Cal Dive International — Q1 2009 Earnings Presentation
11 slides from Cal Dive International's earnings presentation, May 6, 2009

Slide 1: Cal Dive International 1st Quarter 2009 Earnings Conference Call
INTERNATIONAL Cal Dive International 1%* Quarter 2009 Earnings Conference Call May 6, 2009 -
Slide 2: Forward-Looking Statements
Forward-Looking Statements This presentation may include “forward-looking” statements that are generally identifiable through our use of words such as “believe,” “expect,” “anticipate,” “intend,” “plan,” “estimate,” “project” and similar expressions and include any statements that we make regarding
Slide 3: Presentation Outline
Presentation Outline @> Summary of 15t Quarter 2009 Results @> Discussion of Financial Results @> Non-GAAP Reconciliations > Questions and Answers >» Cu Dive HTML
Slide 4: Summary of 1Q Results
Surnimany of 1Q Results @> Increased international diving activity @> Hurricane salvage & repair > Full year of integration of Horizon > Completed over half of dry dock days @> Backlog @> Outlook > Cu Dive Se
Slide 5: Backlog
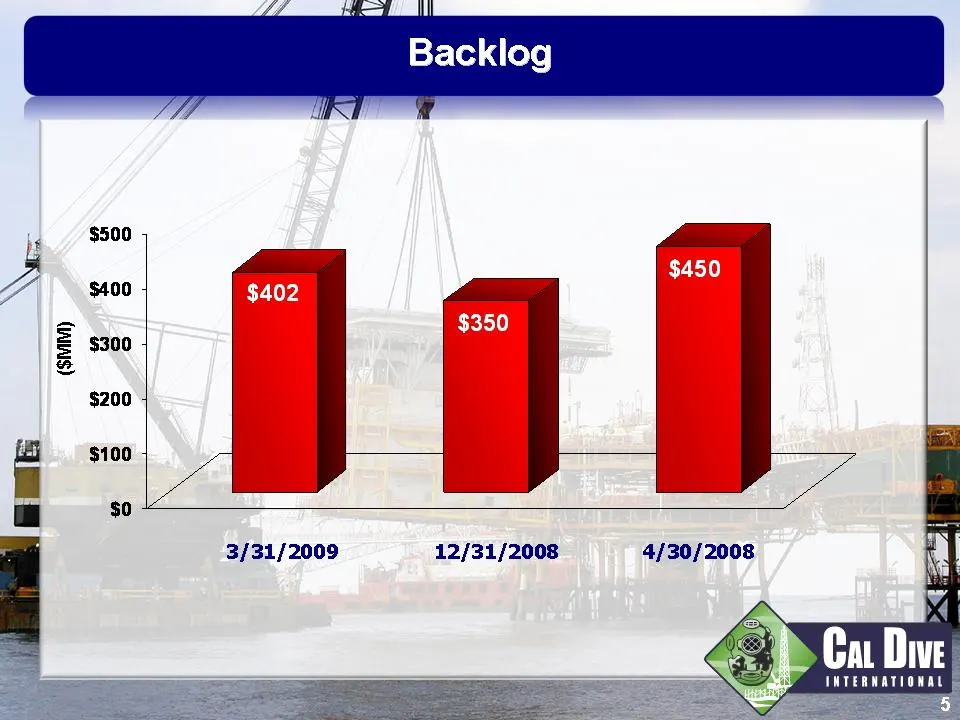
Backlog $500 \vs $400 $300 ($mmM) $200 $100 $o 3/31/2009 12/31/2008 4/30/2008 Cu Dive INTERWATIO
Slide 6: First Quarter 2009 vs 2008 Financial Results
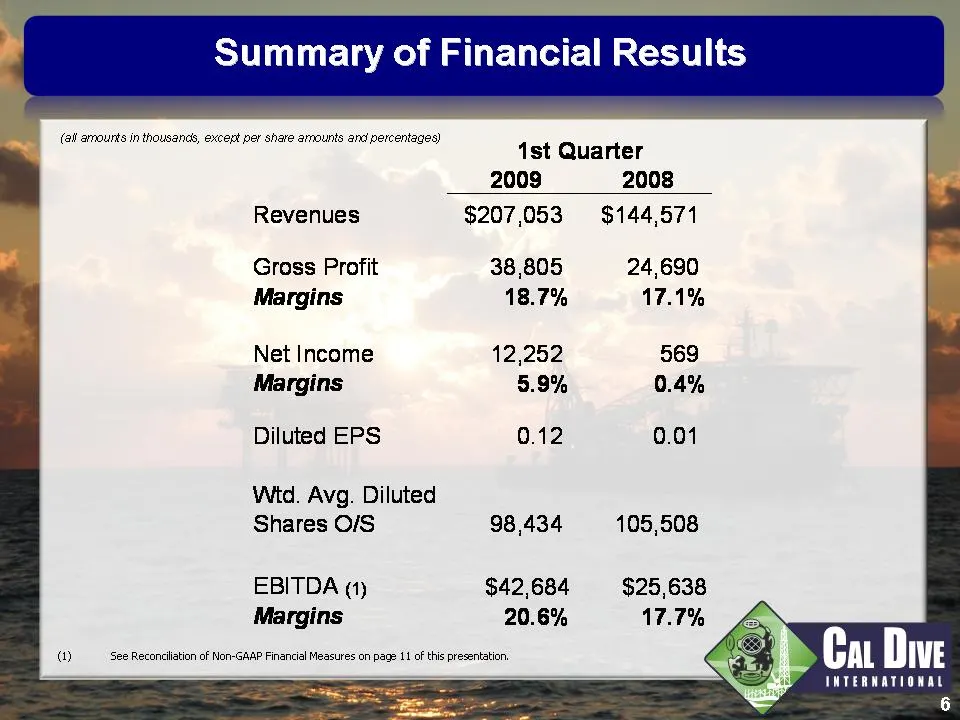
(ail arrourts in thousands, except per share amounts and percentages) Revenues Gross Profit Margins Net Income Margins Diluted EPS Wid. Avg. Diluted Shares O/S EBITDA «1 Margins 1st Quarter 2009 2008 $207,053 $144,571 38,805 24,690 18.7% 17.1% 12,252 569 5.9% 0.4% 0.12 0.01 98,434 105,508 $42,684 $2
Slide 7: Key Statistics
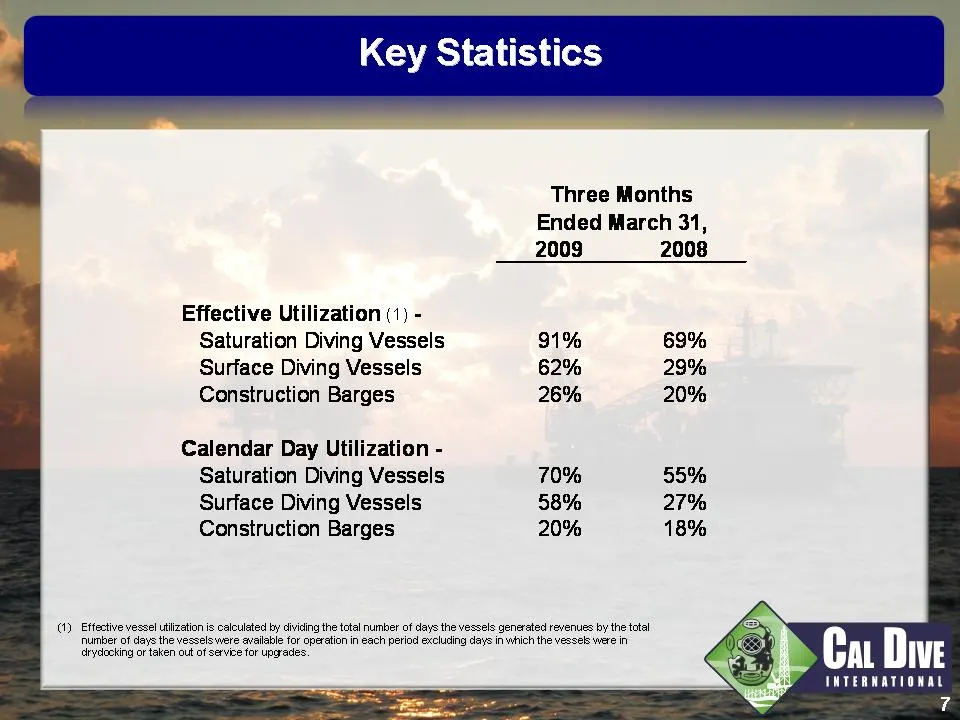
Key Statistics Ye Three Months Ended March 31, 2009 2008 . Effective Utilization (1) - Saturation Diving Vessels 91% 69% Surface Diving Vessels 62% 29% Construction Barges 26% 20% Calendar Day Utilization - Saturation Diving Vessels 70% 55% Surface Diving Vessels 58% 27% Construction Barges 20% 18%
Slide 8: International Revenue
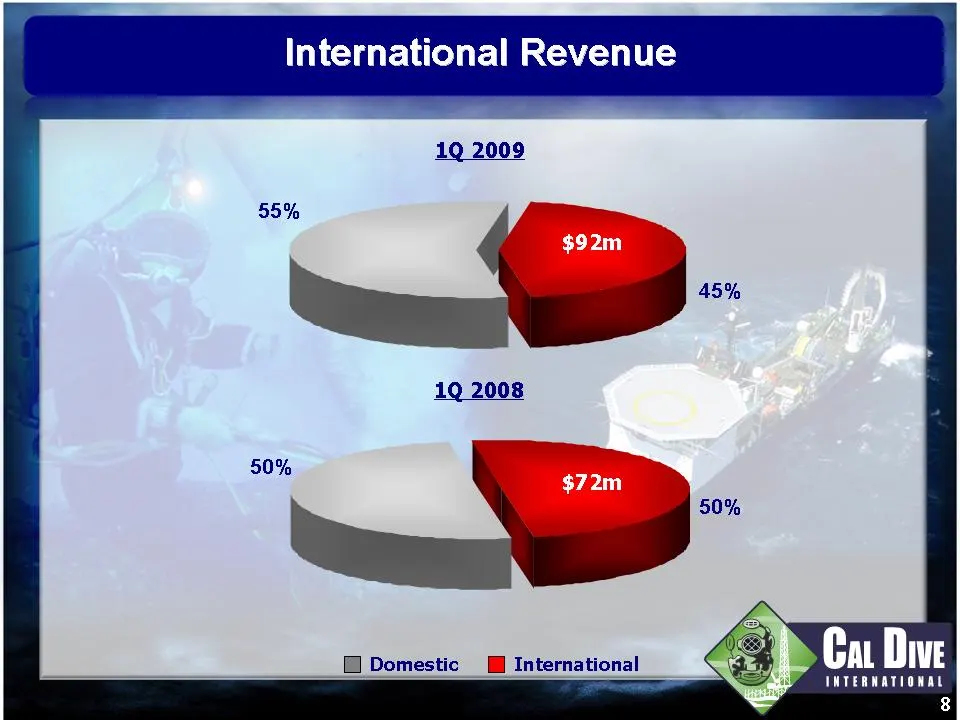
International Revenue i Domestic Mf International Ca Dive HEEL
Slide 9: Financial Flexibility
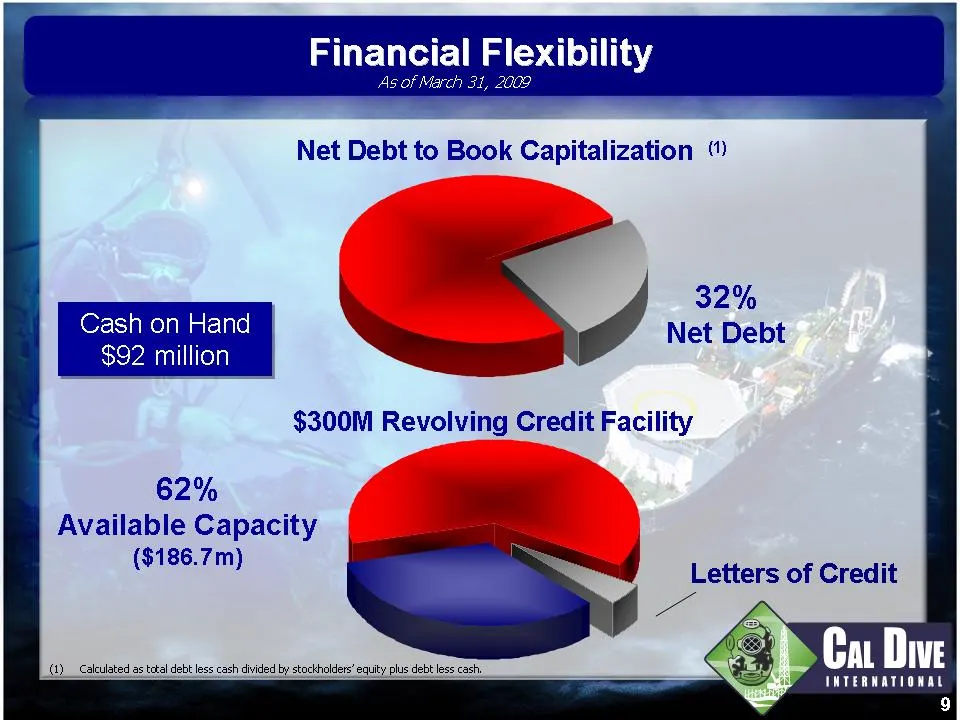
Financial Flexibility Net Debt to Book Capitalization “ $300M Revolving Credit Facility 62% Available Capacity EEA, Letters of Credit Cat Dive ae
Slide 10: > Cu Dive
7 > Cu Dive TMTERMATIONAL 10
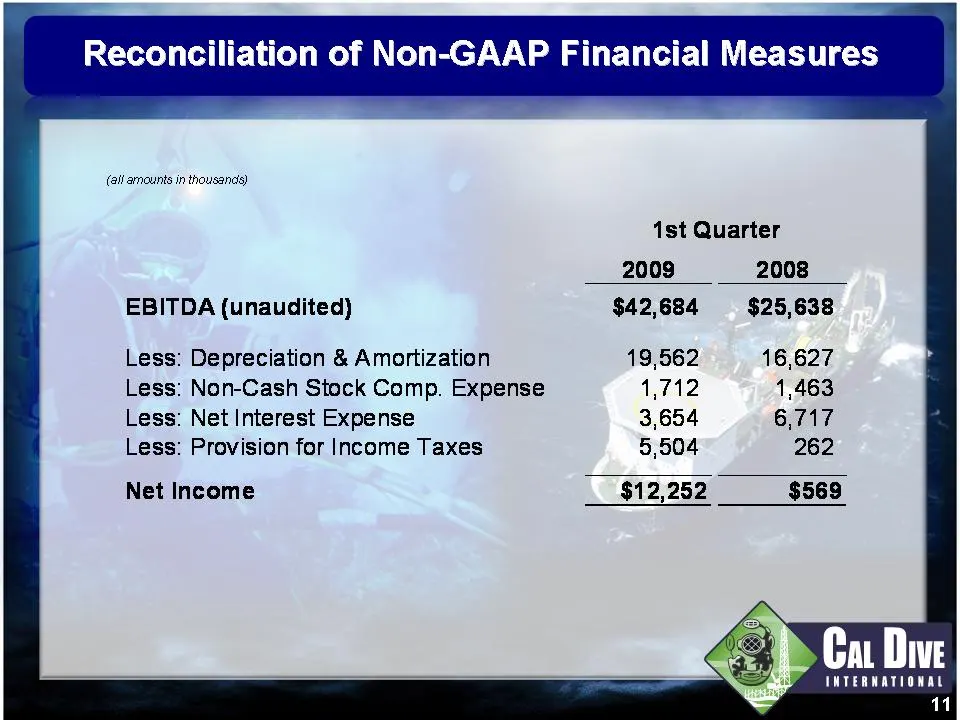
Slide 11: Reconciliation of Non-GAAP Financial Measures
(all arnounts in thousands) 1st Quarter 2009 2008 EBITDA (unaudited) $42,684 $25,638 Less: Depreciation & Amortization 19,562 16,627 Less: Non-Cash Stock Comp. Expense 1,712 1,463 Less: Net Interest Expense 3,654 6,717 Less: Provision for Income Taxes 5,504 262 Net Income $12,252 $569 Ca Dive INTERN
Source: SEC EDGAR · 8-K filed May 6, 2009
More decks from Cal Dive International Inc
 Q3 2014 Earnings Presentation12 slides · Nov 6, 2014
 Q2 2014 Earnings Presentation12 slides · Aug 11, 2014
 Q1 2014 Earnings Presentation12 slides · May 9, 2014
 Q4 2013 Earnings Presentation11 slides · Mar 5, 2014
 Q3 2013 Earnings Presentation11 slides · Nov 7, 2013
 Q2 2013 Earnings Presentation11 slides · Aug 8, 2013