Cal Dive International — Q3 2014 Earnings Presentation
12 slides from Cal Dive International's earnings presentation, Nov 6, 2014

Slide 1: Cal Dive International 3rd Quarter 2014 Earnings Conference Call
Cal Dive International 3rd Quarter 2014 Earnings Conference Call
Slide 2: Cautionary Statement
Cautionary Statement This presentation may include “forward-looking” statements that are generally identifiable through the use of words such as “believe,” “expect,” “anticipate,” “intend,” “plan,” “estimate,” “project” and similar expressions and include any statements that are made regarding earni
Slide 3: Presentation Outline
Presentation Outline * Summary of 3Q 2014 Backlog Discussion of Financial Results Non-GAAP Reconciliations Q & A
Slide 4: Summary of 3Q 2014
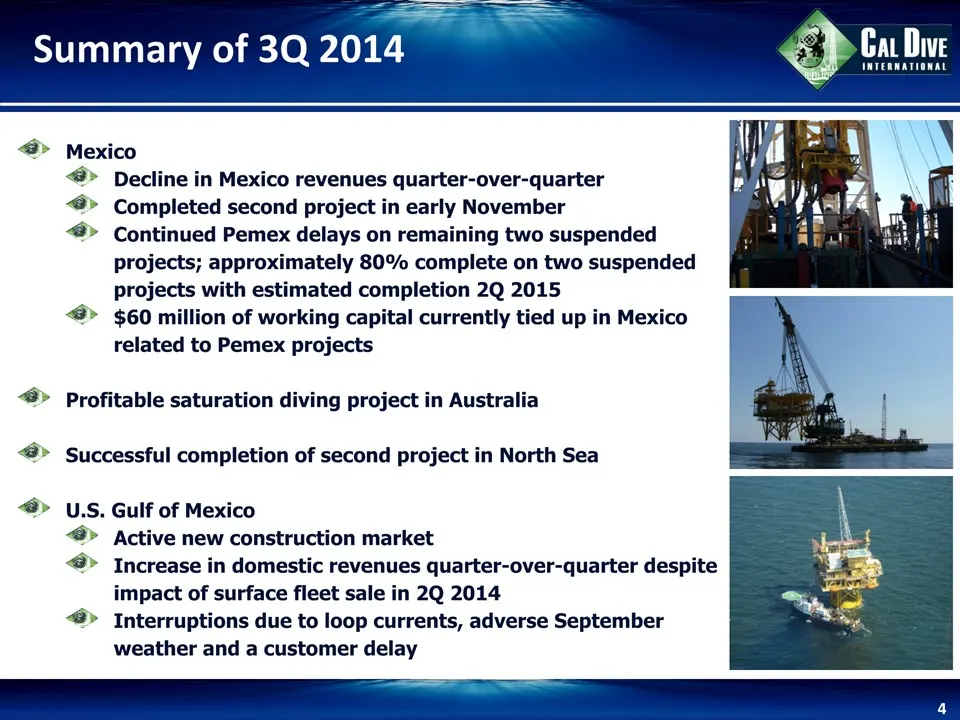
Summary of 3Q 2014 * Mexico Decline in Mexico revenues quarter-over-quarterCompleted second project in early NovemberContinued Pemex delays on remaining two suspended projects; approximately 80% complete on two suspended projects with estimated completion 2Q 2015$60 million of working capital curren
Slide 5: Backlog
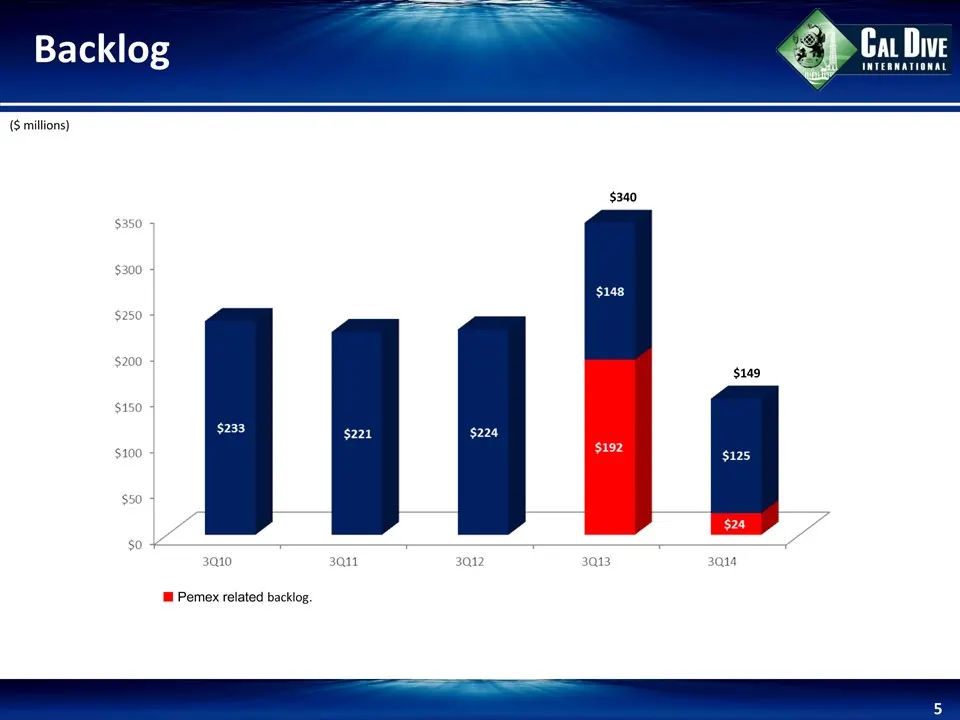
Backlog * ($ millions) 230 Pemex related backlog. $340 $149
Slide 6: Financial Results
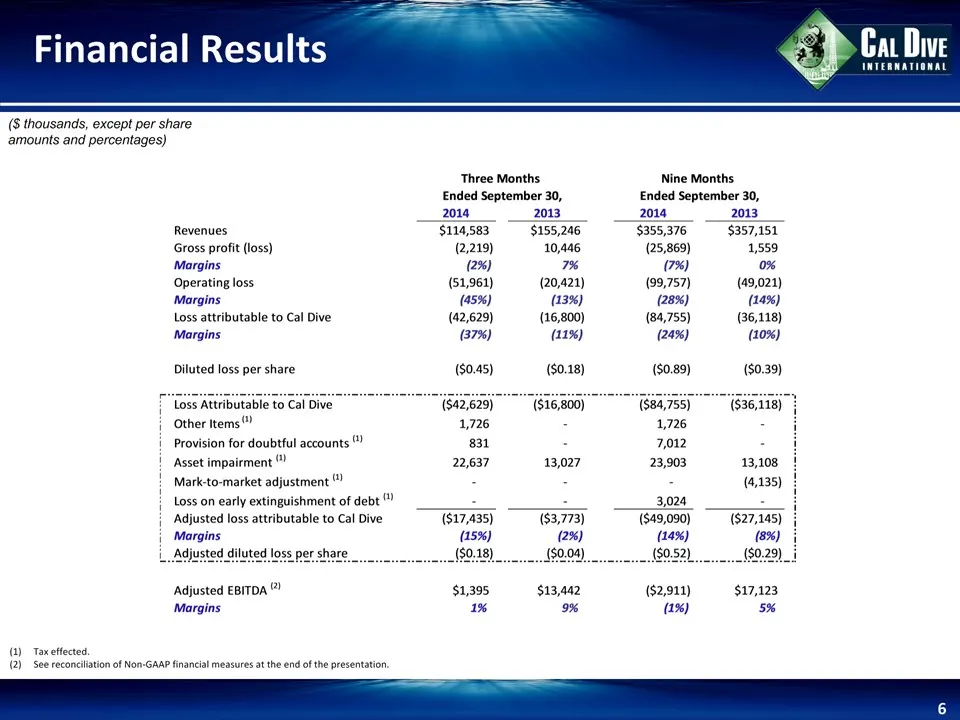
Financial Results * Tax effected.See reconciliation of Non-GAAP financial measures at the end of the presentation. ($ thousands, except per share amounts and percentages)
Slide 7: Revenue Breakdown
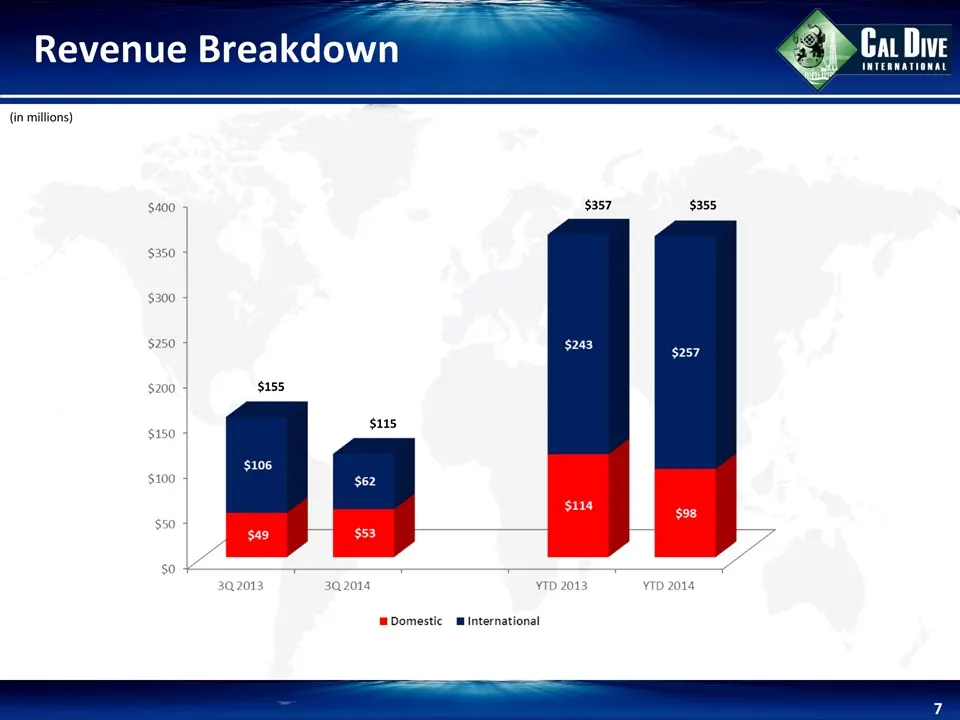
Revenue Breakdown * {55%} {45%} {47%} {53%} {55%} {49%} {27%} {12%} {88%} {73%} (in millions) {32%} {46%} {54%} {68%} {30%} {27%} {73%} {70%} $355 $357 $155 $115
Slide 8: Utilization
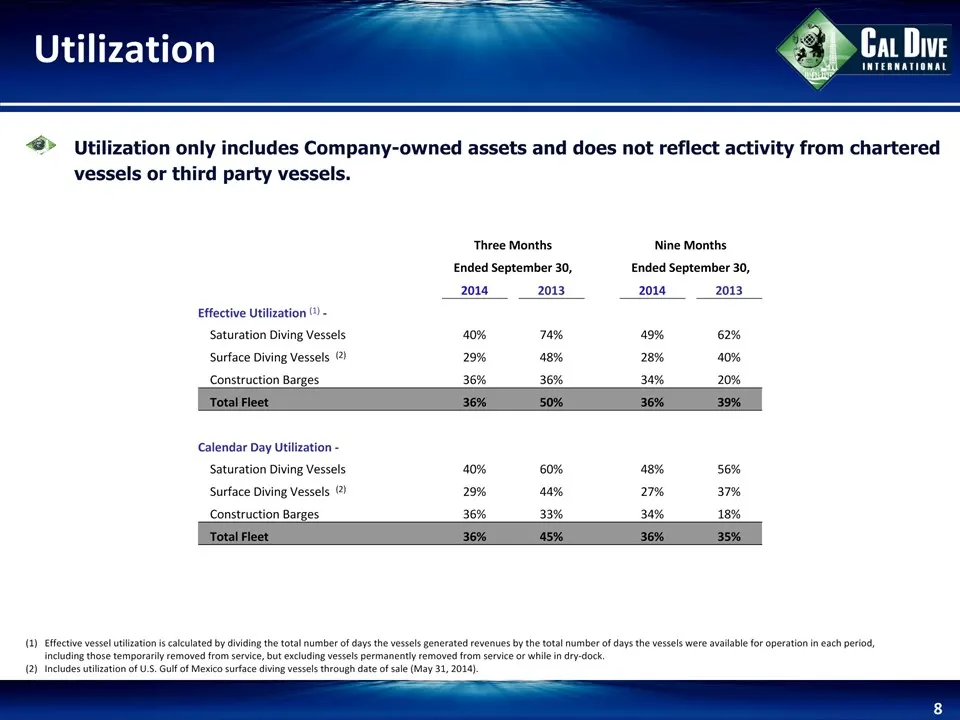
Utilization * (1) Effective vessel utilization is calculated by dividing the total number of days the vessels generated revenues by the total number of days the vessels were available for operation in each period, including those temporarily removed from service, but excluding vessels permanently re
Slide 9: Debt Levels
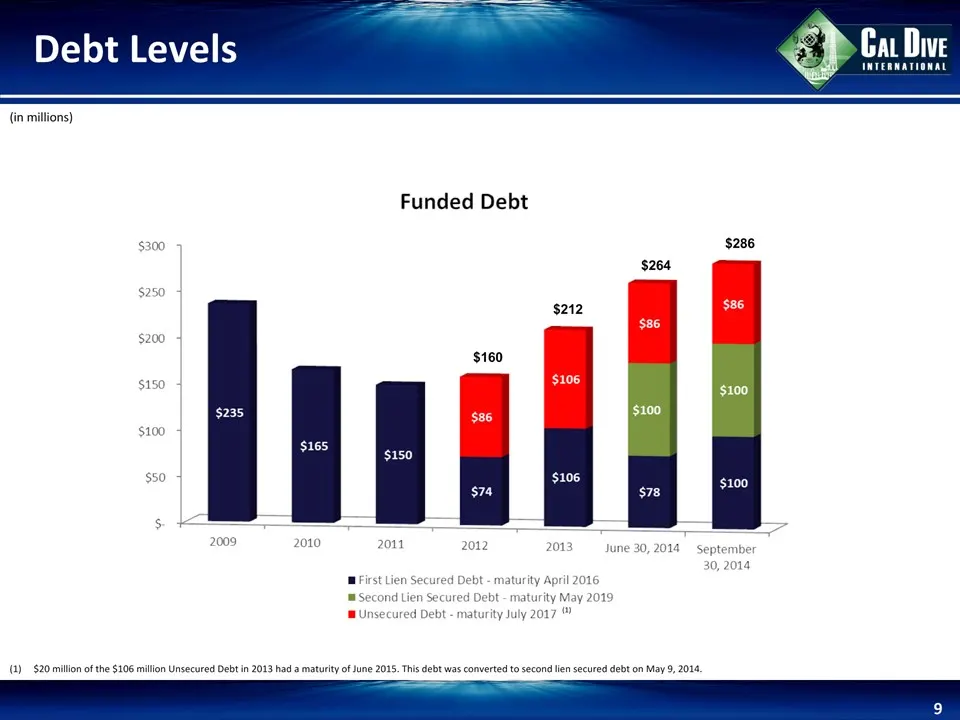
Debt Levels * (in millions) $20 million of the $106 million Unsecured Debt in 2013 had a maturity of June 2015. This debt was converted to second lien secured debt on May 9, 2014. $286 $160 $212 $264 (1)
Slide 10: Liquidity and Debt Refinancing
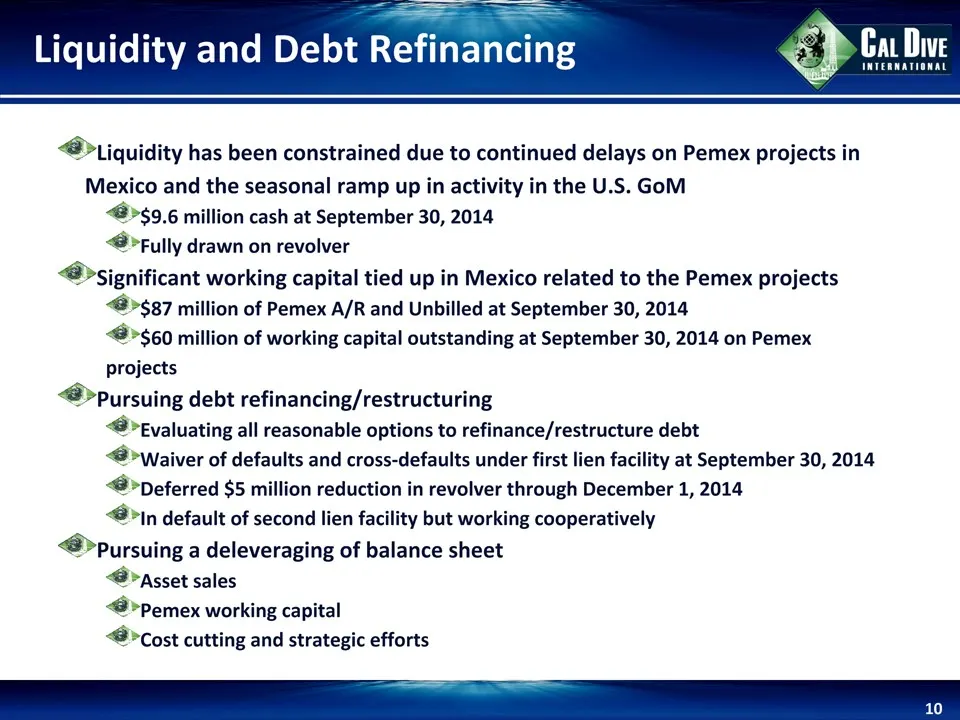
Liquidity and Debt Refinancing * Liquidity has been constrained due to continued delays on Pemex projects in Mexico and the seasonal ramp up in activity in the U.S. GoM$9.6 million cash at September 30, 2014Fully drawn on revolverSignificant working capital tied up in Mexico related to the Pemex pro
Slide 11: Non-GAAP Reconciliations
Non-GAAP Reconciliations *
Slide 12: EBITDA Reconciliations
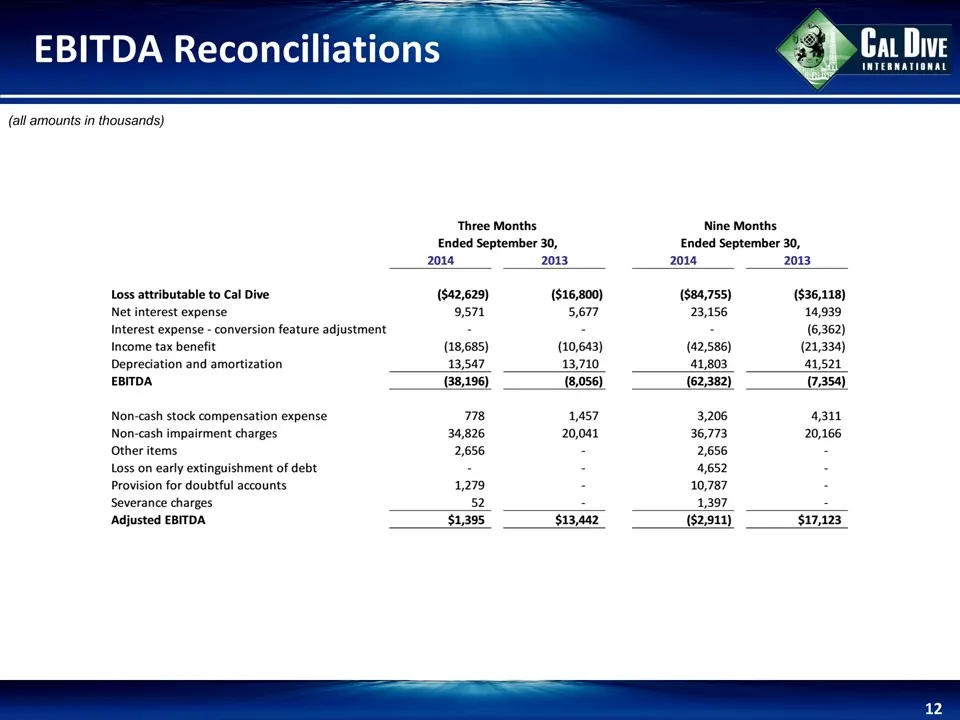
EBITDA Reconciliations * (all amounts in thousands)
Source: SEC EDGAR · 8-K filed Nov 6, 2014
More decks from Cal Dive International Inc
 Q2 2014 Earnings Presentation12 slides · Aug 11, 2014
 Q1 2014 Earnings Presentation12 slides · May 9, 2014
 Q4 2013 Earnings Presentation11 slides · Mar 5, 2014
 Q3 2013 Earnings Presentation11 slides · Nov 7, 2013
 Q2 2013 Earnings Presentation11 slides · Aug 8, 2013
 Q1 2013 Earnings Presentation12 slides · May 2, 2013