Cal Dive International — Q1 2014 Earnings Presentation
12 slides from Cal Dive International's earnings presentation, May 9, 2014
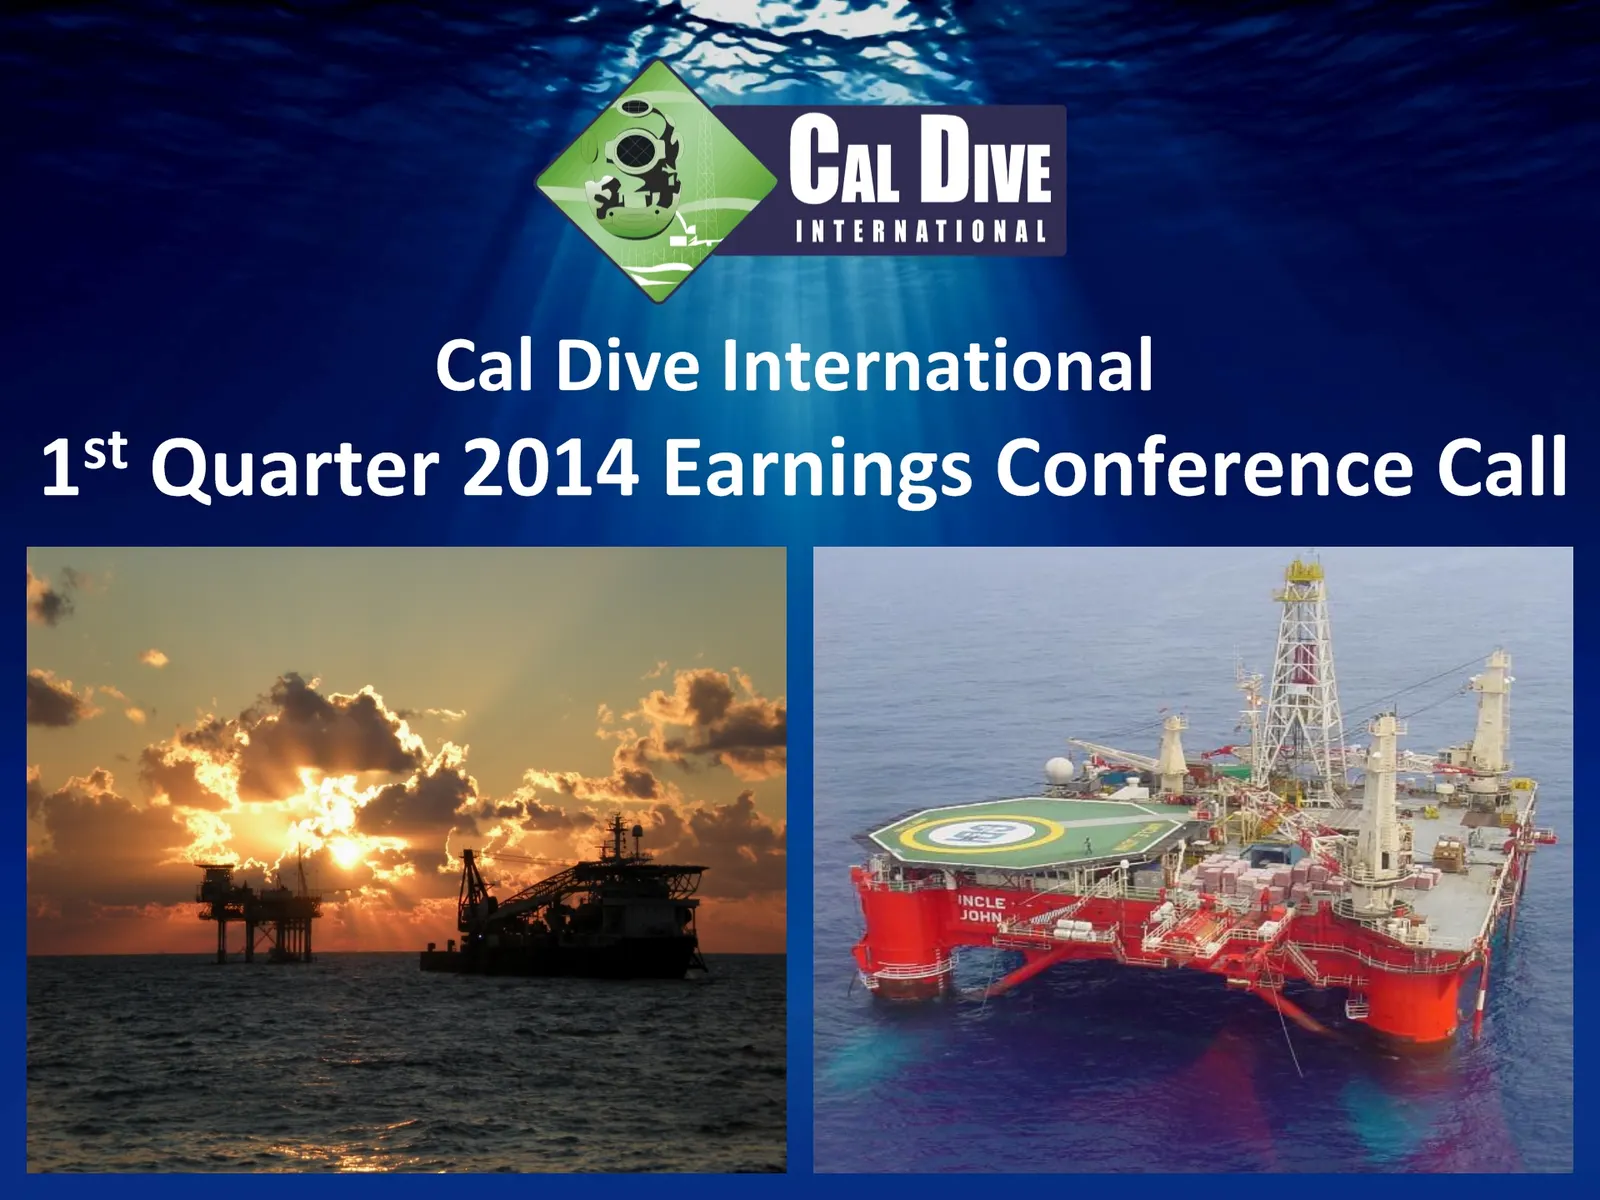
Slide 1: Cal Dive International 1st Quarter 2014 Earnings Conference Call
Cal Dive International 1st Quarter 2014 Earnings Conference Call
Slide 2: Cautionary Statement
Cautionary Statement This presentation and related commentary may include “forward-looking” statements that are generally identifiable through the use of words such as “believe,” “expect,” “anticipate,” “intend,” “plan,” “estimate,” “project” and similar expressions and include any statements that a
Slide 3: Presentation Outline
Presentation Outline * Summary of 1Q 2014 Backlog Discussion of Financial Results Non-GAAP Reconciliations Q & A
Slide 4: Summary of 1Q 2014
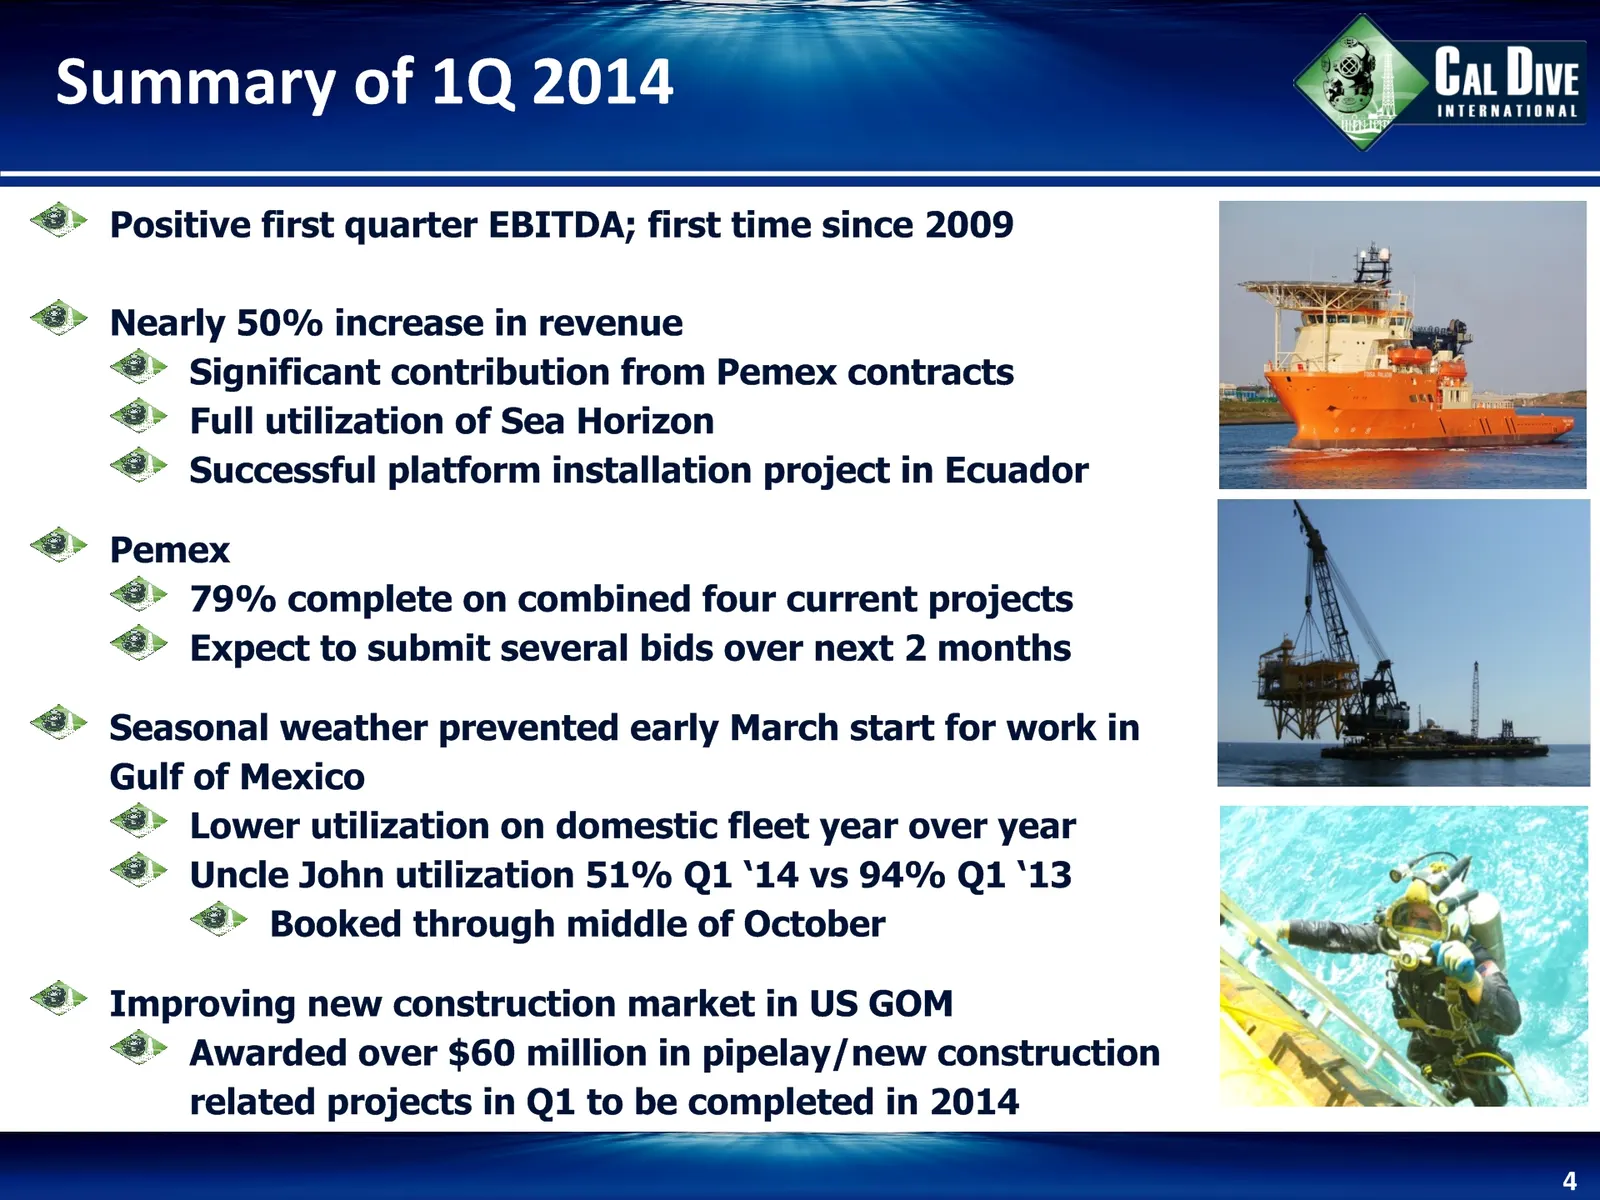
Summary of 1Q 2014 * Positive first quarter EBITDA; first time since 2009Nearly 50% increase in revenueSignificant contribution from Pemex contractsFull utilization of Sea HorizonSuccessful platform installation project in EcuadorPemex79% complete on combined four current projectsExpect to submit se
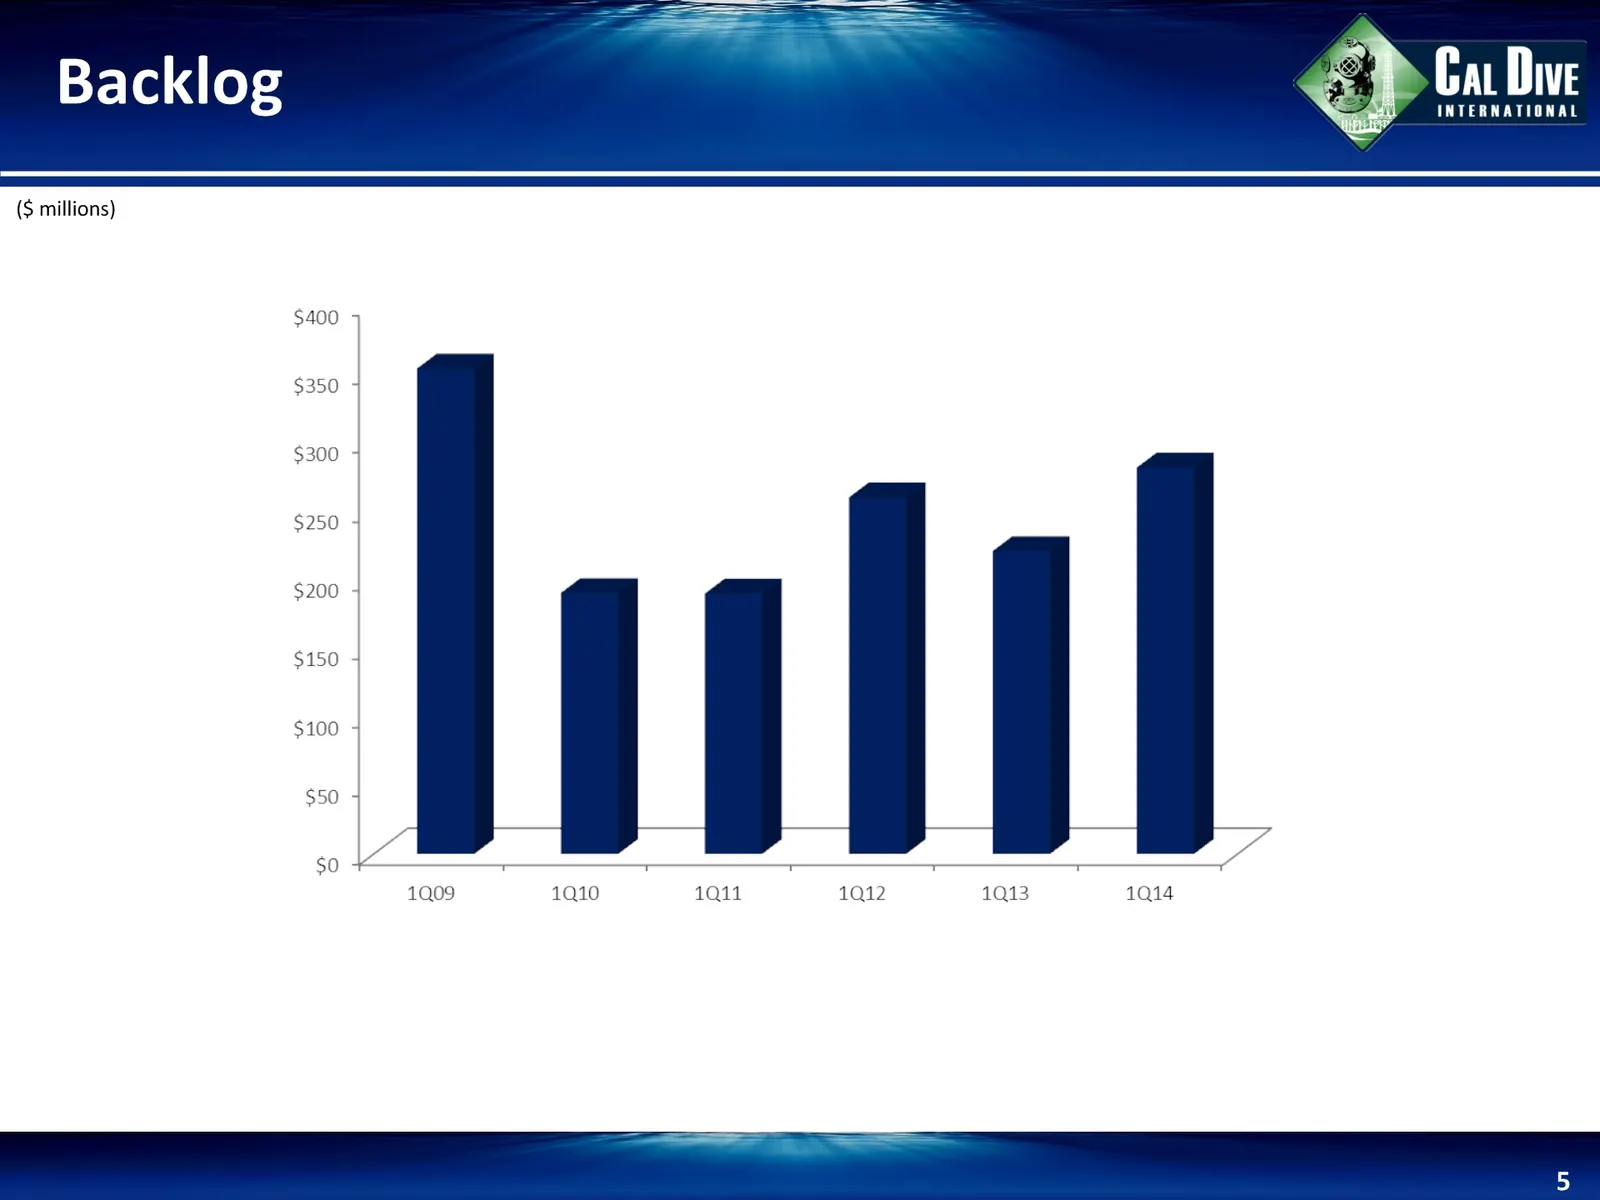
Slide 5: Backlog ($ millions)
Cat Dive INTERNATIONAL ($ millions) $400 4 $350 4 $300 $250 4 $200 $150 4 $100 $50 4 SO + 1Q09 1Q10 1Q11 1Q12 1Q13 1Q14
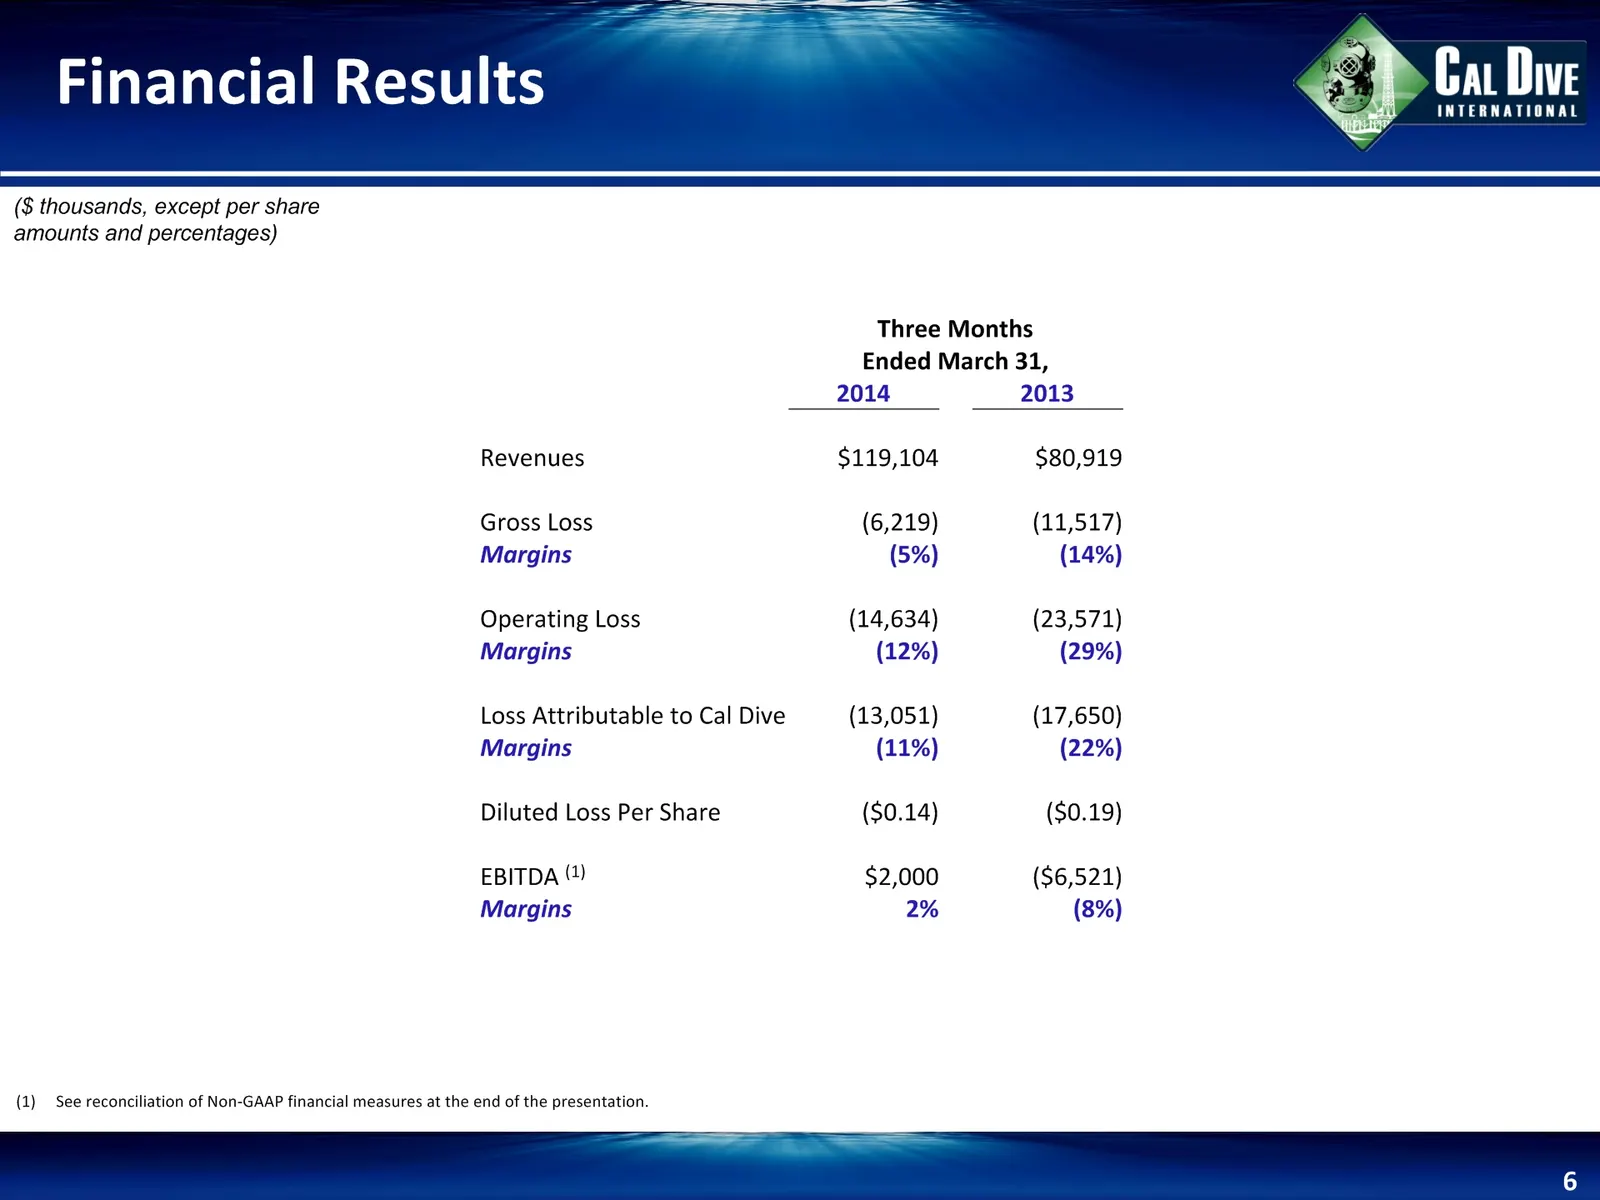
Slide 6: Financial Results
Financial Results * See reconciliation of Non-GAAP financial measures at the end of the presentation. ($ thousands, except per share amounts and percentages) Three Months Three Months Three Months Ended March 31, Ended March 31, Ended March 31, 2014 2013 Revenues $119,104 $80,919 Gross Loss (6,219)
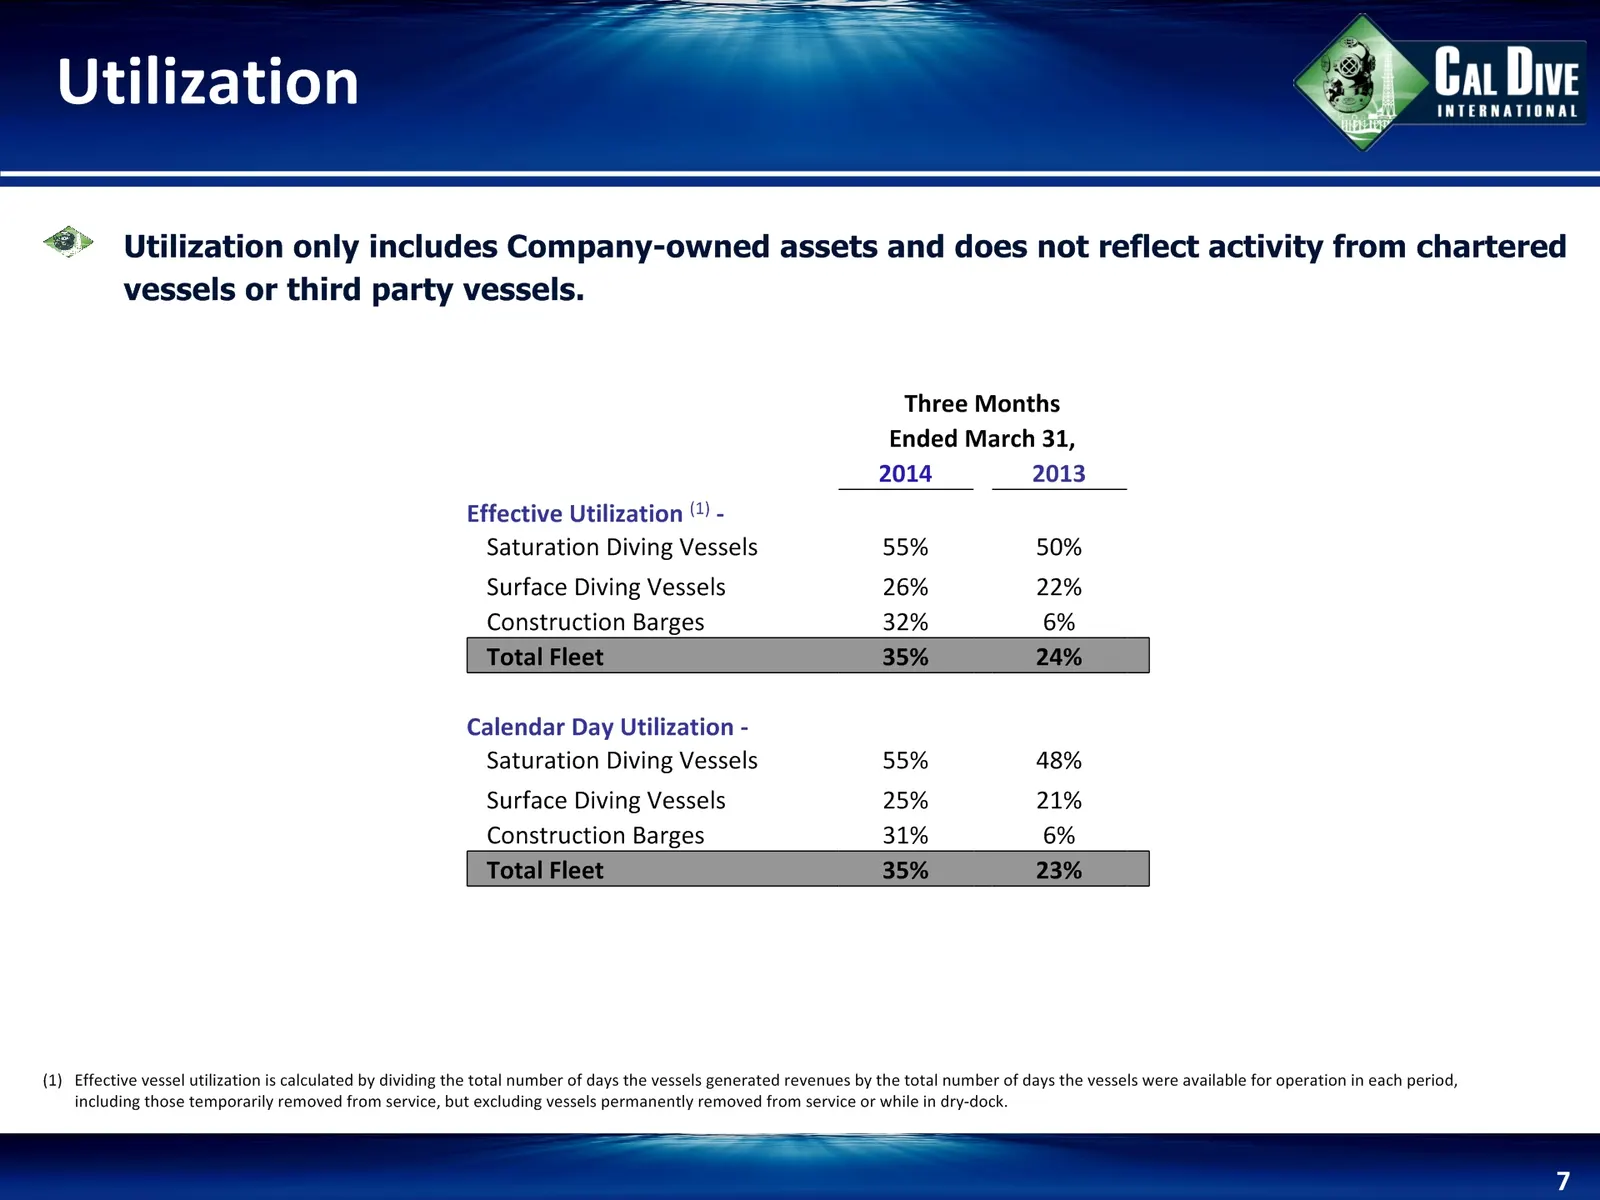
Slide 7: Utilization
Utilization * (1) Effective vessel utilization is calculated by dividing the total number of days the vessels generated revenues by the total number of days the vessels were available for operation in each period, including those temporarily removed from service, but excluding vessels permanently re
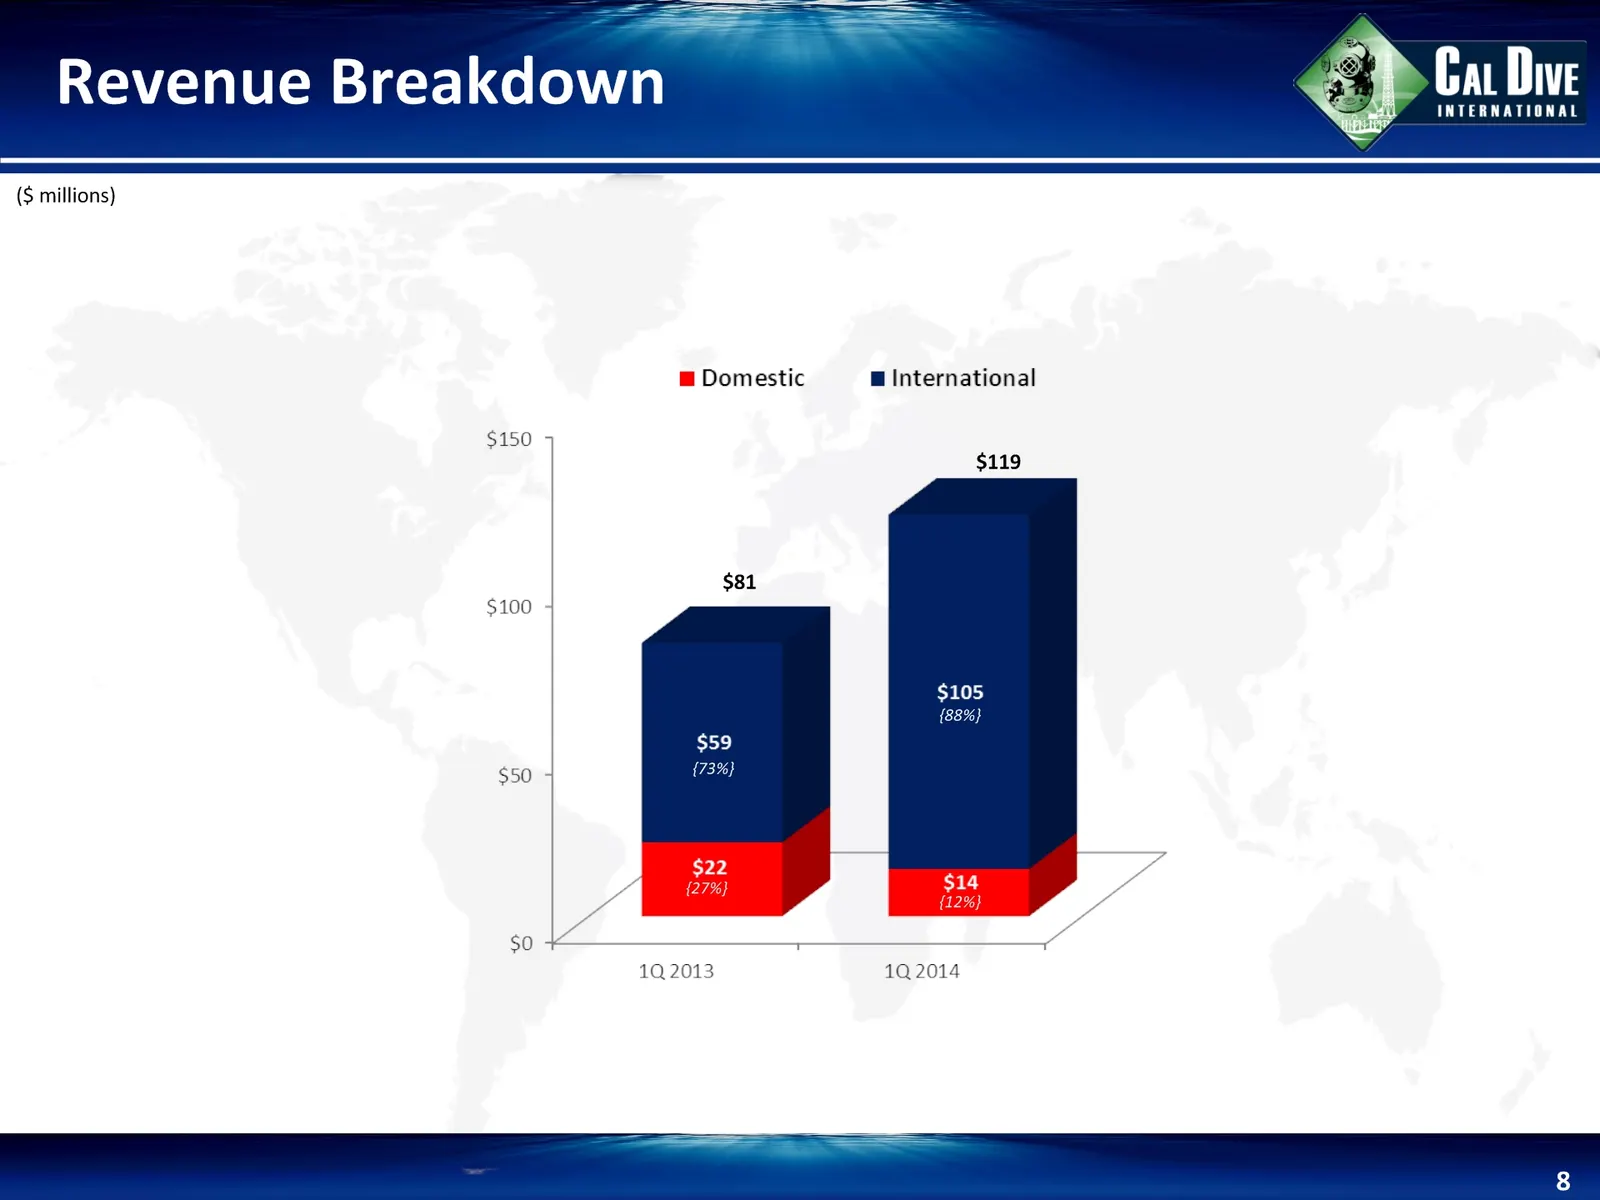
Slide 8: Revenue Breakdown
Revenue Breakdown * ($ millions) {55%} {45%} {47%} {53%} {55%} {49%} {27%} {12%} {88%} {73%} $81 $119
Slide 9: Debt Levels
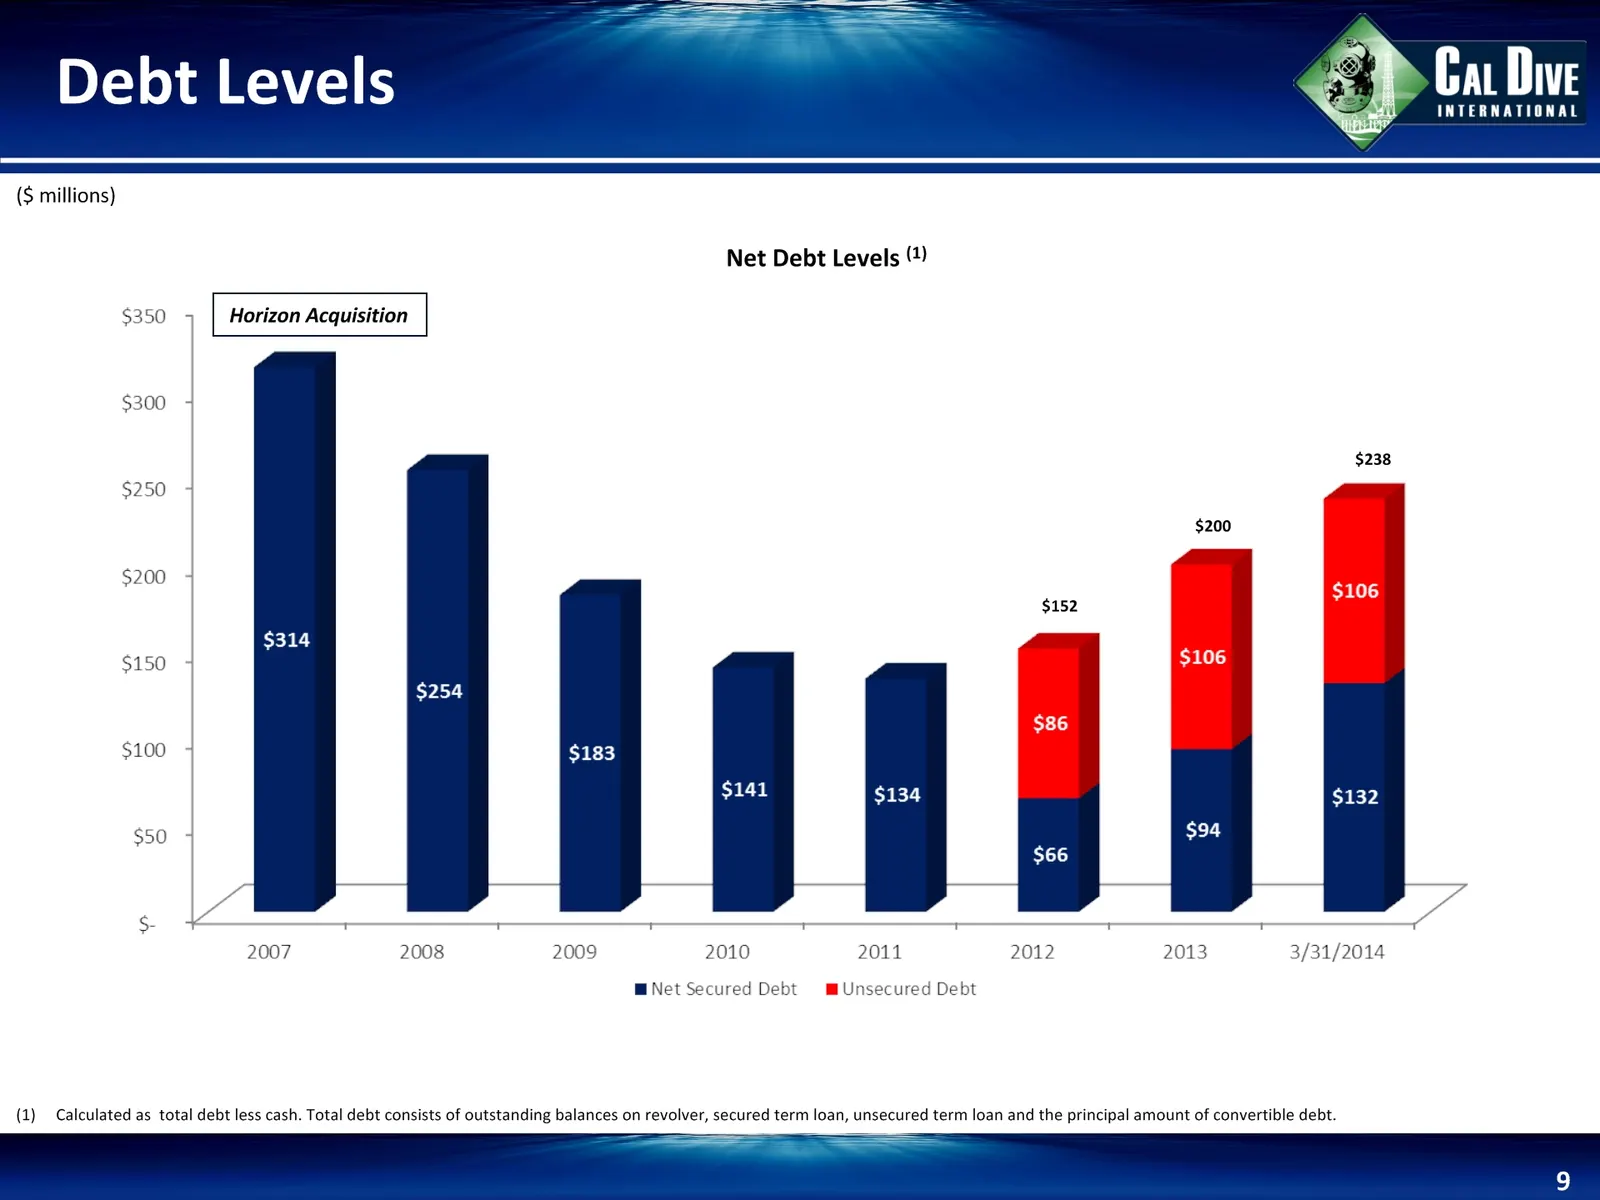
Debt Levels * Net Debt Levels (1) ($ millions) Calculated as total debt less cash. Total debt consists of outstanding balances on revolver, secured term loan, unsecured term loan and the principal amount of convertible debt. $152 $200 $238 Horizon Acquisition
Slide 10: Debt Refinancing
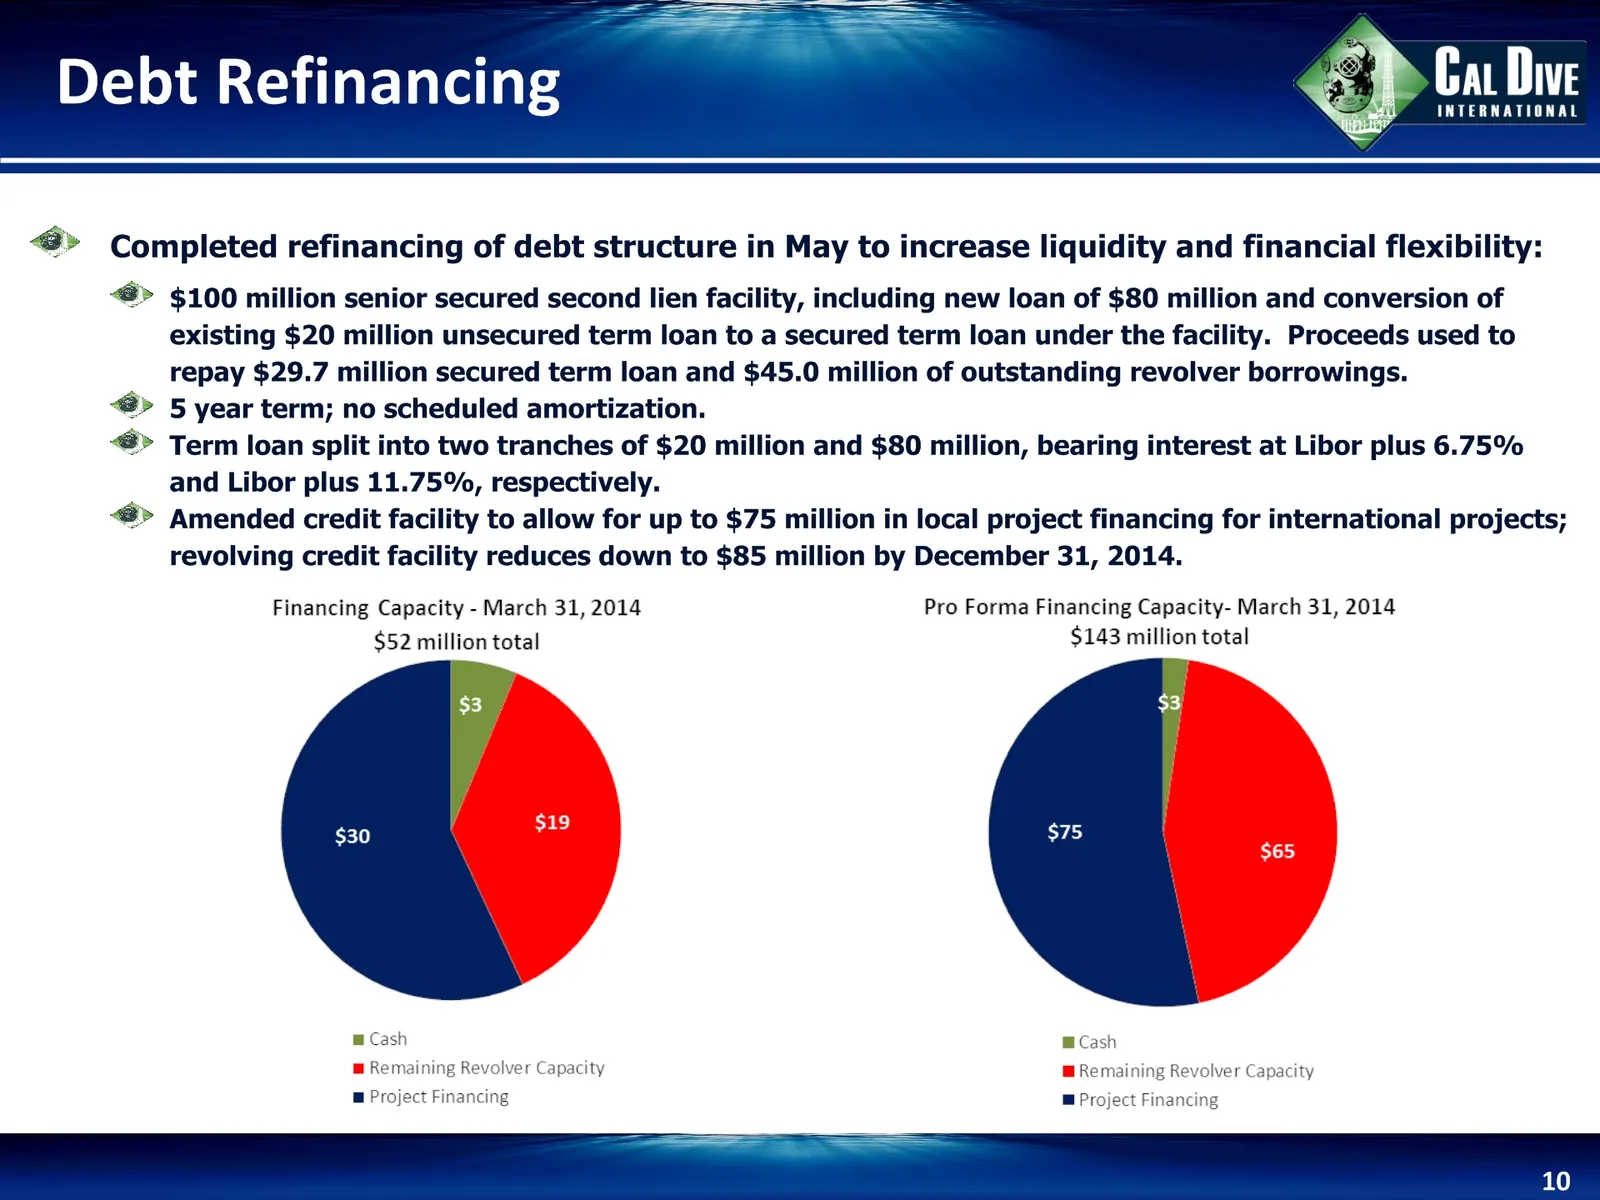
Debt Refinancing * Completed refinancing of debt structure in May to increase liquidity and financial flexibility:$100 million senior secured second lien facility, including new loan of $80 million and conversion of existing $20 million unsecured term loan to a secured term loan under the facility.
Slide 11: Non-GAAP Reconciliations
Non-GAAP Reconciliations *
Slide 12: EBITDA Reconciliations
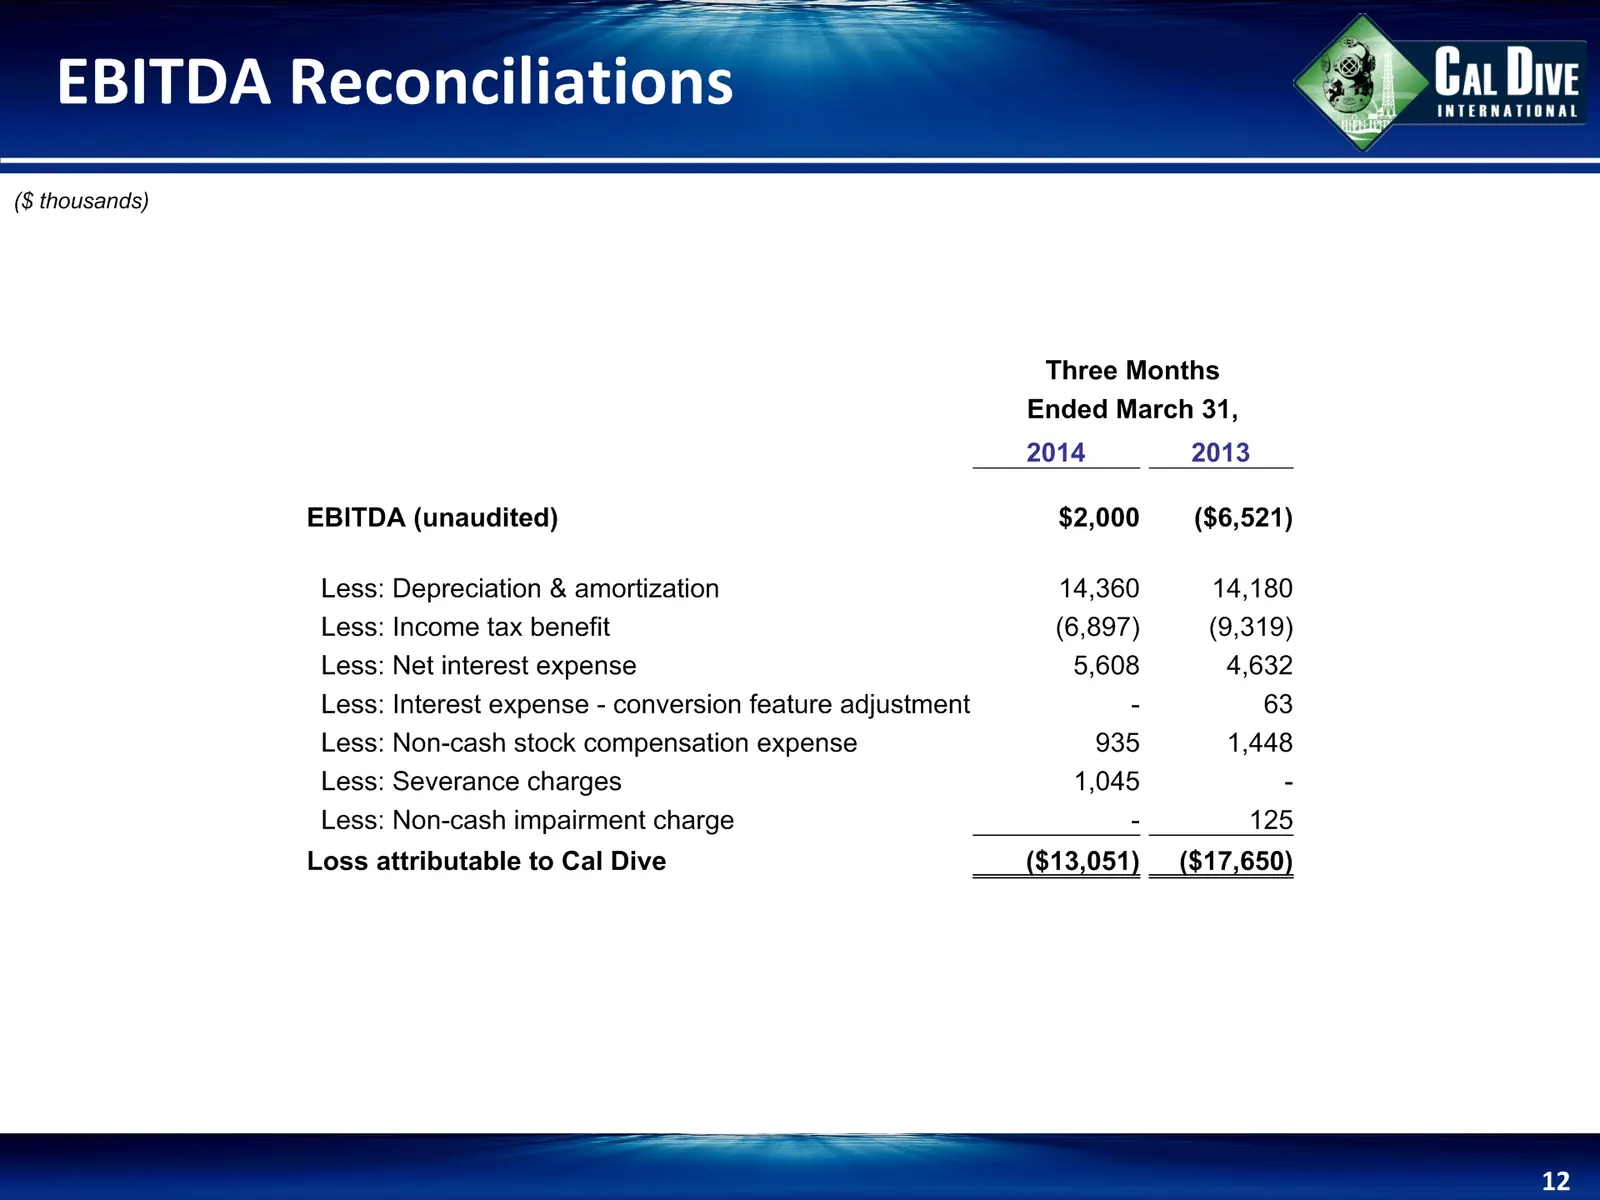
EBITDA Reconciliations * ($ thousands) Three Months Three Months Three Months Ended March 31, Ended March 31, Ended March 31, 2014 2013 EBITDA (unaudited) $2,000 ($6,521) Less: Depreciation & amortization 14,360 14,180 Less: Income tax benefit (6,897) (9,319) Less: Net interest expense 5,608 4,632 L
Source: SEC EDGAR · 8-K filed May 9, 2014
More decks from Cal Dive International Inc
 Q3 2014 Earnings Presentation12 slides · Nov 6, 2014
 Q2 2014 Earnings Presentation12 slides · Aug 11, 2014
 Q4 2013 Earnings Presentation11 slides · Mar 5, 2014
 Q3 2013 Earnings Presentation11 slides · Nov 7, 2013
 Q2 2013 Earnings Presentation11 slides · Aug 8, 2013
 Q1 2013 Earnings Presentation12 slides · May 2, 2013