Harvest Natural Resources — The 2010 Oil & Gas Conference (Enercom) 2010
32 slides from Harvest Natural Resources's conference presentation, Aug 23, 2010
Slide 1: Harvest Natural Resources, Inc. The 2010 Oil & Gas Conference Enercom
1 1 Harvest Natural Resources, Inc. The 2010 Oil & Gas Conference Enercom August 23, 2010 Tested. Proven. Moving Forward
Slide 2: Cautionary Statements: Forward-Looking Statements
2 Cautionary Statements: Certain statements in this presentation are forward-looking and are based upon Harvest's current belief as to the outcome and timing of future events. All statements other than statements of historical facts including planned capital expenditures, increases in oil and gas pr
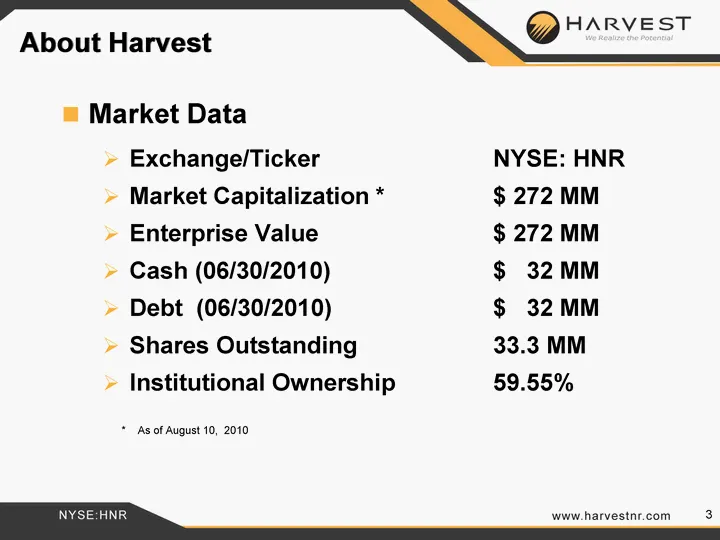
Slide 3: About Harvest Market Data
3 About Harvest Market Data Exchange/Ticker NYSE: HNR Market Capitalization * $ 272 MM Enterprise Value $ 272 MM Cash (06/30/2010) $ 32 MM Debt (06/30/2010) $ 32 MM Shares Outstanding 33.3 MM Institutional Ownership 59.55% * As of August 10, 2010
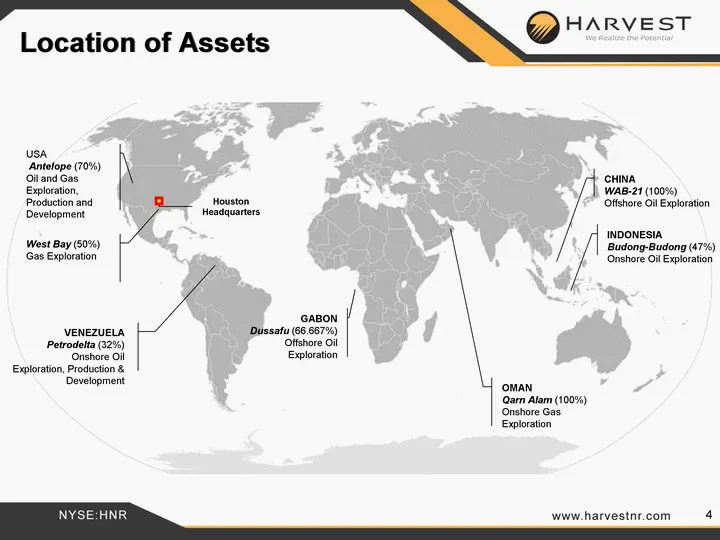
Slide 4: Location of Assets
4 Location of Assets Houston Headquarters
Slide 5: International Portfolio
5 5 Harvest Natural Resources, Inc. International Portfolio Tested. Proven. Moving Forward
Slide 6: Venezuela - Petrodelta
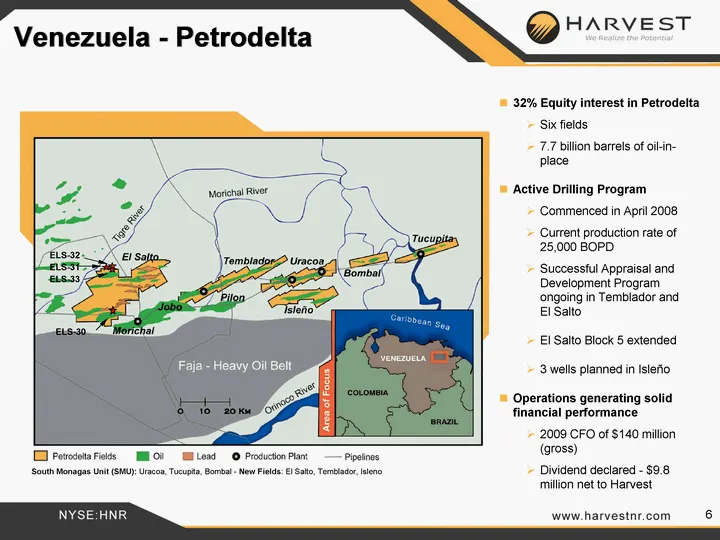
6 Venezuela - Petrodelta ELS-30 ELS-31 South Monagas Unit (SMU): Uracoa, Tucupita, Bombal - New Fields: El Salto, Temblador, Isleno ELS-32 ELS-33 32% Equity interest in Petrodelta Six fields 7.7 billion barrels of oil-in- place Active Drilling Program Commenced in April 2008 Current production rate
Slide 7: 1/1/2004 2/1/2004 3/1/2004 4/1/2004 5/1/2004 6/1/2004 7/1/2004 8/1/2004 9/1/2004 10/1/2004 11/1/2004 12/1/2004 1/1/20…
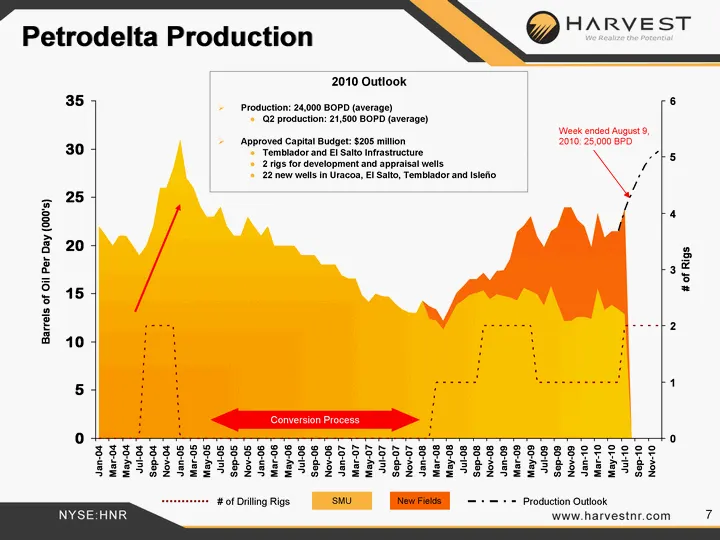
7 1/1/2004 2/1/2004 3/1/2004 4/1/2004 5/1/2004 6/1/2004 7/1/2004 8/1/2004 9/1/2004 10/1/2004 11/1/2004 12/1/2004 1/1/2005 2/1/2005 3/1/2005 4/1/2005 5/1/2005 6/1/2005 7/1/2005 8/1/2005 9/1/2005 10/1/2005 11/1/2005 12/1/2005 1/1/2006 2/1/2006 3/1/2006 4/1/2006 5/1/2006 6/1/2006 7/1/2006 8/1/2006 9/1/
Slide 8: Petrodelta Margins
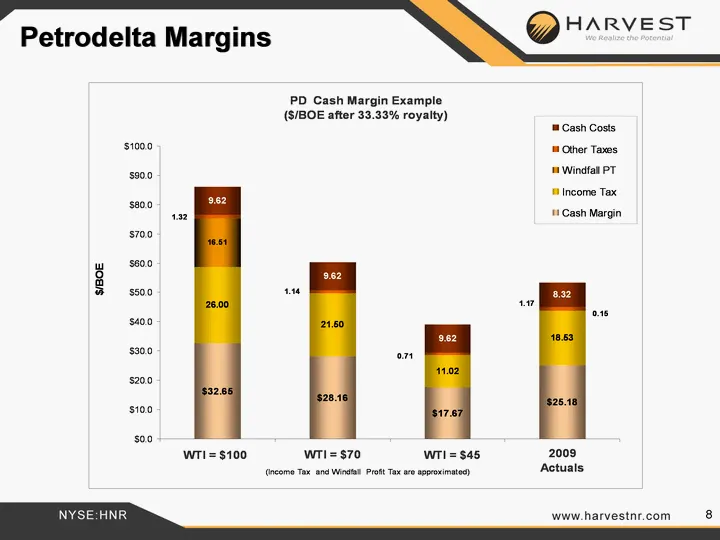
8 Petrodelta Margins WTI = $61.76
Slide 9: Petrodelta Resource Base
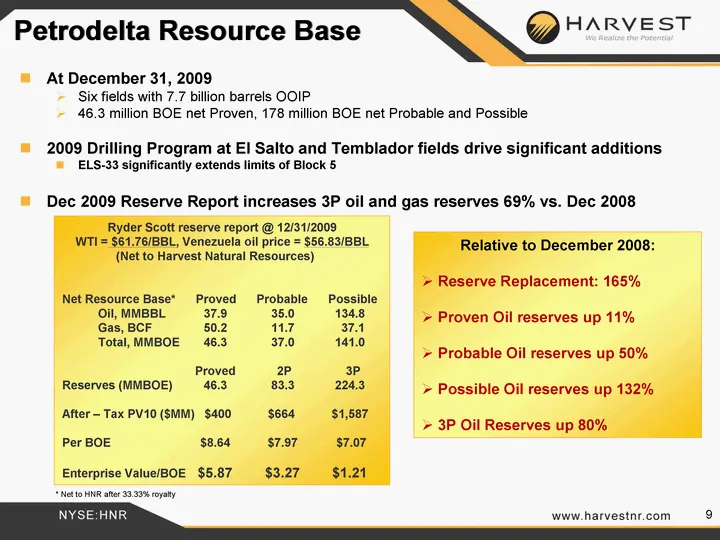
9 Petrodelta Resource Base At December 31, 2009 Six fields with 7.7 billion barrels OOIP 46.3 million BOE net Proven, 178 million BOE net Probable and Possible 2009 Drilling Program at El Salto and Temblador fields drive significant additions ELS-33 significantly extends limits of Block 5 Dec 2009 R
Slide 10: El Salto Drilling 2010
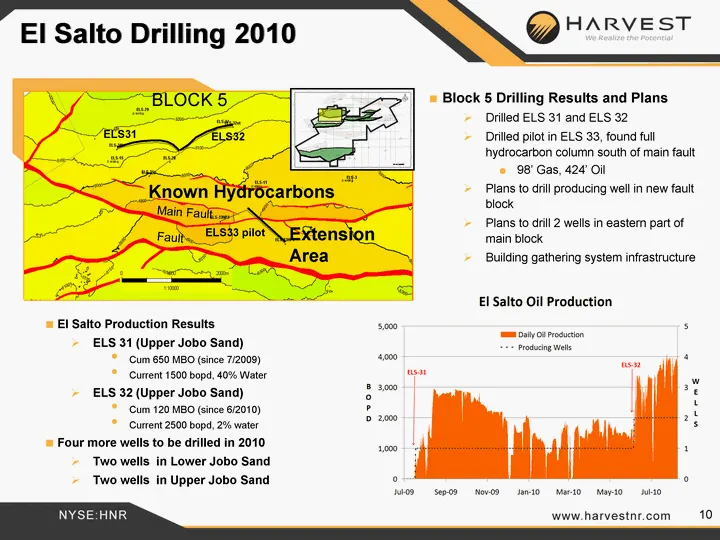
El Salto Drilling 2010 Block 5 Drilling Results and Plans Drilled ELS 31 and ELS 32 Drilled pilot in ELS 33, found full hydrocarbon column south of main fault 98' Gas, 424' Oil Plans to drill producing well in new fault block Plans to drill 2 wells in eastern part of main block Building gathering sy
Slide 11: El Salto Block and Extension
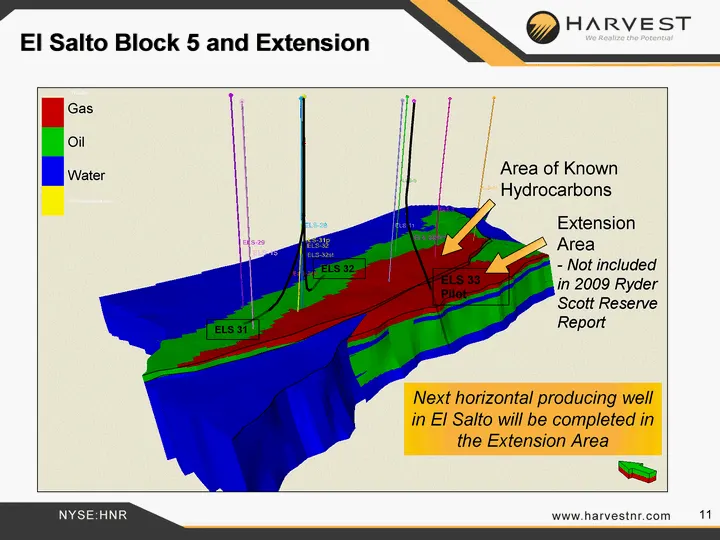
11 El Salto Block 5 and Extension ELS 31 ELS 32 ELS 33 Pilot Area of Known Hydrocarbons Extension Area - - Not included in 2009 Ryder Scott Reserve Report Next horizontal producing well in El Salto will be completed in the Extension Area Gas Oil Water
Slide 12: ELS 33 Pilot Hole Results
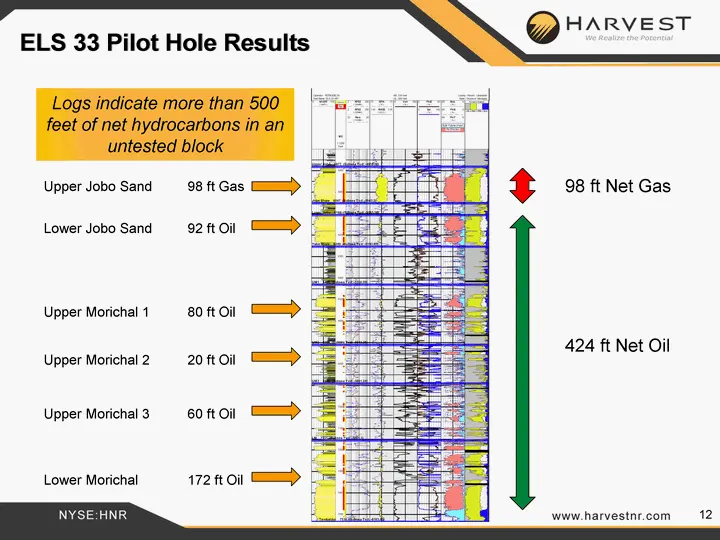
12 Upper Jobo Sand 98 ft Gas Lower Jobo Sand 92 ft Oil Upper Morichal 1 80 ft Oil Upper Morichal 2 20 ft Oil Upper Morichal 3 60 ft Oil Lower Morichal 172 ft Oil 98 ft Net Gas 424 ft Net Oil ELS 33 Pilot Hole Results Logs indicate more than 500 feet of net hydrocarbons in an untested block
Slide 13: Indonesia Budong-Budong
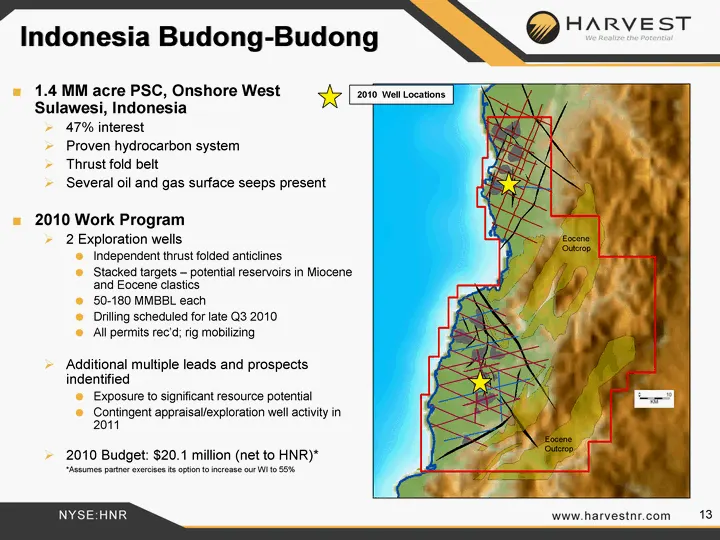
13 Indonesia Budong-Budong 1.4 MM acre PSC, Onshore West Sulawesi, Indonesia 47% interest Proven hydrocarbon system Thrust fold belt Several oil and gas surface seeps present 2010 Work Program 2 Exploration wells Independent thrust folded anticlines Stacked targets - potential reservoirs in Miocene
Slide 14: First Budong Well: Lariang LG-1 Prospect
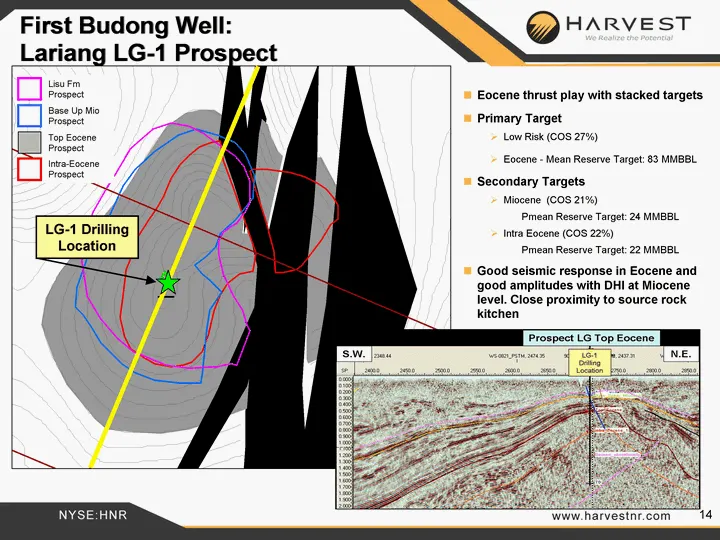
14 First Budong Well: Lariang LG-1 Prospect Eocene thrust play with stacked targets Primary Target Low Risk (COS 27%) Eocene - Mean Reserve Target: 83 MMBBL Secondary Targets Miocene (COS 21%) Pmean Reserve Target: 24 MMBBL Intra Eocene (COS 22%) Pmean Reserve Target: 22 MMBBL Good seismic response
Slide 15: Second Budong Well: Karama KD-1 Prospect
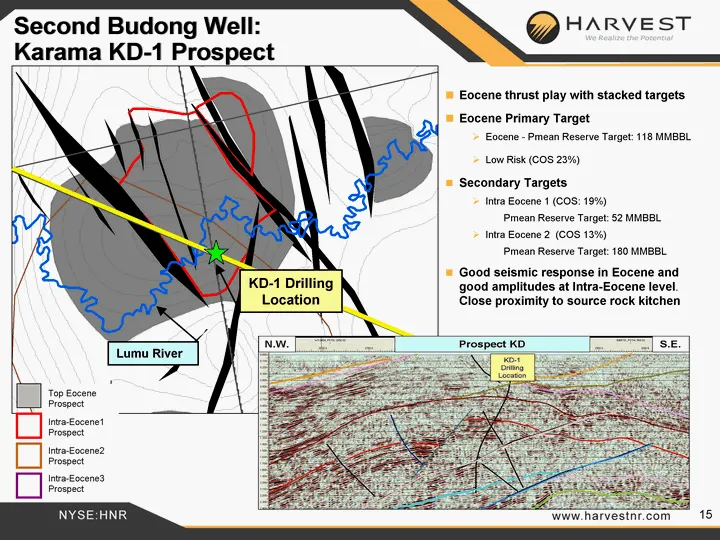
15 Second Budong Well: Karama KD-1 Prospect Eocene thrust play with stacked targets Eocene Primary Target Eocene - Pmean Reserve Target: 118 MMBBL Low Risk (COS 23%) Secondary Targets Intra Eocene 1 (COS: 19%) Pmean Reserve Target: 52 MMBBL Intra Eocene 2 (COS 13%) Pmean Reserve Target: 180 MMBBL Go
Slide 16: Gabon - Dussafu
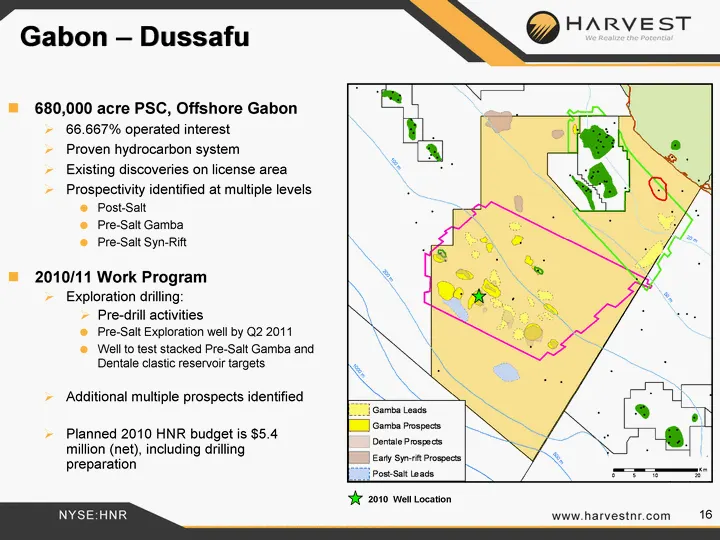
16 Gabon - Dussafu 680,000 acre PSC, Offshore Gabon 66.667% operated interest Proven hydrocarbon system Existing discoveries on license area Prospectivity identified at multiple levels Post-Salt Pre-Salt Gamba Pre-Salt Syn-Rift 2010/11 Work Program Exploration drilling: Pre-drill activities Pre-Salt
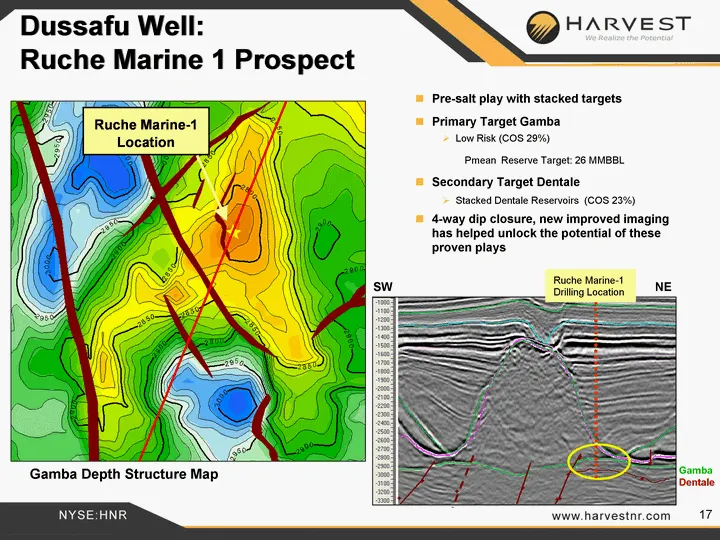
Slide 17: Dussafu Well: Ruche Marine Prospect
17 Dussafu Well: Ruche Marine 1 Prospect Pre-salt play with stacked targets Primary Target Gamba Low Risk (COS 29%) Pmean Reserve Target: 26 MMBBL Secondary Target Dentale Stacked Dentale Reservoirs (COS 23%) 4-way dip closure, new improved imaging has helped unlock the potential of these proven pla
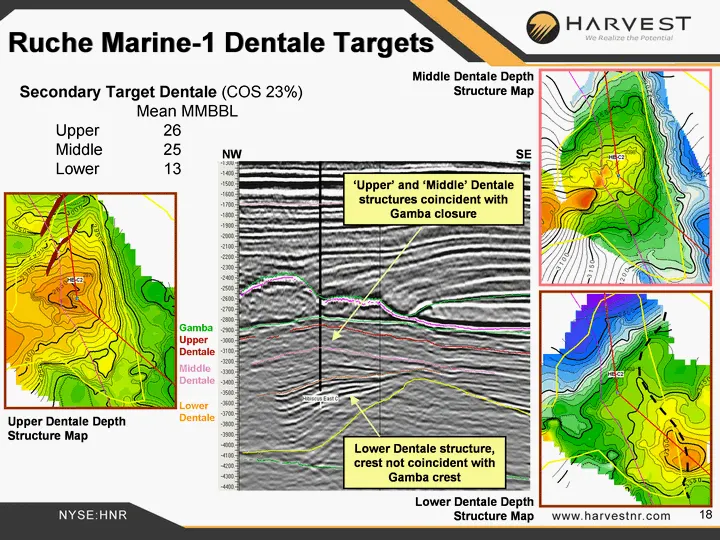
Slide 18: Ruche Marine-1 Dentale Targets
18 Ruche Marine-1 Dentale Targets Secondary Target Dentale (COS 23%) Mean MMBBL Upper 26 Middle 25 Lower 13 Gamba Upper Dentale Middle Dentale Lower Dentale
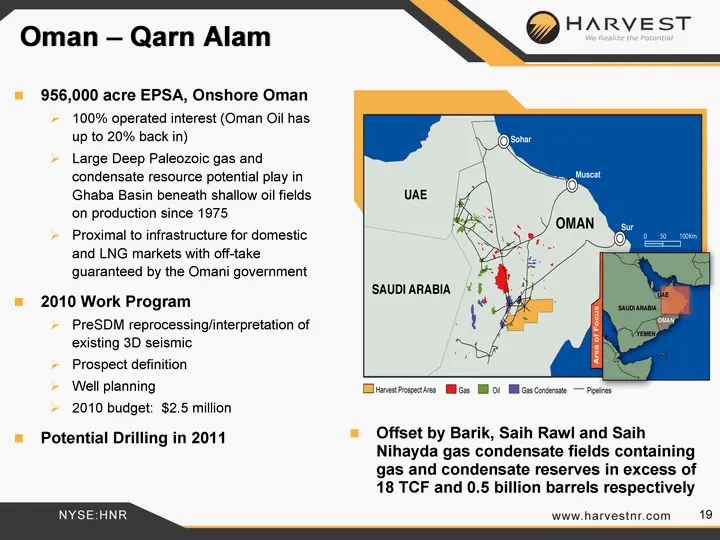
Slide 19: Oman - Qarn Alam
19 Oman - Qarn Alam 956,000 acre EPSA, Onshore Oman 100% operated interest (Oman Oil has up to 20% back in) Large Deep Paleozoic gas and condensate resource potential play in Ghaba Basin beneath shallow oil fields on production since 1975 Proximal to infrastructure for domestic and LNG markets with
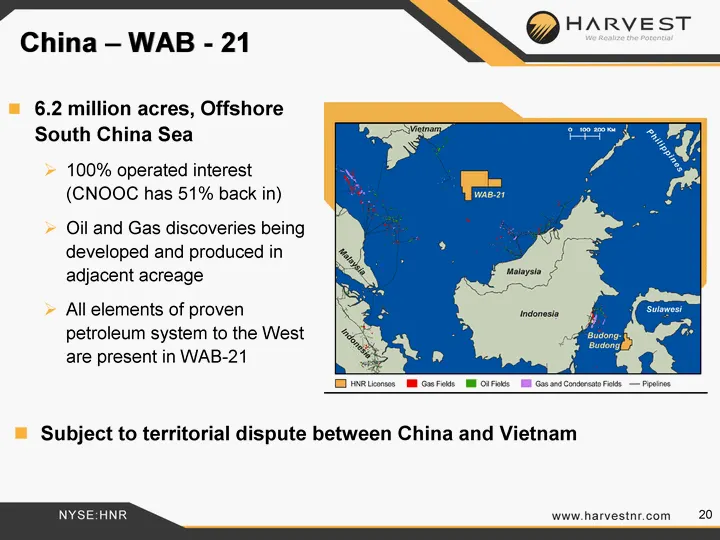
Slide 20: China - WAB
20 China - WAB - 21 6.2 million acres, Offshore South China Sea 100% operated interest (CNOOC has 51% back in) Oil and Gas discoveries being developed and produced in adjacent acreage All elements of proven petroleum system to the West are present in WAB-21 Subject to territorial dispute between Chi
Slide 21: US Portfolio
21 21 Harvest Natural Resources, Inc. US Portfolio Tested. Proven. Moving Forward
Slide 22: Central Area of the Uinta Basin, Utah
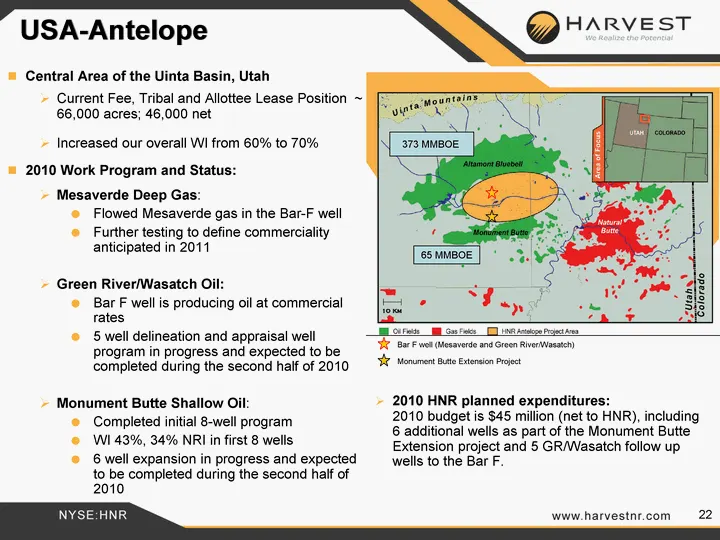
22 Central Area of the Uinta Basin, Utah Current Fee, Tribal and Allottee Lease Position ~ 66,000 acres; 46,000 net Increased our overall WI from 60% to 70% 2010 Work Program and Status: Mesaverde Deep Gas: Flowed Mesaverde gas in the Bar-F well Further testing to define commerciality anticipated in
Slide 23: USA-Antelope - Shallow Oil: Monument Butte Extension
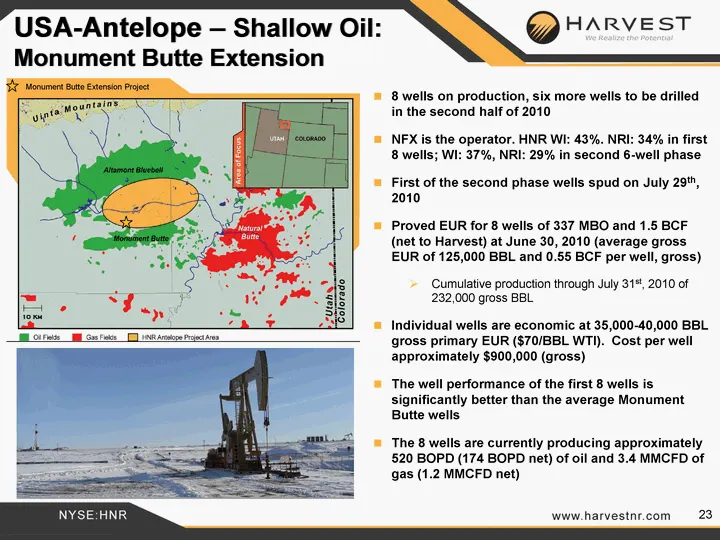
23 8 wells on production, six more wells to be drilled in the second half of 2010 NFX is the operator. HNR WI: 43%. NRI: 34% in first 8 wells; WI: 37%, NRI: 29% in second 6-well phase First of the second phase wells spud on July 29th, 2010 Proved EUR for 8 wells of 337 MBO and 1.5 BCF (net to Harves
Slide 24: USA-Antelope - Bar F Well Green River/Wasatch Oil
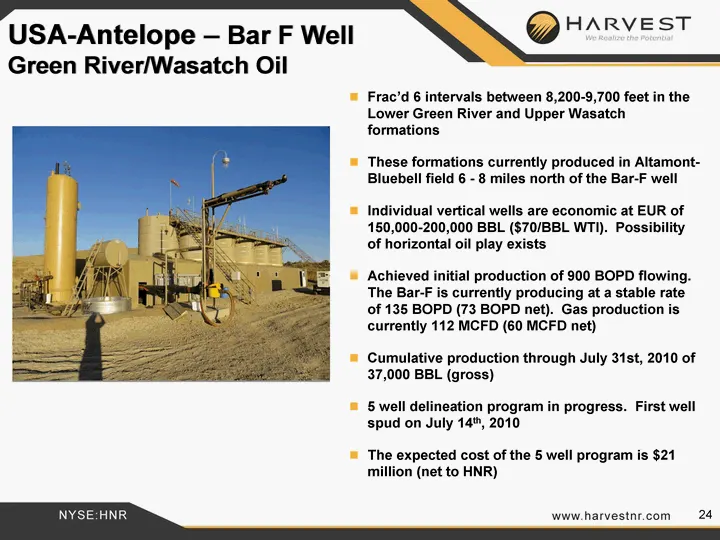
24 Frac'd 6 intervals between 8,200-9,700 feet in the Lower Green River and Upper Wasatch formations These formations currently produced in Altamont- Bluebell field 6 - 8 miles north of the Bar-F well Individual vertical wells are economic at EUR of 150,000-200,000 BBL ($70/BBL WTI). Possibility of
Slide 25: USA-Antelope: Deep Tight Mesaverde Gas Exploration
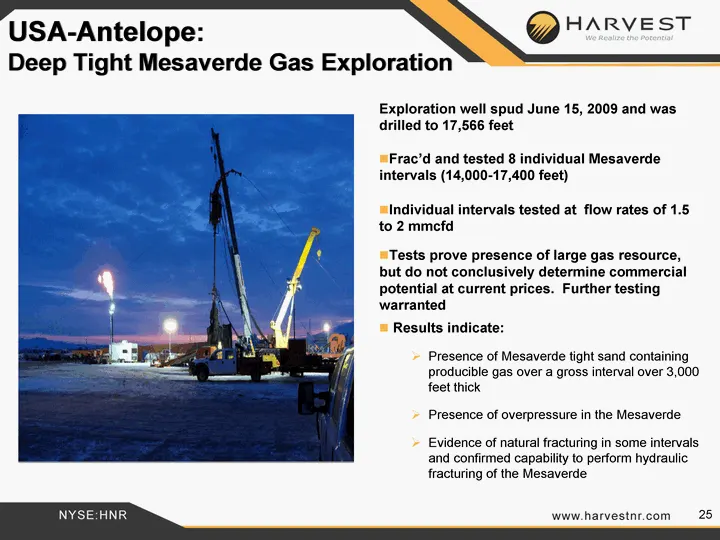
25 Exploration well spud June 15, 2009 and was drilled to 17,566 feet Frac'd and tested 8 individual Mesaverde intervals (14,000-17,400 feet) Individual intervals tested at flow rates of 1.5 to 2 mmcfd Tests prove presence of large gas resource, but do not conclusively determine commercial potential
Slide 26: Antelope Project Summary
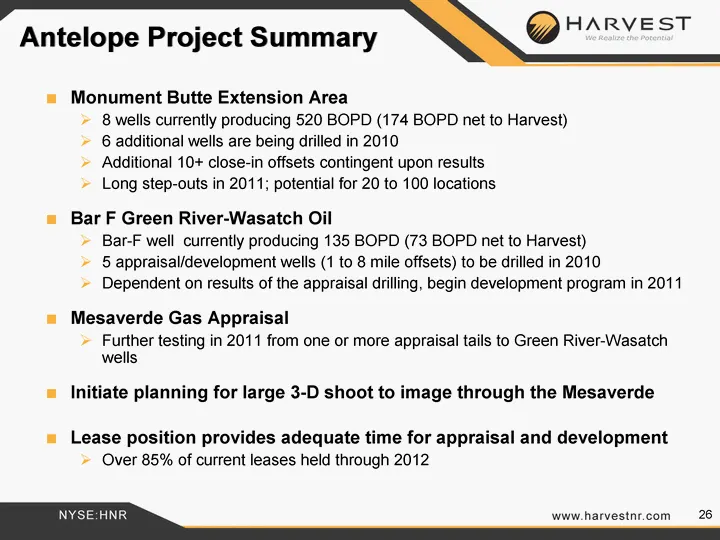
26 Antelope Project Summary Monument Butte Extension Area 8 wells currently producing 520 BOPD (174 BOPD net to Harvest) 6 additional wells are being drilled in 2010 Additional 10+ close-in offsets contingent upon results Long step-outs in 2011; potential for 20 to 100 locations Bar F Green River-Wa
Slide 27: Schedule
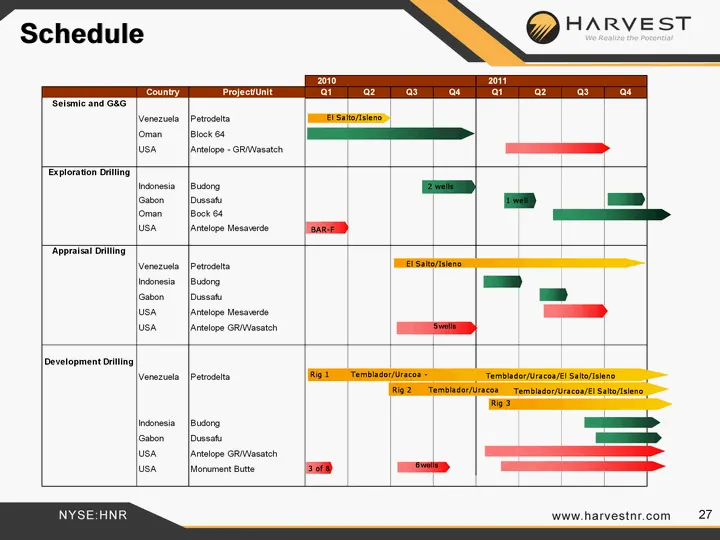
Schedule \Venezvaia petodsta lusa —_Jataone -cRowasaten Exploraon Daling Indonesia Jeutora ten Jouseat = =) lorem foockst — luca |araloe Mesneco SD, aT [Venezucia |Petrodelta. | Samoytsiene lsoresia [outer = stenoses = lusa—|araloe Meer =} luce |artaope anriaten sD, evelopment Dring \enazvaia Jpetod
Slide 28: Share Price Relative to Value
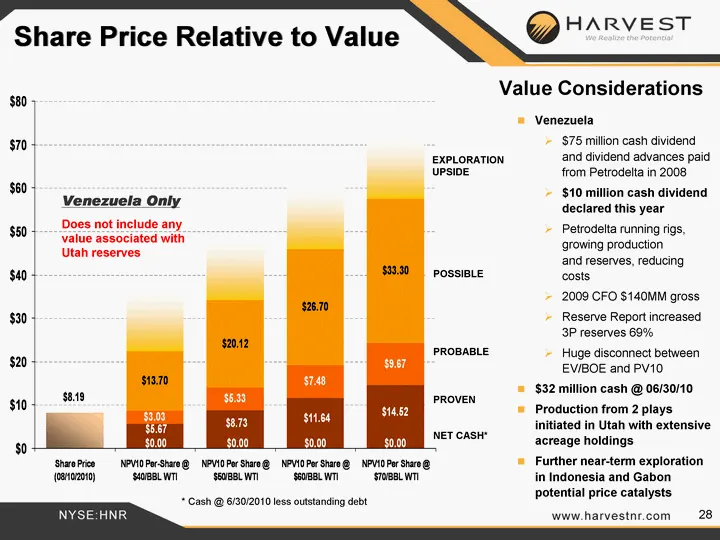
28 Share Price Relative to Value Share Price (08/10/2010) NPV10 Per-Share @ $40/BBL WTI NPV10 Per Share @ $50/BBL WTI NPV10 Per Share @ $60/BBL WTI NPV10 Per Share @ $70/BBL WTI Share Price (08/10/10) 8.19 Cash 0 0 0 0 Petrodelta 1P 5.67 8.73 11.64 14.52 Petrodelta 2P 3.03 5.33 7.48 9.67 Petrodelta
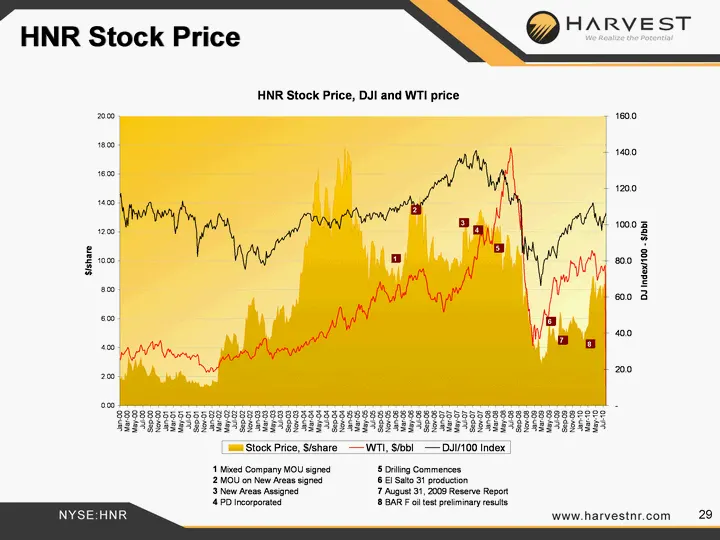
Slide 29: HNR Stock Price
HNR Stock Price ‘\ NO QHaArvest HNR Stock Price, DJ! and WT! price 8 sehare Index t00- sob 9888833335 338898 38888888: crt Speaggsgesasugssaggsasege ‘Stock Price, Siéhare_ —WT, Sibbl_ —DJV/00 Index 1 Nxed Company MOU signed $5 Ding Commences 3 New Aves sed 1 August 3, 2009 Renarve Repo 4 PO Inrporat
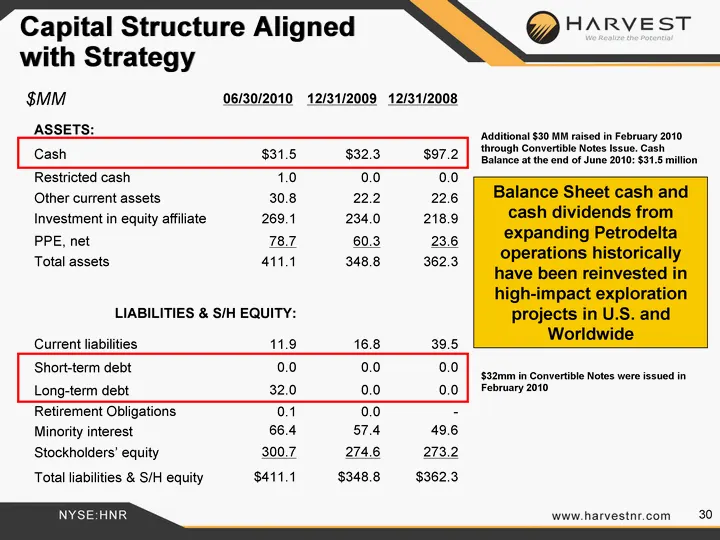
Slide 30: Capital Structure Aligned with Strategy
30 Capital Structure Aligned with Strategy 06/30/2010 12/31/2009 12/31/2008 ASSETS: Cash $31.5 $32.3 $97.2 Restricted cash 1.0 0.0 0.0 Other current assets 30.8 22.2 22.6 Investment in equity affiliate 269.1 234.0 218.9 PPE, net 78.7 60.3 23.6 Total assets 411.1 348.8 362.3 LIABILITIES & S/H EQUITY:
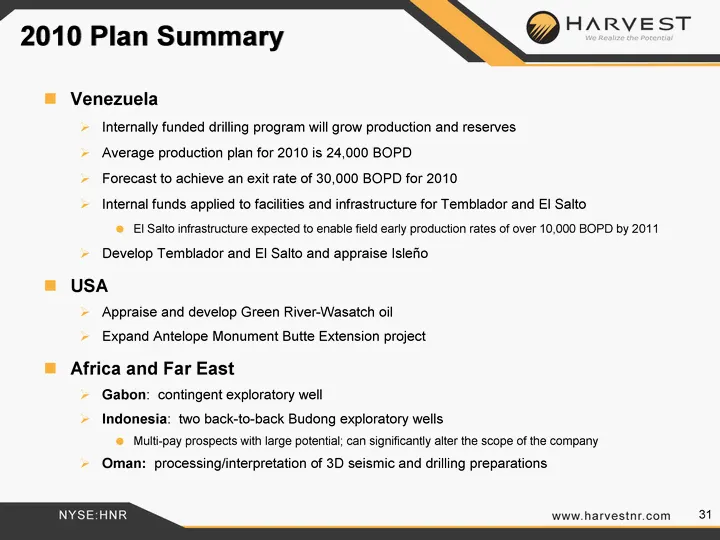
Slide 31: 2010 Plan Summary
31 2010 Plan Summary Venezuela Internally funded drilling program will grow production and reserves Average production plan for 2010 is 24,000 BOPD Forecast to achieve an exit rate of 30,000 BOPD for 2010 Internal funds applied to facilities and infrastructure for Temblador and El Salto El Salto inf
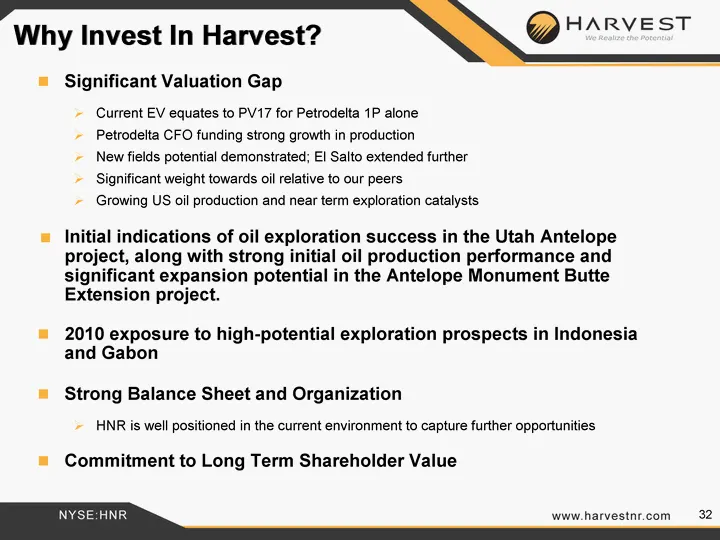
Slide 32: Why Invest In Harvest?
32 Why Invest In Harvest? Significant Valuation Gap Current EV equates to PV17 for Petrodelta 1P alone Petrodelta CFO funding strong growth in production New fields potential demonstrated; El Salto extended further Significant weight towards oil relative to our peers Growing US oil production and ne
Source: SEC EDGAR · 8-K filed Aug 23, 2010
More decks from Harvest Natural Resources Inc
 Enercom Oil and Gas Conference 201517 slides · Aug 17, 2015
 Enercom Oil and Gas Conference 201417 slides · Aug 18, 2014
 Global Hunter Energy Conference (June 2014)18 slides · Jun 25, 2014
 EnerCom's The Oil & Gas Conference 18 (August 2013)20 slides · Aug 12, 2013
 Global Hunter Securities 100 Energy Conference 201316 slides · Jun 25, 2013
 EnerCom's The Oil and Gas Conference 201220 slides · Aug 13, 2012