Cal Dive International — Q3 2012 Earnings Presentation
12 slides from Cal Dive International's earnings presentation, Nov 8, 2012

Slide 1: Cal Dive International 3rd Quarter 2012 Earnings Conference Call
Cal Dive International 3rd Quarter 2012 Earnings Conference Call
Slide 2: Forward-Looking Statements
Forward-Looking Statements This presentation may include “forward-looking” statements that are generally identifiable through the use of words such as “believe,” “expect,” “anticipate,” “intend,” “plan,” “estimate,” “project” and similar expressions and include any statements that are made regarding
Slide 3: Presentation Outline
Presentation Outline * Summary of 3Q 2012 Backlog Discussion of Financial Results Non-GAAP Reconciliations Q & A
Slide 4: Summary of 3Q 2012
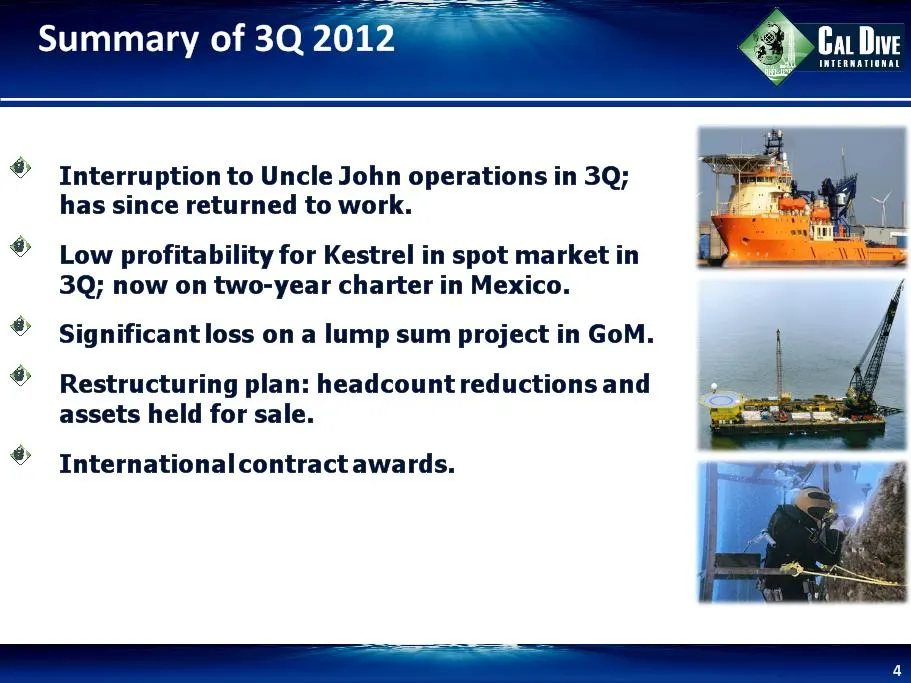
Summary of 3Q 2012 * Interruption to Uncle John operations in 3Q; has since returned to work. Low profitability for Kestrel in spot market in 3Q; now on two-year charter in Mexico. Significant loss on a lump sum project in GoM. Restructuring plan: headcount reductions and assets held for sale. Inter
Slide 5: Backlog
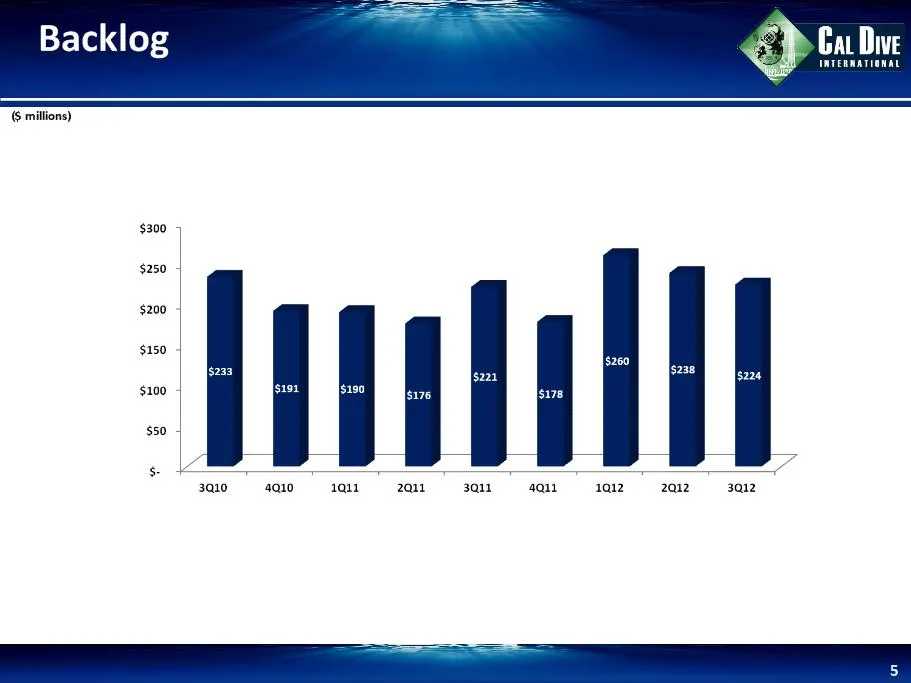
Backlog Cat Dive INTERNATIONAL $200 $250 $200 $150 , 260 s22a $238 sz2e $100 | es 3176 5178 $50 ¢ £ y saxo. agi iqtn 2d 3QI2, agua. tqaz,2aaz_ az
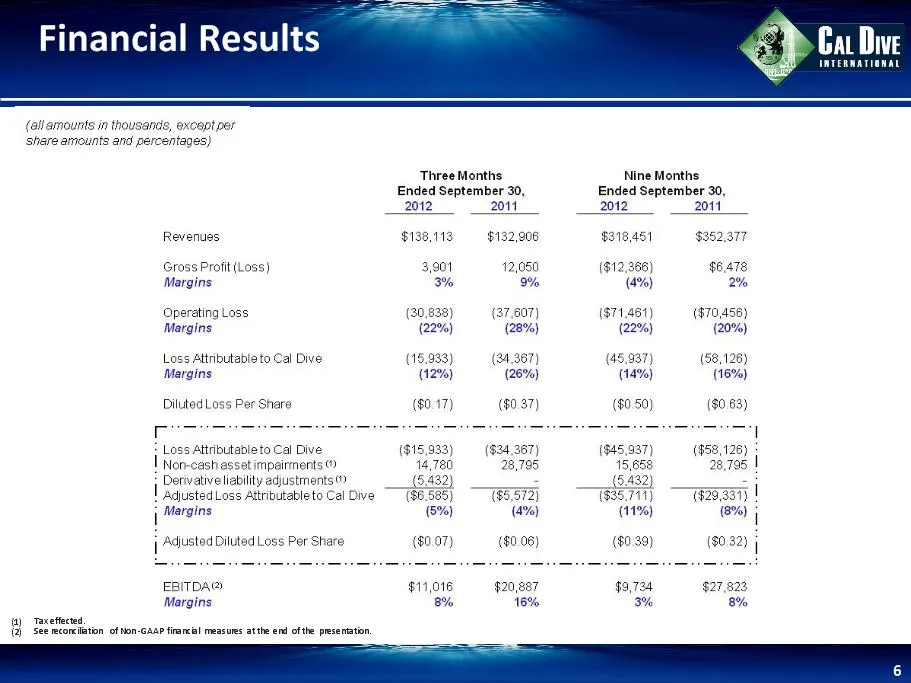
Slide 6: Financial Results
Financial Results * Tax effected. See reconciliation of Non-GAAP financial measures at the end of the presentation.
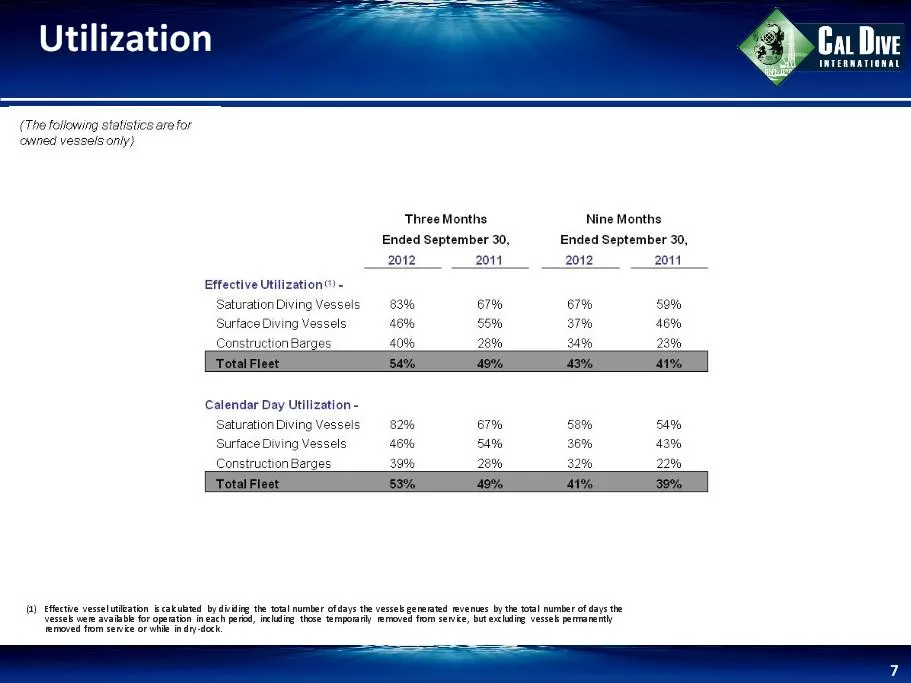
Slide 7: Utilization
Utilization * (1) Effective vessel utilization is calculated by dividing the total number of days the vessels generated revenues by the total number of days the vessels were available for operation in each period, including those temporarily removed from service, but excluding vessels permanently re
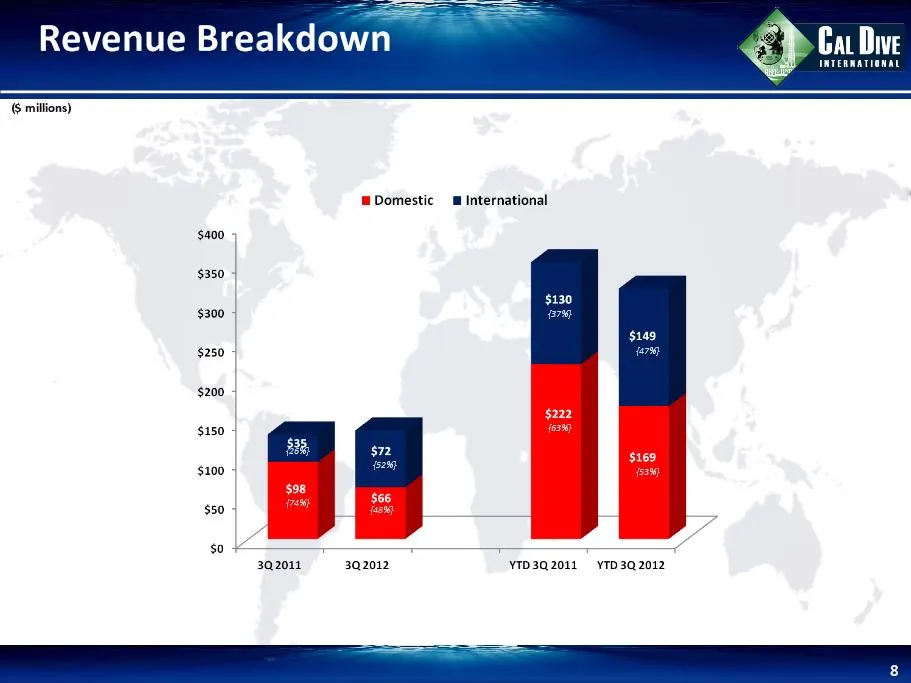
Slide 8: Revenue Breakdown
Revenue Breakdown * ($ millions) {26%} {74%} {52%} {48%} {53%} {37%} {47%} {63%}
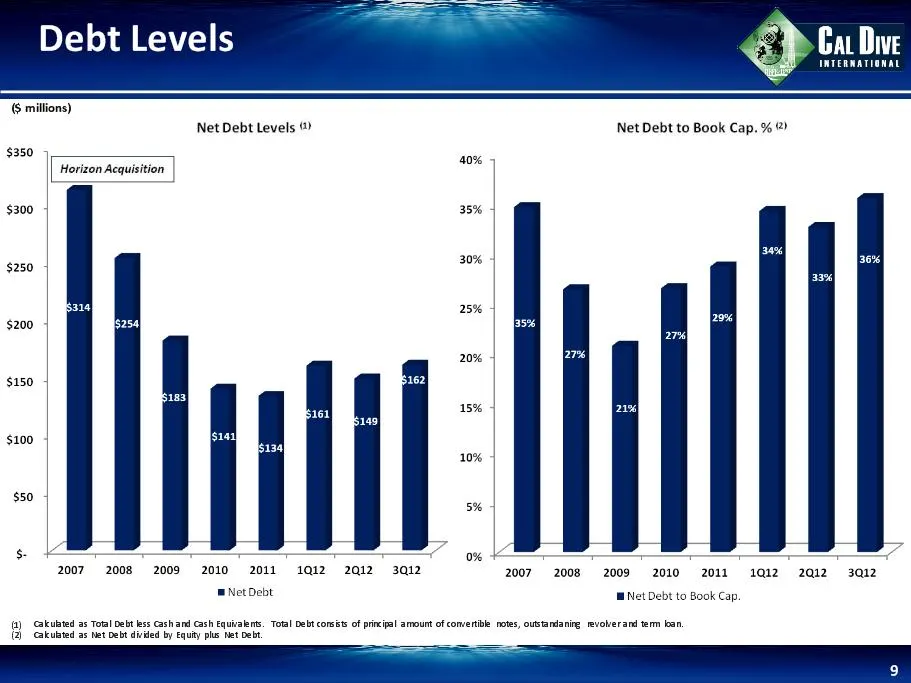
Slide 9: Debt Levels
Debt Levels * ($ millions) Calculated as Total Debt less Cash and Cash Equivalents. Total Debt consists of principal amount of convertible notes, outstandaning revolver and term loan. Calculated as Net Debt divided by Equity plus Net Debt.
Slide 10: Revolver Capacity
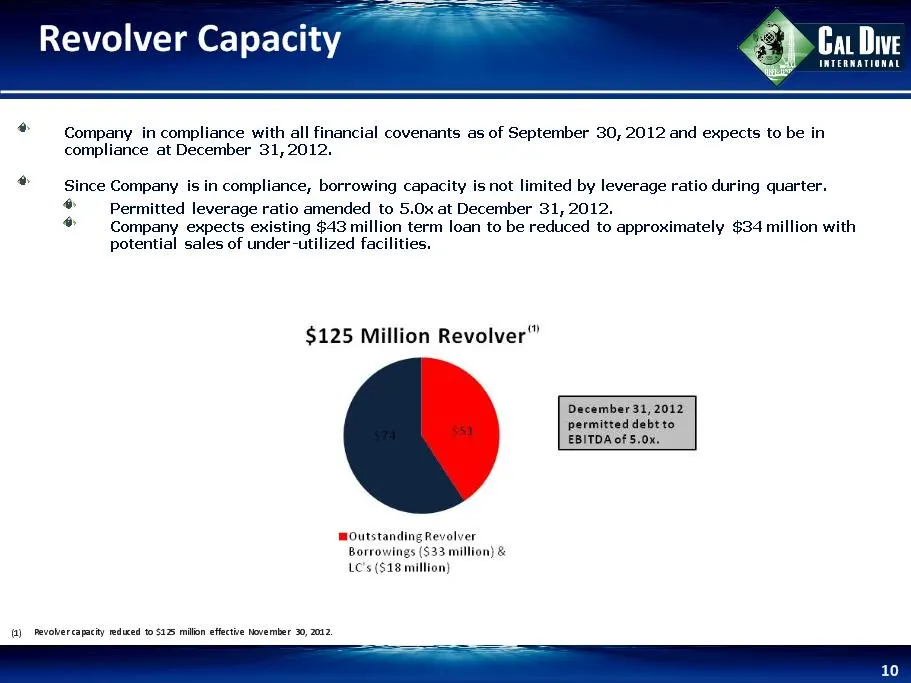
Revolver Capacity * Company in compliance with all financial covenants as of September 30, 2012 and expects to be in compliance at December 31, 2012. Since Company is in compliance, borrowing capacity is not limited by leverage ratio during quarter. Permitted leverage ratio amended to 5.0x at Decemb
Slide 11: Non-GAAP Reconciliations
Non-GAAP Reconciliations *
Slide 12: EBITDA Reconciliations
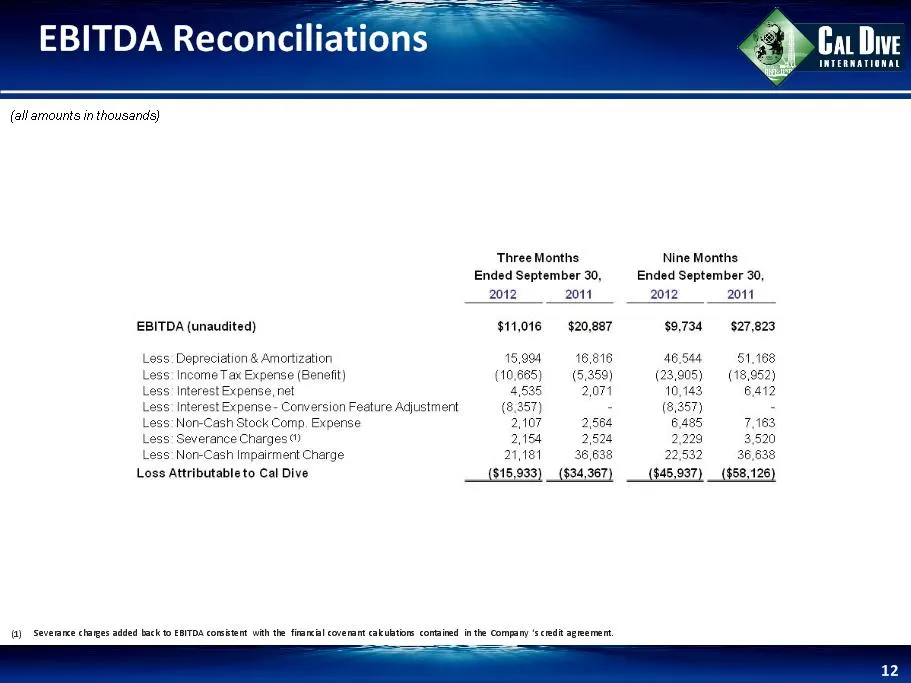
EBITDA Reconciliations * (all amounts in thousands) Severance charges added back to EBITDA consistent with the financial covenant calculations contained in the Company ‘s credit agreement.
Source: SEC EDGAR · 8-K filed Nov 8, 2012
More decks from Cal Dive International Inc
 Q3 2014 Earnings Presentation12 slides · Nov 6, 2014
 Q2 2014 Earnings Presentation12 slides · Aug 11, 2014
 Q1 2014 Earnings Presentation12 slides · May 9, 2014
 Q4 2013 Earnings Presentation11 slides · Mar 5, 2014
 Q3 2013 Earnings Presentation11 slides · Nov 7, 2013
 Q2 2013 Earnings Presentation11 slides · Aug 8, 2013