Santander Holdings USA Inc · NYSE:SNUS/PH
Santander Holdings USA — Debt Investor Presentation (March 2021)
43 slides from Santander Holdings USA's debt investor presentation, Mar 3, 2021
Slide 1: Fixed Income Investor Presentation Fourth Quarter and Full Year 2020
Fixed Income Investor Presentation Fourth Quarter and Full Year 2020 March 3, 2021 SANTANDER HOLDINGS USA, INC.
Slide 2: Disclaimer
2 DISCLAIMER This presentation of Santander Holdings USA, Inc. (“SHUSA”) contains “forward-looking statements” within the meaning of the Private Securities Litigation Reform Act of 1995 regarding the financial condition, results of operations, business plans and future performance of SHUSA. Words su
Slide 3: Santander Group
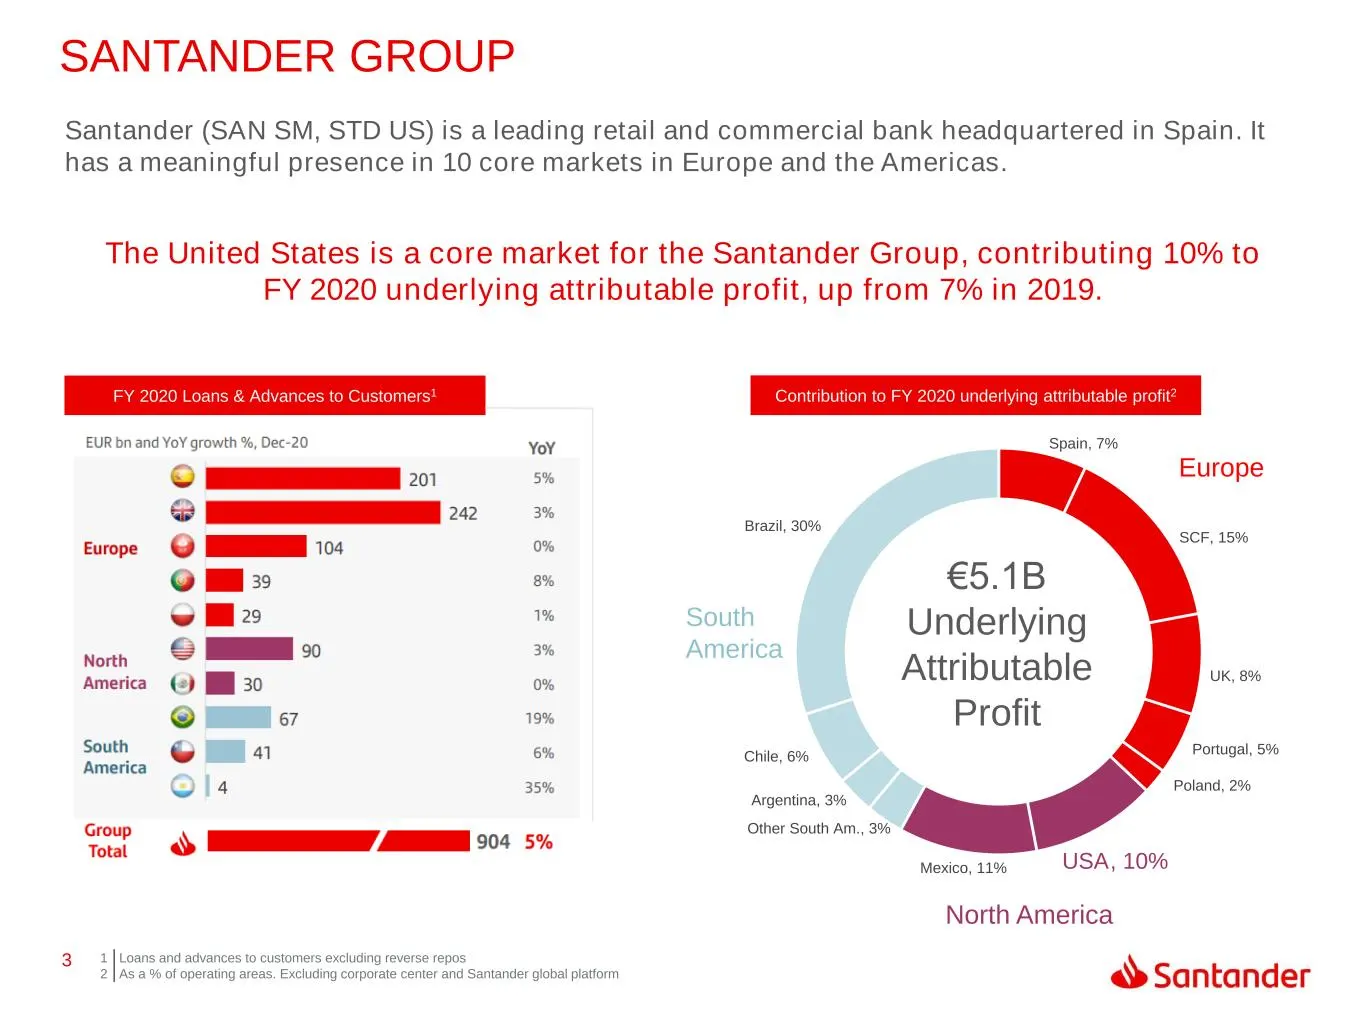
3 Spain, 7% SCF, 15% UK, 8% Portugal, 5% Poland, 2% USA, 10%Mexico, 11% Other South Am., 3% Argentina, 3% Chile, 6% Brazil, 30% SANTANDER GROUP The United States is a core market for the Santander Group, contributing 10% to FY 2020 underlying attributable profit, up from 7% in 2019. 1 2 Loans and ad
Slide 4: SHUSA Highlights
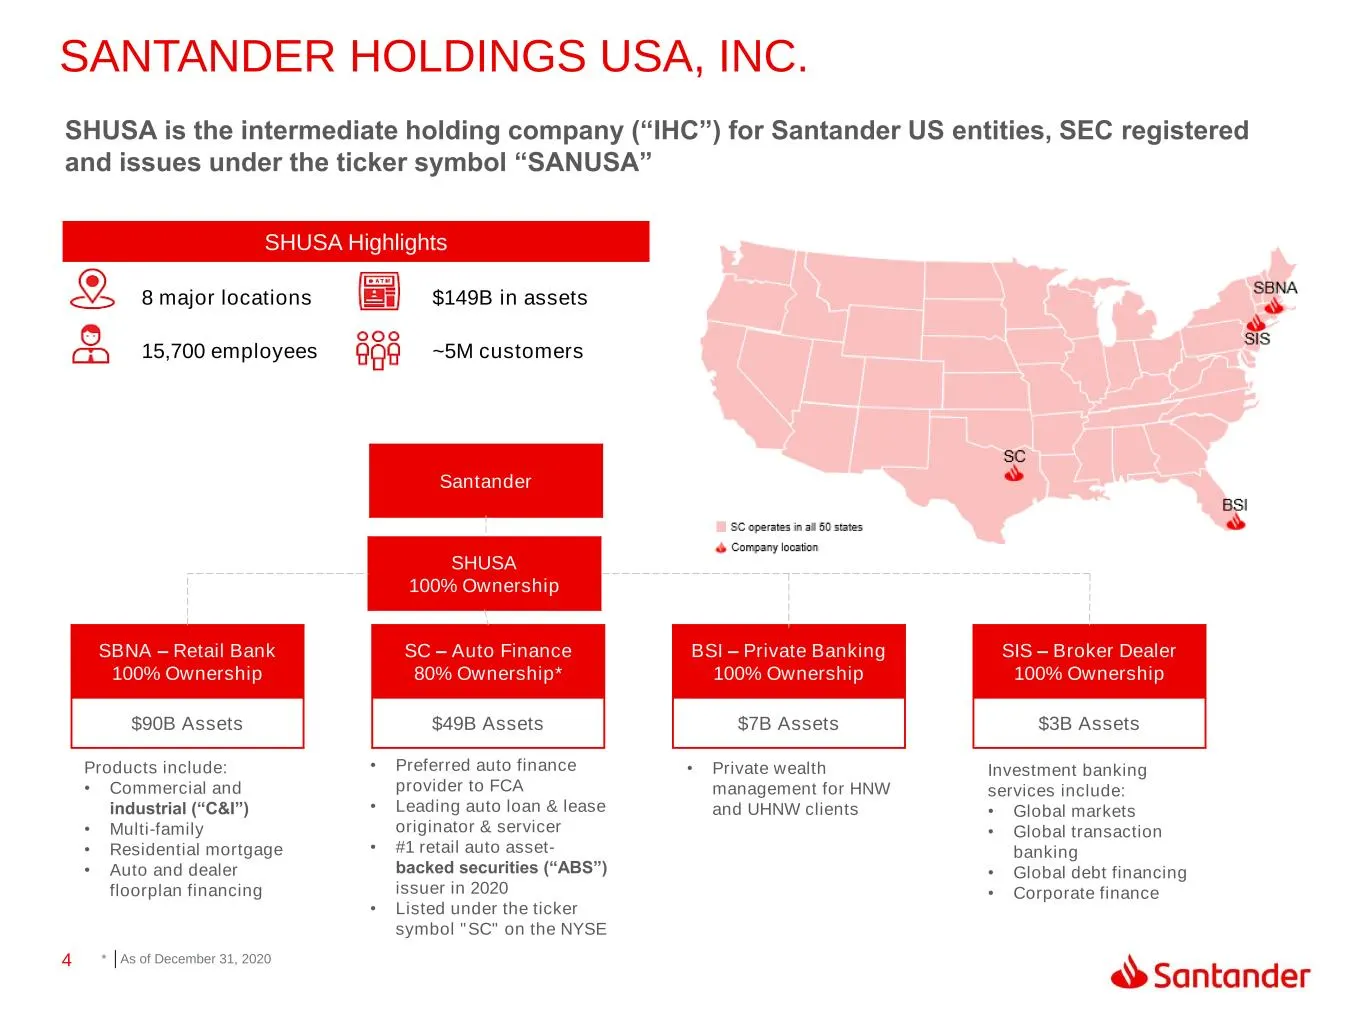
4 SANTANDER HOLDINGS USA, INC. SHUSA Highlights 15,700 employees ~5M customers $149B in assets8 major locations SHUSA is the intermediate holding company (“IHC”) for Santander US entities, SEC registered and issues under the ticker symbol “SANUSA” SHUSA 100% Ownership SBNA – Retail Bank 100% Ownersh
Slide 5: SBNA Highlights
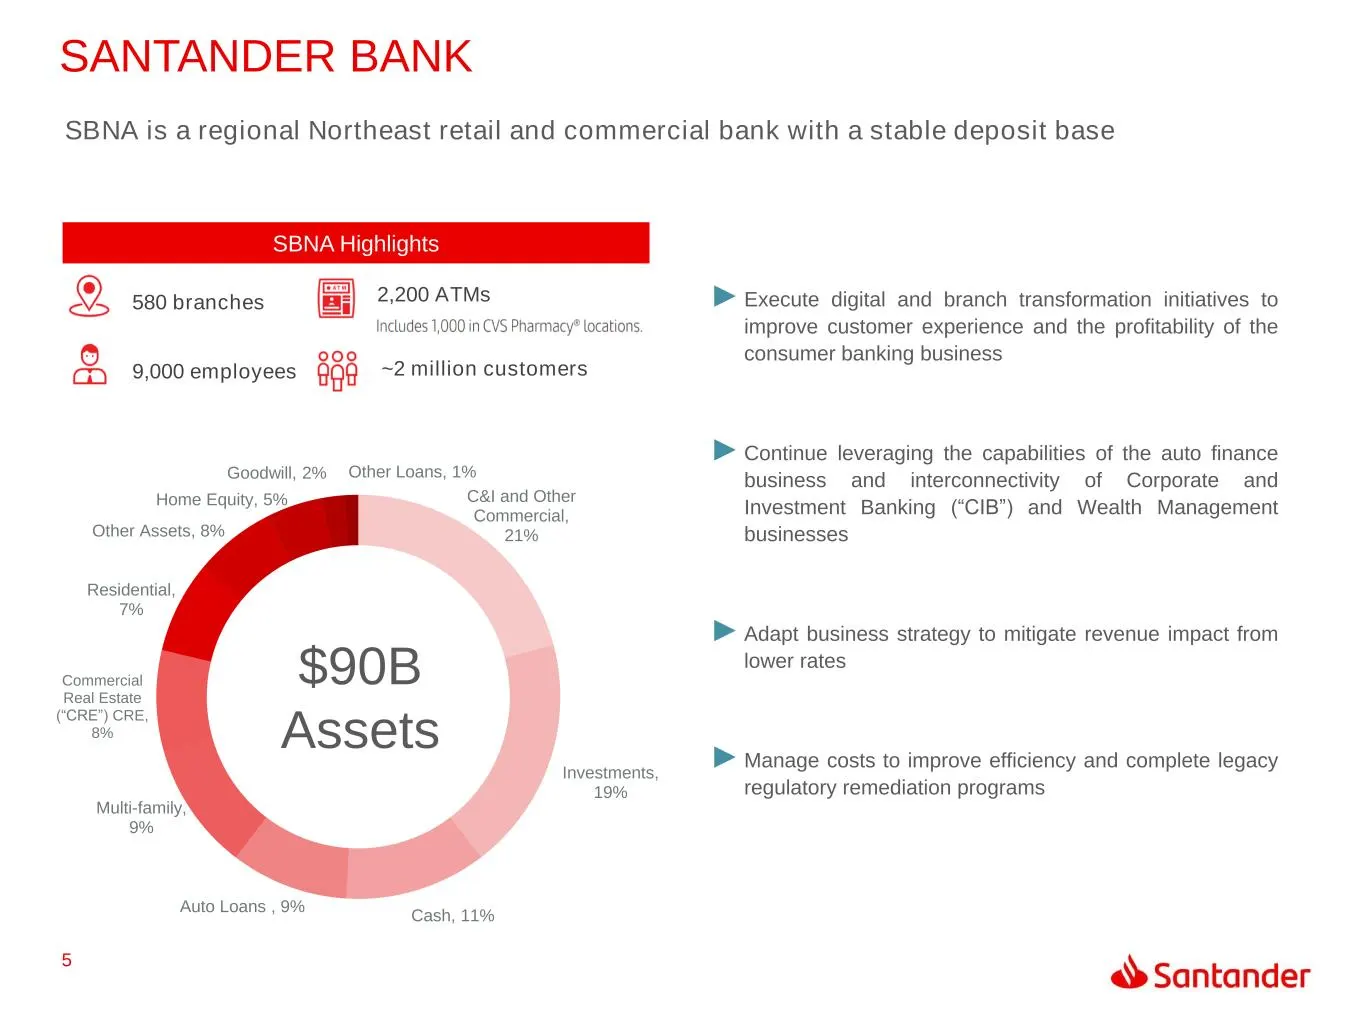
5 C&I and Other Commercial, 21% Investments, 19% Cash, 11% Auto Loans , 9% Multi-family, 9% Commercial Real Estate (“CRE”) CRE, 8% Residential, 7% Other Assets, 8% Home Equity, 5% Goodwill, 2% Other Loans, 1% SANTANDER BANK SBNA Highlights SBNA is a regional Northeast retail and commercial bank with
Slide 6: Santander Consumer USA: SC Highlights
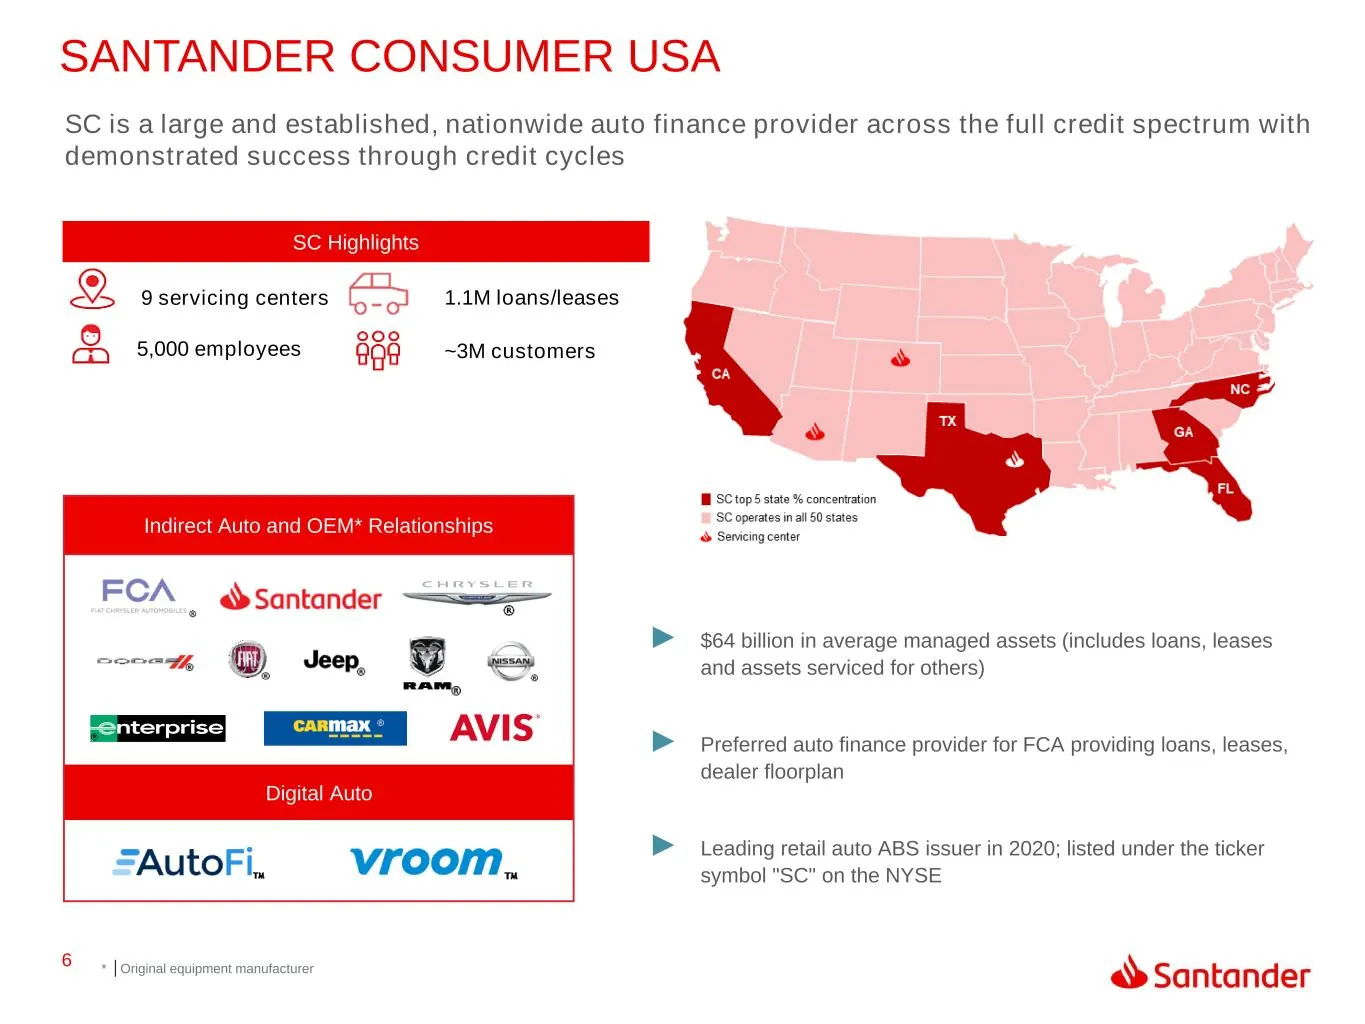
6 Digital Auto SANTANDER CONSUMER USA SC Highlights 5,000 employees ~3M customers 1.1M loans/leases9 servicing centers SC is a large and established, nationwide auto finance provider across the full credit spectrum with demonstrated success through credit cycles Indirect Auto and OEM* Relationships
Slide 7: FY 2020 Highlights
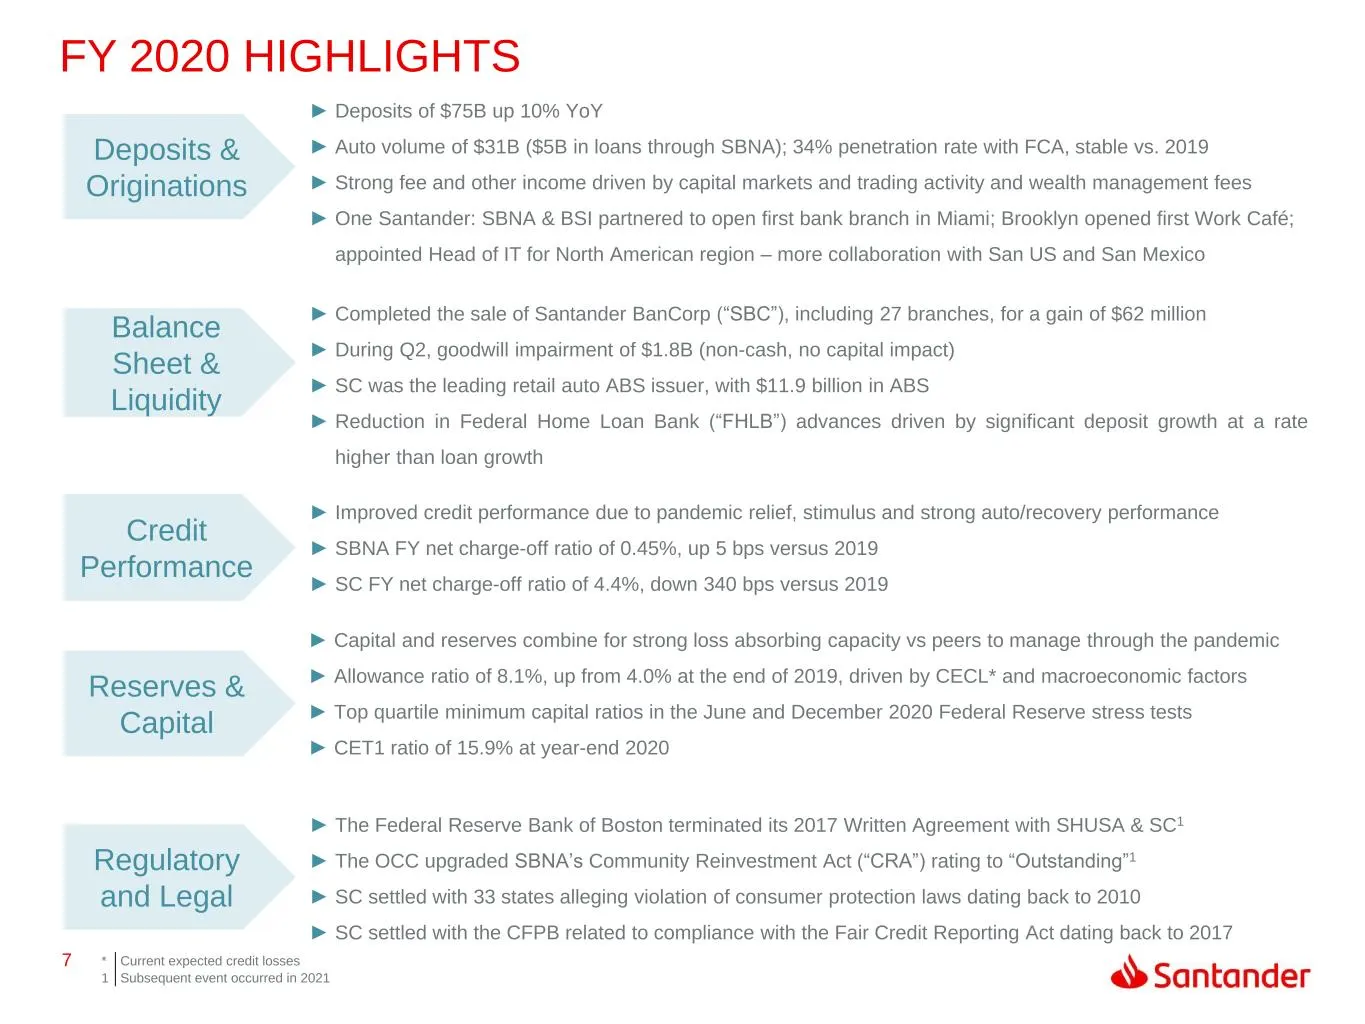
7 ► The Federal Reserve Bank of Boston terminated its 2017 Written Agreement with SHUSA & SC1 ► The OCC upgraded SBNA’s Community Reinvestment Act (“CRA”) rating to “Outstanding”1 ► SC settled with 33 states alleging violation of consumer protection laws dating back to 2010 ► SC settled with the CFP
Slide 8: Allowance for Credit Losses
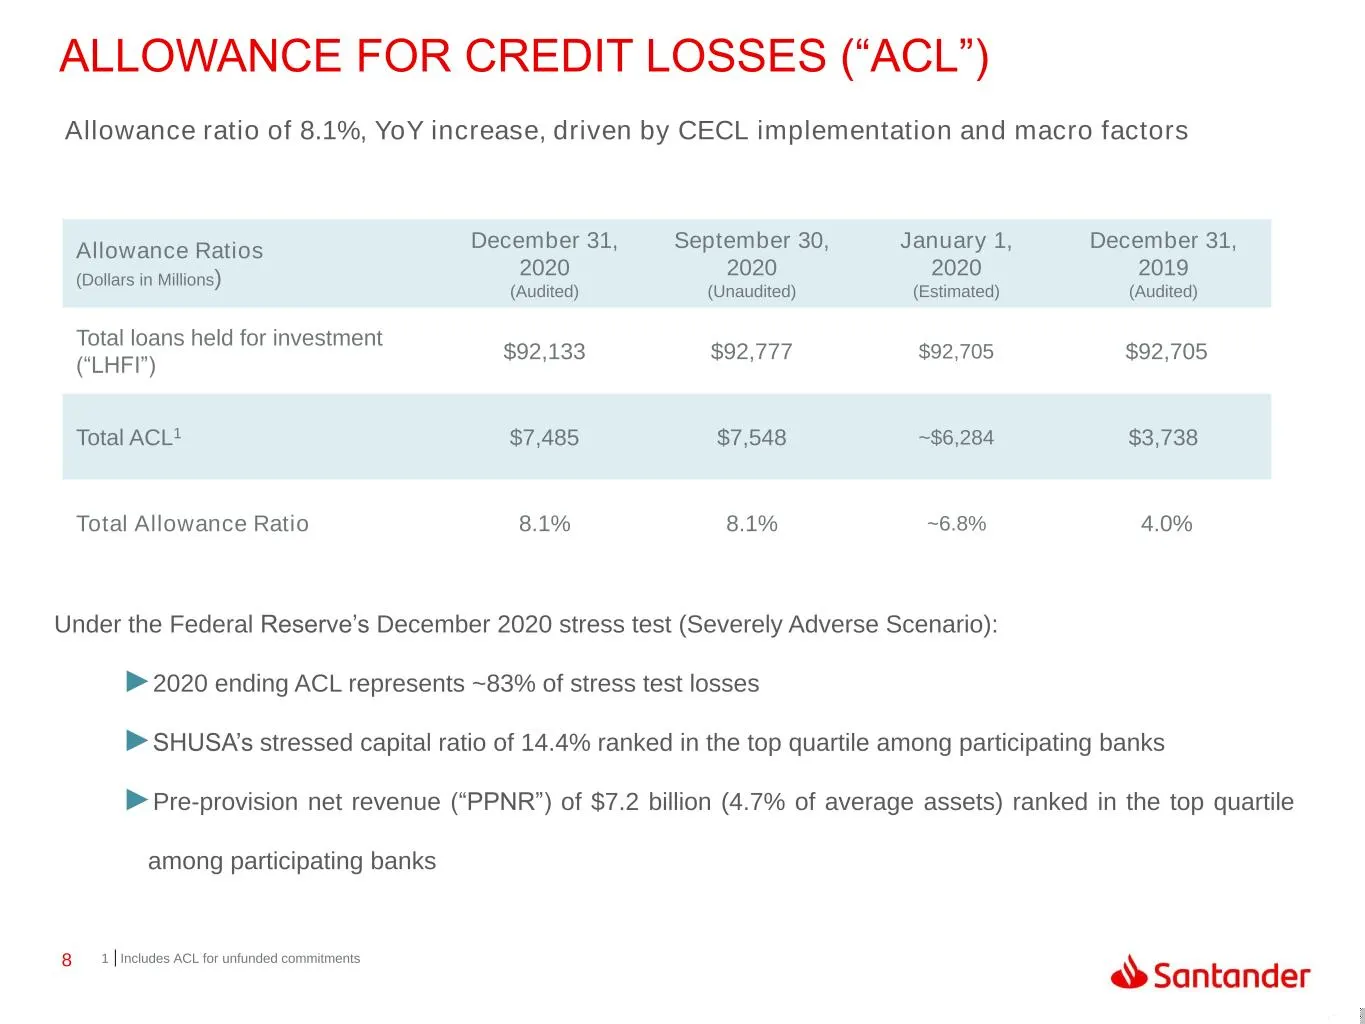
8 ALLOWANCE FOR CREDIT LOSSES (“ACL”) Allowance Ratios (Dollars in Millions) December 31, 2020 (Audited) September 30, 2020 (Unaudited) January 1, 2020 (Estimated) December 31, 2019 (Audited) Total loans held for investment (“LHFI”) $92,133 $92,777 $92,705 $92,705 Total ACL1 $7,485 $7,548 ~$6,284 $3
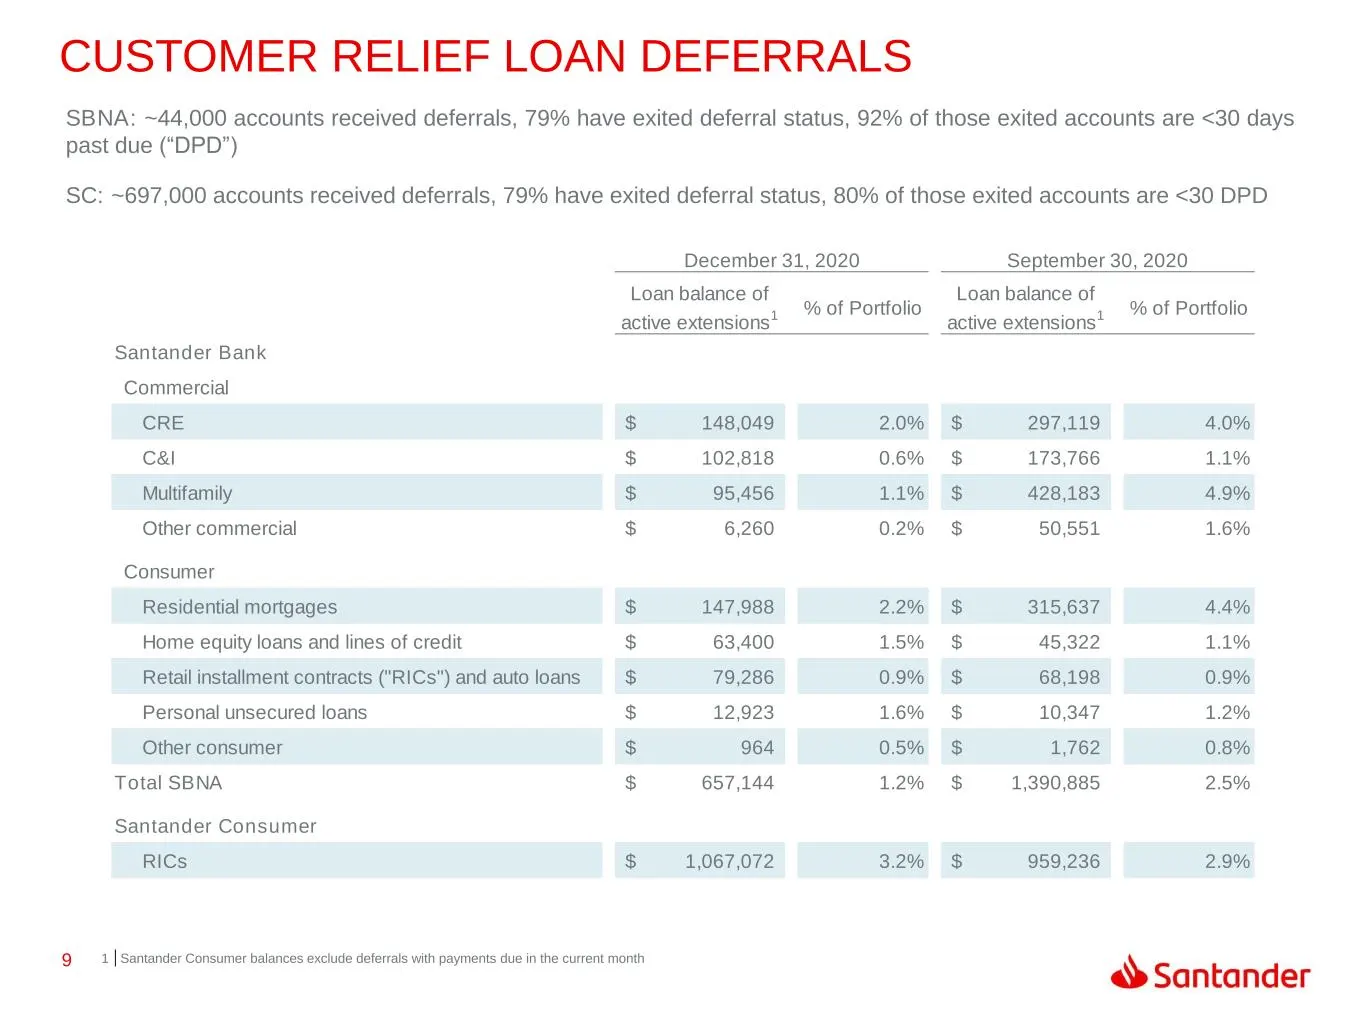
Slide 9: Customer Relief Loan Deferrals
9 CUSTOMER RELIEF LOAN DEFERRALS 1 Santander Consumer balances exclude deferrals with payments due in the current month SBNA: ~44,000 accounts received deferrals, 79% have exited deferral status, 92% of those exited accounts are <30 days past due (“DPD”) SC: ~697,000 accounts received deferrals, 79%
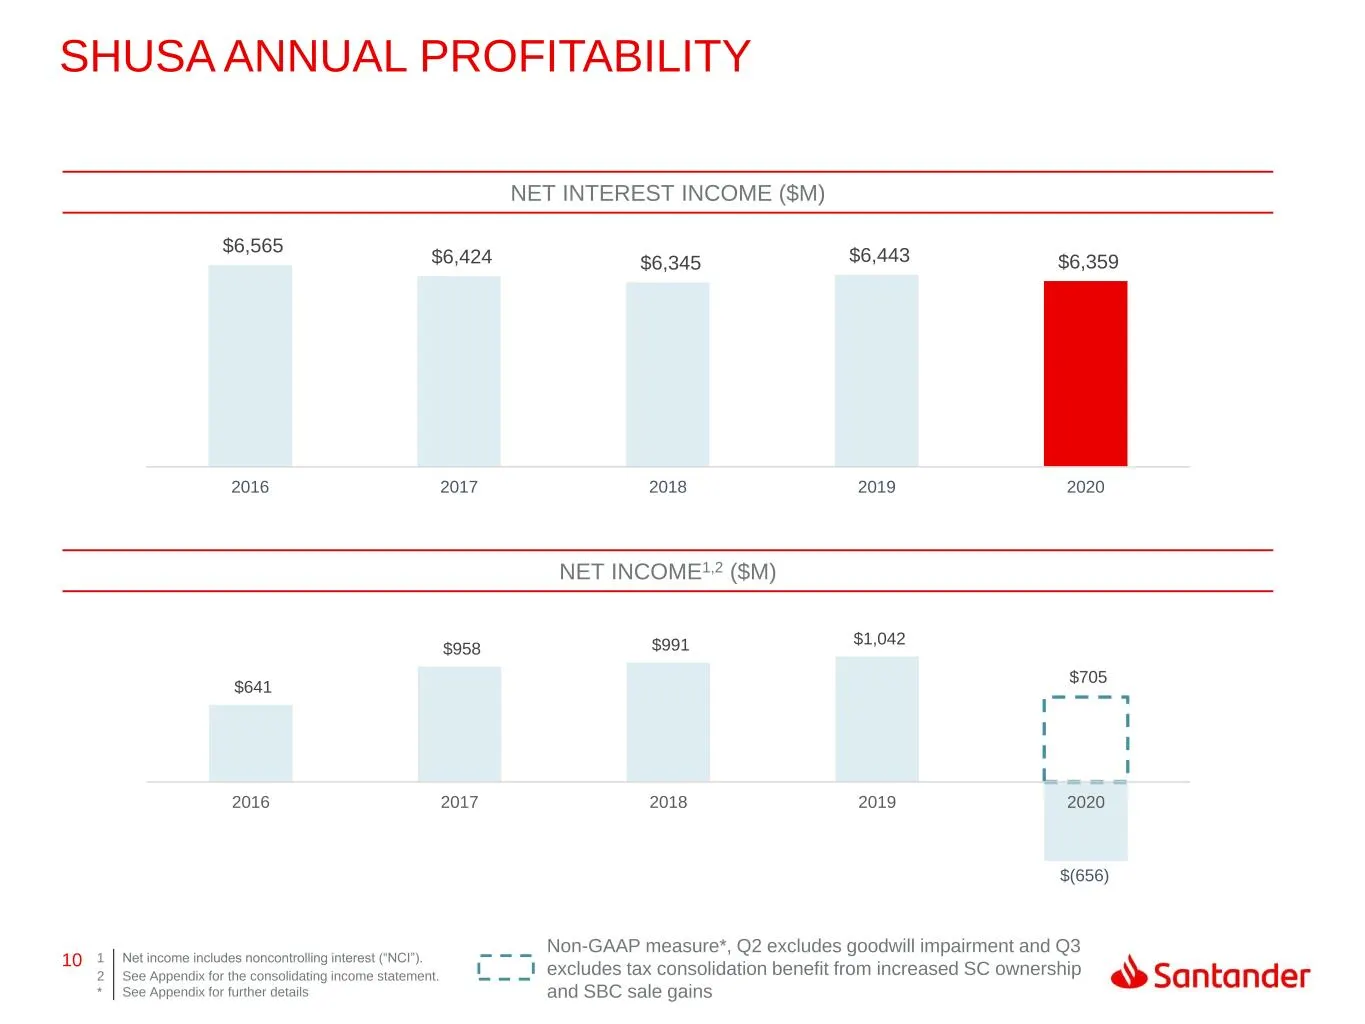
Slide 10: SHUSA Annual Profitability
10 $(656) $641 $958 $991 $1,042 $705 2016 2017 2018 2019 2020 $6,565 $6,424 $6,345 $6,443 $6,359 2016 2017 2018 2019 2020 SHUSA ANNUAL PROFITABILITY NET INTEREST INCOME ($M) NET INCOME1,2 ($M) 1 Net income includes noncontrolling interest (“NCI”). 2 * See Appendix for the consolidating income statem
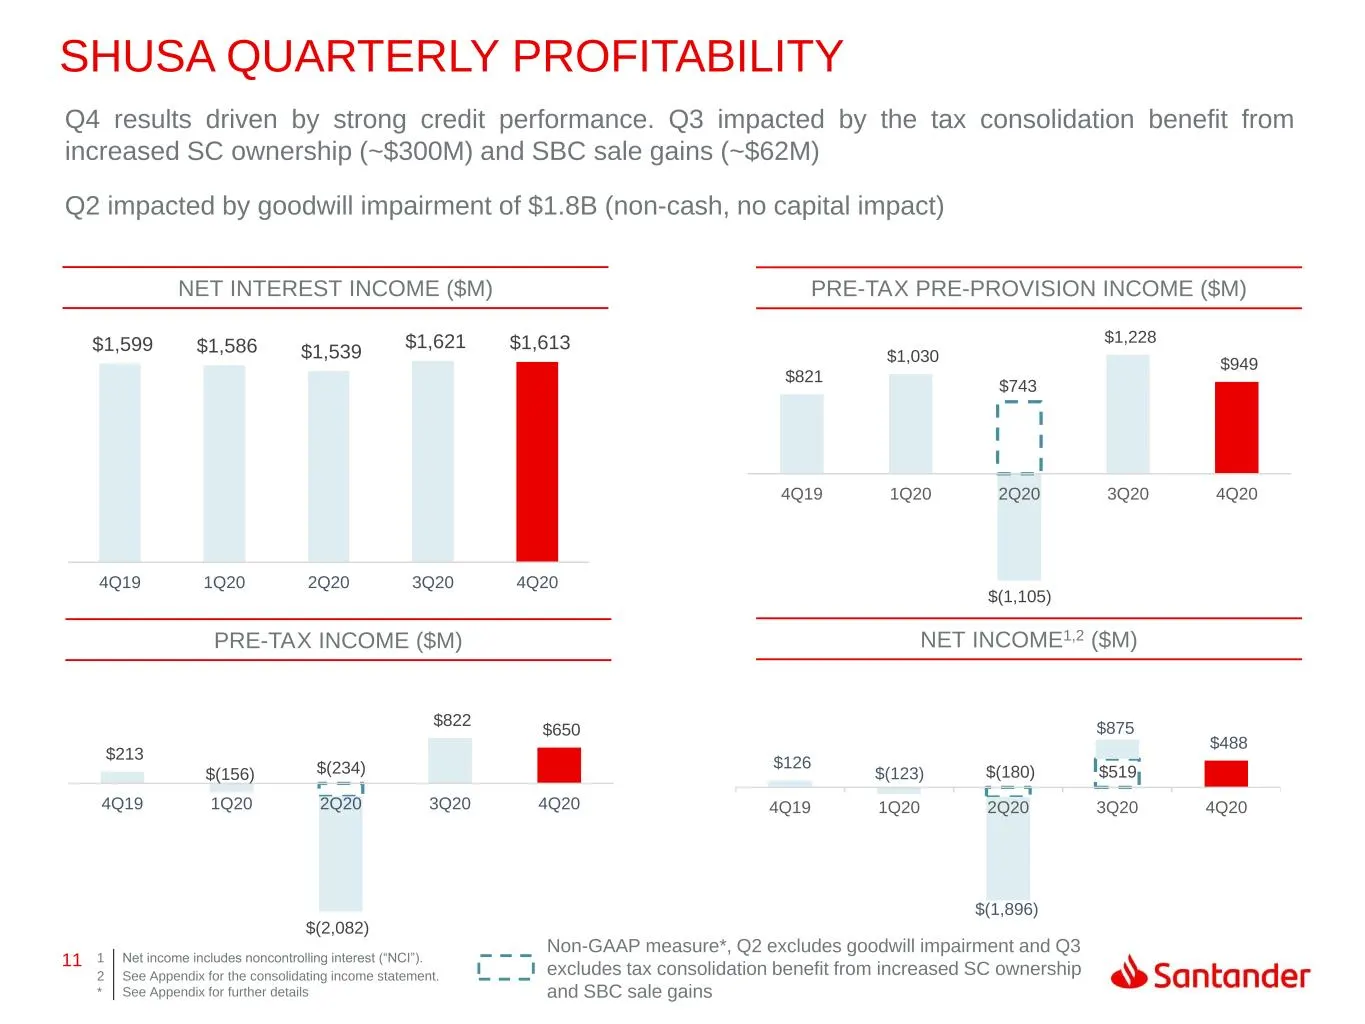
Slide 11: SHUSA Quarterly Profitability
11 $(180) $519 $126 $(123) $(1,896) $875 $488 4Q19 1Q20 2Q20 3Q20 4Q20 $(1,105) $821 $1,030 $743 $1,228 $949 4Q19 1Q20 2Q20 3Q20 4Q20 $(156) $(234) $213 $(2,082) $822 $650 4Q19 1Q20 2Q20 3Q20 4Q20 $1,599 $1,586 $1,539 $1,621 $1,613 4Q19 1Q20 2Q20 3Q20 4Q20 SHUSA QUARTERLY PROFITABILITY NET INTEREST
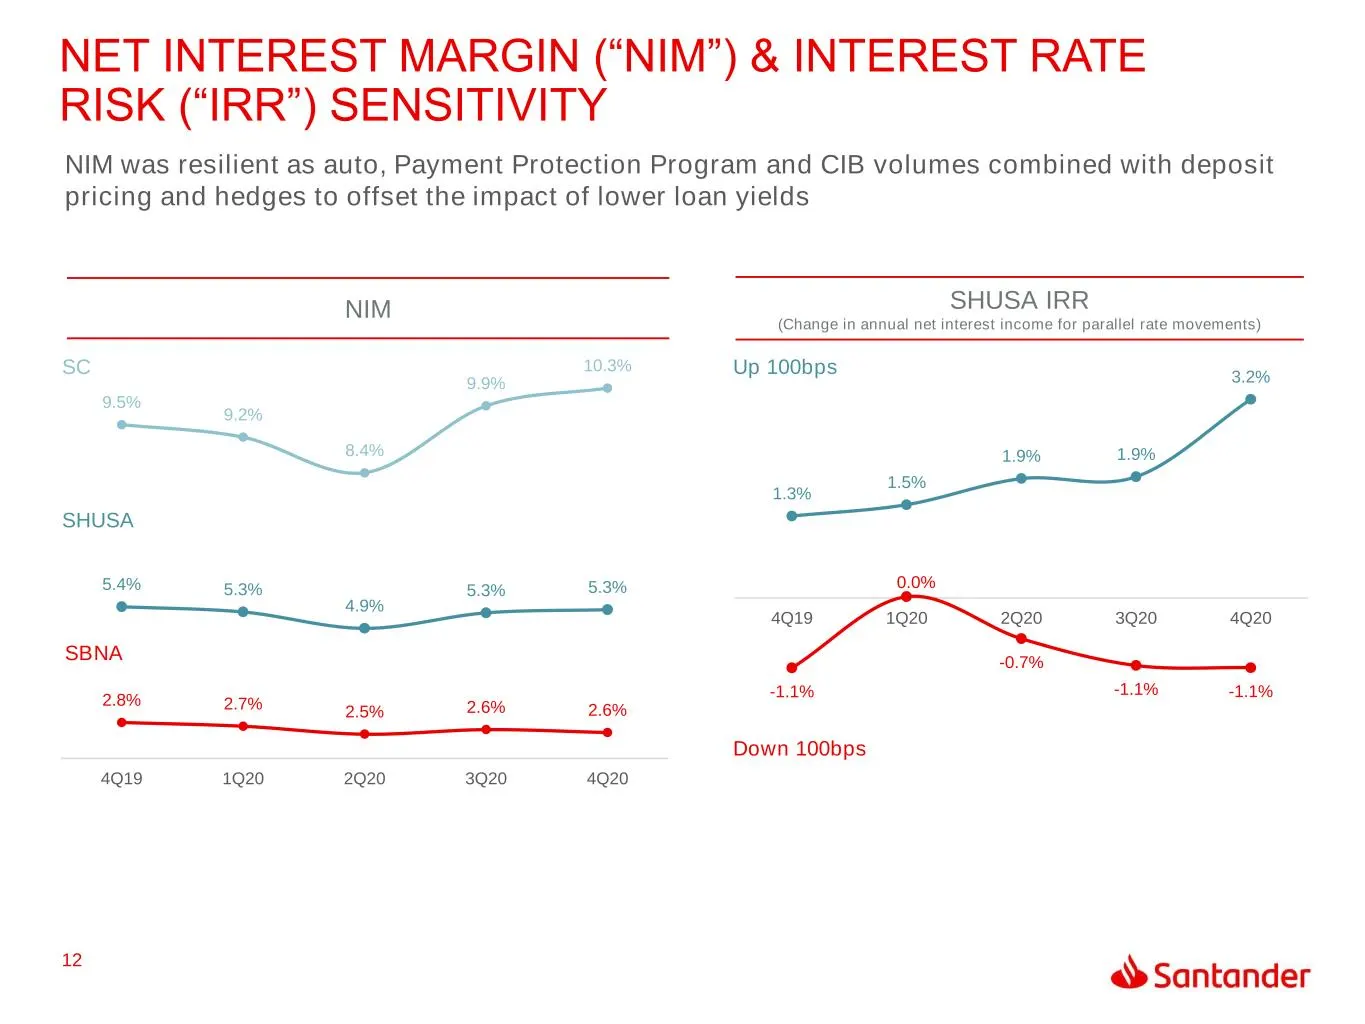
Slide 12: Net Interest Margin & Interest Rate Risk Sensitivity
12 5.4% 5.3% 4.9% 5.3% 5.3% 9.5% 9.2% 8.4% 9.9% 10.3% 2.8% 2.7% 2.5% 2.6% 2.6% 4Q19 1Q20 2Q20 3Q20 4Q20 -1.1% 0.0% -0.7% -1.1% -1.1% 1.3% 1.5% 1.9% 1.9% 3.2% 4Q19 1Q20 2Q20 3Q20 4Q20 NET INTEREST MARGIN (“NIM”) & INTEREST RATE RISK (“IRR”) SENSITIVITY NIM was resilient as auto, Payment Protection Pr
Slide 13: Balance Sheet Overview
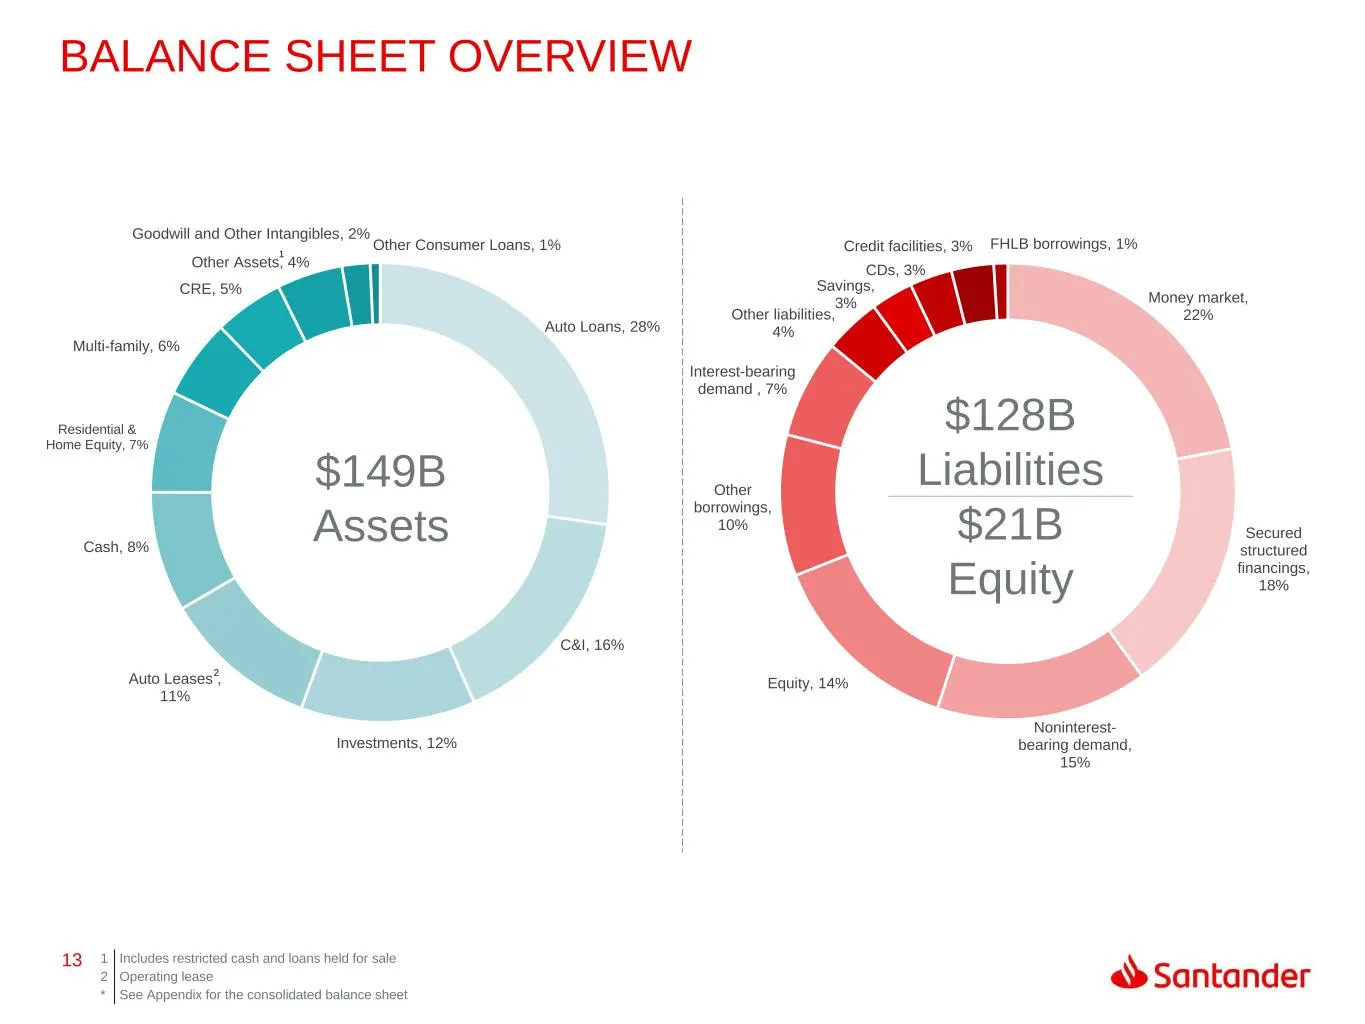
13 Money market, 22% Secured structured financings, 18% Noninterest- bearing demand, 15% Equity, 14% Other borrowings, 10% Interest-bearing demand , 7% Other liabilities, 4% Savings, 3% CDs, 3% Credit facilities, 3% FHLB borrowings, 1% Auto Loans, 28% C&I, 16% Investments, 12% Auto Leases , 11% Cash
Slide 14: Balance Sheet Trends
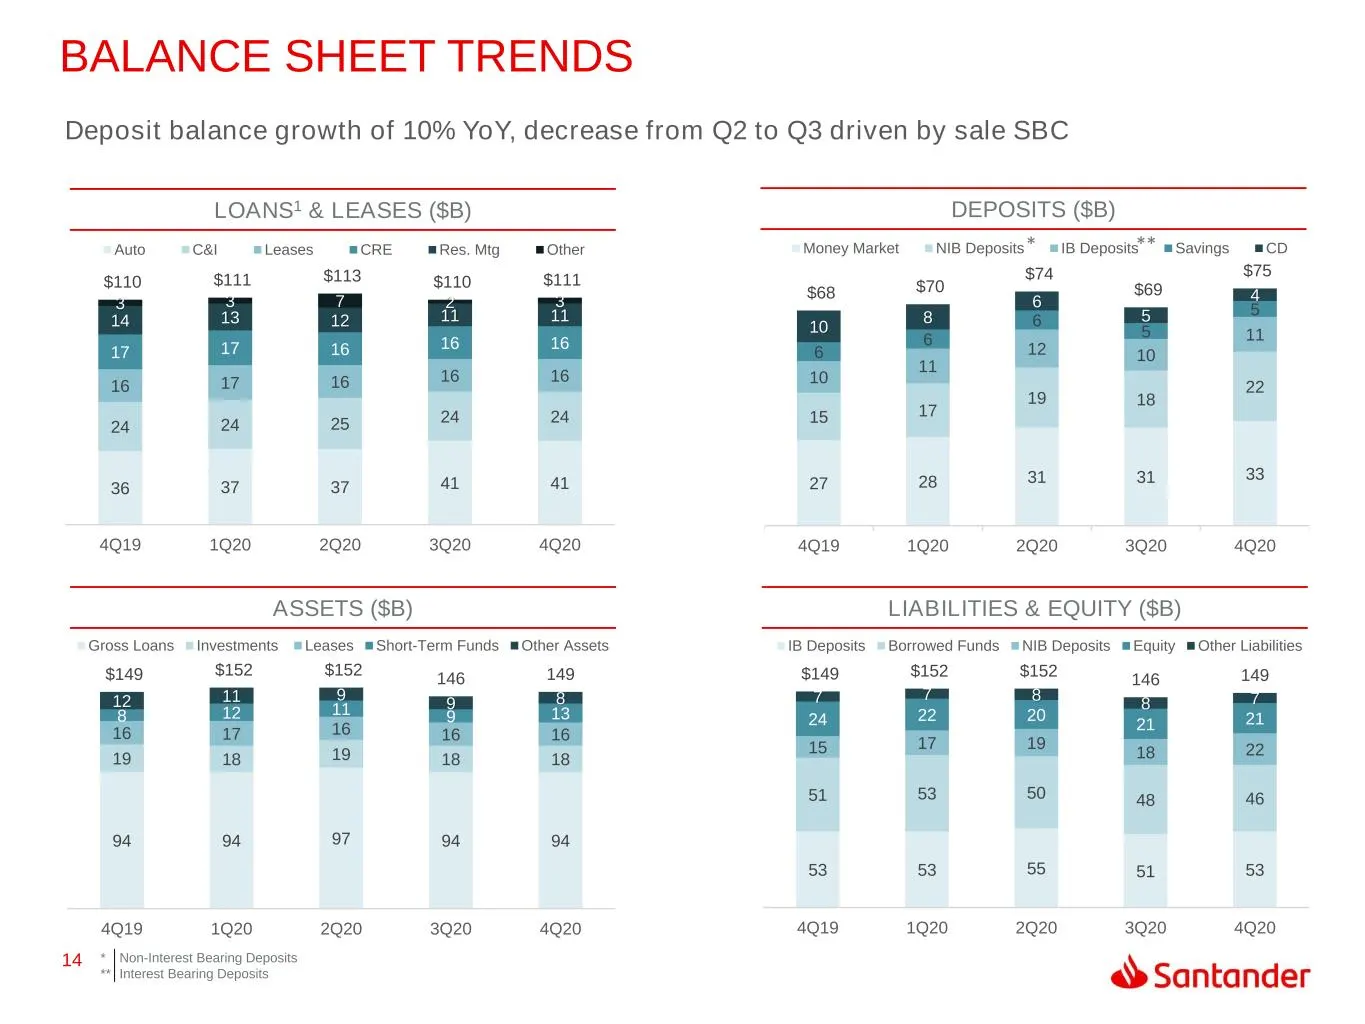
14 27 28 31 31 33 15 17 19 18 22 10 11 12 10 11 6 6 6 5 5 10 8 6 5 4$68 $70 $74 $69 $75 4Q19 1Q20 2Q20 3Q20 4Q20 Money Market NIB Deposits IB Deposits Savings CD 36 37 37 41 41 24 24 25 24 24 16 17 16 16 16 17 17 16 16 16 14 13 12 11 11 3 3 7 2 3 $110 $111 $113 $110 $111 4Q19 1Q20 2Q20 3Q20 4Q20 Aut
Slide 15: Borrowed Funds Profile
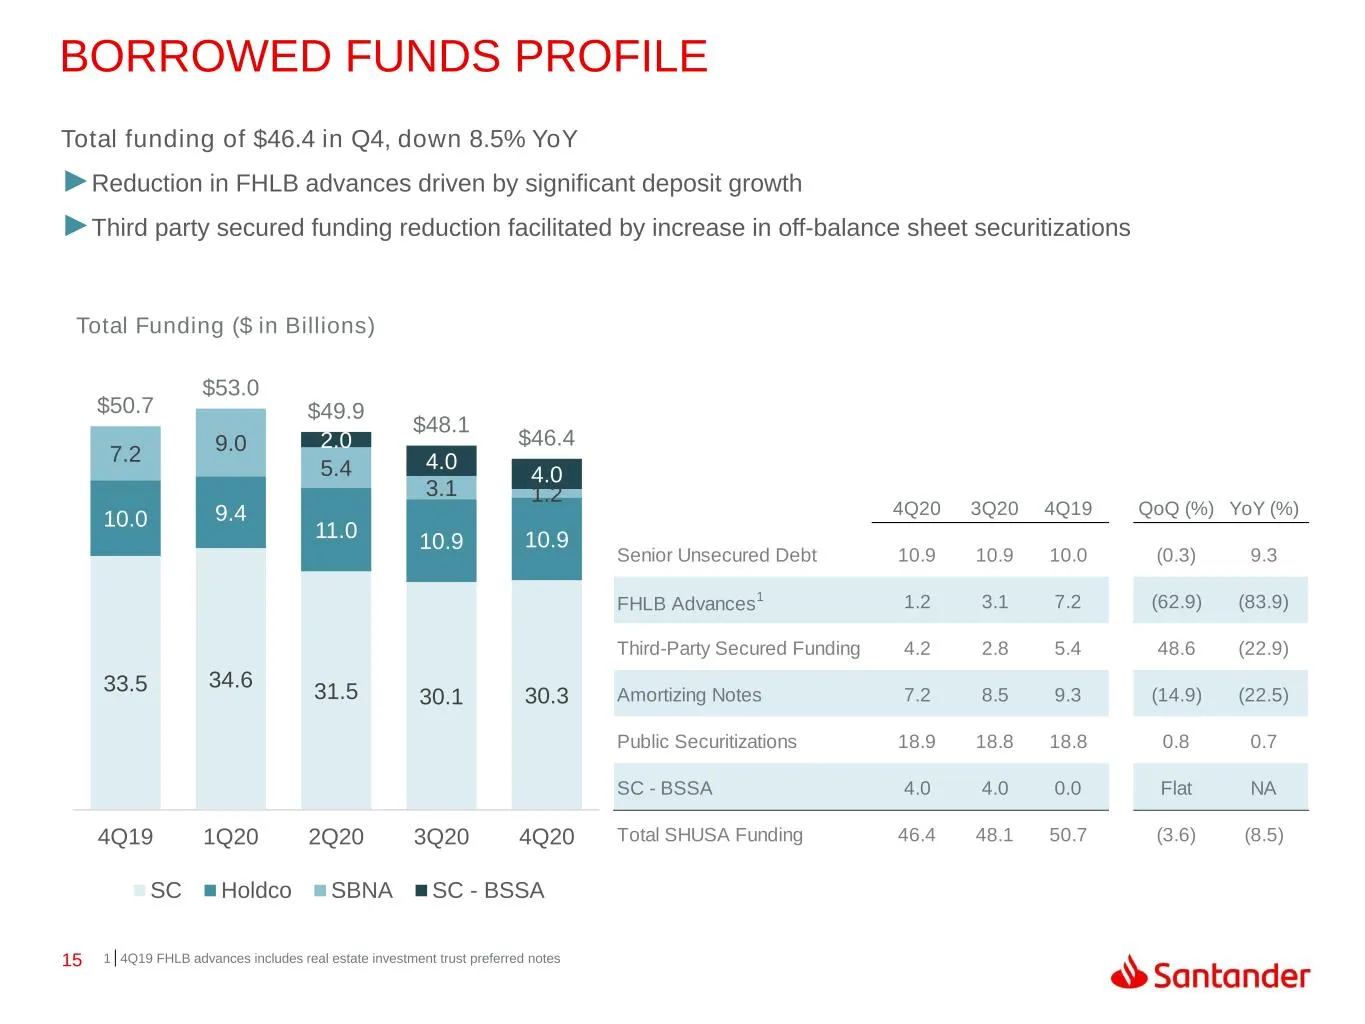
15 4Q20 3Q20 4Q19 QoQ (%) YoY (%) Senior Unsecured Debt 10.9 10.9 10.0 (0.3) 9.3 FHLB Advances 1 1.2 3.1 7.2 (62.9) (83.9) Third-Party Secured Funding 4.2 2.8 5.4 48.6 (22.9) Amortizing Notes 7.2 8.5 9.3 (14.9) (22.5) Public Securitizations 18.9 18.8 18.8 0.8 0.7 SC - BSSA 4.0 4.0 0.0 Flat NA Total
Slide 16: SHUSA Debt & TLAC
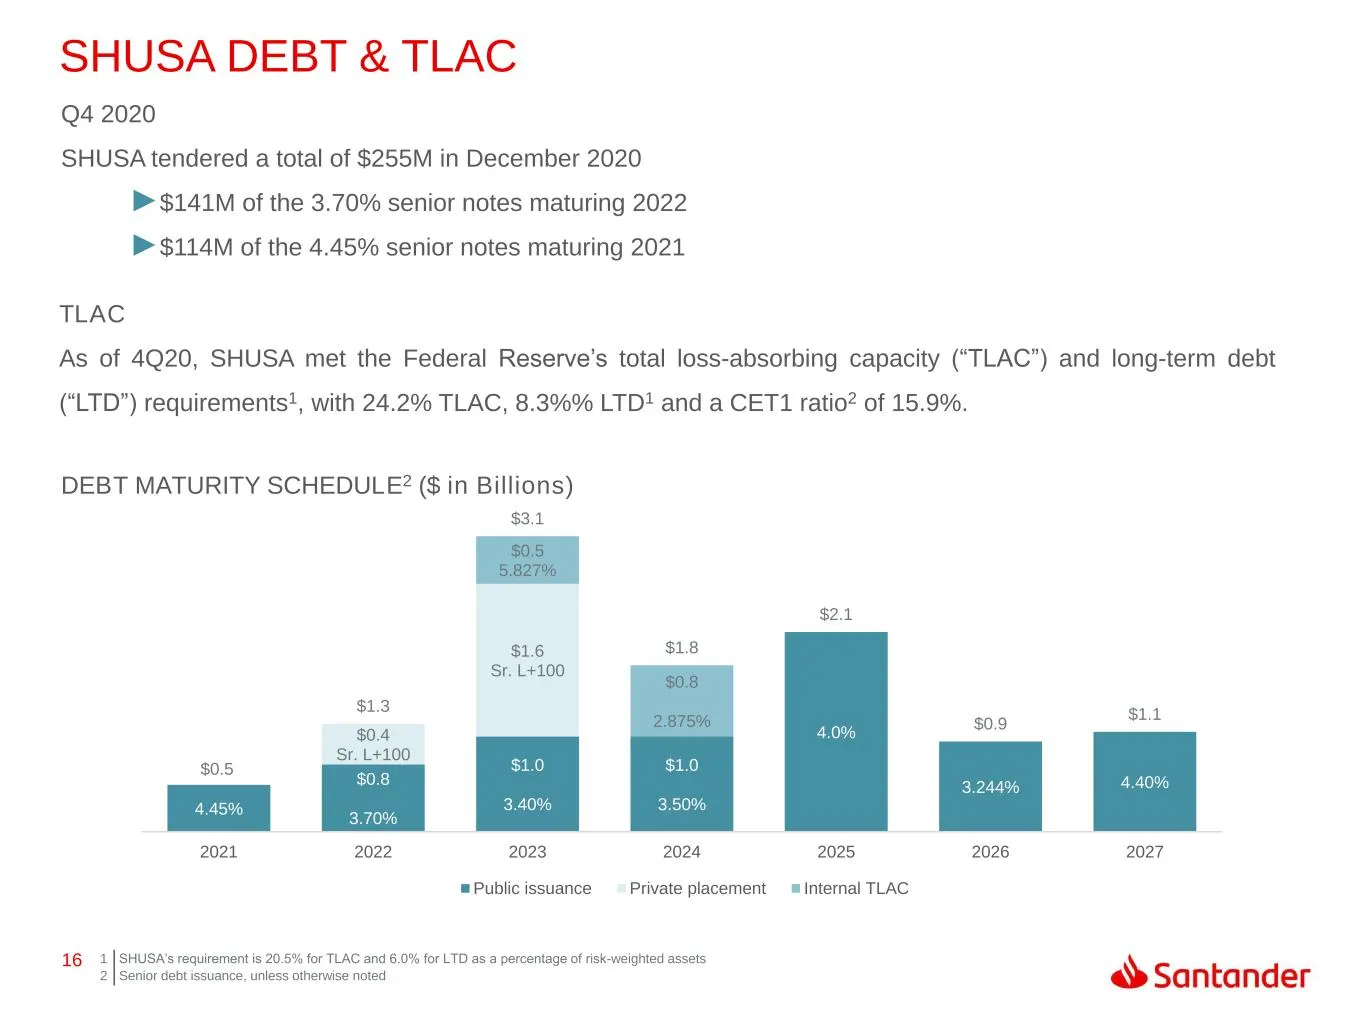
16 4.45% $0.8 3.70% $1.0 3.40% $1.0 3.50% 4.0% 3.244% 4.40% $0.4 Sr. L+100 $1.6 Sr. L+100 $0.5 5.827% $0.8 2.875% $0.5 $1.3 $3.1 $1.8 $2.1 $0.9 $1.1 2021 2022 2023 2024 2025 2026 2027 Public issuance Private placement Internal TLAC SHUSA DEBT & TLAC Q4 2020 SHUSA tendered a total of $255M in Decembe
Slide 17: Capital Ratios
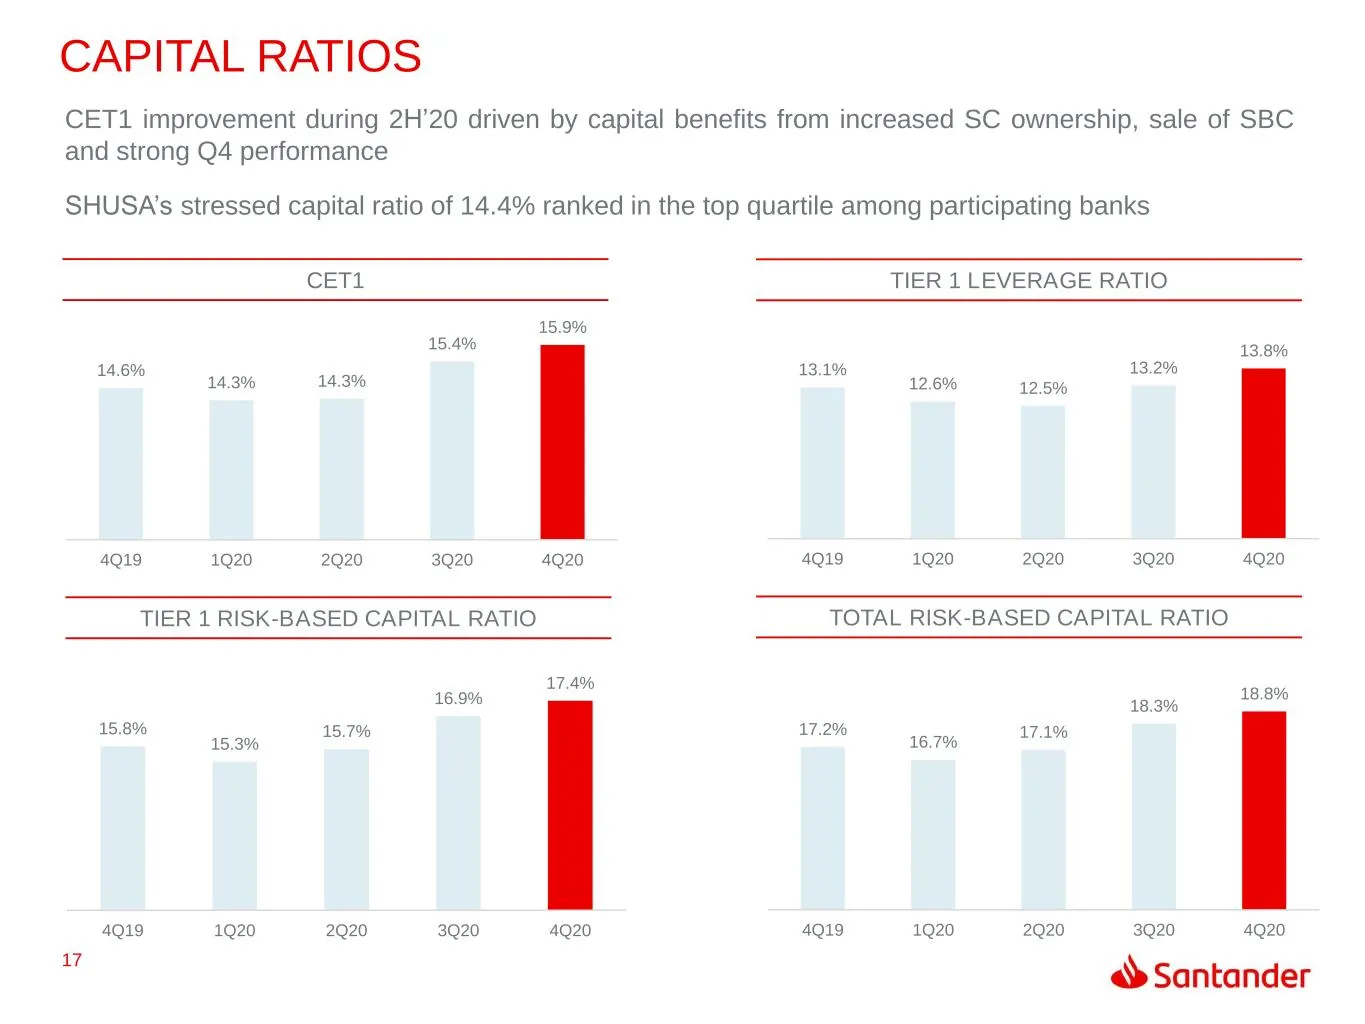
17 15.8% 15.3% 15.7% 16.9% 17.4% 4Q19 1Q20 2Q20 3Q20 4Q20 13.1% 12.6% 12.5% 13.2% 13.8% 4Q19 1Q20 2Q20 3Q20 4Q20 17.2% 16.7% 17.1% 18.3% 18.8% 4Q19 1Q20 2Q20 3Q20 4Q20 14.6% 14.3% 14.3% 15.4% 15.9% 4Q19 1Q20 2Q20 3Q20 4Q20 CAPITAL RATIOS CET1 TIER 1 RISK-BASED CAPITAL RATIO TOTAL RISK-BASED CAPITAL
Slide 18: SBNA Asset Quality
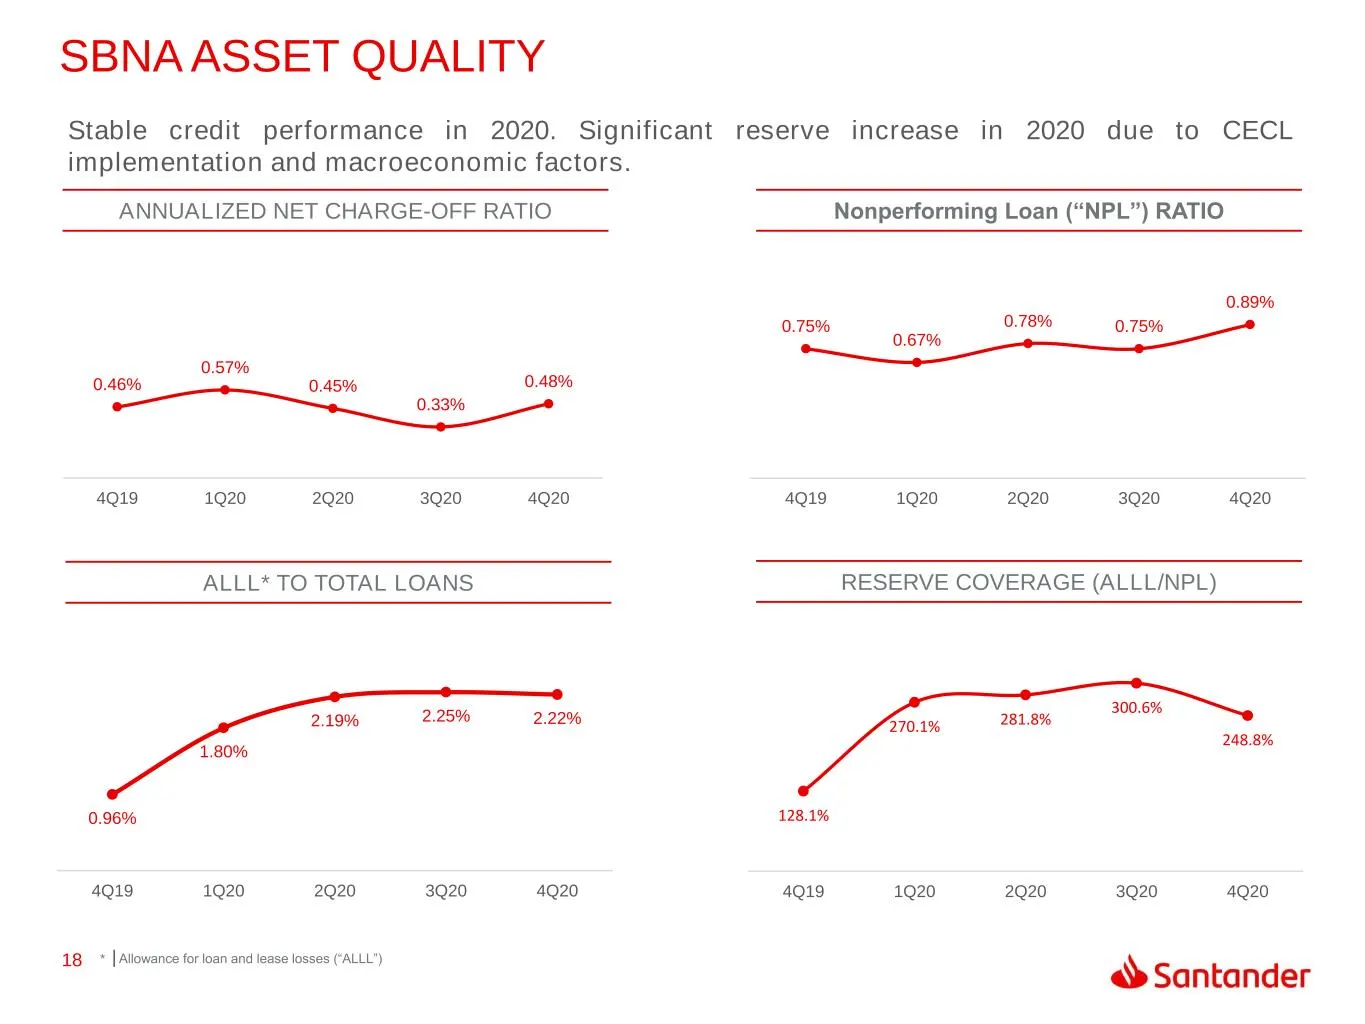
18 128.1% 270.1% 281.8% 300.6% 248.8% 4Q19 1Q20 2Q20 3Q20 4Q20 0.96% 1.80% 2.19% 2.25% 2.22% 4Q19 1Q20 2Q20 3Q20 4Q20 0.75% 0.67% 0.78% 0.75% 0.89% 4Q19 1Q20 2Q20 3Q20 4Q20 0.46% 0.57% 0.45% 0.33% 0.48% 4Q19 1Q20 2Q20 3Q20 4Q20 SBNA ASSET QUALITY Stable credit performance in 2020. Significant reserv
Slide 19: SC Auto Originations
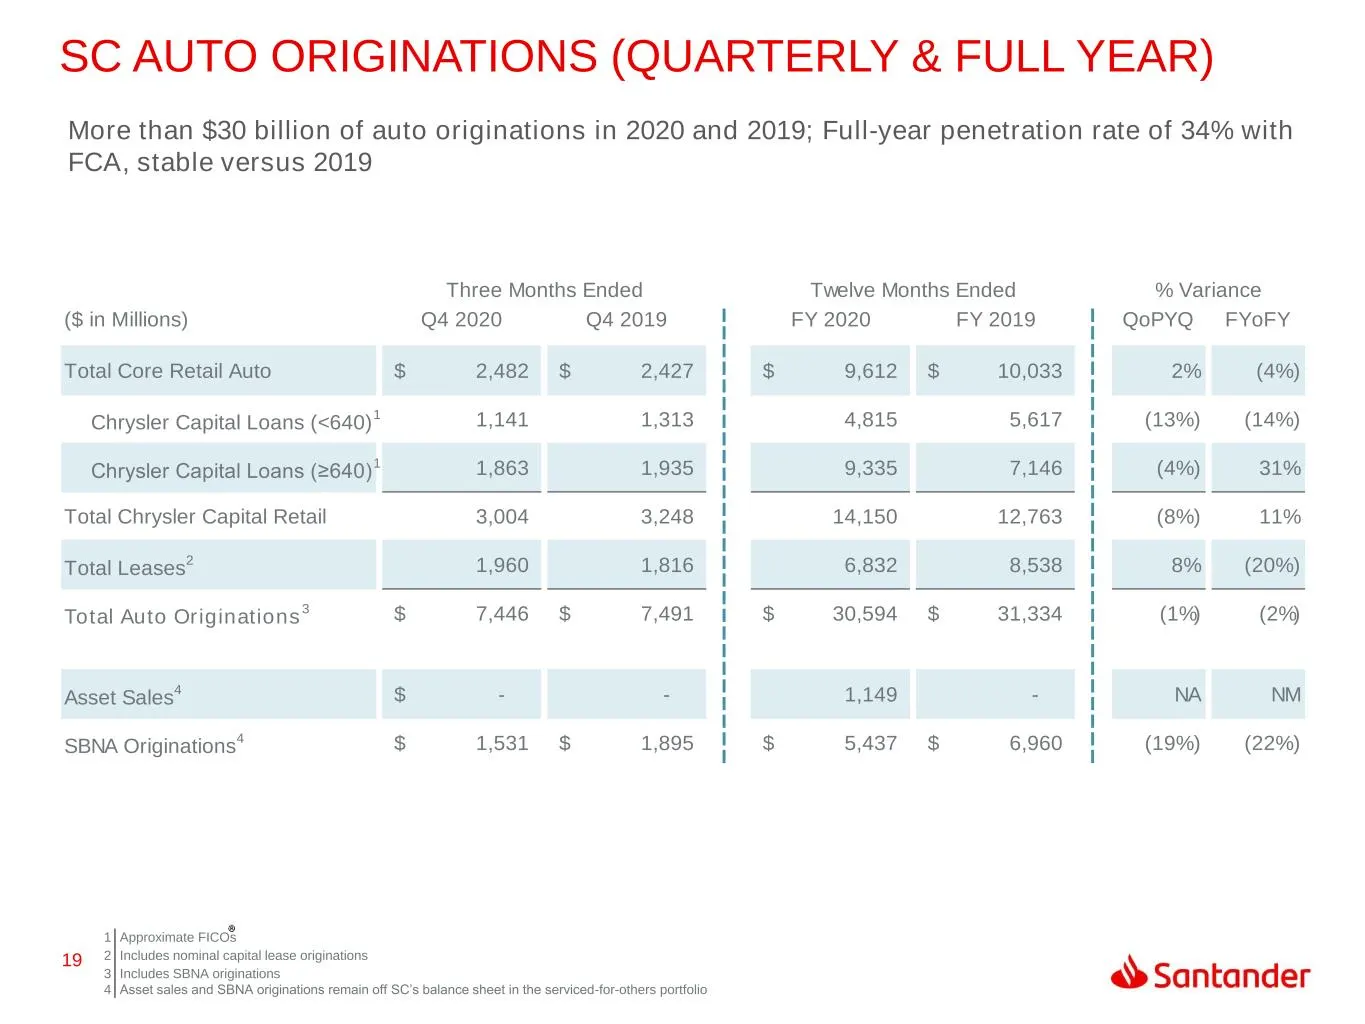
19 SC AUTO ORIGINATIONS (QUARTERLY & FULL YEAR) 1 Approximate FICOs 2 Includes nominal capital lease originations 3 4 Includes SBNA originations Asset sales and SBNA originations remain off SC’s balance sheet in the serviced-for-others portfolio Three Months Ended Twelve Months Ended ($ in Millions)
Slide 20: SC Delinquency and Loss
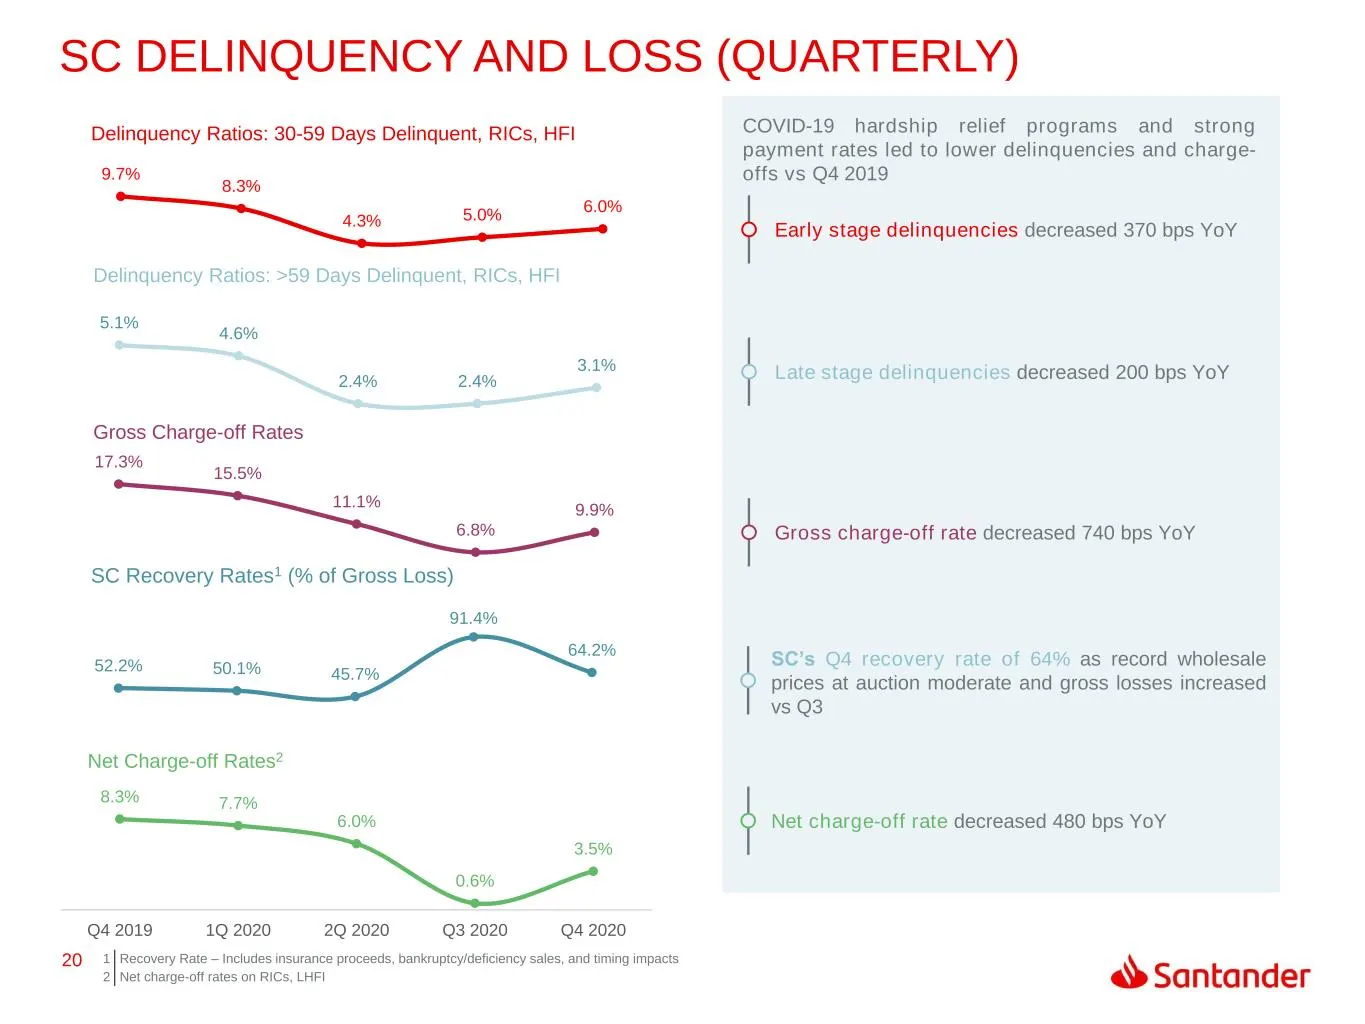
20 1 Recovery Rate – Includes insurance proceeds, bankruptcy/deficiency sales, and timing impacts 2 Net charge-off rates on RICs, LHFI SC DELINQUENCY AND LOSS (QUARTERLY) SC Recovery Rates1 (% of Gross Loss) Net Charge-off Rates2 Delinquency Ratios: 30-59 Days Delinquent, RICs, HFI Delinquency Ratio
Slide 21: Rating Agencies
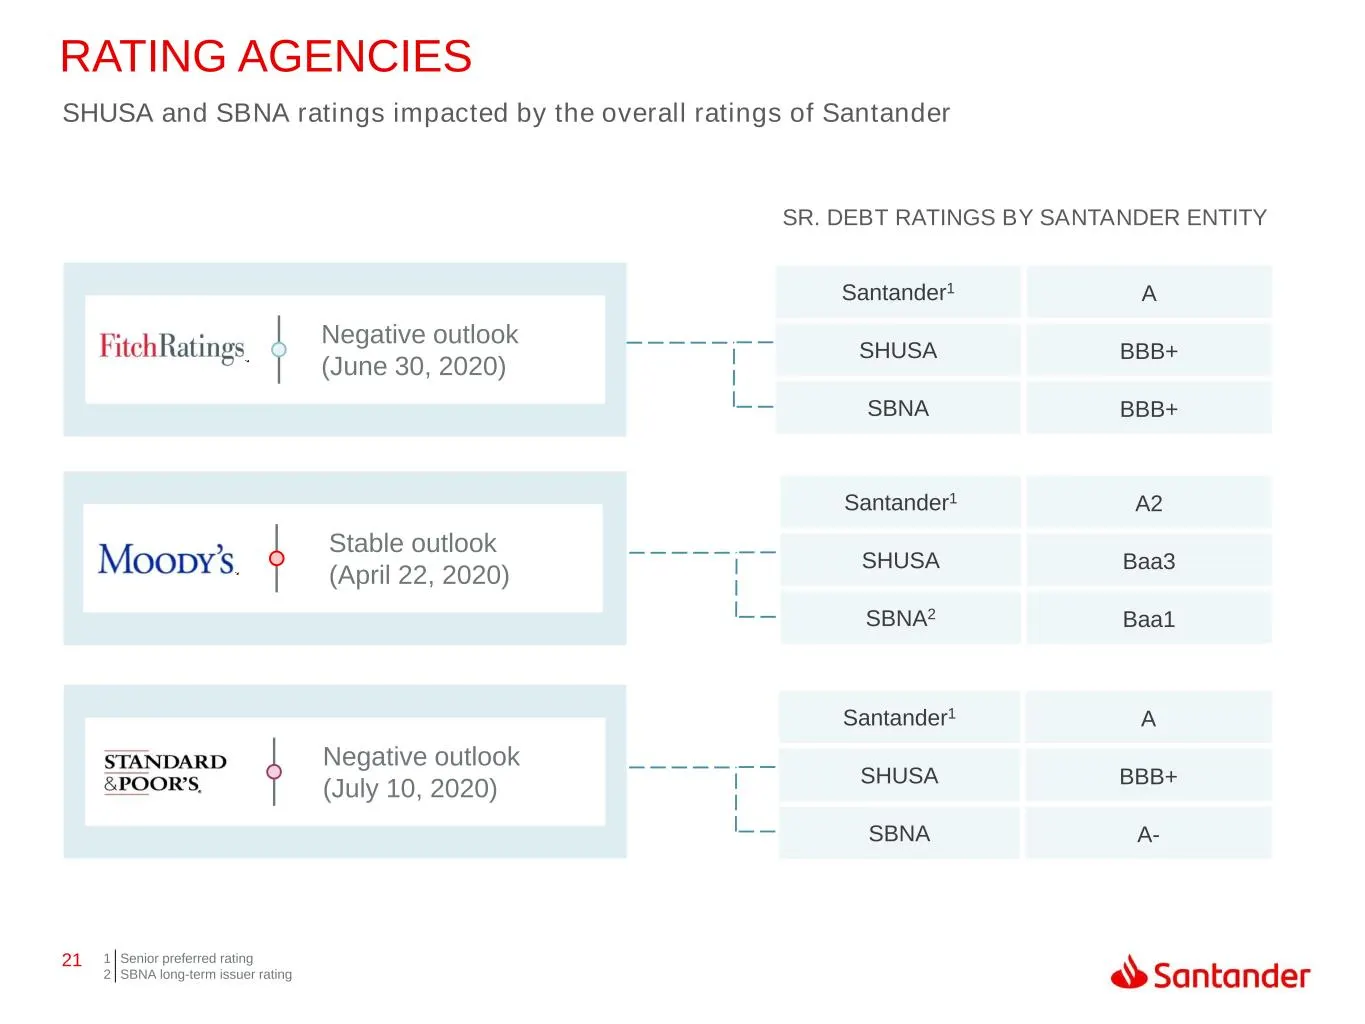
21 Santander1 A2 SHUSA Baa3 SBNA2 Baa1 Santander1 A SHUSA BBB+ SBNA A- RATING AGENCIES Negative outlook (June 30, 2020) SHUSA and SBNA ratings impacted by the overall ratings of Santander SR. DEBT RATINGS BY SANTANDER ENTITY Santander1 A SHUSA BBB+ SBNA BBB+ Stable outlook (April 22, 2020) Negative
Slide 22: Appendix
APPENDIX «Santander
Slide 23: Consolidating Income Statement – FY 2020
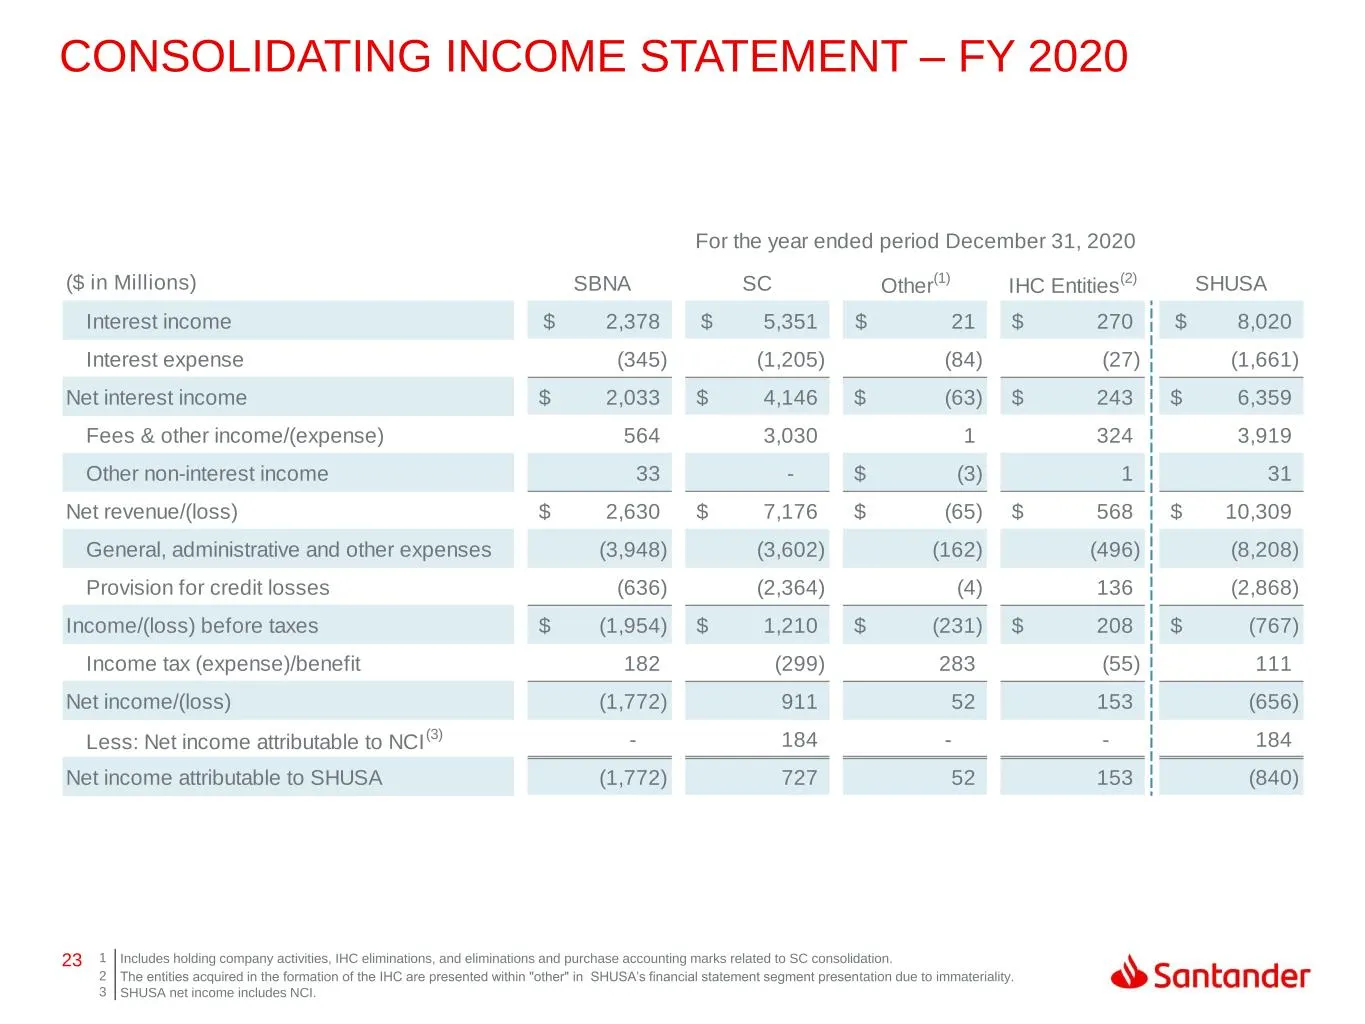
23 CONSOLIDATING INCOME STATEMENT – FY 2020 1 Includes holding company activities, IHC eliminations, and eliminations and purchase accounting marks related to SC consolidation. 2 3 The entities acquired in the formation of the IHC are presented within "other" in SHUSA’s financial statement segment p
Slide 24: Consolidating Income Statement – 4Q 2020
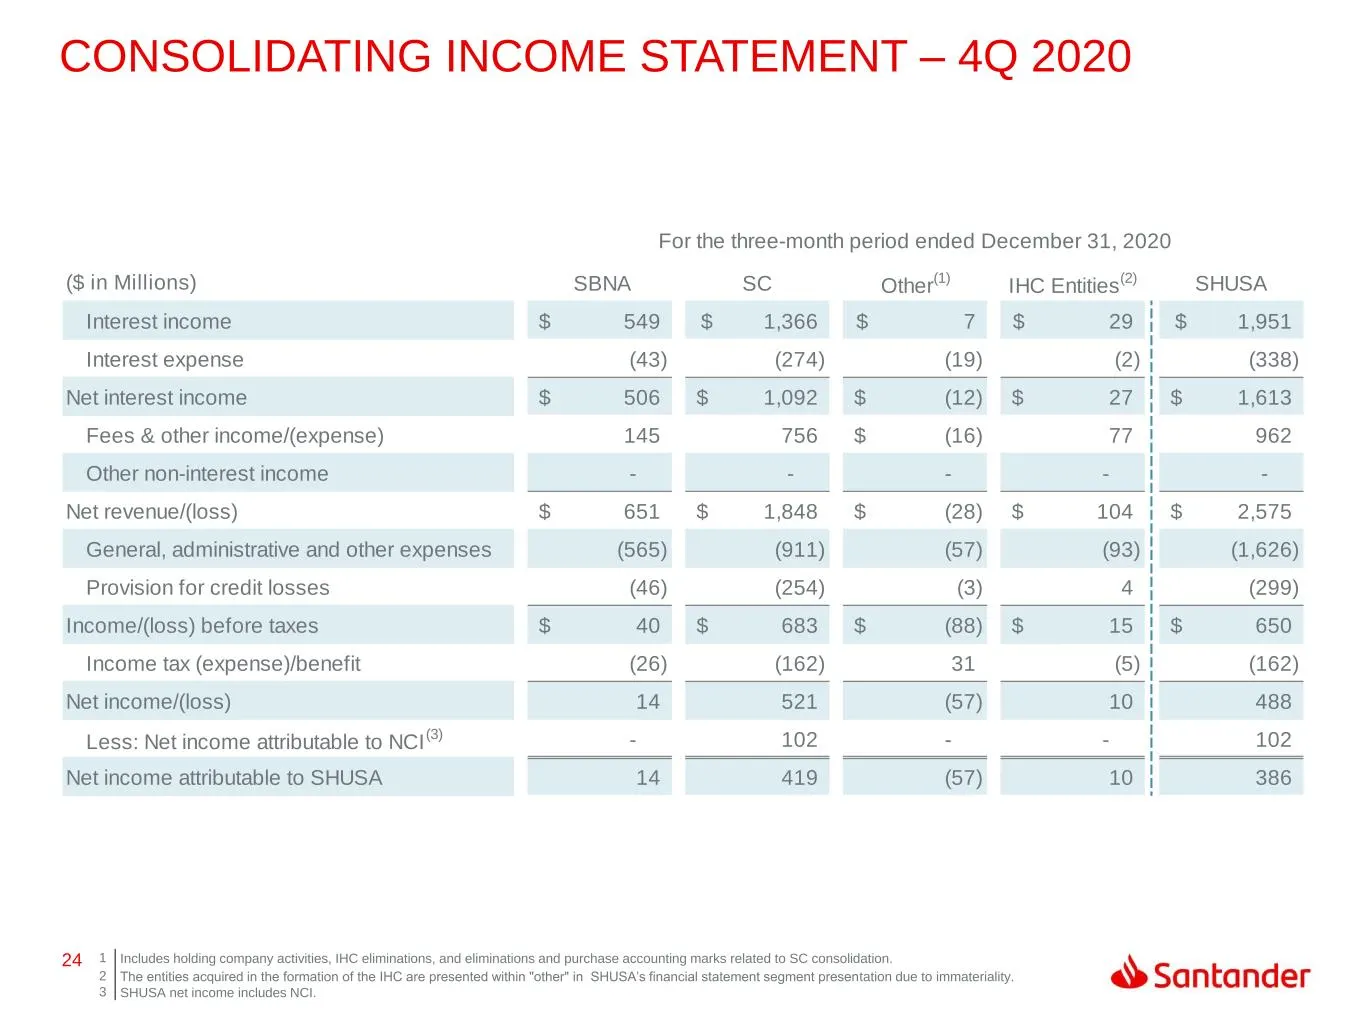
24 CONSOLIDATING INCOME STATEMENT – 4Q 2020 1 Includes holding company activities, IHC eliminations, and eliminations and purchase accounting marks related to SC consolidation. 2 3 The entities acquired in the formation of the IHC are presented within "other" in SHUSA’s financial statement segment p
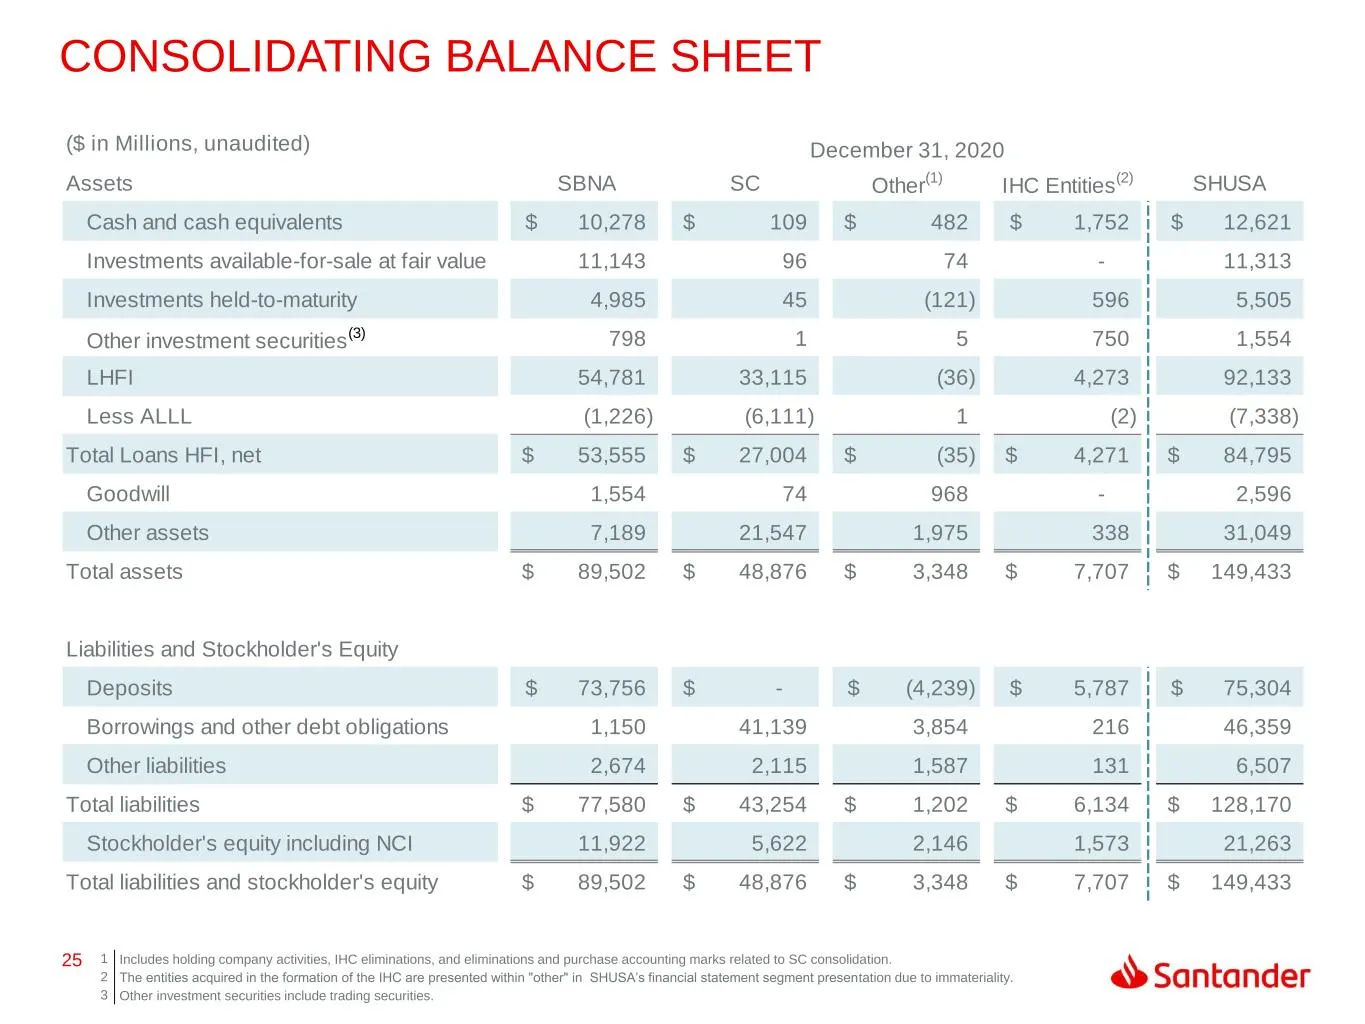
Slide 25: Consolidating Balance Sheet
25 CONSOLIDATING BALANCE SHEET 1 Includes holding company activities, IHC eliminations, and eliminations and purchase accounting marks related to SC consolidation. 2 The entities acquired in the formation of the IHC are presented within "other" in SHUSA’s financial statement segment presentation due
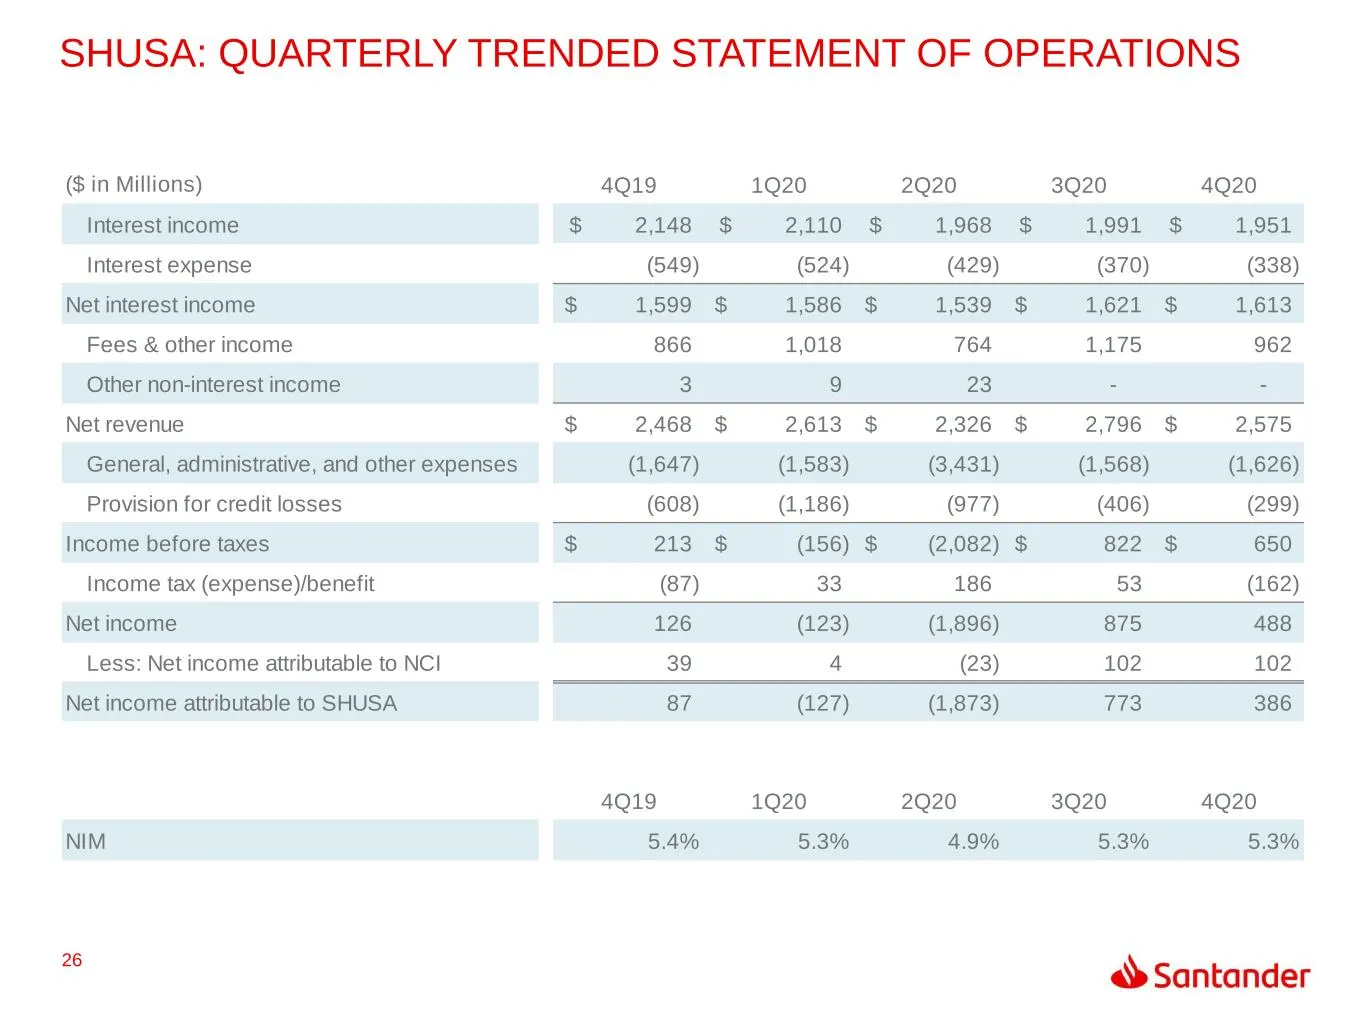
Slide 26: SHUSA: Quarterly Trended Statement of Operations
26 SHUSA: QUARTERLY TRENDED STATEMENT OF OPERATIONS ($ in Millions) 4Q19 1Q20 2Q20 3Q20 4Q20 Interest income 2,148$ 2,110$ 1,968$ 1,991$ 1,951$ Interest expense (549) (524) (429) (370) (338) Net interest income 1,599$ 1,586$ 1,539$ 1,621$ 1,613$ Fees & other income 866 1,018 764 1,175 962 Other non-
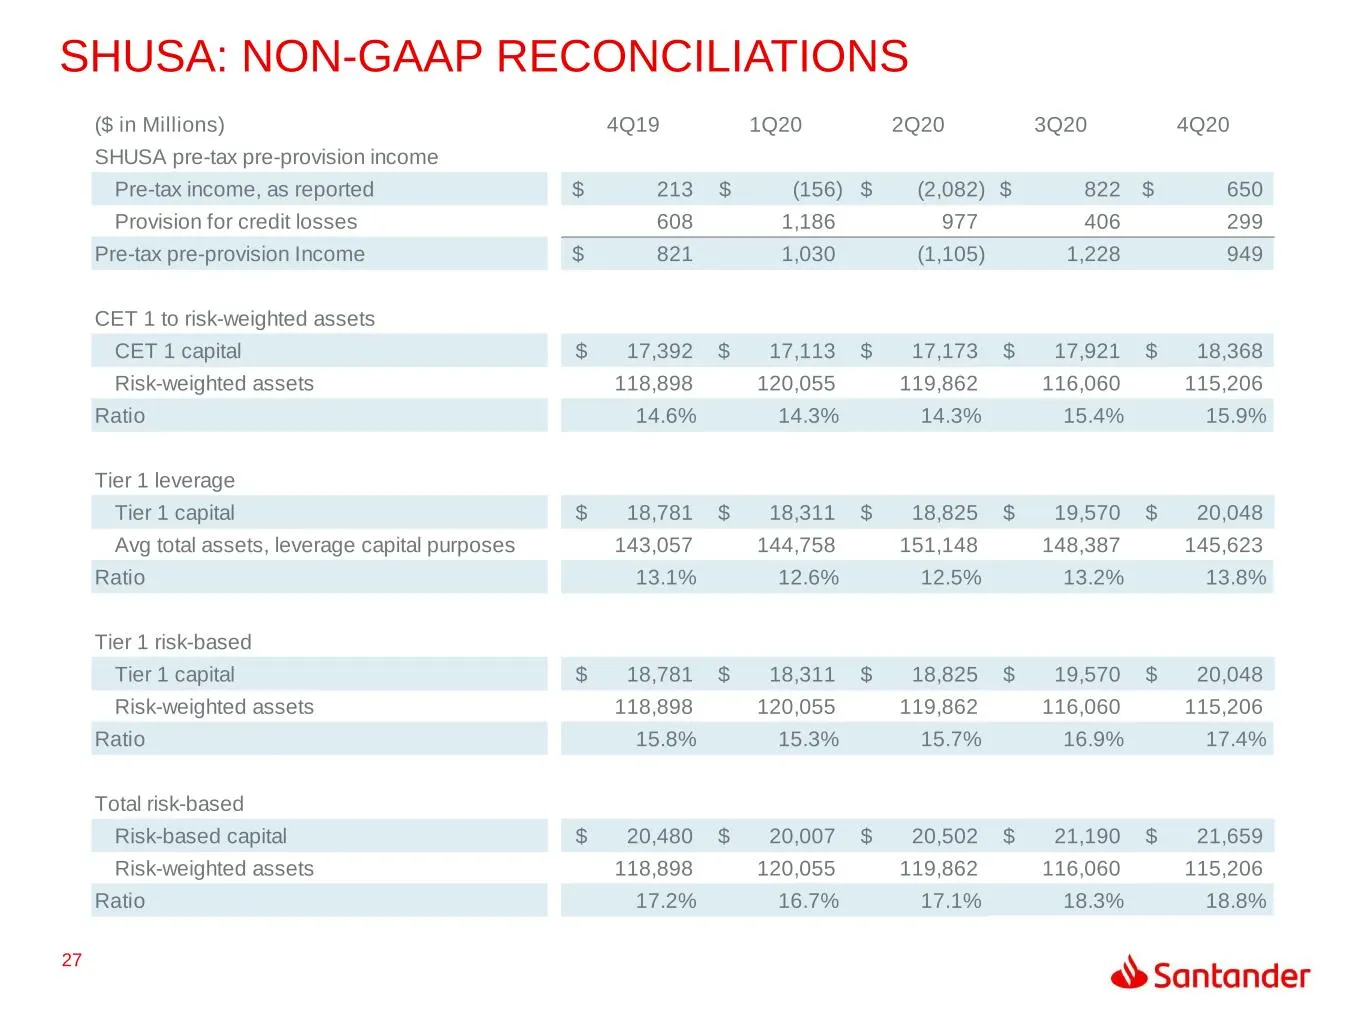
Slide 27: SHUSA: Non-GAAP Reconciliations
27 SHUSA: NON-GAAP RECONCILIATIONS ($ in Millions) 4Q19 1Q20 2Q20 3Q20 4Q20 SHUSA pre-tax pre-provision income Pre-tax income, as reported 213$ (156)$ (2,082)$ 822$ 650$ Provision for credit losses 608 1,186 977 406 299 Pre-tax pre-provision Income 821$ 1,030 (1,105) 1,228 949 CET 1 to risk-weighted
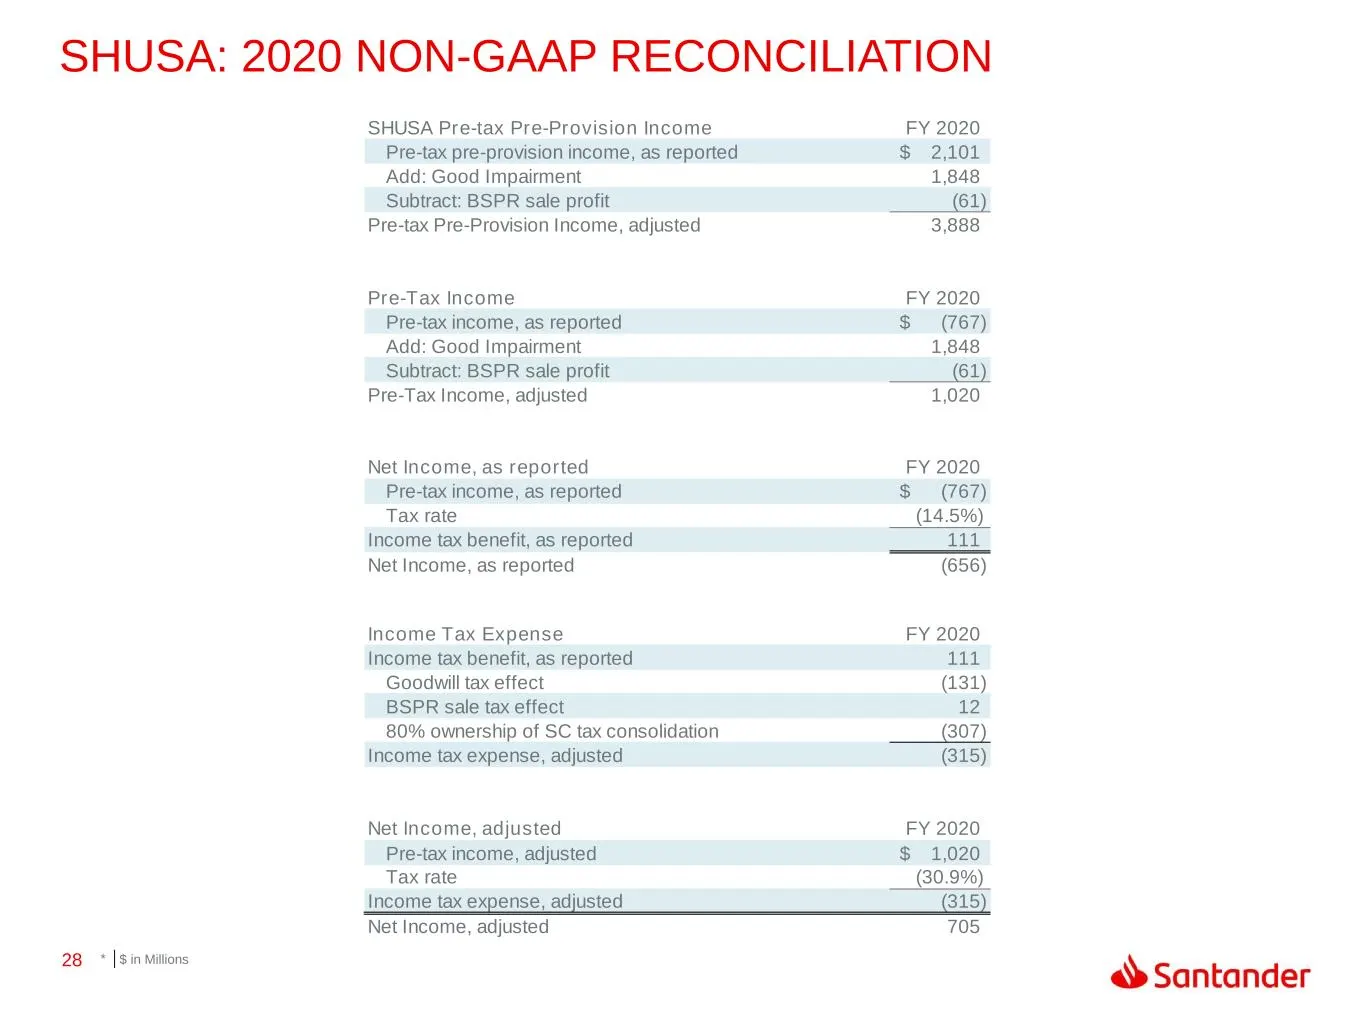
Slide 28: SHUSA: 2020 Non-GAAP Reconciliation
28 SHUSA: 2020 NON-GAAP RECONCILIATION SHUSA Pre-tax Pre-Provision Income FY 2020 Pre-tax pre-provision income, as reported 2,101$ Add: Good Impairment 1,848 Subtract: BSPR sale profit (61) Pre-tax Pre-Provision Income, adjusted 3,888 Pre-Tax Income FY 2020 Pre-tax income, as reported (767)$ Add: Go
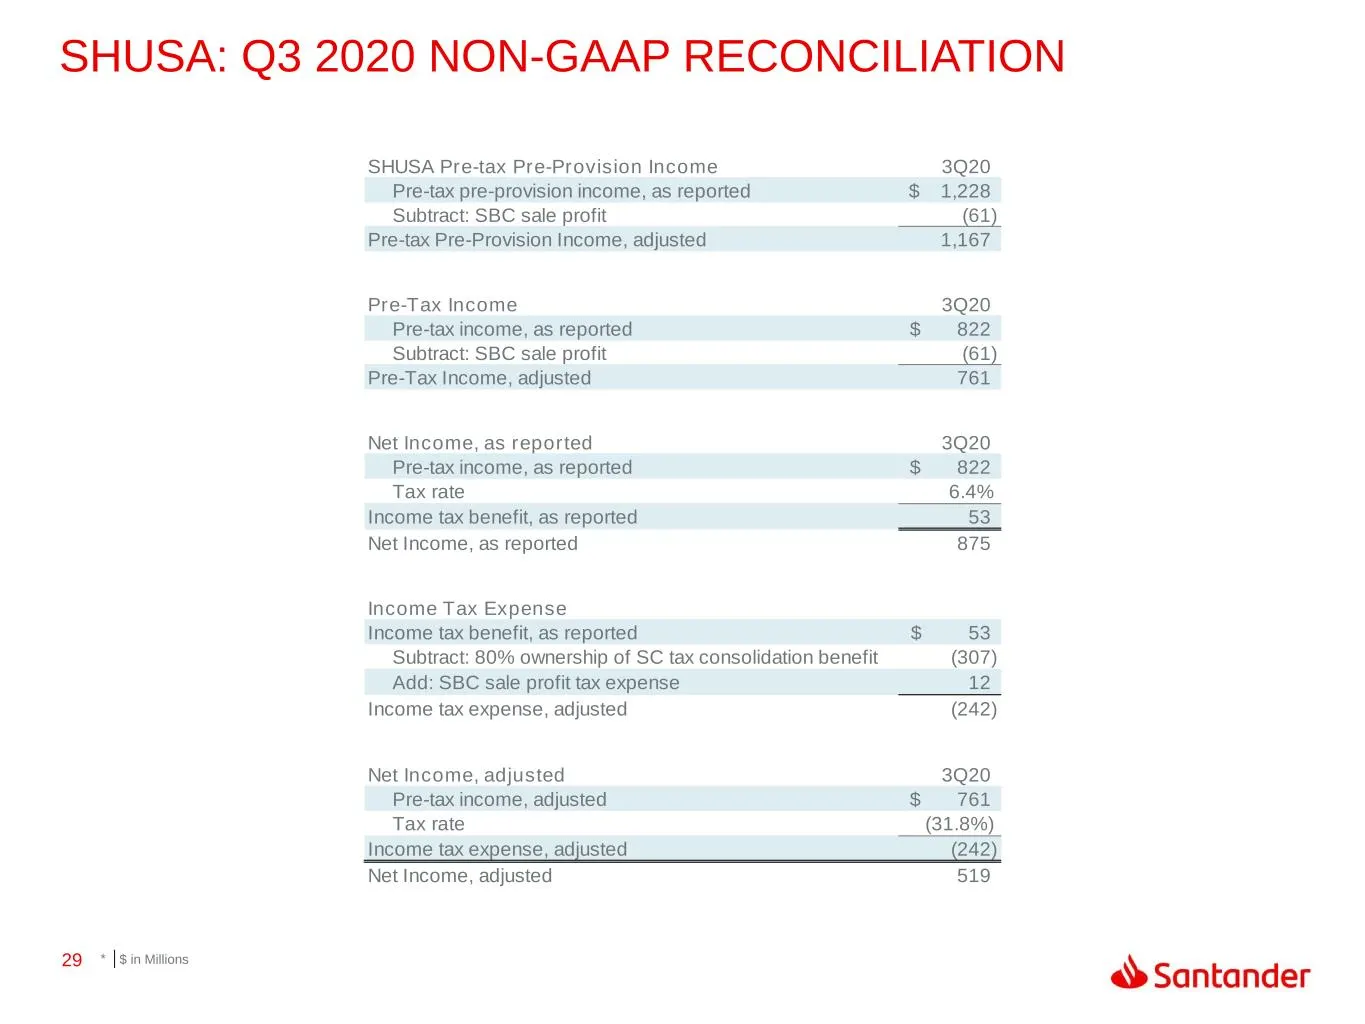
Slide 29: SHUSA: Q3 2020 Non-GAAP Reconciliation
29 SHUSA: Q3 2020 NON-GAAP RECONCILIATION SHUSA Pre-tax Pre-Provision Income 3Q20 Pre-tax pre-provision income, as reported 1,228$ Subtract: SBC sale profit (61) Pre-tax Pre-Provision Income, adjusted 1,167 Pre-Tax Income 3Q20 Pre-tax income, as reported 822$ Subtract: SBC sale profit (61) Pre-Tax I
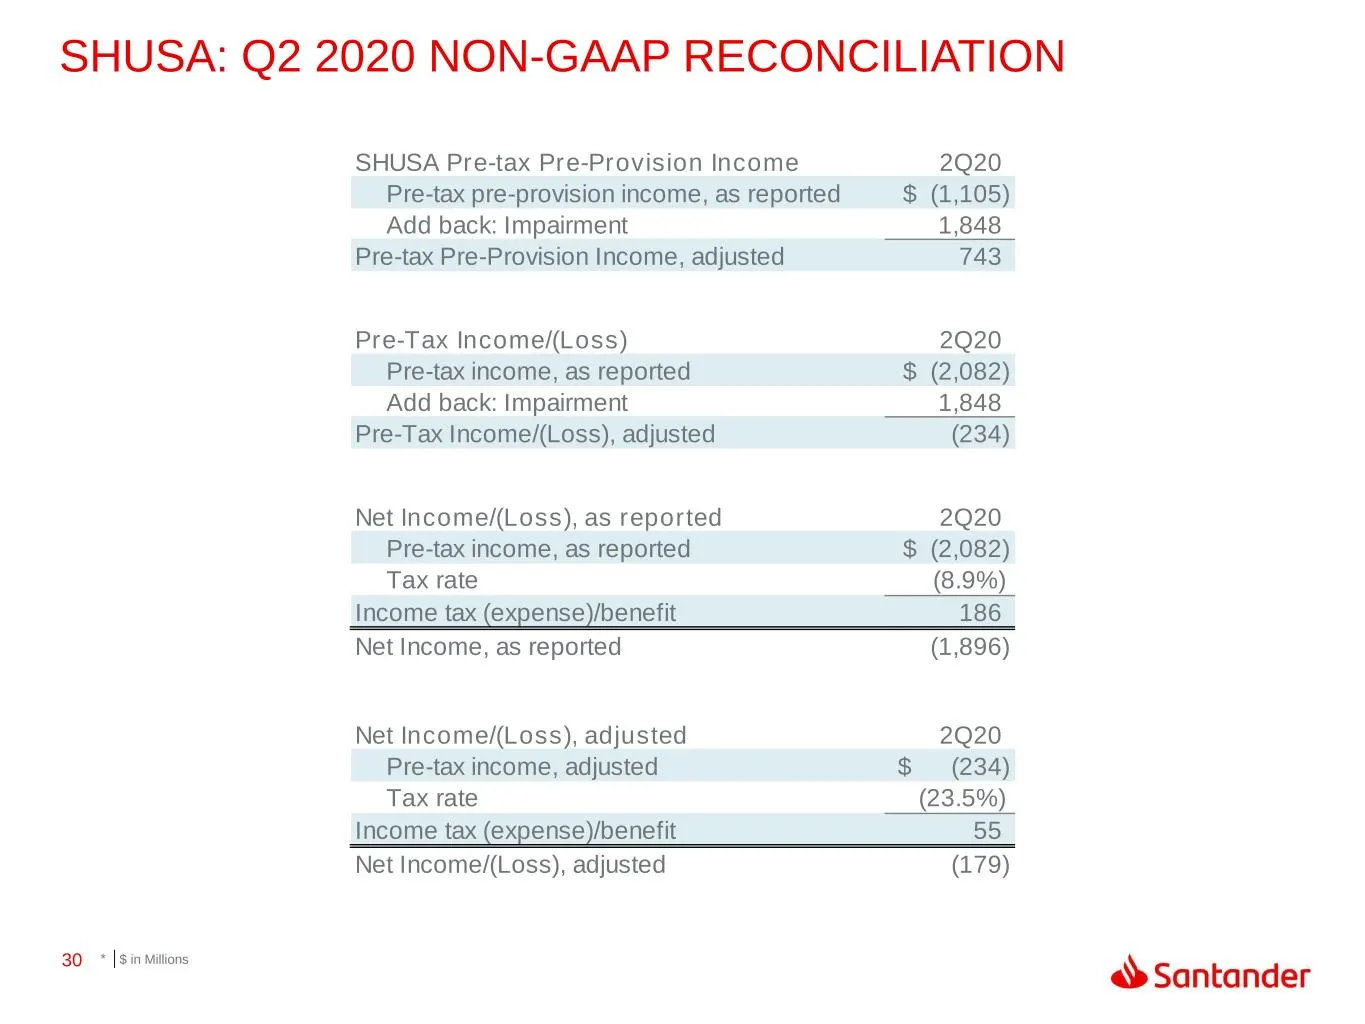
Slide 30: SHUSA: Q2 2020 Non-GAAP Reconciliation
30 SHUSA: Q2 2020 NON-GAAP RECONCILIATION SHUSA Pre-tax Pre-Provision Income 2Q20 Pre-tax pre-provision income, as reported (1,105)$ Add back: Impairment 1,848 Pre-tax Pre-Provision Income, adjusted 743 Pre-Tax Income/(Loss) 2Q20 Pre-tax income, as reported (2,082)$ Add back: Impairment 1,848 Pre-Ta
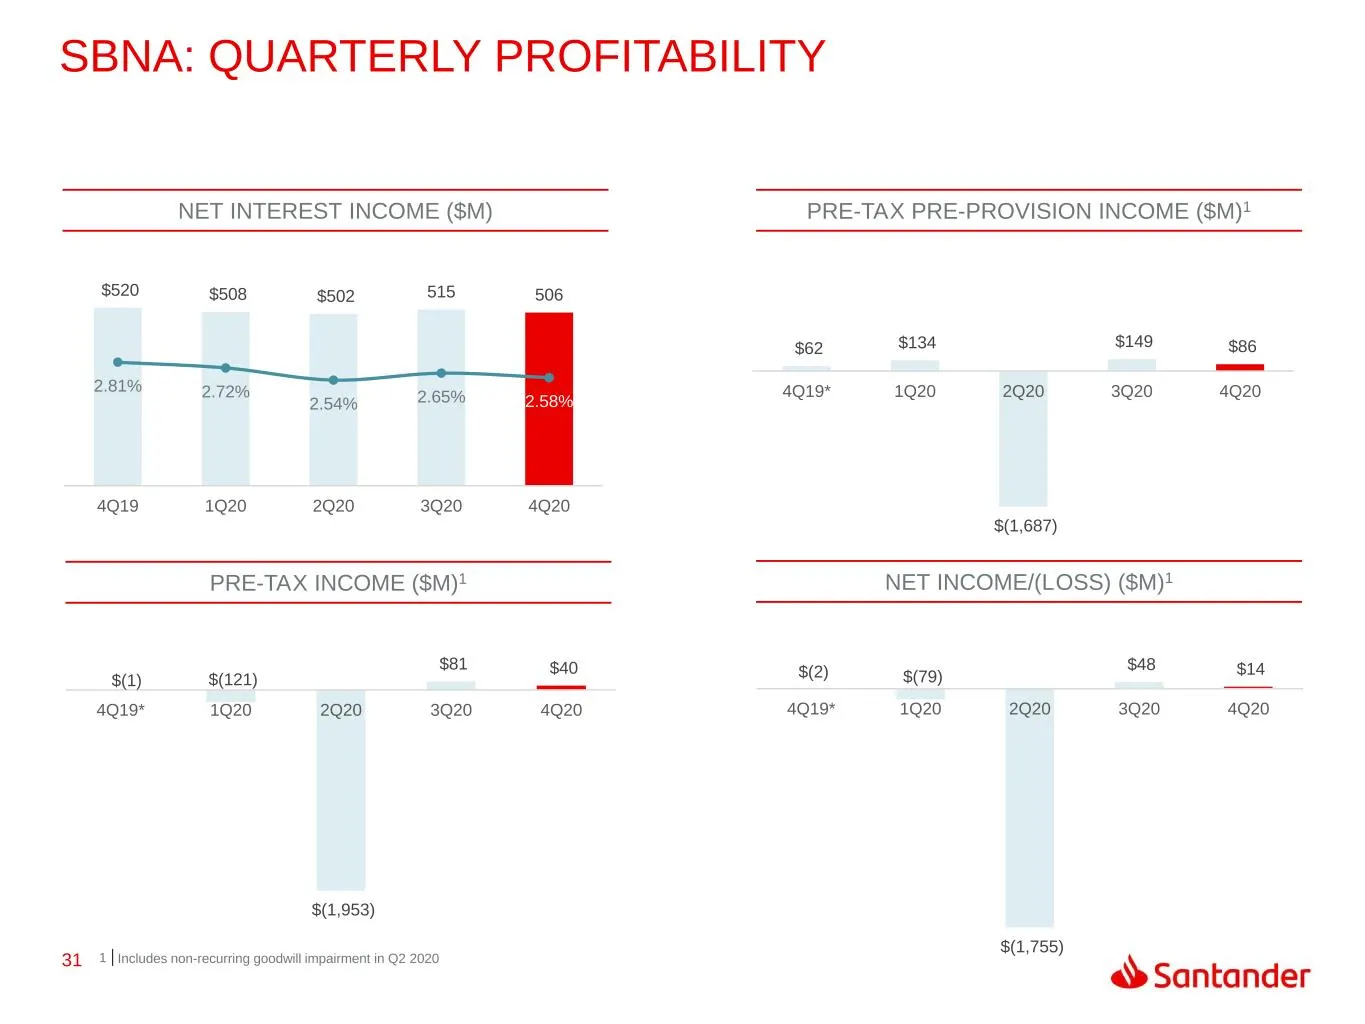
Slide 31: SBNA: Quarterly Profitability
31 $62 $134 $(1,687) $149 $86 4Q19* 1Q20 2Q20 3Q20 4Q20 $520 $508 $502 515 506 2.81% 2.72% 2.54% 2.65% 2.58% 1.00% 1.50% 2.00% 2.50% 3.00% 3.50% 4.00% $- $100 $200 $300 $400 $500 $600 4Q19 1Q20 2Q20 3Q20 4Q20 $(1) $(121) $(1,953) $81 $40 4Q19* 1Q20 2Q20 3Q20 4Q20 $(2) $(79) $(1,755) $48 $14 4Q19* 1Q
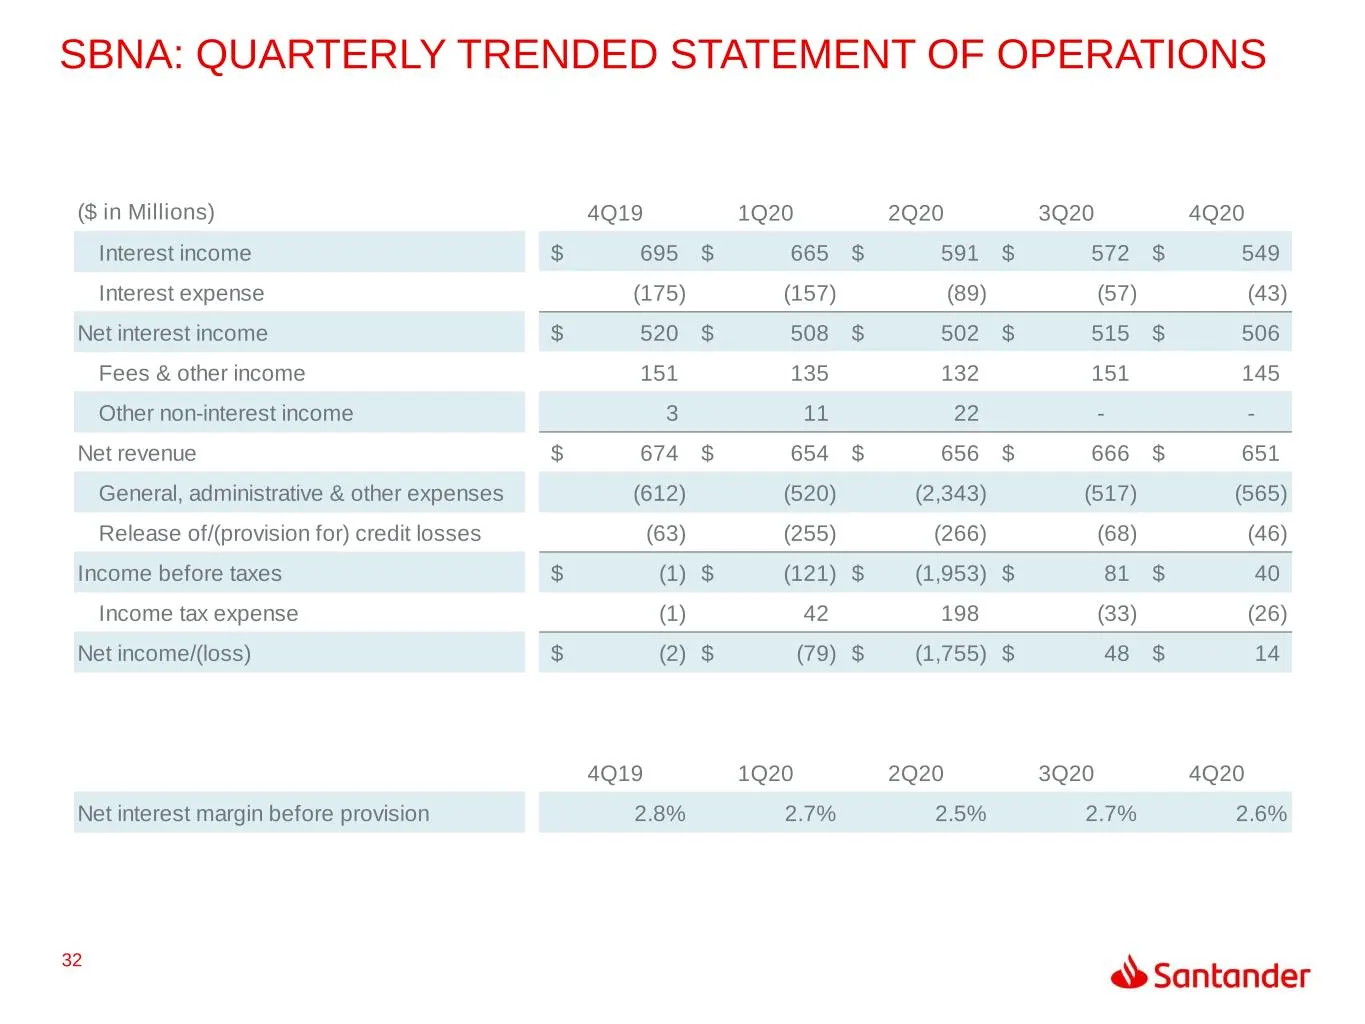
Slide 32: SBNA: Quarterly Trended Statement of Operations
32 SBNA: QUARTERLY TRENDED STATEMENT OF OPERATIONS ($ in Millions) 4Q19 1Q20 2Q20 3Q20 4Q20 Interest income 695$ 665$ 591$ 572$ 549$ Interest expense (175) (157) (89) (57) (43) Net interest income 520$ 508$ 502$ 515$ 506$ Fees & other income 151 135 132 151 145 Other non-interest income 3 11 22 - -
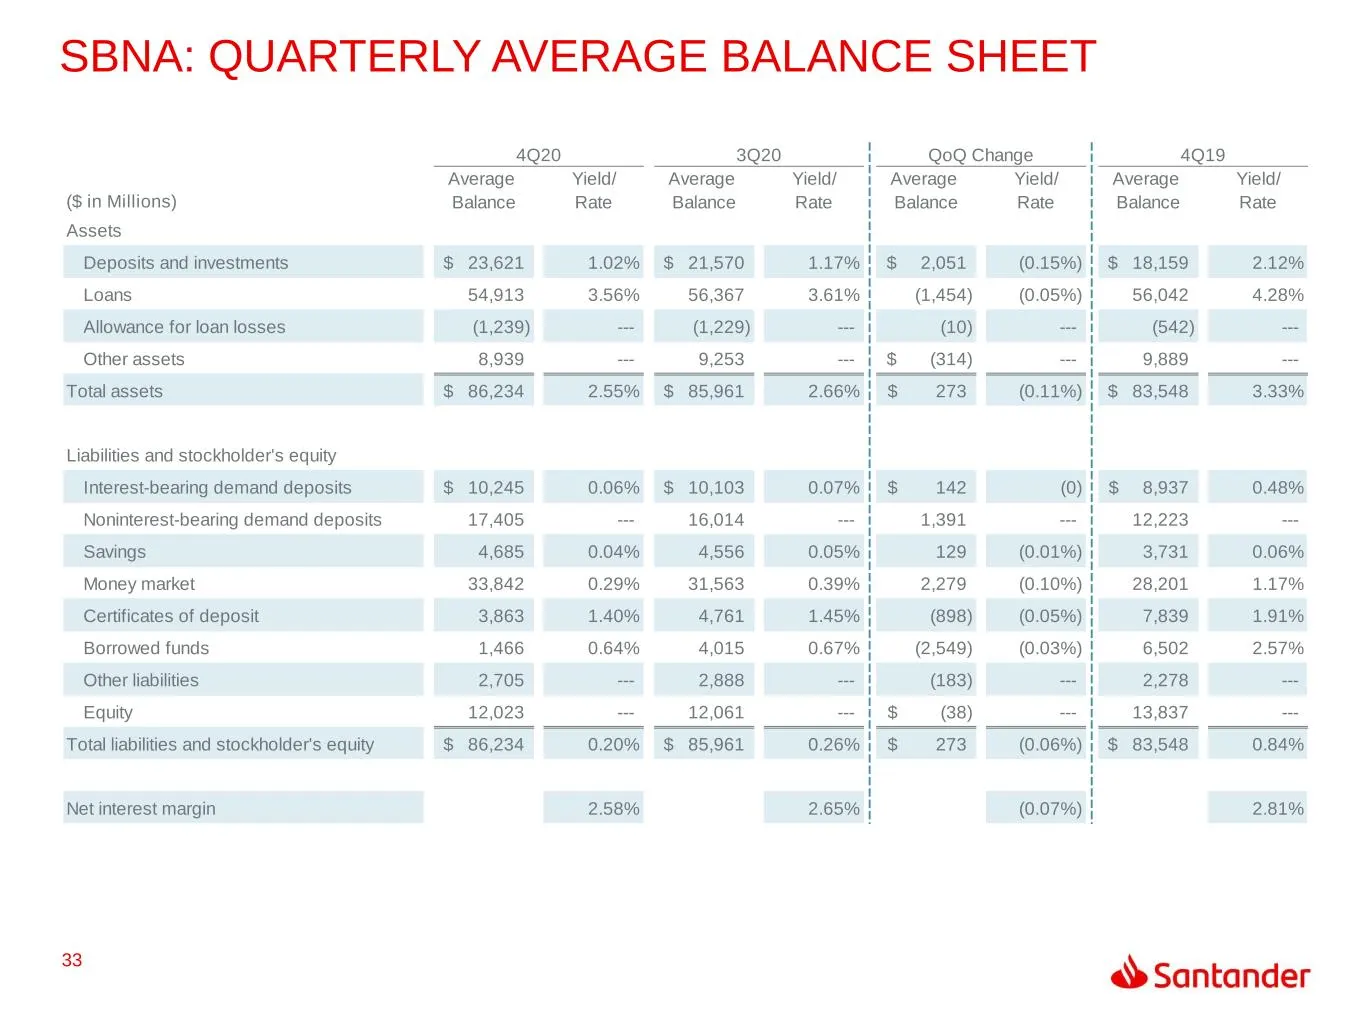
Slide 33: SBNA: Quarterly Average Balance Sheet
33 SBNA: QUARTERLY AVERAGE BALANCE SHEET Average Yield/ Average Yield/ Average Yield/ Average Yield/ ($ in Millions) Balance Rate Balance Rate Balance Rate Balance Rate Assets Deposits and investments 23,621$ 1.02% 21,570$ 1.17% 2,051$ (0.15%) 18,159$ 2.12% Loans 54,913 3.56% 56,367 3.61% (1,454) (0
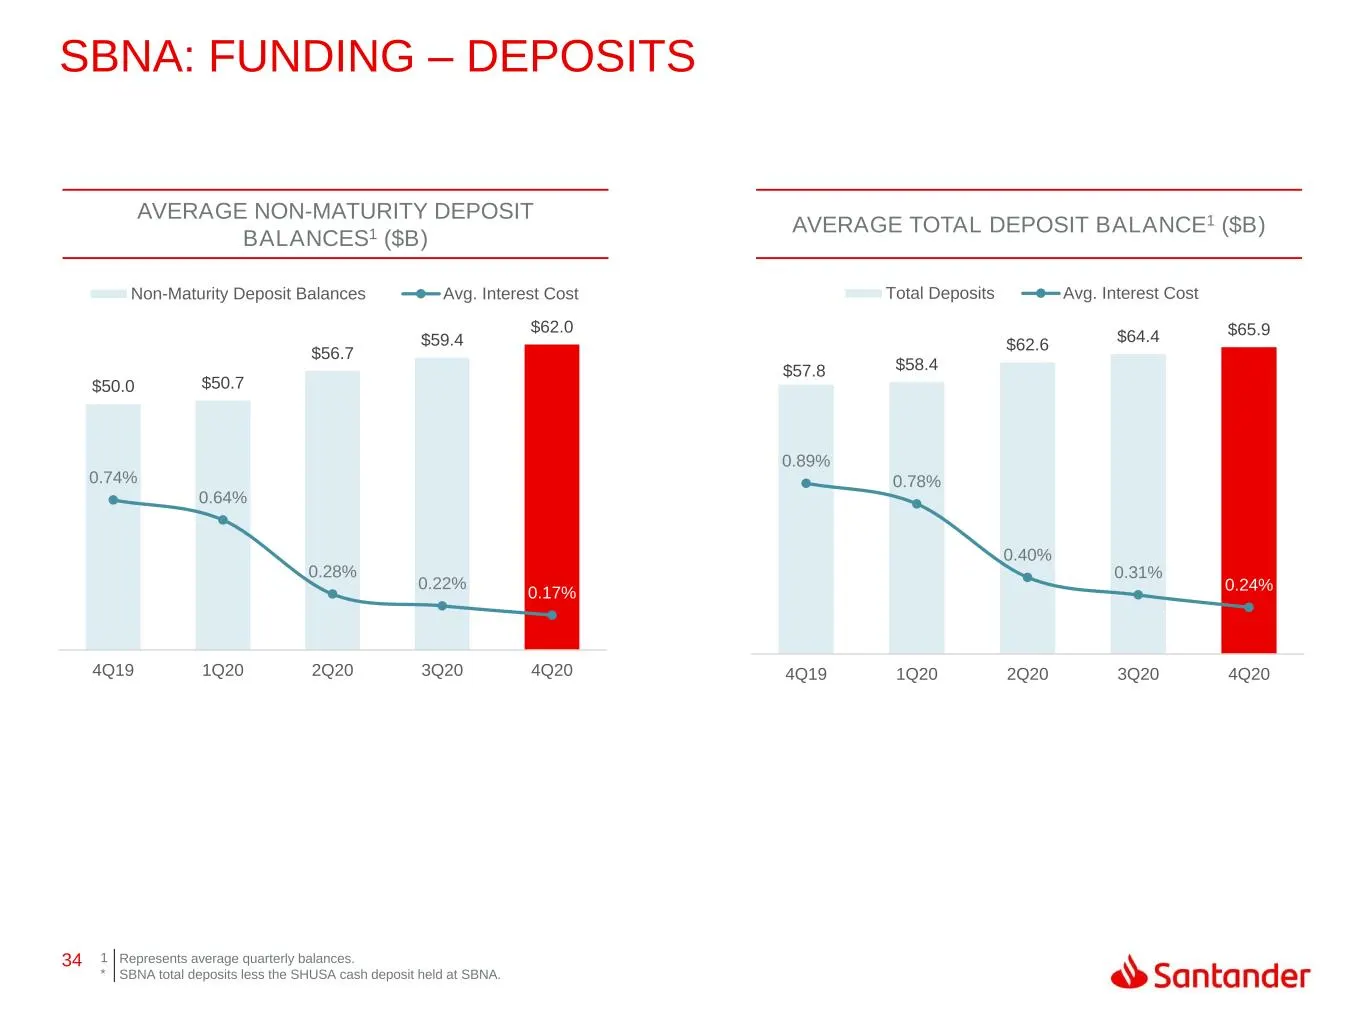
Slide 34: SBNA: Funding – Deposits
34 $50.0 $50.7 $56.7 $59.4 $62.0 0.74% 0.64% 0.28% 0.22% 0.17% 0.00% 0.20% 0.40% 0.60% 0.80% 1.00% 1.20% 1.40% 1.60% - 10.0 20.0 30.0 40.0 50.0 60.0 70.0 4Q19 1Q20 2Q20 3Q20 4Q20 Non-Maturity Deposit Balances Avg. Interest Cost $57.8 $58.4 $62.6 $64.4 $65.9 0.89% 0.78% 0.40% 0.31% 0.24% 0.00% 0.20%
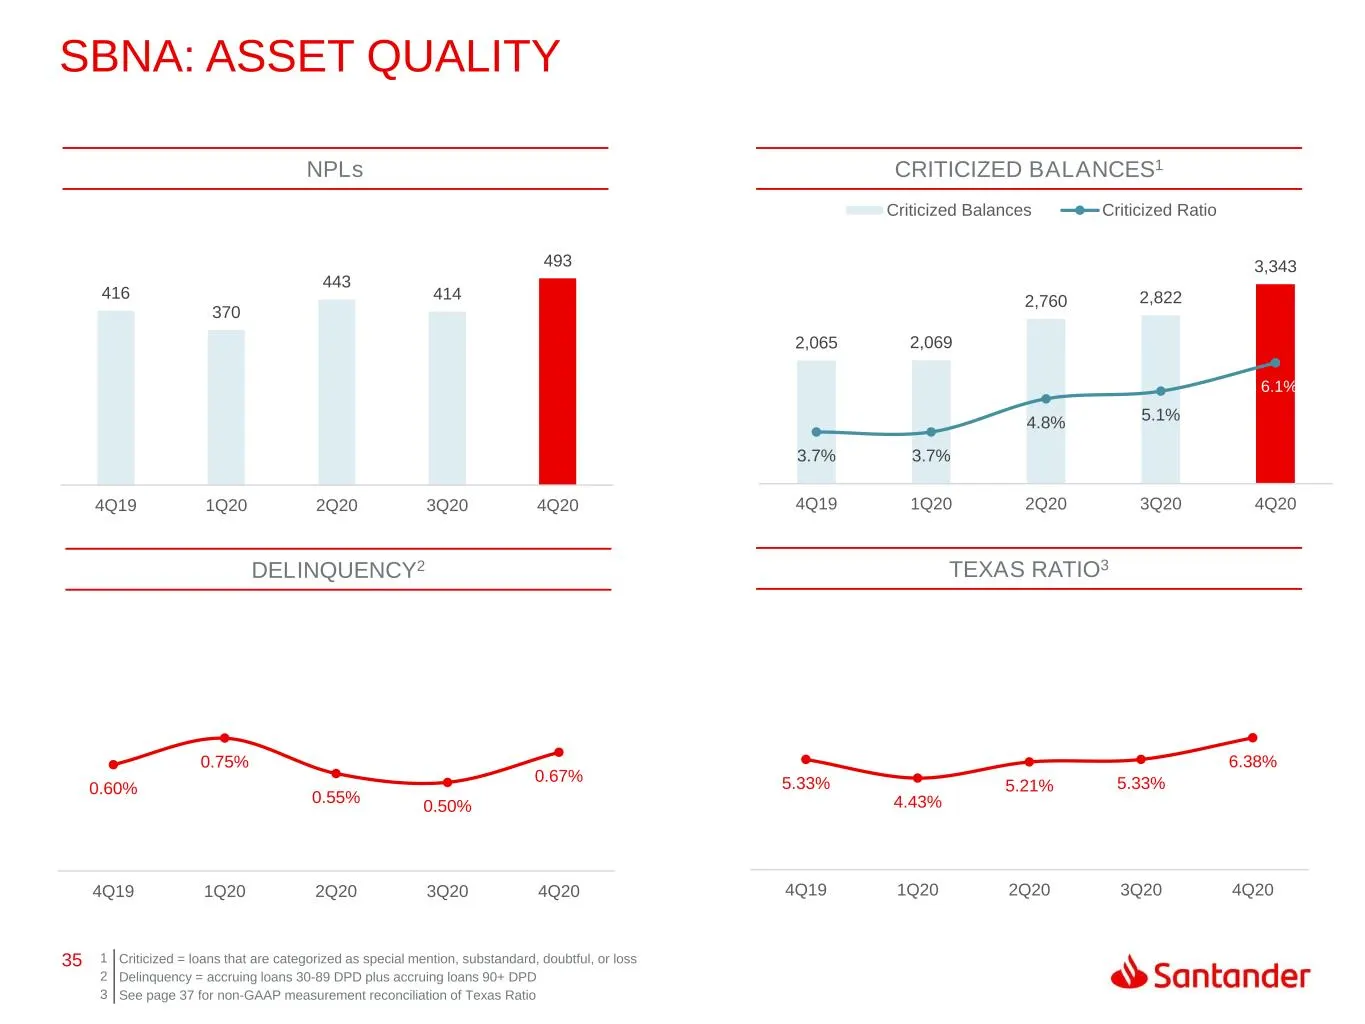
Slide 35: SBNA: Asset Quality
35 5.33% 4.43% 5.21% 5.33% 6.38% 4Q19 1Q20 2Q20 3Q20 4Q20 416 370 443 414 493 4Q19 1Q20 2Q20 3Q20 4Q20 2,065 2,069 2,760 2,822 3,343 3.7% 3.7% 4.8% 5.1% 6.1% 2.00% 3.00% 4.00% 5.00% 6.00% 7.00% 8.00% 9.00% 10.00% 0 500 1,000 1,500 2,000 2,500 3,000 3,500 4,000 4Q19 1Q20 2Q20 3Q20 4Q20 Criticized Bal
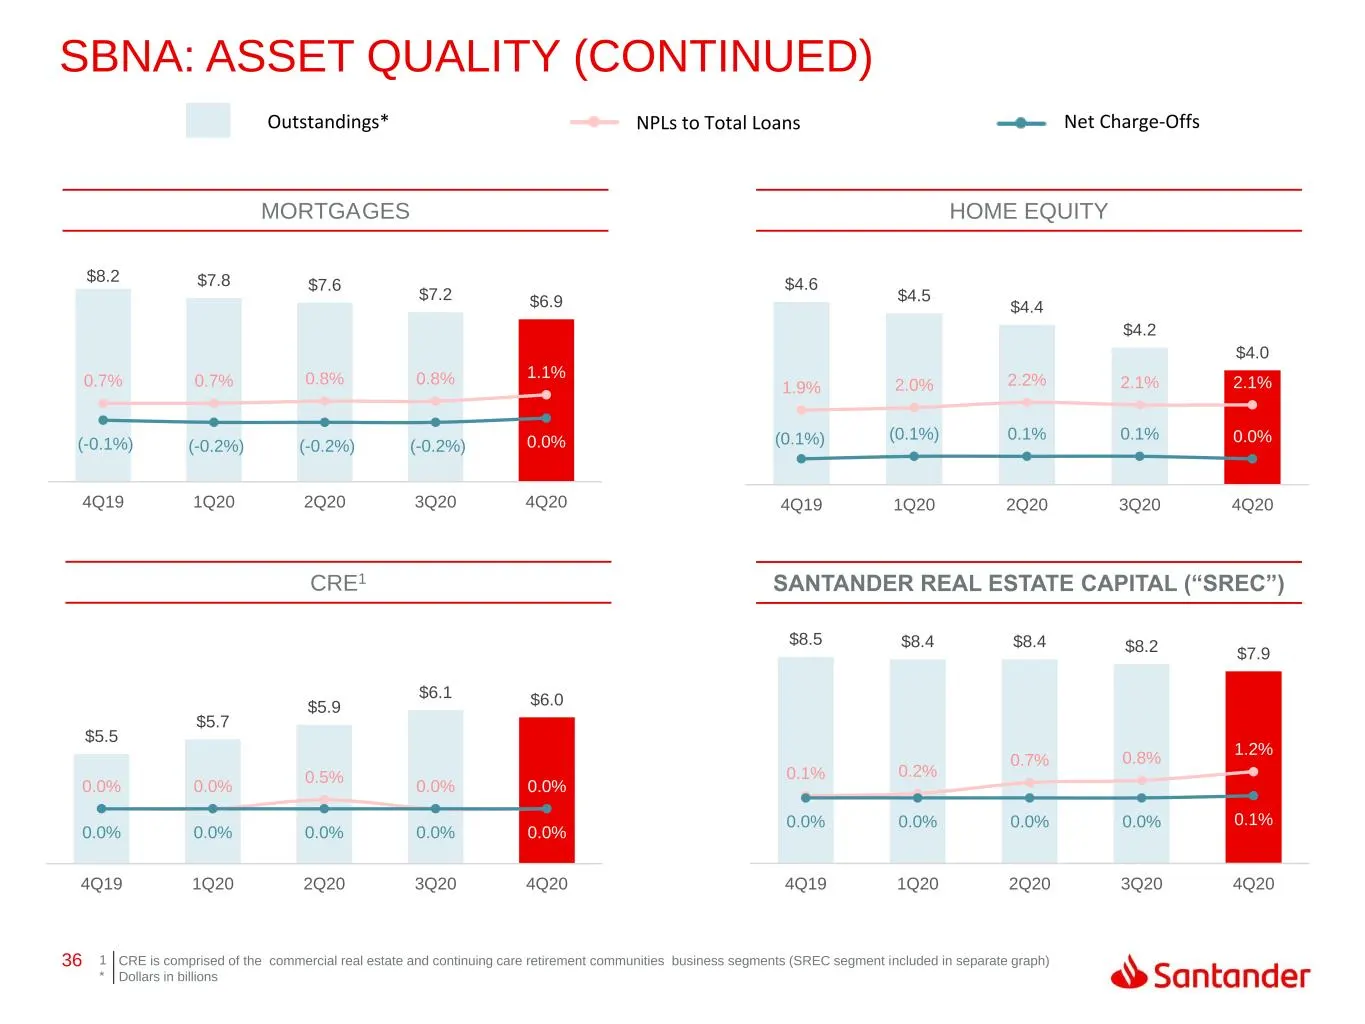
Slide 36: SBNA: Asset Quality (Continued)
36 $5.5 $5.7 $5.9 $6.1 $6.0 0.0% 0.0% 0.5% 0.0% 0.0% 0.0% 0.0% 0.0% 0.0% 0.0% (-3.0%) (-2.0%) (-1.0%) 0.0% 1.0% 2.0% 3.0% 4.0% 5.0% 6.0% 7.0% $4.0 $4.5 $5.0 $5.5 $6.0 $6.5 4Q19 1Q20 2Q20 3Q20 4Q20 $8.5 $8.4 $8.4 $8.2 $7.9 0.1% 0.2% 0.7% 0.8% 1.2% 0.0% 0.0% 0.0% 0.0% 0.1% (-3.0%) (-2.0%) (-1.0%) 0.0%
Slide 37: SBNA: Asset Quality (Continued)
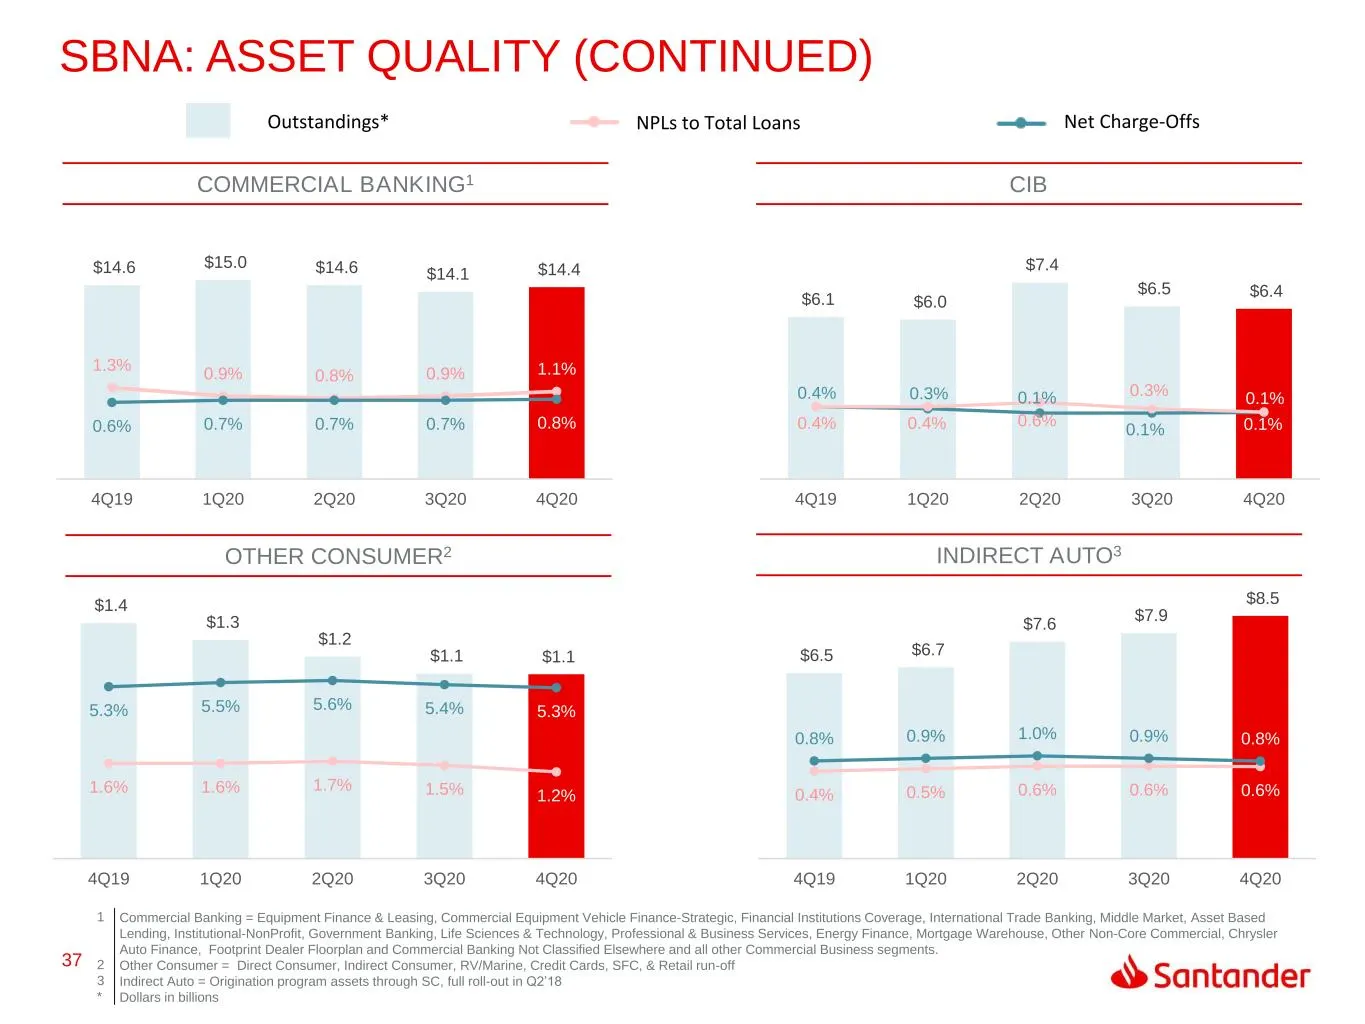
37 $1.4 $1.3 $1.2 $1.1 $1.1 1.6% 1.6% 1.7% 1.5% 1.2% 5.3% 5.5% 5.6% 5.4% 5.3% (-3.0%) (-1.0%) 1.0% 3.0% 5.0% 7.0% 9.0% - $0.2 $0.4 $0.6 $0.8 $1.0 $1.2 $1.4 $1.6 4Q19 1Q20 2Q20 3Q20 4Q20 $6.5 $6.7 $7.6 $7.9 $8.5 0.4% 0.5% 0.6% 0.6% 0.6% 0.8% 0.9% 1.0% 0.9% 0.8% (-3.0%) (-2.0%) (-1.0%) 0.0% 1.0% 2.0%
Slide 38: SBNA: Capital Ratios
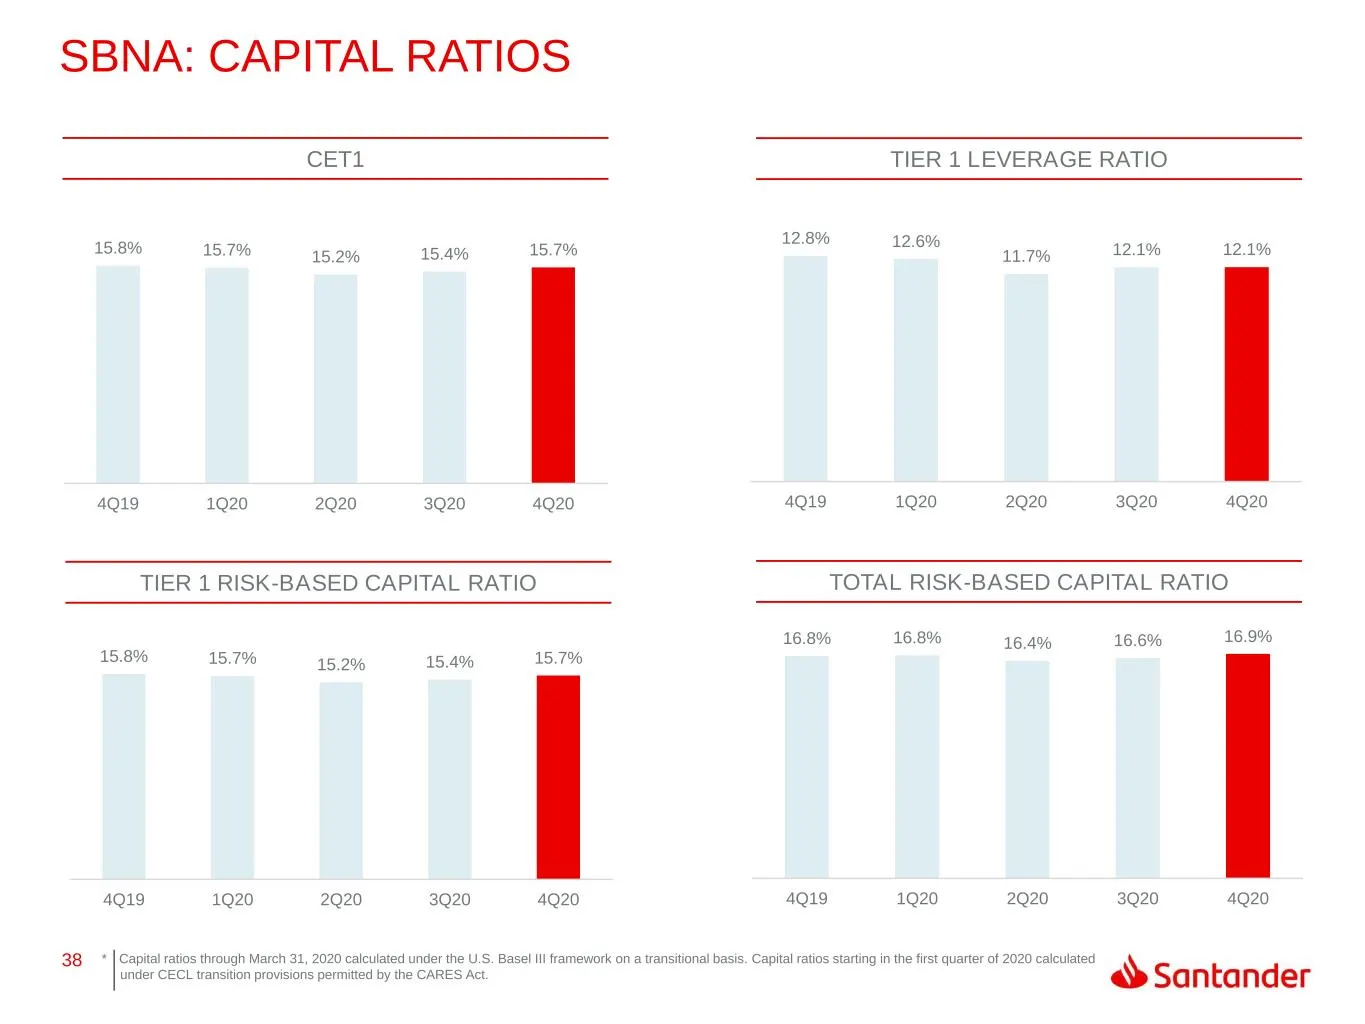
38 16.8% 16.8% 16.4% 16.6% 16.9% 4Q19 1Q20 2Q20 3Q20 4Q20 15.8% 15.7% 15.2% 15.4% 15.7% 4Q19 1Q20 2Q20 3Q20 4Q20 12.8% 12.6% 11.7% 12.1% 12.1% 4Q19 1Q20 2Q20 3Q20 4Q20 15.8% 15.7% 15.2% 15.4% 15.7% 4Q19 1Q20 2Q20 3Q20 4Q20 SBNA: CAPITAL RATIOS CET1 TIER 1 RISK-BASED CAPITAL RATIO TOTAL RISK-BASED CA
Slide 39: SC Auto 2020 Monthly Originations
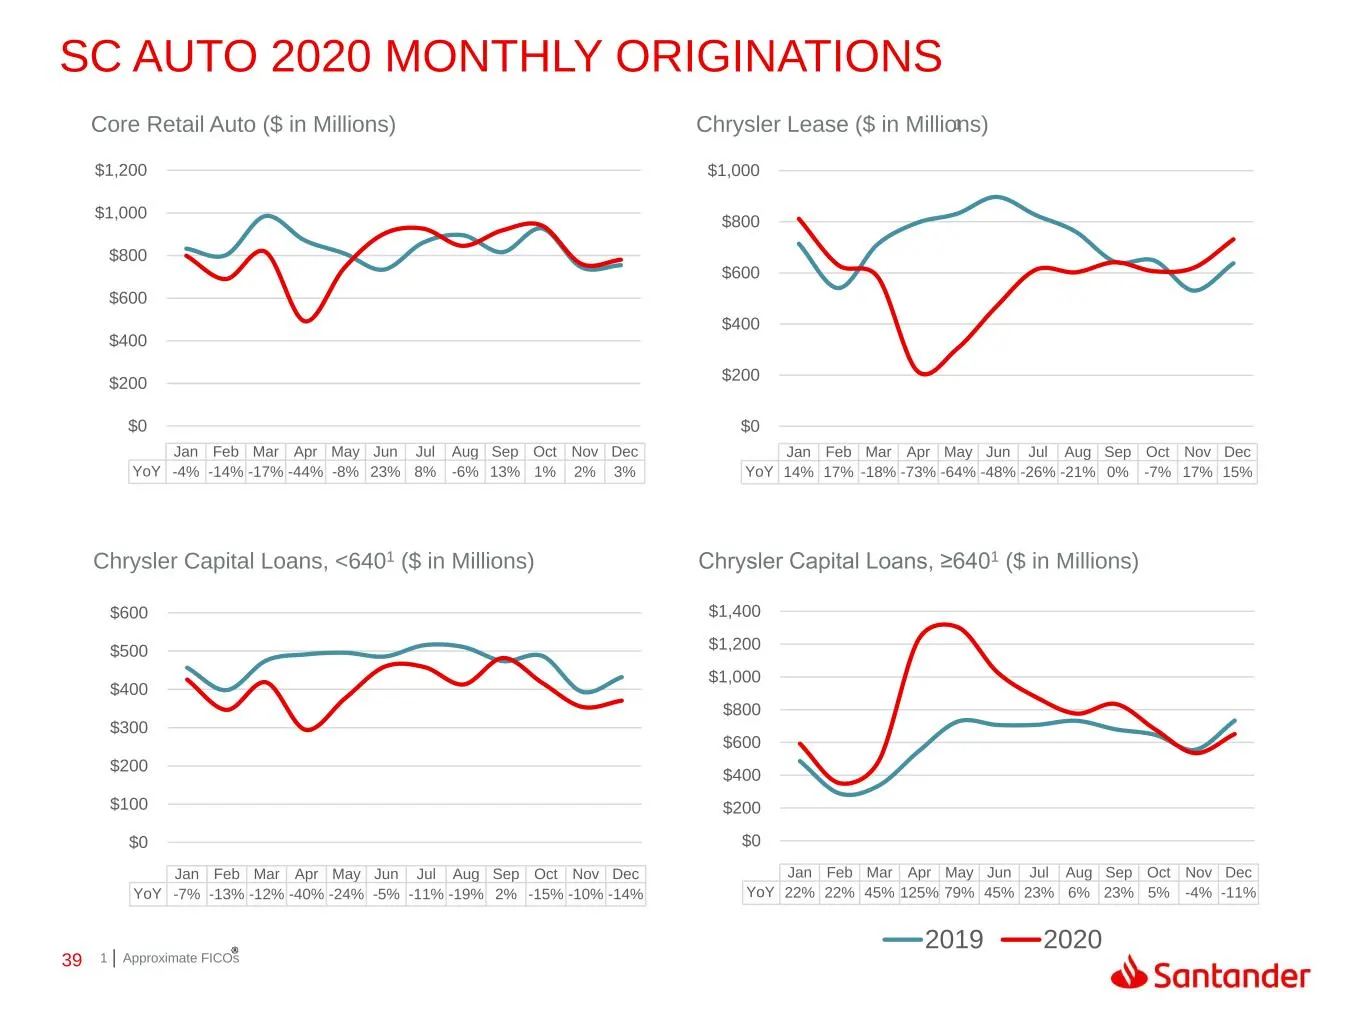
39 Jan Feb Mar Apr May Jun Jul Aug Sep Oct Nov Dec YoY 22% 22% 45% 125% 79% 45% 23% 6% 23% 5% -4% -11% 2019 2020 SC AUTO 2020 MONTHLY ORIGINATIONS $0 $200 $400 $600 $800 $1,000 $1,200 $1,400 Jan Feb Mar Apr May Jun Jul Aug Sep Oct Nov Dec YoY -7% -13% -12% -40% -24% -5% -11% -19% 2% -15% -10% -14% $
Slide 40: SC Auto Loss & Recovery Ratios
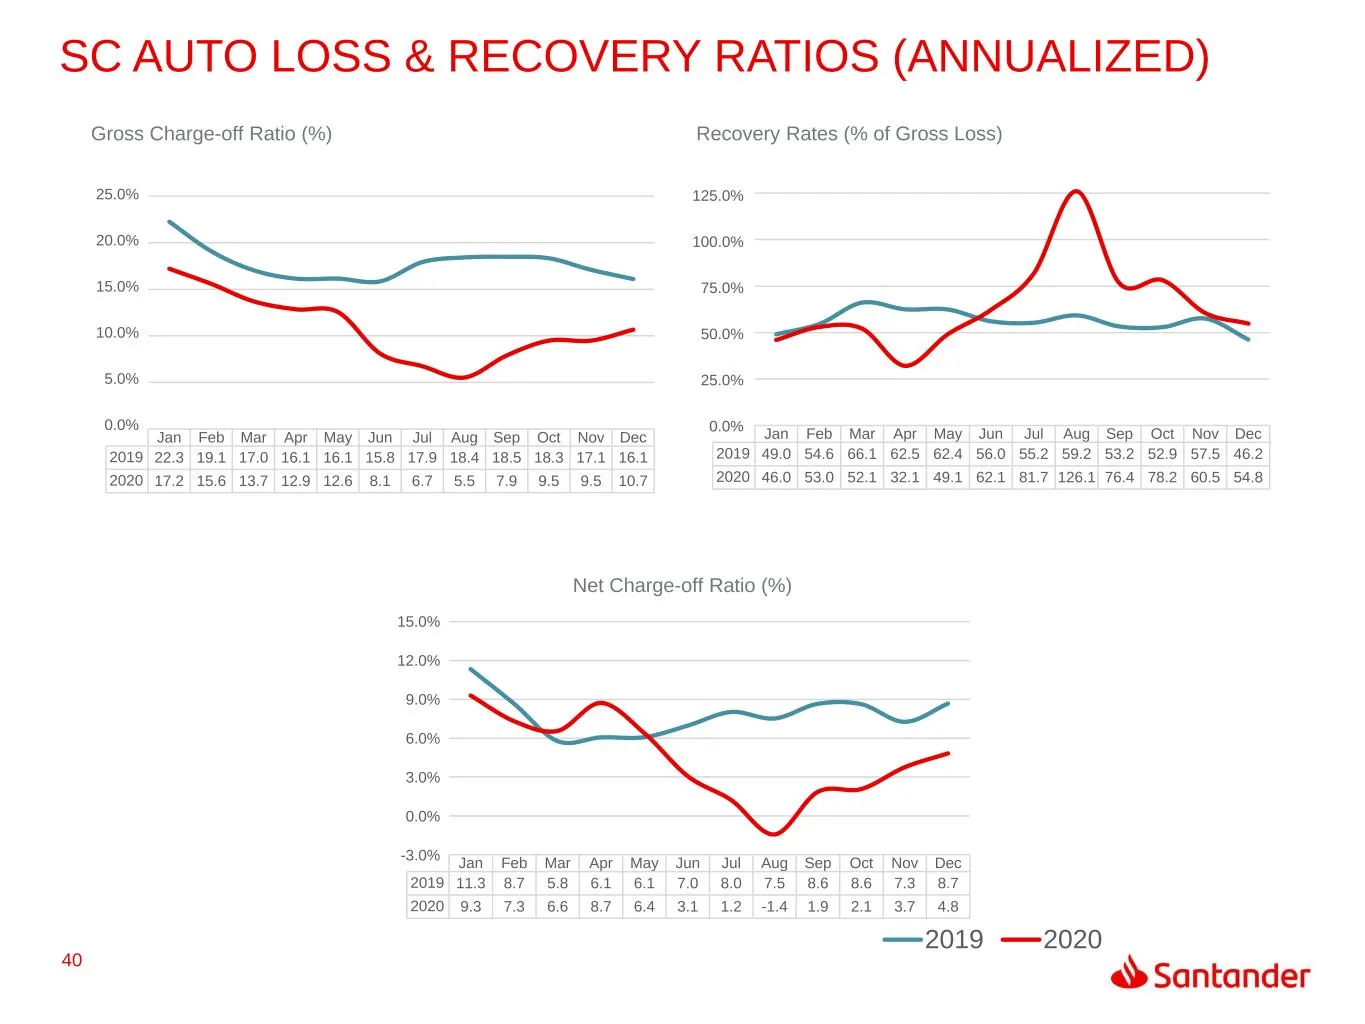
40 SC AUTO LOSS & RECOVERY RATIOS (ANNUALIZED) -3.0% 0.0% 3.0% 6.0% 9.0% 12.0% 15.0% Jan Feb Mar Apr May Jun Jul Aug Sep Oct Nov Dec 2019 11.3 8.7 5.8 6.1 6.1 7.0 8.0 7.5 8.6 8.6 7.3 8.7 2020 9.3 7.3 6.6 8.7 6.4 3.1 1.2 -1.4 1.9 2.1 3.7 4.8 Jan Feb Mar Apr May Jun Jul Aug Sep Oct Nov Dec 2019 49.0 5
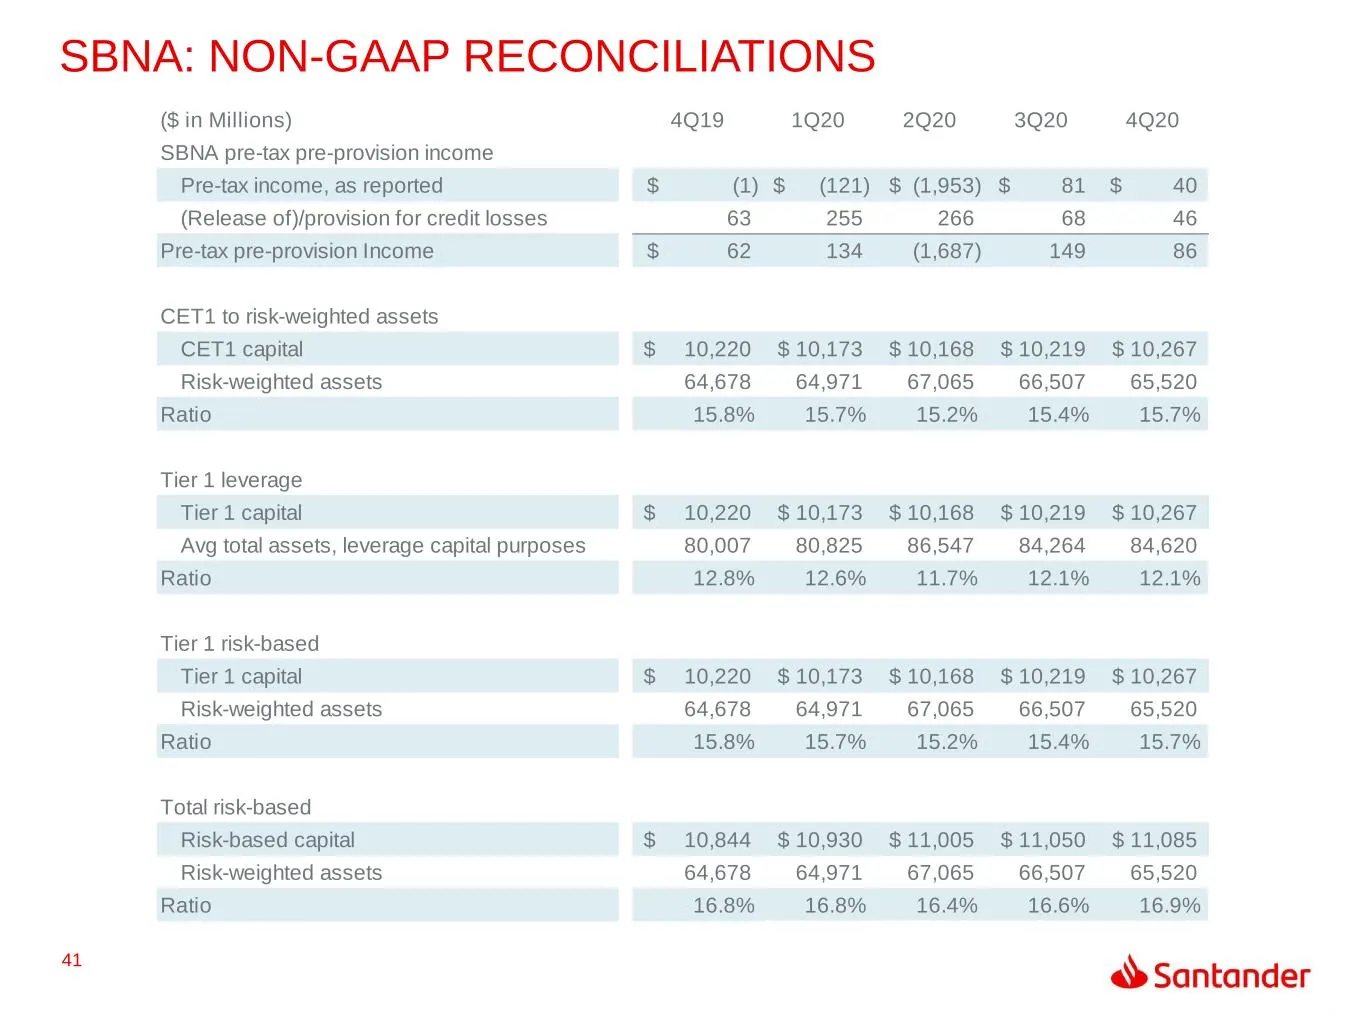
Slide 41: SBNA: Non-GAAP Reconciliations
41 SBNA: NON-GAAP RECONCILIATIONS ($ in Millions) 4Q19 1Q20 2Q20 3Q20 4Q20 SBNA pre-tax pre-provision income Pre-tax income, as reported (1)$ (121)$ (1,953)$ 81$ 40$ (Release of)/provision for credit losses 63 255 266 68 46 Pre-tax pre-provision Income 62$ 134 (1,687) 149 86 CET1 to risk-weighted as
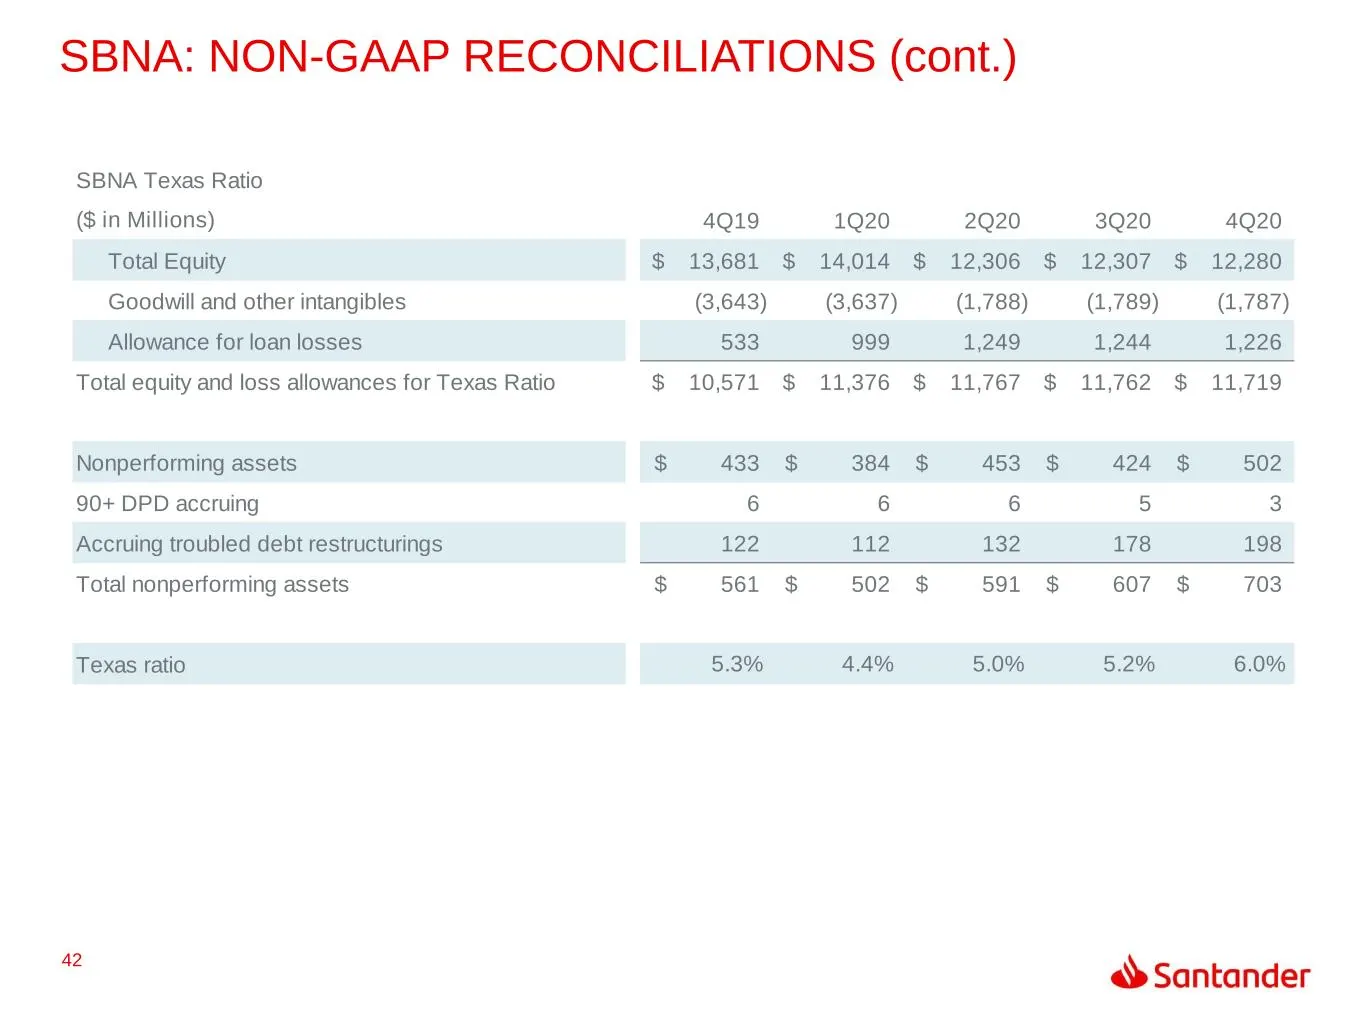
Slide 42: SBNA: Non-GAAP Reconciliations (cont.)
42 SBNA Texas Ratio ($ in Millions) 4Q19 1Q20 2Q20 3Q20 4Q20 Total Equity 13,681$ 14,014$ 12,306$ 12,307$ 12,280$ Goodwill and other intangibles (3,643) (3,637) (1,788) (1,789) (1,787) Allowance for loan losses 533 999 1,249 1,244 1,226 Total equity and loss allowances for Texas Ratio 10,571$ 11,376
Slide 43: Thank You
Our purpose is to help people and businesses prosper. Our culture is based on believing that everything we do should be: THANK YOU
Source: SEC EDGAR · 8-K filed Mar 3, 2021
More decks from Santander Holdings USA Inc
 Debt Investor Presentation (August 2026)30 slides · Aug 12, 2026
 Debt Investor Presentation (August 2026)30 slides · Aug 12, 2026
 Debt Investor Presentation (June 2026)29 slides · Jun 12, 2026
 Debt Investor Presentation (June 2026)29 slides · Jun 12, 2026
 Debt Investor Presentation (March 2026)36 slides · Mar 6, 2026
 Debt Investor Presentation (March 2026)36 slides · Mar 6, 2026