Cal Dive International — Q1 2010 Earnings Presentation
12 slides from Cal Dive International's earnings presentation, Apr 29, 2010

Slide 1: Cal Dive International 1st Quarter 2010 Earnings Conference Call
€; Cat Dive INTERNATIONAL Cal Dive International 1st Quarter 2010 Earnings Conference Call
Slide 2: Forward-Looking Statements
Forward-Looking Statements This presentation may include “forward-looking” statements that are generally identifiable through our use of words such as “believe,” “expect,” “anticipate,” “intend,” “plan,” “estimate,” “project” and similar expressions and include any statements that we make regarding
Slide 3: Presentation Outline
Presentation Outline @> Summary of 1Q 2010 Results @> Backlog @> Discussion of Financial Results @> Non-GAAP Reconciliations @> Questions & Answers
Slide 4: Summary of Results
Summary of 10 Results @> Decreased utilization and day rates for key assets. siggy @> Limited customer spending due to uncertainty regarding commodity prices. @ Lag effect of reduced drilling in 2009. @> Reduction in hurricane repair work in US GOM compared to 1Q 2009 elevated levels. @> Lower inter
Slide 5: Backlog
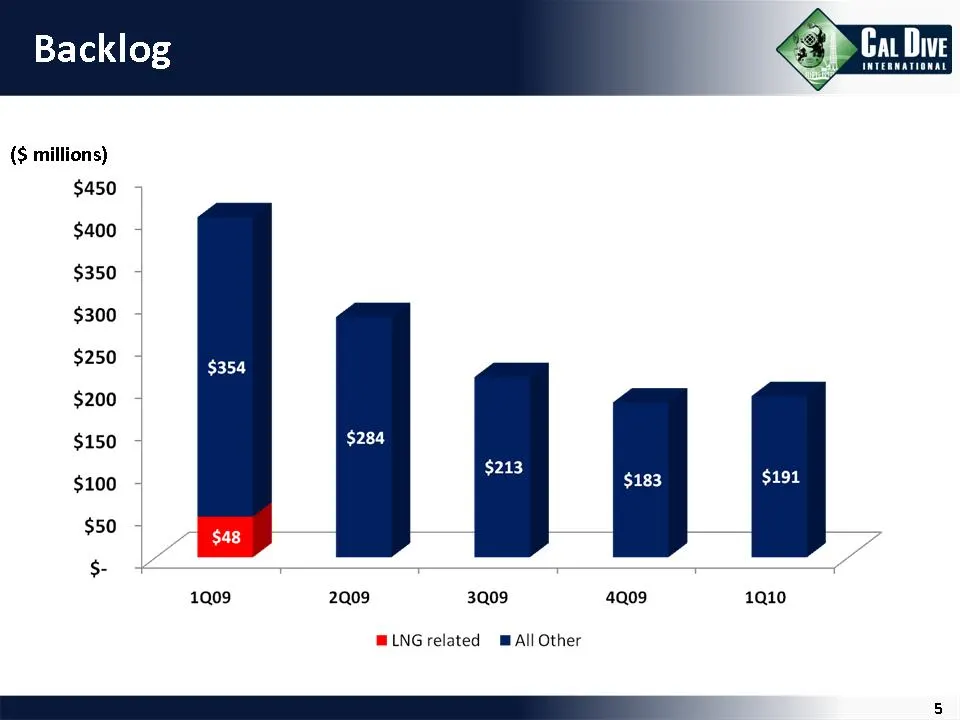
Backlog Cat Dive INTERNATIONAL ($ millions) $450 $400 $350 $300 $250 $354 $200 $150 $284 $100 - ae a $50 $- 1Q09 2Q09 3Q09 4Q09 1Q10 LNG related mAll Other
Slide 6: Financial Results
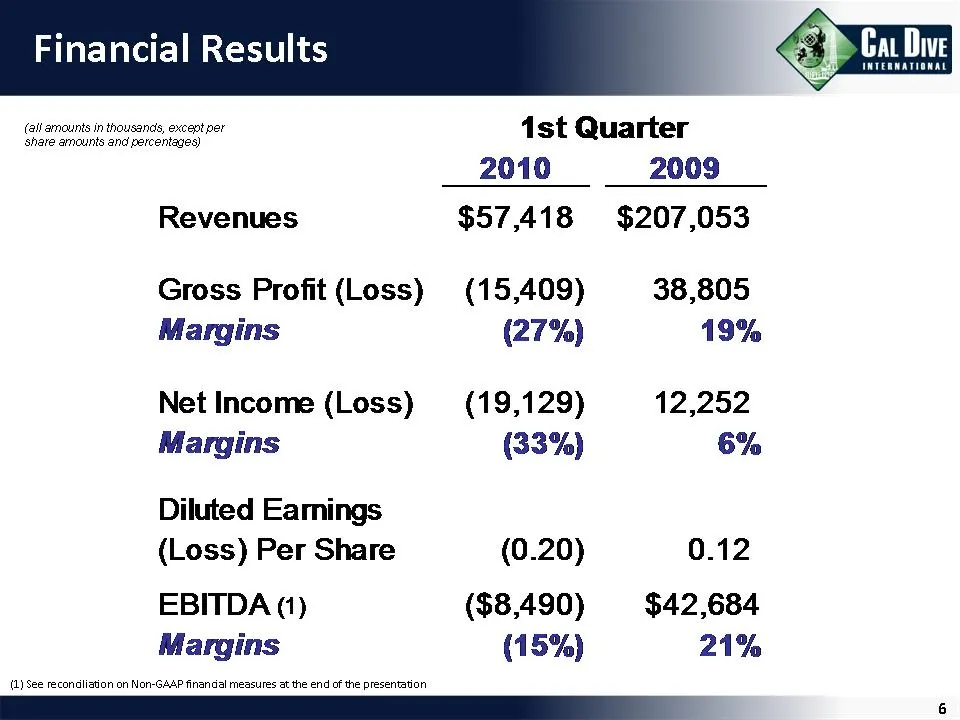
Financial Results 6 p> Cu Dive (all amounts in thousands, except per share amounts and percentages) Revenues Gross Profit (Loss) Margins Net Income (Loss) Margins Diluted Eamings (Loss) Per Share EBITDA (1) Margins (2) See reconaliation on Non-GAAP finandal measures atthe end of the presentation 1st
Slide 7: Utilization
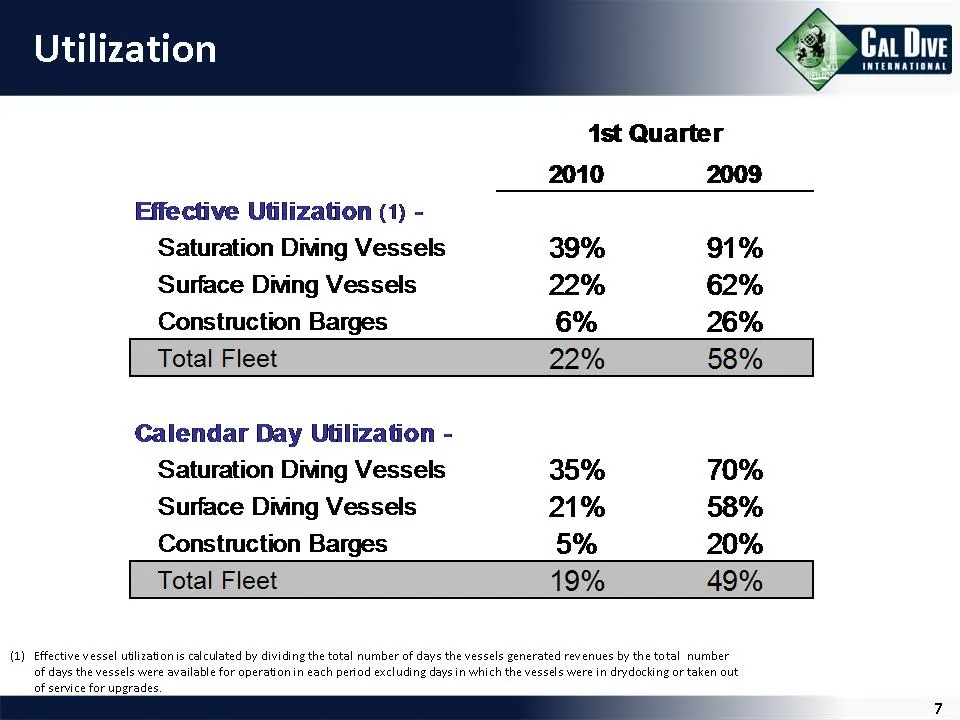
Utilization 1st Quarter 2010 2009 Effective Utilization (1) - Saturation Diving Vessels 39% 91% Surface Diving Vessels 22% 62% Construction Barges 6% 26% Total Fleet 22% 58% Calendar Day Utilization - Saturation Diving Vessels 35% 70% Surface Diving Vessels 21% 58% Construction Barges 5% 20% Total F
Slide 8: International Revenue
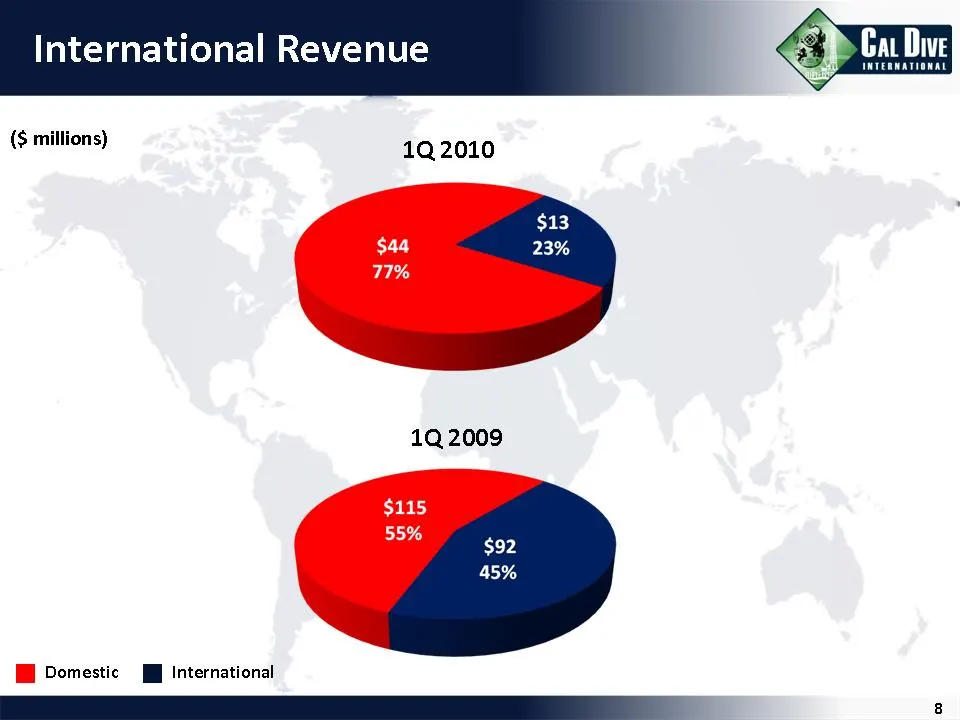
International Revenue ($ millions) 1Q 2010 1Q 2009 Domestic [J International
Slide 9: Debt Levels
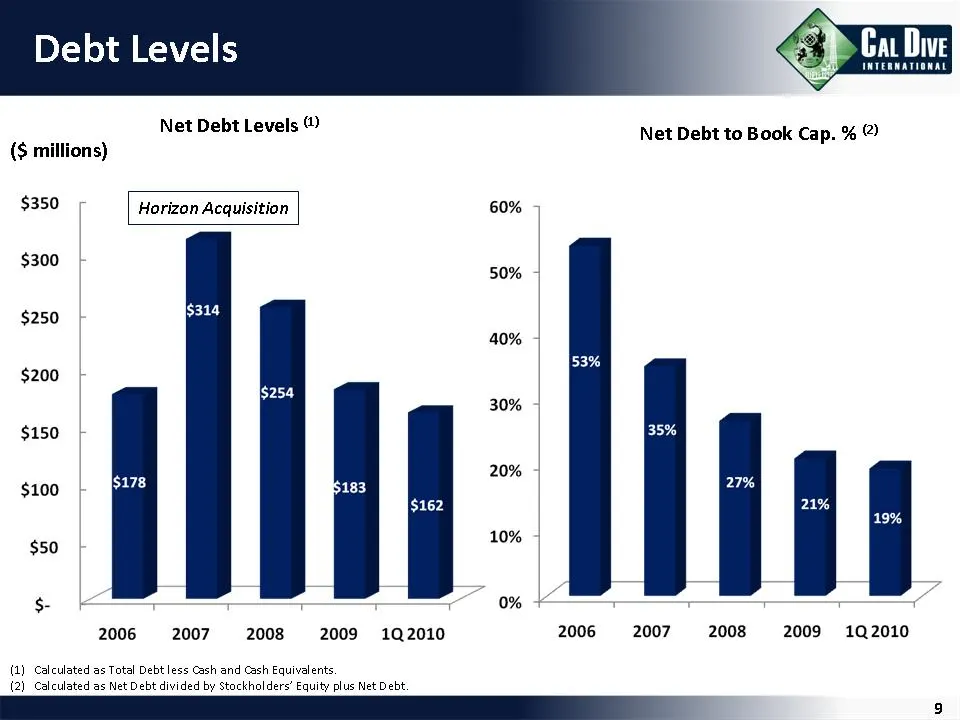
Debt Levels >> Ca Dive INTERWATIONAL w (§ millions) Net Debt Levels ® Net Debt to Book Cap. % @) millions} $350 Horizon Acquisition 60% 300 ‘ 50% + $250 40% 53% $200 30% $150 35% $100 $378 183 20% 27% 70% A 9%, $50 10% $- F T 0% + < 2006 2007 ©2008 += 2009: 19.2010 2006 ©2007» 2008 «= 2009: 1Q.2010
Slide 10: Liquidity
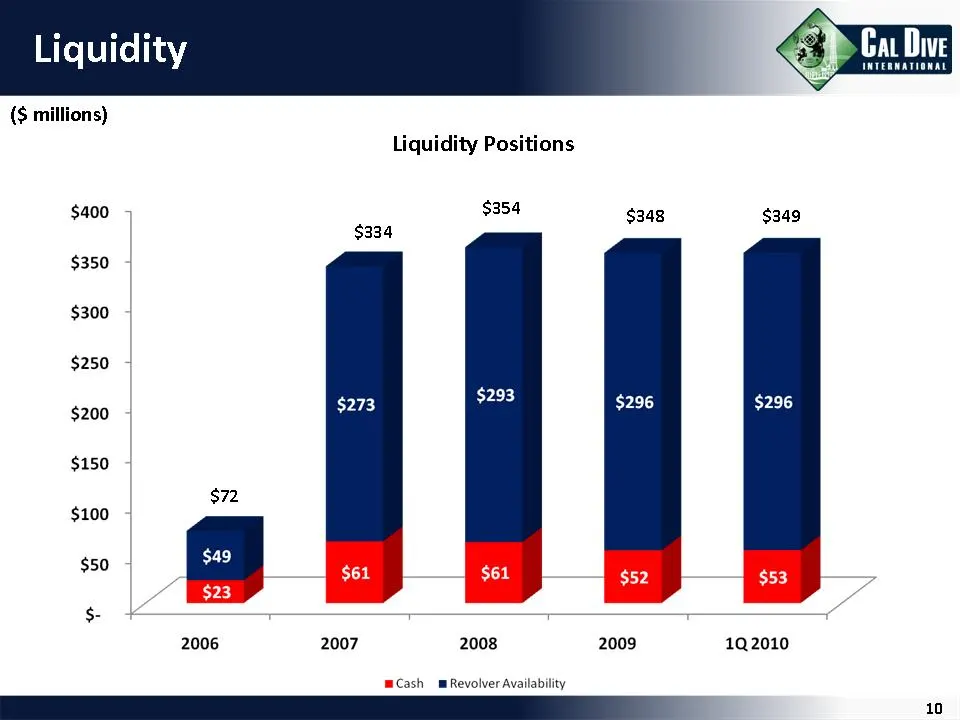
Cat Dive INTERNATIONAL Liquidity ($ millions) Liquidity Positions $400 $354 $348 $349 $334 $350 $300 $250 $200 $273 $293 $150 $72 $100 $50 $- 2006 2007 2008 2009 1Q2010 Cash _mRevolver Availability 10
Slide 11: Non-GAAP Reconciliations
—- i al Non-GAAP Reconciliations pee Ah INTERWATIONAL
Slide 12: EBITDA Reconciliations
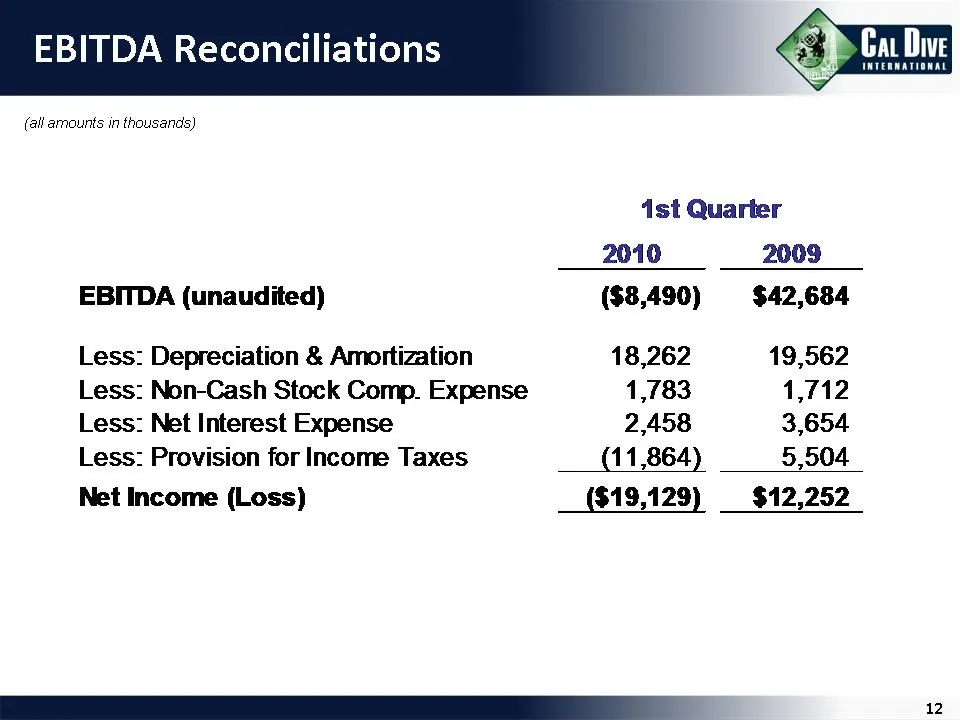
EBITDA Reconciliations (all amounts in thousands) Ga Dive 1st Quarter 2010 2009 EBITDA (unaudited) ($8,490) $42,684 Less: Depreciation & Amortization 18,262 19,562 Less: Non-Cash Stock Comp. Expense 1,783 1,712 Less: Net Interest Expense 2,458 3,654 Less: Provision for Income Taxes (11,864) 5,504 Ne
Source: SEC EDGAR · 8-K filed Apr 29, 2010
More decks from Cal Dive International Inc
 Q3 2014 Earnings Presentation12 slides · Nov 6, 2014
 Q2 2014 Earnings Presentation12 slides · Aug 11, 2014
 Q1 2014 Earnings Presentation12 slides · May 9, 2014
 Q4 2013 Earnings Presentation11 slides · Mar 5, 2014
 Q3 2013 Earnings Presentation11 slides · Nov 7, 2013
 Q2 2013 Earnings Presentation11 slides · Aug 8, 2013