PowerSecure International — Investor Presentation (March 2008)
25 slides from PowerSecure International's investor presentation, Mar 25, 2008
Slide 1: PowerSecure (March 25, 2008)
Power Kaatine March 25, 2008
Slide 2: Forward Looking Statements Safe Harbor
Forward Looking Statements Safe Harbor All forward-looking statements made in this presentation are made under the safe harbor provisions of the Private Securities Litigation Reform Act of 1995. Forward-looking statements, which are all statements other than statements of historical facts and includ
Slide 3: Who We Are
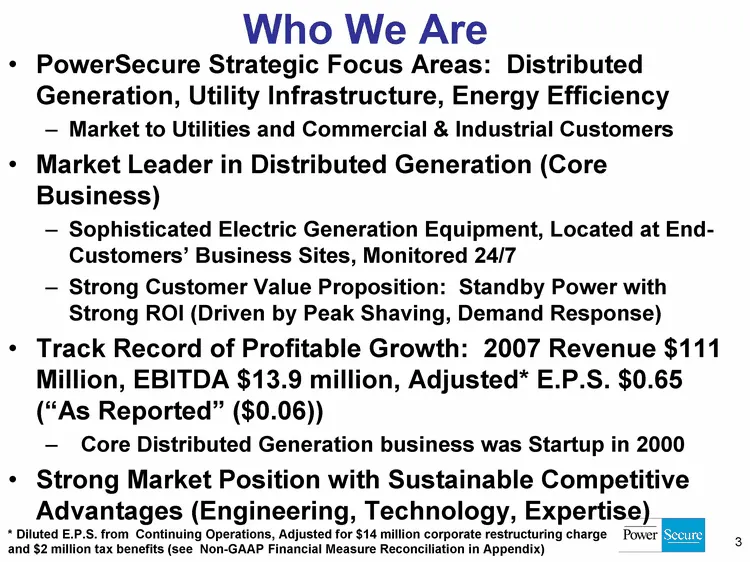
Who We Are PowerSecure Strategic Focus Areas: Distributed Generation, Utility Infrastructure, Energy Efficiency Market to Utilities and Commercial & Industrial Customers Market Leader in Distributed Generation (Core Business) Sophisticated Electric Generation Equipment, Located at End- Customers' Bu
Slide 4: 4Q07: A Record Quarter
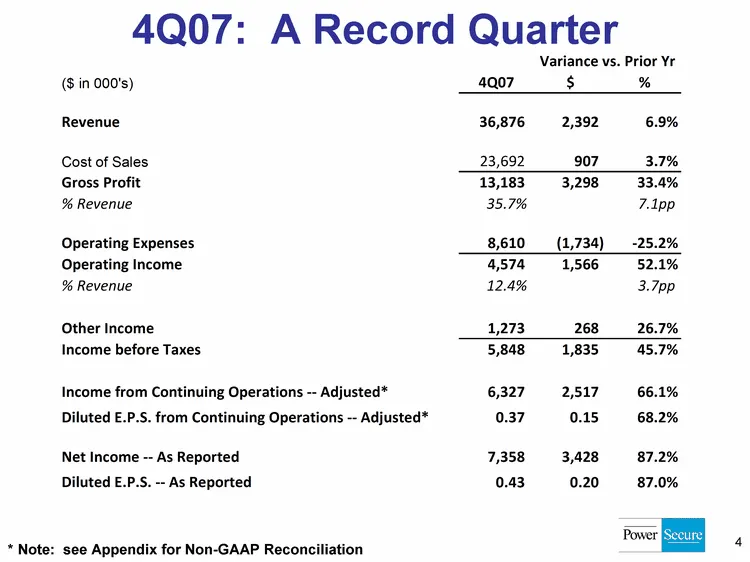
4Q07: A Record Quarter 4 * Note: see Appendix for Non-GAAP Reconciliation
Slide 5: The Electric Power Industry is Large and Growing
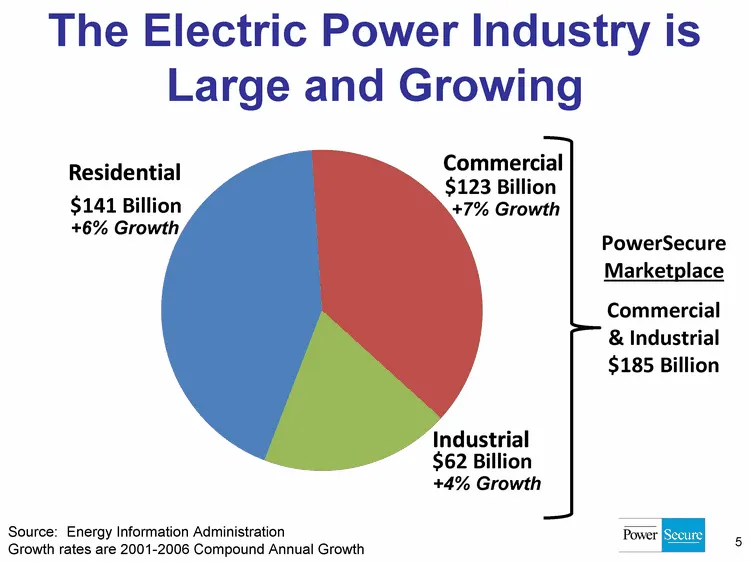
The Electric Power Industry is Large and Growing 5 Source: Energy Information Administration Growth rates are 2001-2006 Compound Annual Growth +7% Growth $123 Billion $62 Billion +4% Growth $141 Billion +6% Growth PowerSecure Marketplace Commercial & Industrial $185 Billion
Slide 6: With Continued Long-term Increases in Demand Projected
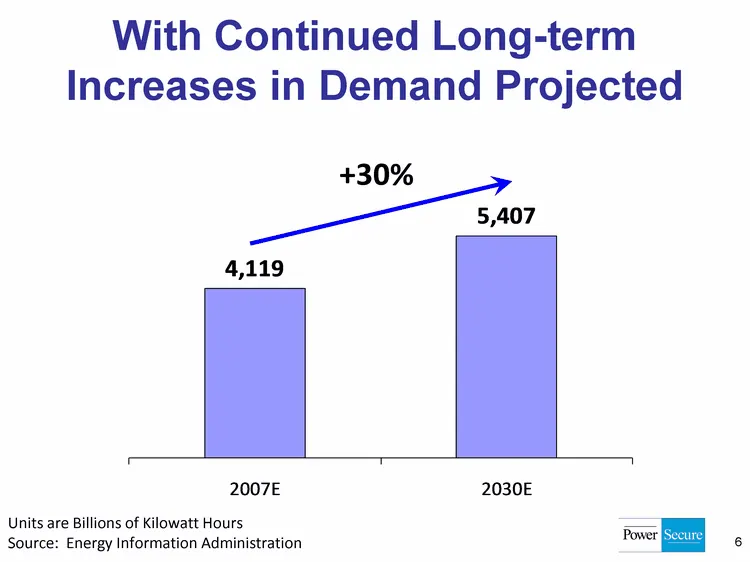
With Continued Long-term Increases in Demand Projected +30% Units are Billions of Kilowatt Hours Source: Energy Information Administration 6
Slide 7: However, Utilities are Increasingly Constrained
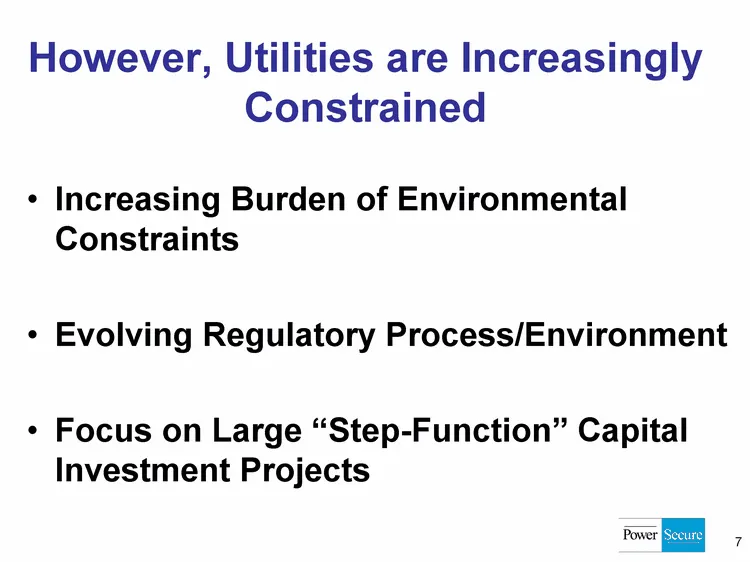
However, Utilities are Increasingly Constrained Increasing Burden of Environmental Constraints Evolving Regulatory Process/Environment Focus on Large "Step-Function" Capital Investment Projects 7
Slide 8: And Electricity Prices Continue to Rise
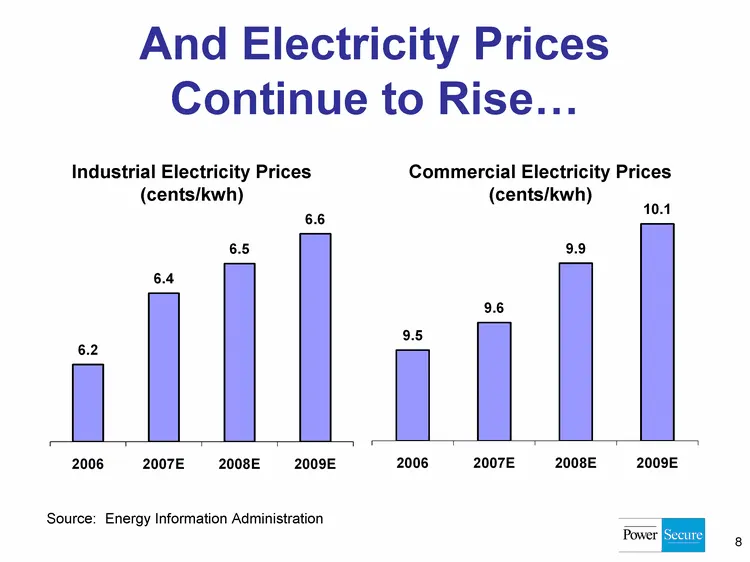
And Electricity Prices Continue to Rise... 8 Industrial Electricity Prices (cents/kwh) Commercial Electricity Prices (cents/kwh) Source: Energy Information Administration
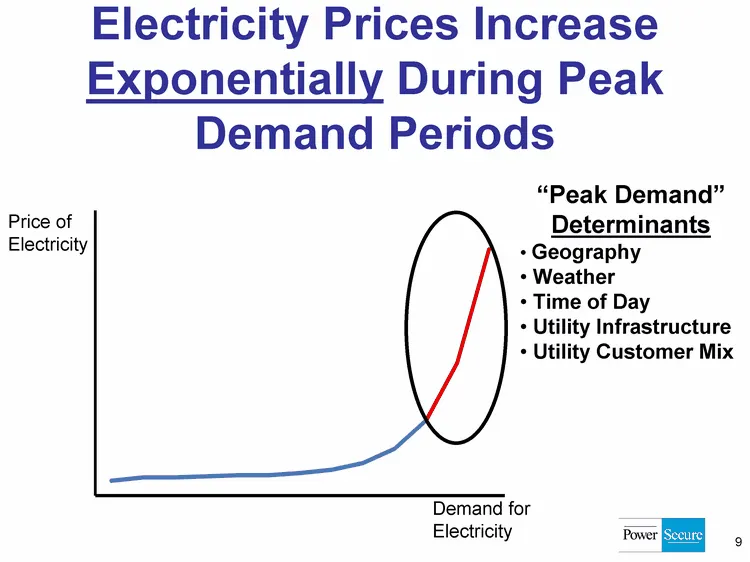
Slide 9: Electricity Prices Increase Exponentially During Peak Demand Periods
9 Electricity Prices Increase Exponentially During Peak Demand Periods Price of Electricity Demand for Electricity "Peak Demand" Determinants Geography Weather Time of Day Utility Infrastructure Utility Customer Mix
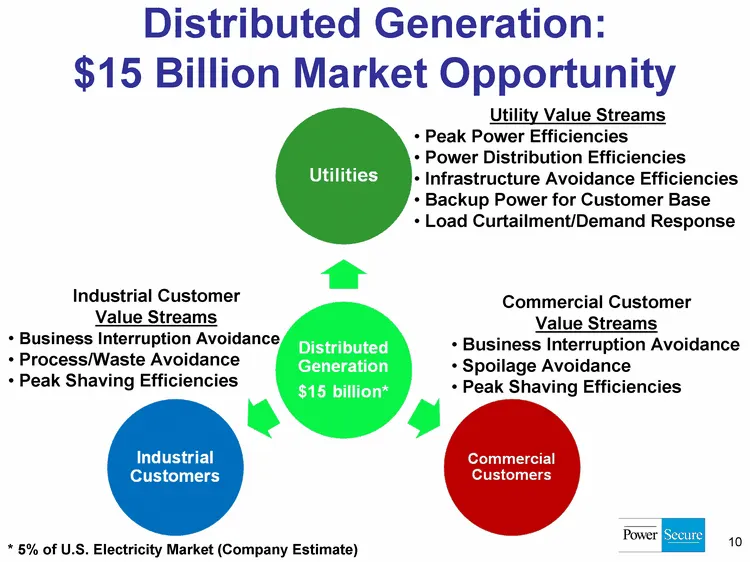
Slide 10: Distributed Generation: $15 Billion Market Opportunity
Distributed Generation: $15 Billion Market Opportunity 10 Utility Value Streams Peak Power Efficiencies Power Distribution Efficiencies Infrastructure Avoidance Efficiencies Backup Power for Customer Base Load Curtailment/Demand Response Industrial Customer Value Streams Business Interruption Avoida
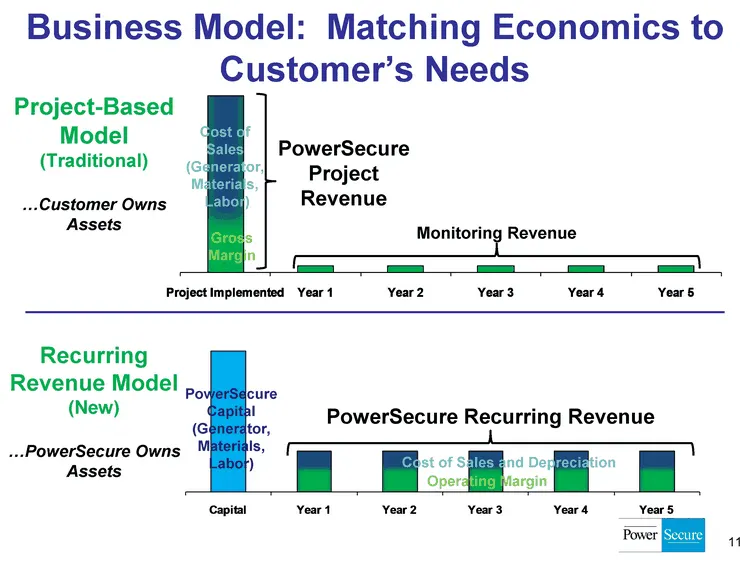
Slide 11: Business Model: Matching Economics to Customer's Needs
Business Model: Matching Economics to Customer's Needs 11 Project-Based Model (Traditional) ....Customer Owns Assets PowerSecure Project Revenue Gross Margin Monitoring Revenue PowerSecure Capital (Generator, Materials, Labor) Recurring Revenue Model (New) ....PowerSecure Owns Assets Cost of Sales (
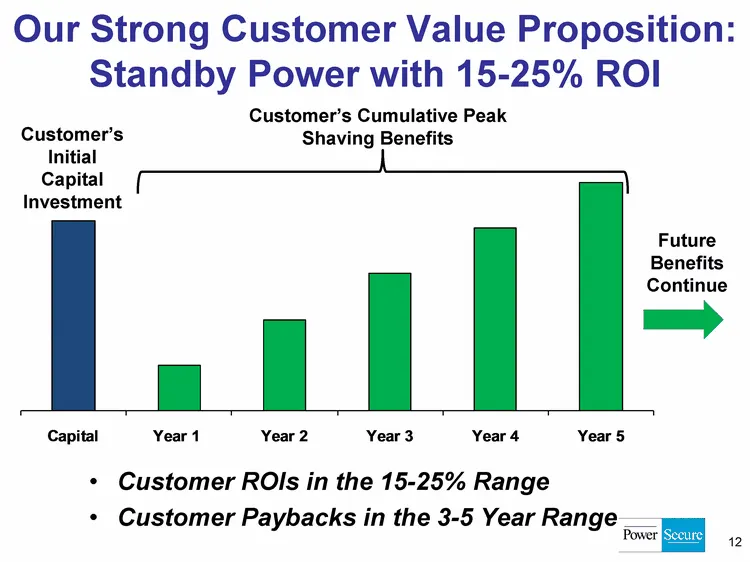
Slide 12: Our Strong Customer Value Proposition: Standby Power with ROI
Our Strong Customer Value Proposition: Standby Power with 15-25% ROI Customer ROIs in the 15-25% Range Customer Paybacks in the 3-5 Year Range 12 Customer's Initial Capital Investment Future Benefits Continue Customer's Cumulative Peak Shaving Benefits
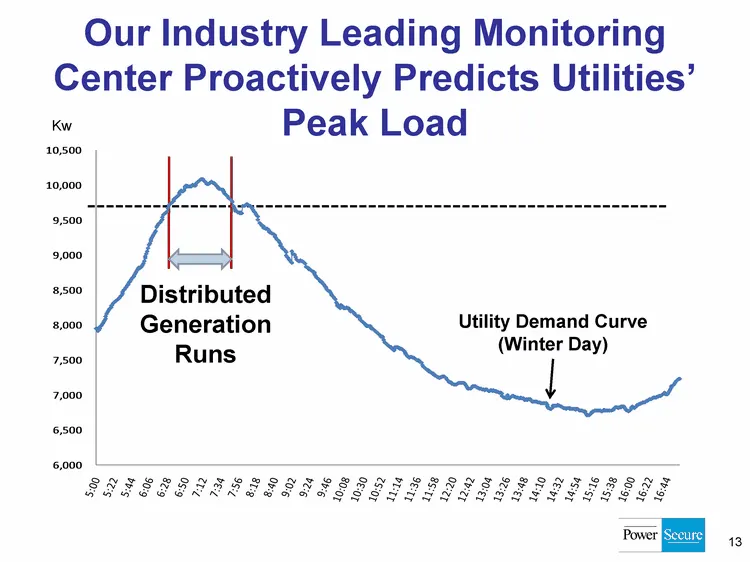
Slide 13: Our Industry Leading Monitoring Center Proactively Predicts Utilities' Peak Load
Our Industry Leading Monitoring Center Proactively Predicts Utilities' Peak Load 13 Distributed Generation Runs Kw Utility Demand Curve (Winter Day)
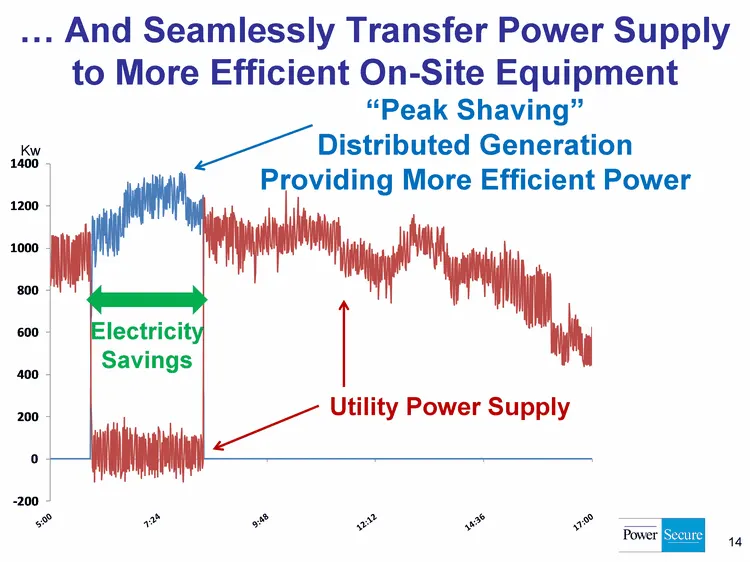
Slide 14: And Seamlessly Transfer Power Supply to More Efficient On-Site Equipment
.... And Seamlessly Transfer Power Supply to More Efficient On-Site Equipment 14 Kw Utility Power Supply "Peak Shaving" Distributed Generation Providing More Efficient Power Electricity Savings
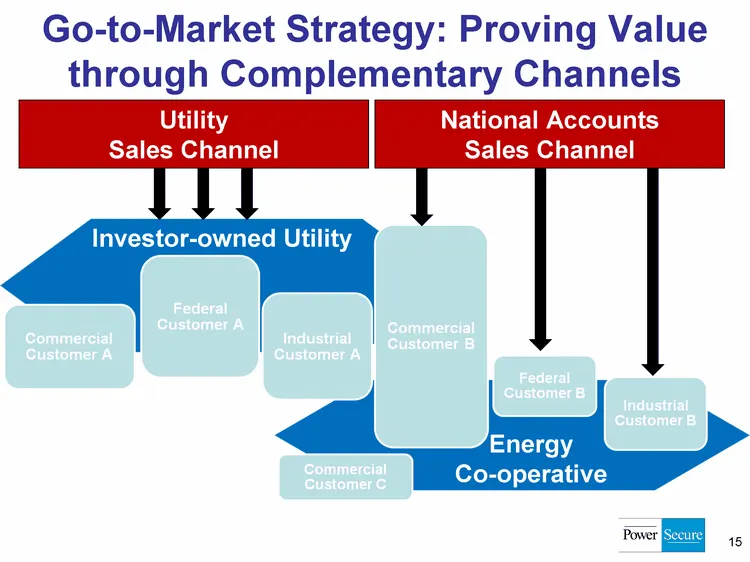
Slide 15: Go-to-Market Strategy: Proving Value through Complementary Channels
Go-to-Market Strategy: Proving Value through Complementary Channels 15 Investor-owned Utility Energy Co-operative Utility Sales Channel National Accounts Sales Channel
Slide 16: Market Leadership
Market Leadership First to Bring Turnkey Distributed Generation Concept to Market (Profitable Day 1) Deep Understanding of Utilities and their Customers Proven track record of execution and dependability Strong ROI-based Customer Value Proposition Strong Relationships - Our Culture Seeks to Build Fo
Slide 17: With Strong, Sustainable Competitive Advantages
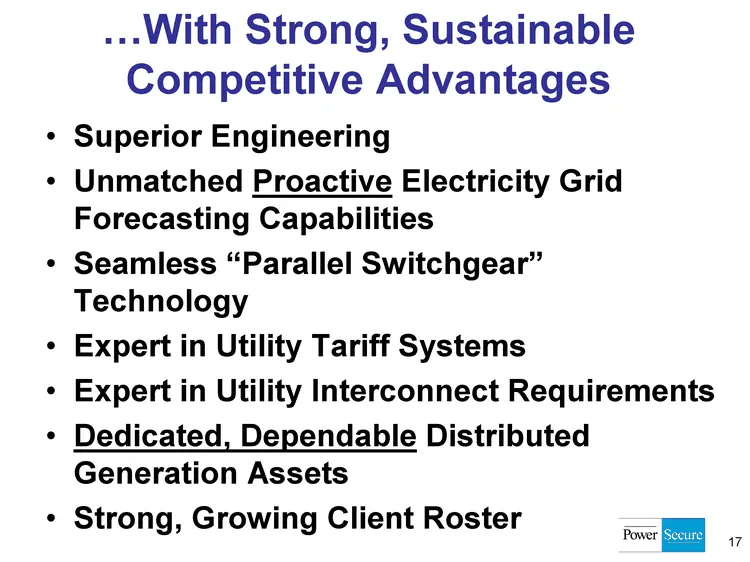
....With Strong, Sustainable Competitive Advantages Superior Engineering Unmatched Proactive Electricity Grid Forecasting Capabilities Seamless "Parallel Switchgear" Technology Expert in Utility Tariff Systems Expert in Utility Interconnect Requirements Dedicated, Dependable Distributed Generation A
Slide 18: And Growing Complementary Businesses
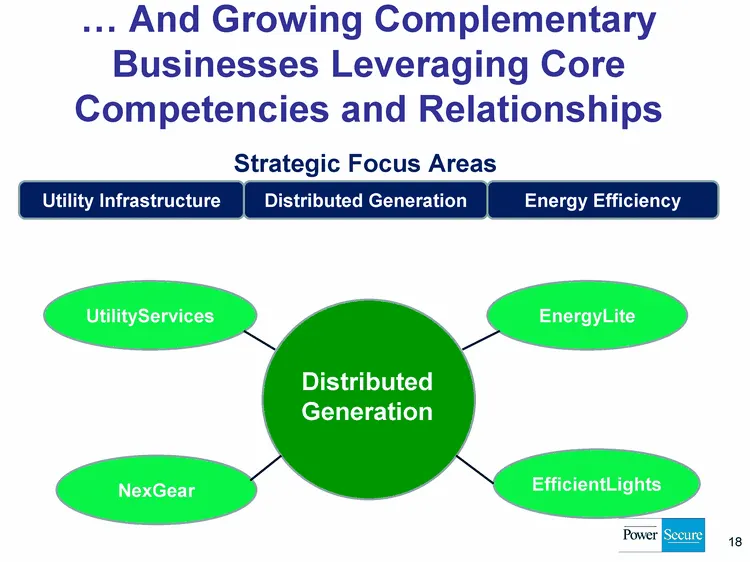
.... And Growing Complementary Businesses Leveraging Core Competencies and Relationships 18 Strategic Focus Areas Distributed Generation EnergyLite EfficientLights Utility Infrastructure Distributed Generation Energy Efficiency UtilityServices NexGear
Slide 19: A Track Record of Profitable Growth
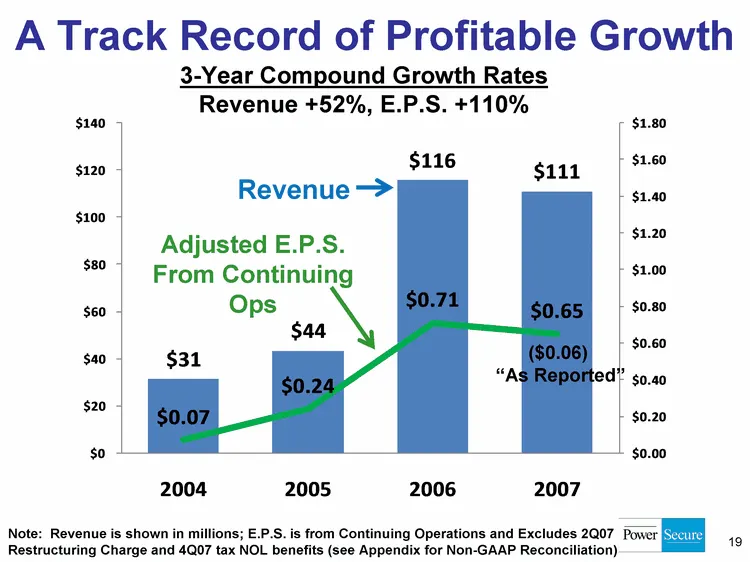
A Track Record of Profitable Growth 19 Note: Revenue is shown in millions; E.P.S. is from Continuing Operations and Excludes 2Q07 Restructuring Charge and 4Q07 tax NOL benefits (see Appendix for Non-GAAP Reconciliation) 3-Year Compound Growth Rates Revenue +52%, E.P.S. +110% Revenue Adjusted E.P.S.
Slide 20: And a Strong Balance Sheet Positions us for the Future
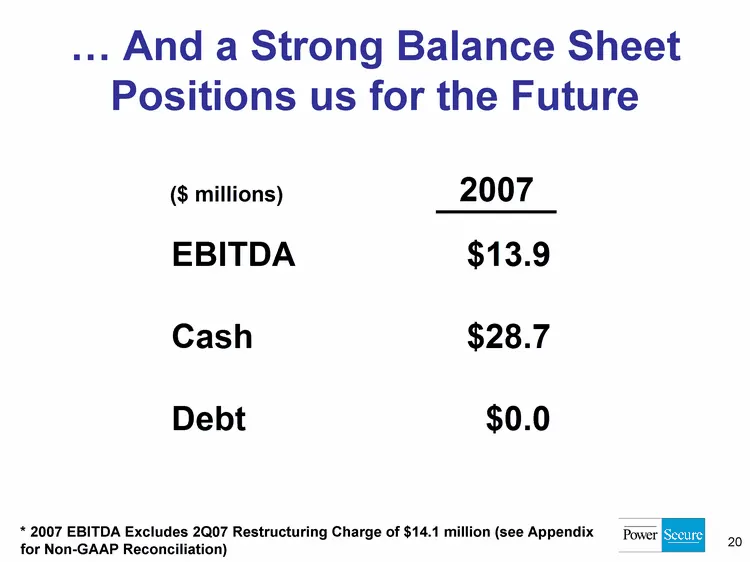
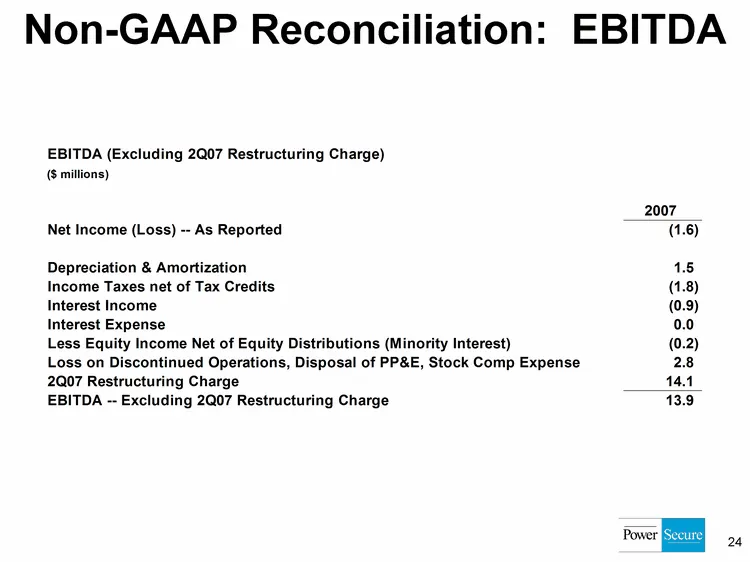
.... And a Strong Balance Sheet Positions us for the Future 20 * 2007 EBITDA Excludes 2Q07 Restructuring Charge of $14.1 million (see Appendix for Non-GAAP Reconciliation)
Slide 21: Our Future is Bright
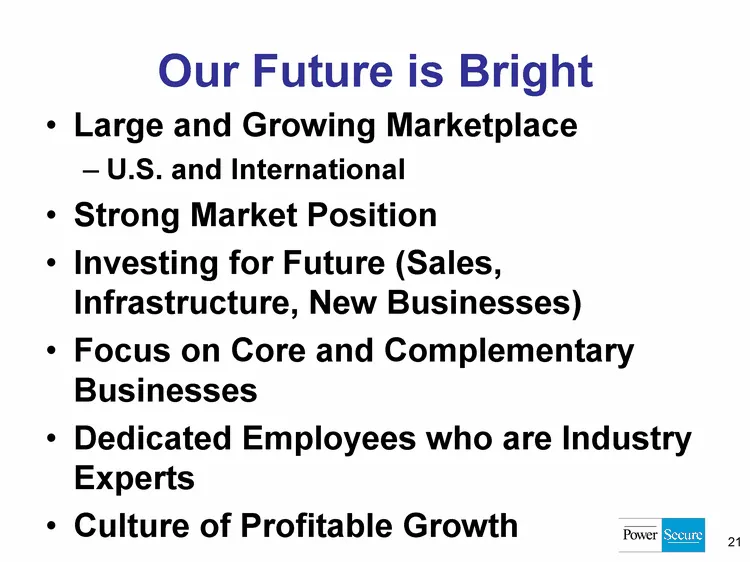
Our Future is Bright Large and Growing Marketplace U.S. and International Strong Market Position Investing for Future (Sales, Infrastructure, New Businesses) Focus on Core and Complementary Businesses Dedicated Employees who are Industry Experts Culture of Profitable Growth 21
Slide 22: Appendix (Non-GAAP Measures)
Appendix (Non-GAAP Measures) 22
Slide 23: Non-GAAP Reconciliation: E.P.S.
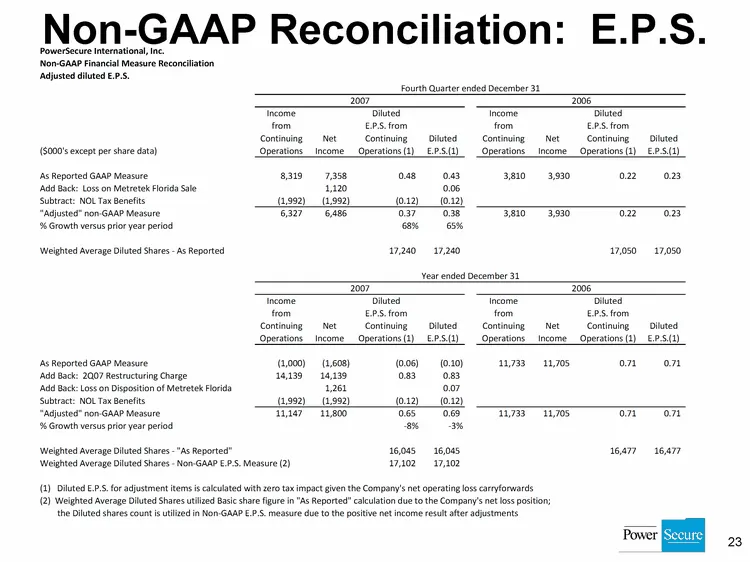
Non-GAAP Reconciliation: E.P.S. 23
Slide 24: Non-GAAP Reconciliation: EBITDA
Non-GAAP Reconciliation: EBITDA 24
Slide 25: Non-GAAP Measures
Non-GAAP Measures References by the Company to "Adjusted E.P.S.", and the other "Adjusted" non-GAAP measures of income or loss from continuing operations, net income, diluted E.P.S. from continuing operations, and diluted E.P.S. in this presentation constitute non-GAAP financial measures. They refer
Source: SEC EDGAR · 8-K filed Mar 25, 2008
More decks from PowerSecure International Inc
 Investor Presentation (January 2016)19 slides · Jan 13, 2016
 Q3 2015 Earnings Presentation19 slides · Nov 9, 2015
 Investor Presentation (September 2015)19 slides · Sep 2, 2015
 Investor Presentation (August 2015)16 slides · Aug 10, 2015
 Investor Presentation (May 2015)21 slides · May 26, 2015
 Investor Presentation (May 2015)18 slides · May 6, 2015