PowerSecure International — Investor Presentation (September 2015)
19 slides from PowerSecure International's investor presentation, Sep 2, 2015
Slide 1: September 2015
1 Exhibit 99.2 September 2015
Slide 2: Forward-Looking Statements Safe Harbor
2 Forward-Looking Statements Safe Harbor All forward-looking statements made or referred to in this presentation are made under the safe harbor provisions of the Private Securities Litigation Reform Act of 1995. Forward-looking statements, which are all statements other than statements of historical
Slide 3: Who We Are
3 POWR Q2 year-over- year revenue growth > 900 employees Focused on Operational Excellence Strong balance sheet $333 million Trailing 12 month revenues Headquarters: Wake Forest, NC $468 million Record backlog Record 2 nd Quarter revenues of $107.2 million Who We Are 88%
Slide 4: Where We Have Been: Building and Growing our Business
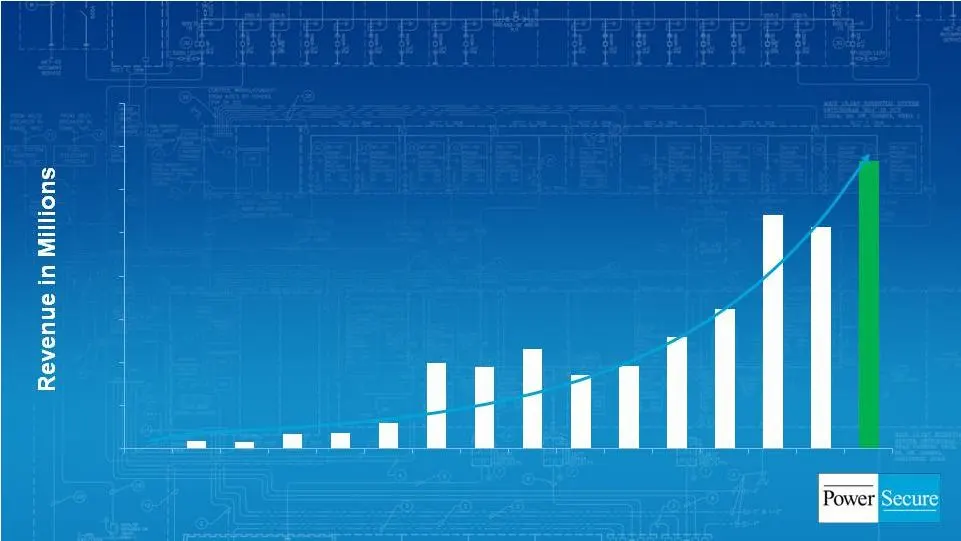
4 Where We Have Been: Building and Growing our Business 0 50 100 150 200 250 300 350 400 2000 2001 2002 2003 2004 2005 2006 2007 2008 2009 2010 2011 2012 2013 2014 TTM Historical (2000-2014) CAGR: 29.4%
Slide 5: Where We Are Now: Solid Q2 Execution
5 Where We Are Now: Solid Q2 Execution • Revenues of $107.2 million (+87.8% y-o-y) • Gross margin of 22.5% (DG: 34.2%, EE: 33.7%) • GAAP EPS of $0.04 • Record backlog grows to $468 million (vs. $349 million at August 2014) • $20.5 million in cash, $20.2 million in term debt and capital leases, nothi
Slide 6: PowerSecure Solutions Across the Grid
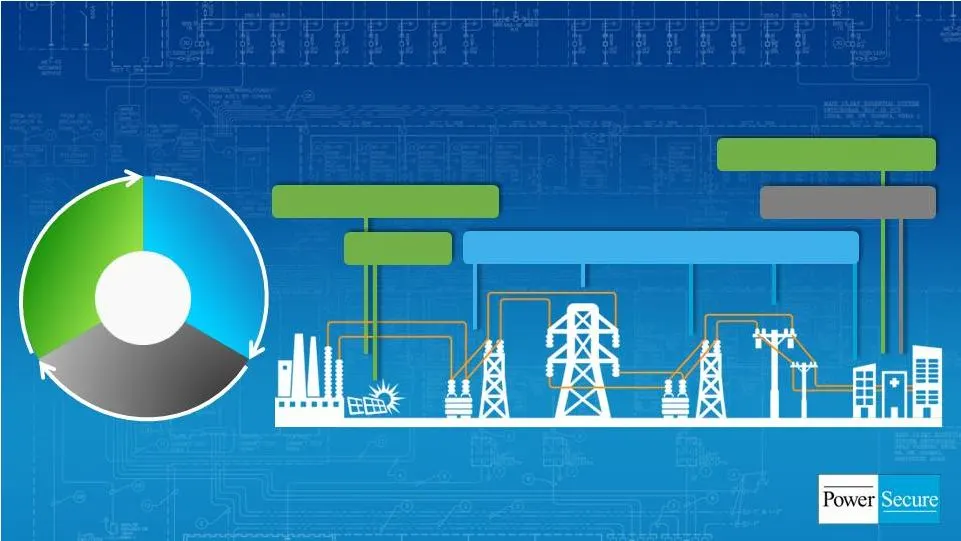
6 PowerSecure Solutions Across the Grid Generation Step-Up Substation Step-Down Substation Transmission Distribution Solar Energy Efficiency Products/Services Utility Infrastructure Solutions Distributed Generation Systems Utility Infrastructure Distributed Generation Energy Efficiency Distributed G
Slide 7: PowerSecure Distributed Generation: Differentiated Solution=Superior Reliability & ROI
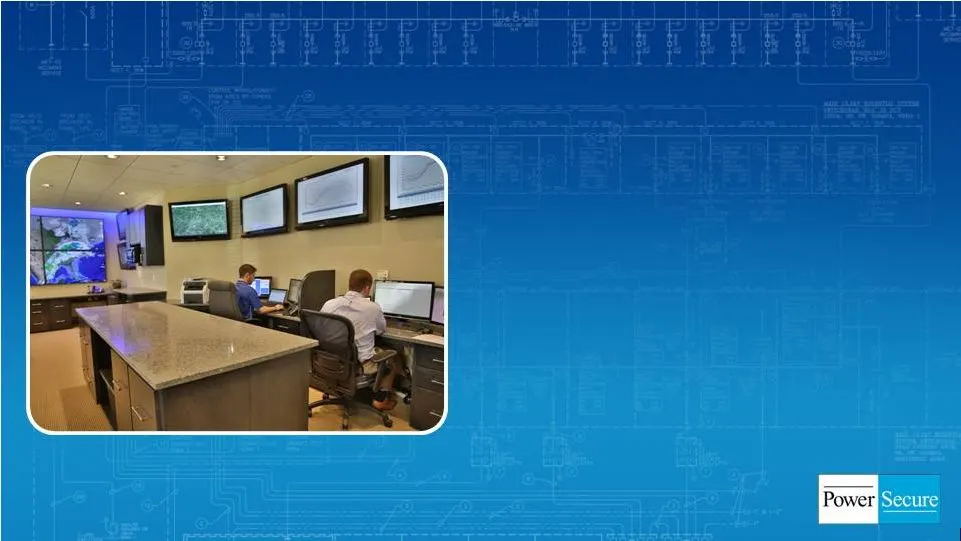
7 PowerSecure Distributed Generation: Differentiated Solution=Superior Reliability & ROI • PowerControl 24/7/365 Command Center monitors all key components, utility grid dynamics and every unit operation • >1500 units deployed nationwide • Proprietary internet-based monitoring, dispatch and control
Slide 8: DG: PowerSecure Manages > 1GW Nationwide
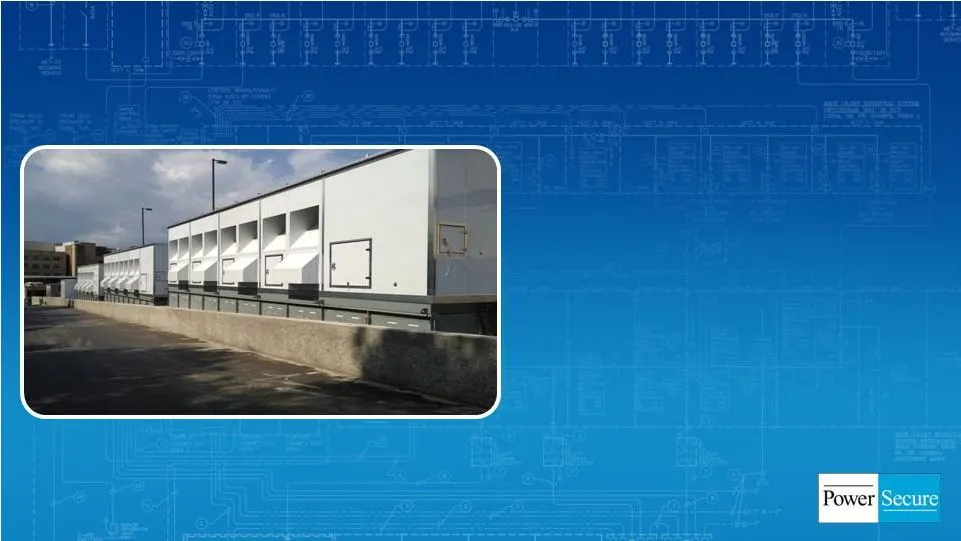
8 DG: PowerSecure Manages > 1GW Nationwide • Proprietary PowerBlock solution drivers higher ROI for customers • 70% bi-fuel capability delivers environmental & economic benefits • 18-24 month sales cycle • Hospital and data center growth drivers with focused sales teams
Slide 9: PowerSecure Delivers: Reliability, Flexibility & Full Scope for Data Centers
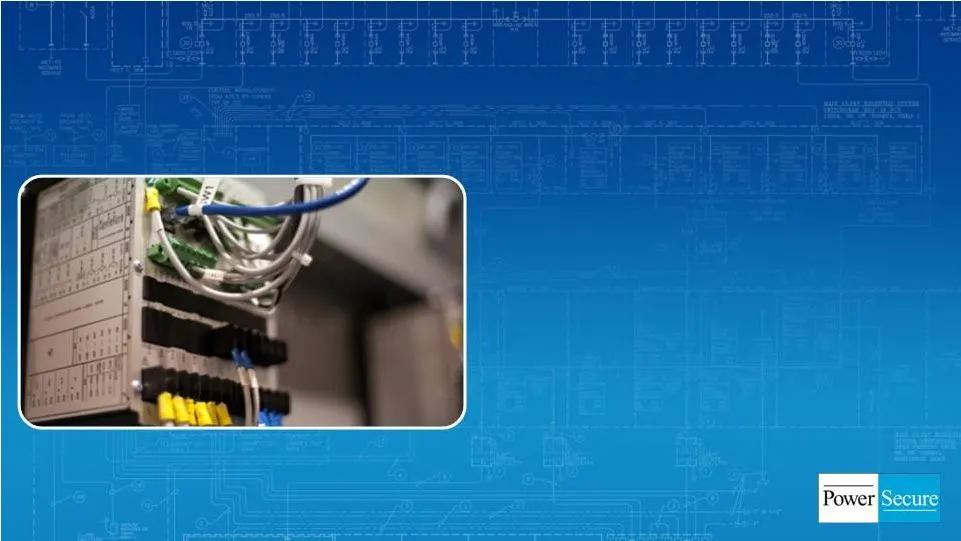
9 PowerSecure Delivers: Reliability, Flexibility & Full Scope for Data Centers • Industry-leading reliability gaining attention from large potential customers • Full turnkey electrical infrastructure, design, implementation and commissioning to data center owners • October 2014 acquisition ($13 M) o
Slide 10: Data Centers = Growing % of DG Revenues
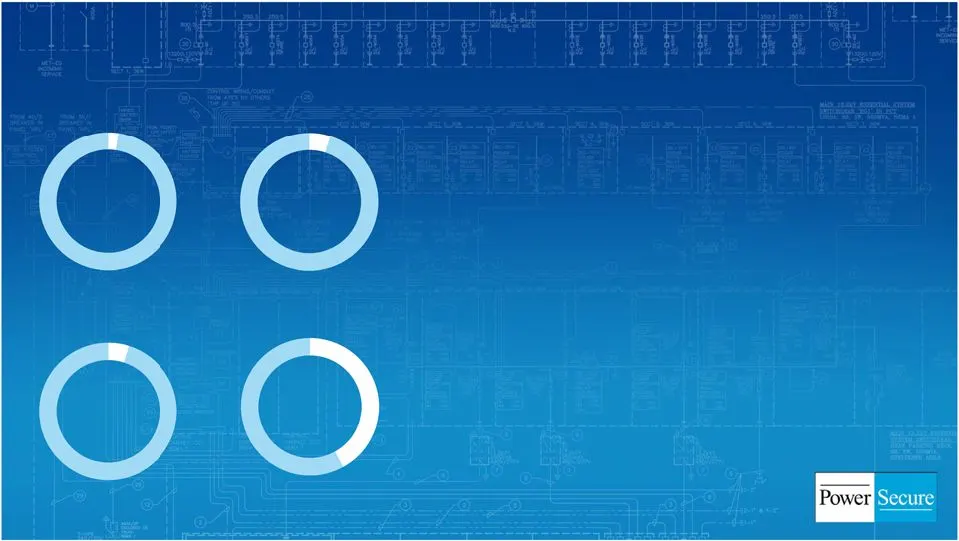
10 Data Centers = Growing % of DG Revenues • 2012-2013: Primarily switchgear • 2014: Switchgear + infrastructure • 2015 Switchgear + infrastructure + backup power • 75% y-o-y DG revenue growth in 1H15 • Increased capacity and new testing facilities at DG manufacturing facility 2012 2014 2013 2015* *
Slide 11: Investing for Growth: Before
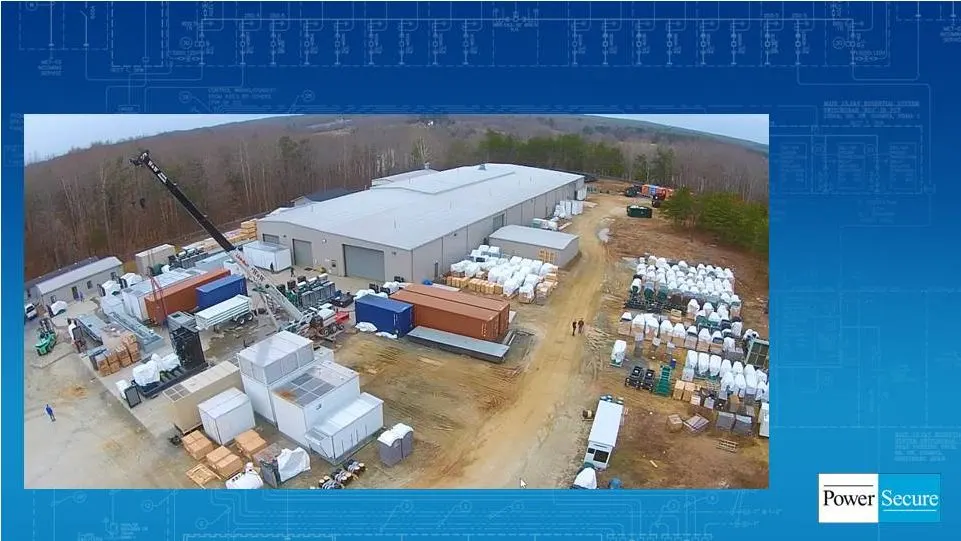
11 Investing for Growth: Before
Slide 12: Investing for Growth: After
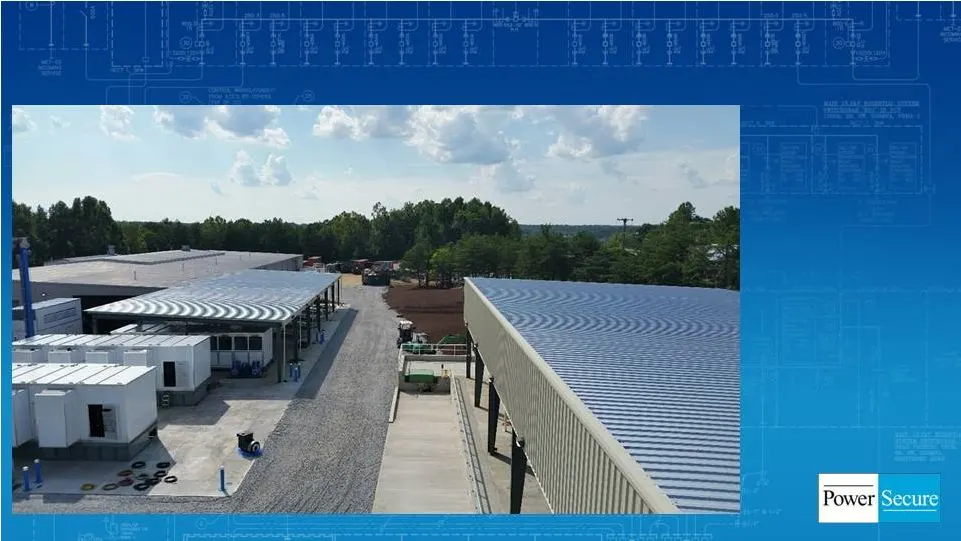
12 Investing for Growth: After
Slide 13: Solar: Positioned to Serve Utilities Now and Post-2017
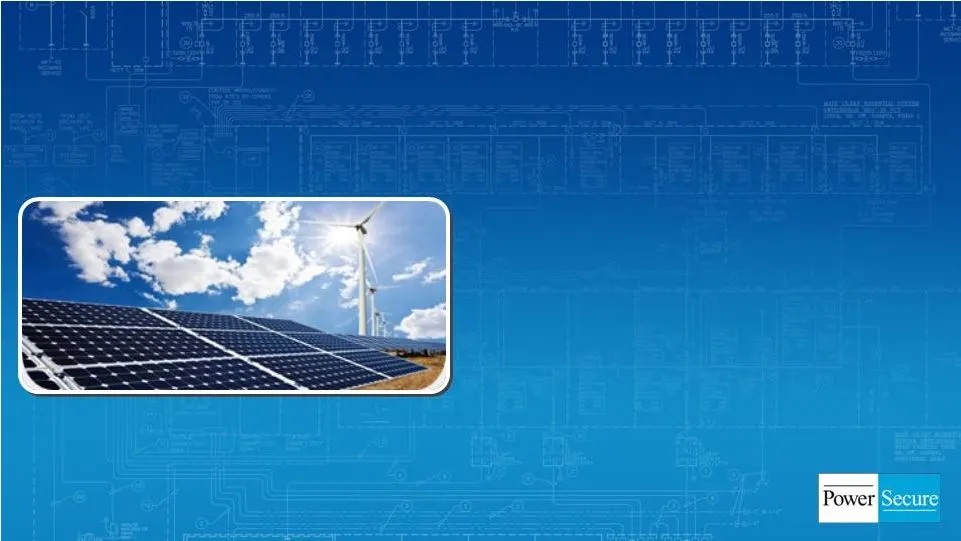
13 Solar: Positioned to Serve Utilities Now and Post-2017 • Purchased solar business for $4M in June 2012 • + $240 M to backlog since mid-2014 - Includes >$200M w/large IOUs • Accretive to net income & EPS • In-house turnkey EPC capability • Focused on large utility opportunities • Strategic offerin
Slide 14: Utility Infrastructure: Direct Service to our Customers
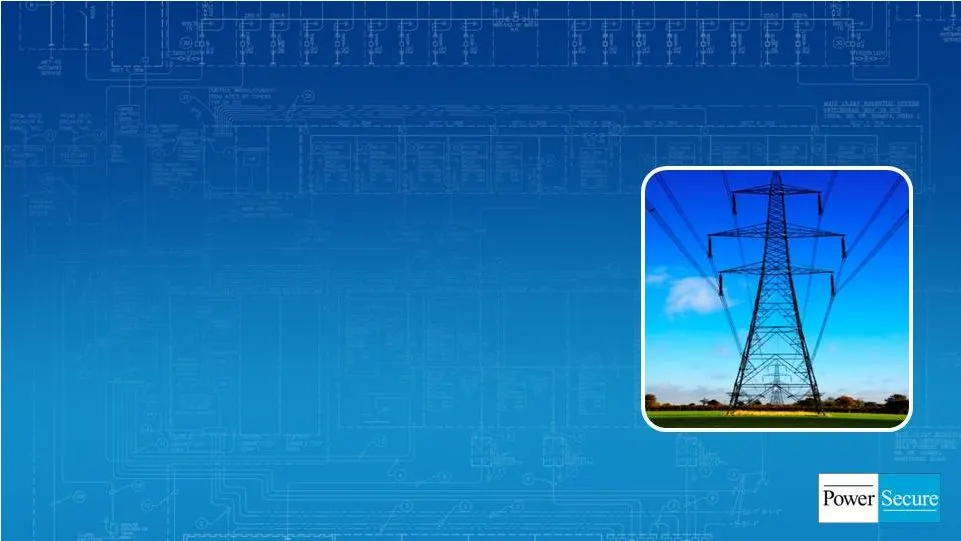
14 Utility Infrastructure: Direct Service to our Customers • Full turnkey electrical infrastructure, design, implementation & commissioning to data center owners • T&D maintenance and construction • Substation products and services • Advanced metering and lighting installation • Storm repair and res
Slide 15: Energy Efficiency: LED Solutions
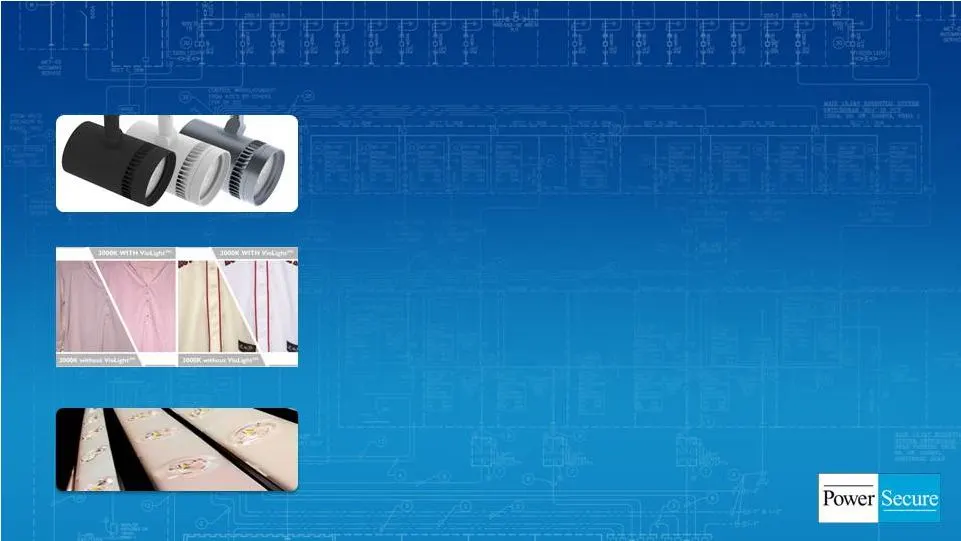
15 Energy Efficiency: LED Solutions • Department store/high-end retail lighting – Proprietary technology provides: superior light output, thermal management, optics, aesthetics • Utility lighting – Utilities/municipalities : millions of potential endpoints – Energy/maintenance savings drive payback
Slide 16: Energy Efficiency Services: ESCO's, Utilities and Retailers
16 Energy Efficiency Services: ESCO’s, Utilities and Retailers • Lighting, mechanical, water and building envelope solutions deliver savings to customers • Adds value for customers bidding federal performance contracts • Full scope from audit/engineering through implementation/commissioning and veri
Slide 17: Where We Are Going: 2015 Focus Areas
17 Where We Are Going: 2015 Focus Areas 1. Relentless pursuit of operational excellence in everything we do 2. Expand our operating margins to drive EPS in 2015 and beyond 3. Grow pipeline of opportunities for 2016 and convert them to backlog
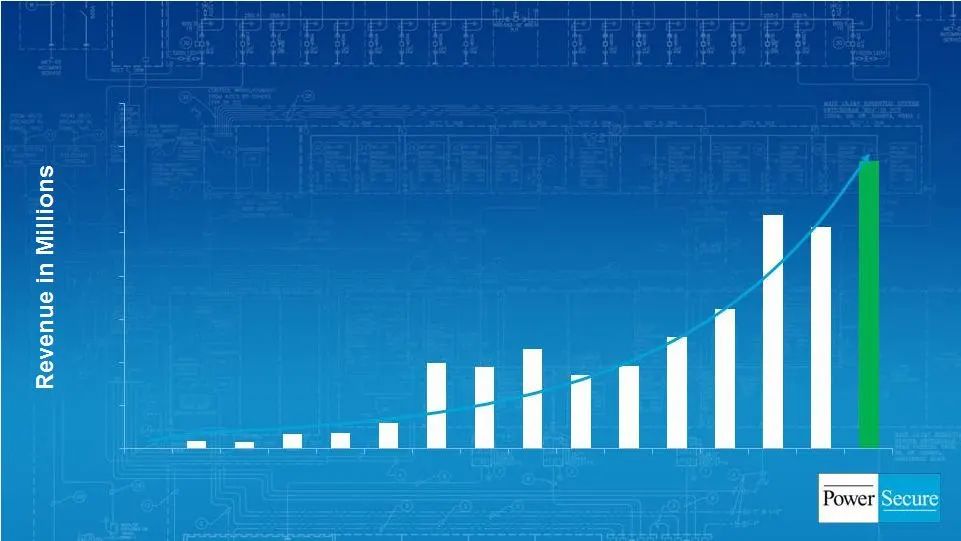
Slide 18: Where We Have Been: Building and Growing our Business
18 Where We Have Been: Building and Growing our Business 0 50 100 150 200 250 300 350 400 2000 2001 2002 2003 2004 2005 2006 2007 2008 2009 2010 2011 2012 2013 2014 TTM Historical (2000-2014) CAGR: 29.4%
Slide 19: 19
19
Source: SEC EDGAR · 8-K filed Sep 2, 2015
More decks from PowerSecure International Inc
 Investor Presentation (January 2016)19 slides · Jan 13, 2016
 Q3 2015 Earnings Presentation19 slides · Nov 9, 2015
 Investor Presentation (August 2015)16 slides · Aug 10, 2015
 Investor Presentation (May 2015)21 slides · May 26, 2015
 Investor Presentation (May 2015)18 slides · May 6, 2015
 Investor Presentation (March 2015)15 slides · Mar 9, 2015