PowerSecure International — Investor Presentation (August 2015)
16 slides from PowerSecure International's investor presentation, Aug 10, 2015
Slide 1: August 2015
1 Exhibit 99.2 August 2015
Slide 2: Forward-Looking Statements Safe Harbor
Forward-Looking Statements Safe Harbor– All forward-looking statements made or referred to in this presentation are made under the safe harbor provisions of the Private Securities Litigation Reform Act of 1995. Forward-looking statements, which are all statements other than statements of historical
Slide 3: Who We Are
3 POWR Q2 year-over- year revenue growth > 800 employees Focused on Operational Excellence Strong balance sheet $333 million Trailing 12 month revenues Headquarters: Wake Forest, NC $468 million Record backlog Record 2 nd Quarter revenues of $107.2 million Who We Are 88%
Slide 4: Where We Have Been: Building and Growing our Business
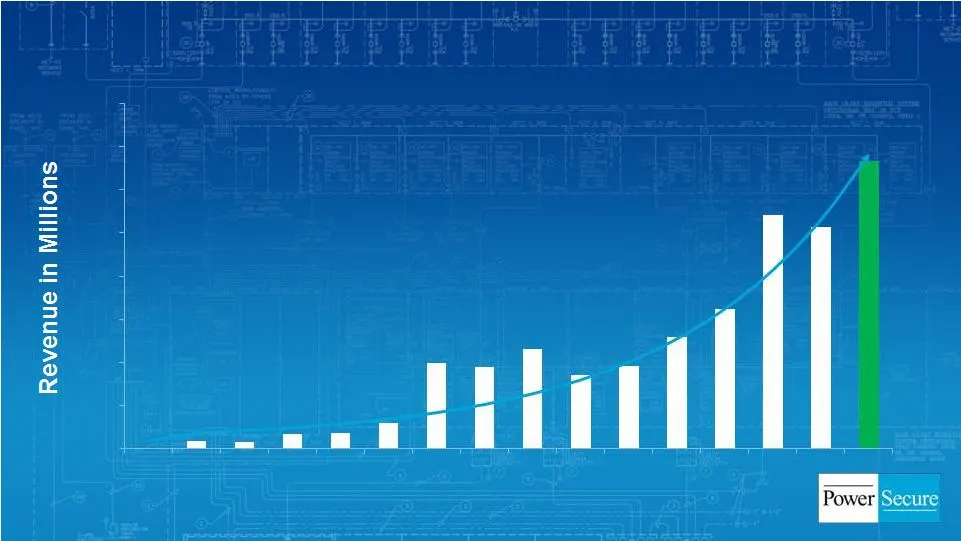
4 Where We Have Been: Building and Growing our Business 0 50 100 150 200 250 300 350 400 2000 2001 2002 2003 2004 2005 2006 2007 2008 2009 2010 2011 2012 2013 2014 TTM Historical CAGR: 29.4%
Slide 5: Where We Are Now: Solid Q2 Execution
Where We Are Now: Solid Q2 Execution • Revenues of $107.2 million (+87.8% y-o-y) • Gross margin of 22.5% (DG: 34.2%, EE: 33.7%) • GAAP EPS of $0.04 • Record backlog grows to $468 million (vs. $349 million at August 2014) • $20.5 million in cash, $20.2 million in term debt and capital leases, nothing
Slide 6: PowerSecure Solutions Across the Grid
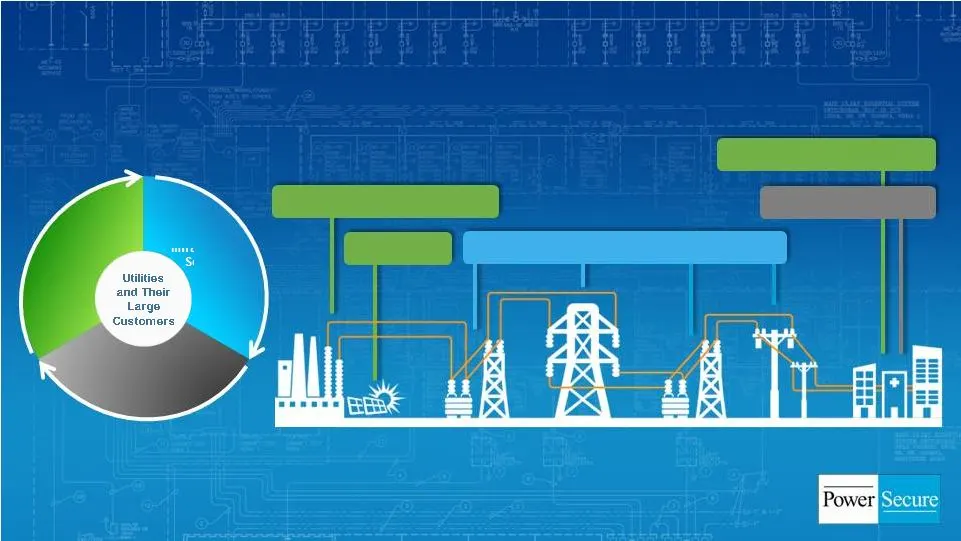
6 PowerSecure Solutions Across the Grid Generation Step-Up Substation Step-Down Substation Transmission Distribution Solar EPC Utility Infrastructure Distributed Generation Energy Efficiency Distributed Generation Consumption Energy Efficiency Products/Services Utility Infrastructure Solutions Distr
Slide 7: DG: Hospital & Data Center Growth Drivers
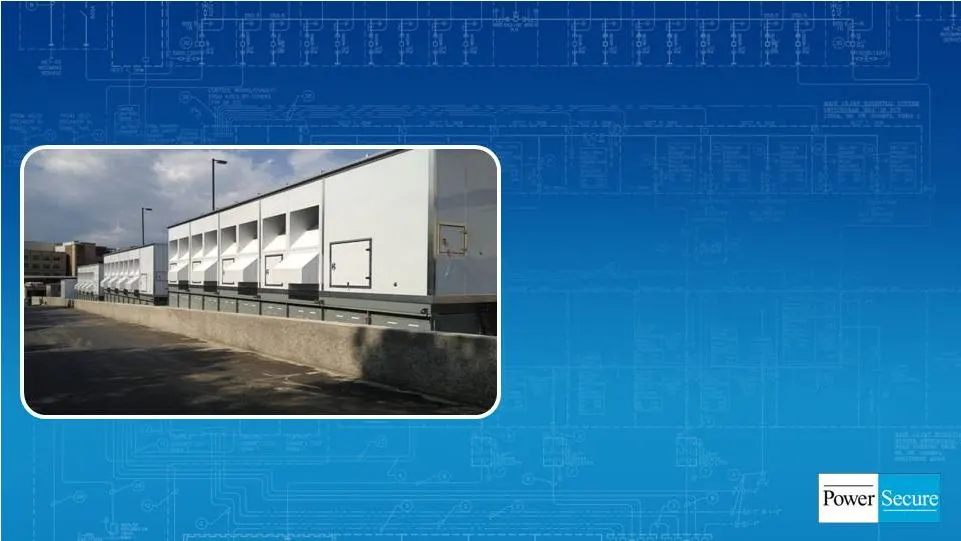
7 • Focused hospital and data center sales teams • Proprietary PowerBlock solution drivers higher ROI for customers • Manage >1 GW nationwide • 70% bi-fuel capability delivers environmental & economic benefits • 18-24 month sales cycle • Acquisition expands data center capabilities DG: Hospital & Da
Slide 8: Acquisitions Add Value: Data Center
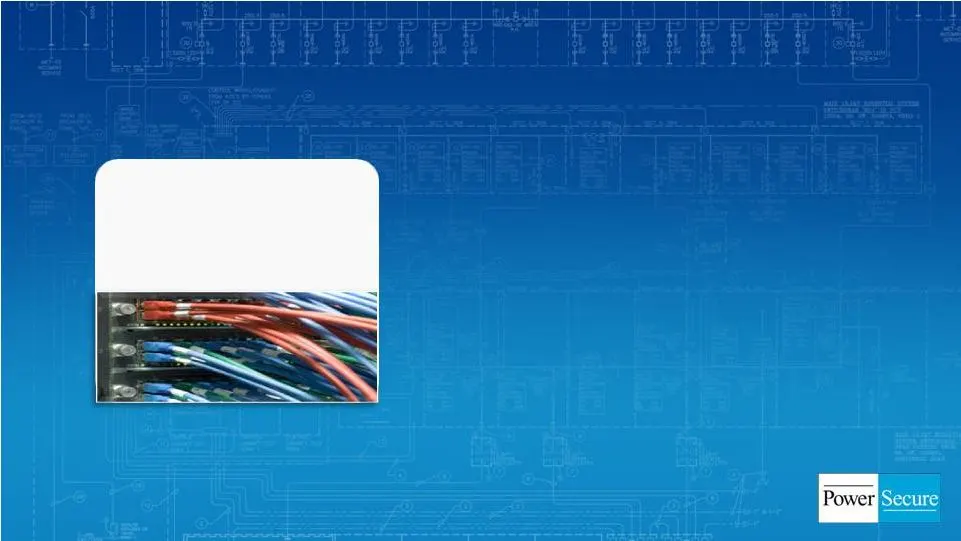
8 • Full turnkey electrical infrastructure, design, implementation and commissioning to data center owners • Established market leader • Speeds access to key data center decision makers • Nearly $9M in Q1 2015 revenues Acquisitions Add Value: Data Center Purchased for $13M in October 2014
Slide 9: Utility Infrastructure: Direct Service to our Customers
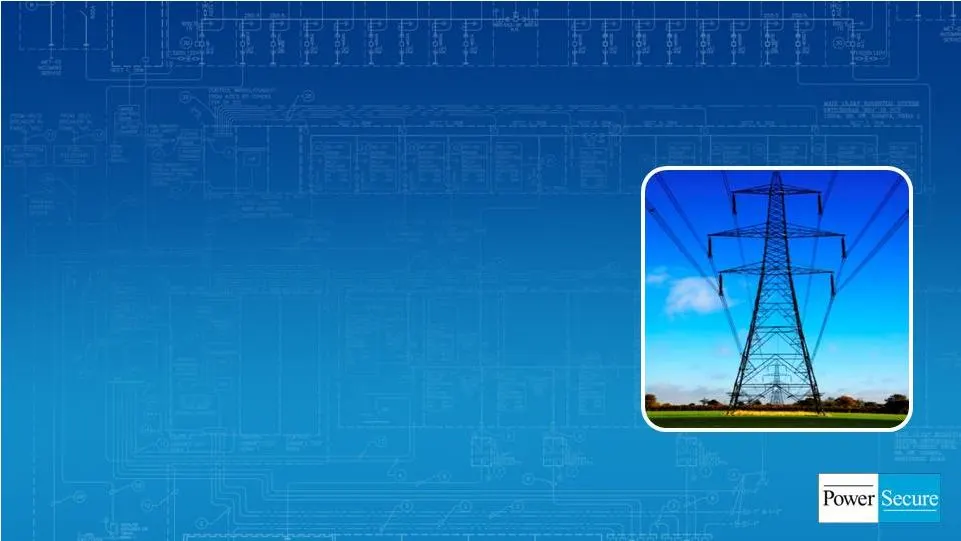
Utility Infrastructure: Direct Service to our Customers • Full turnkey electrical infrastructure, design, implementation & commissioning to data center owners • T&D maintenance and construction • Substation products and services • Advanced metering and lighting installation • Storm repair and restor
Slide 10: Energy Efficiency: LED Solutions
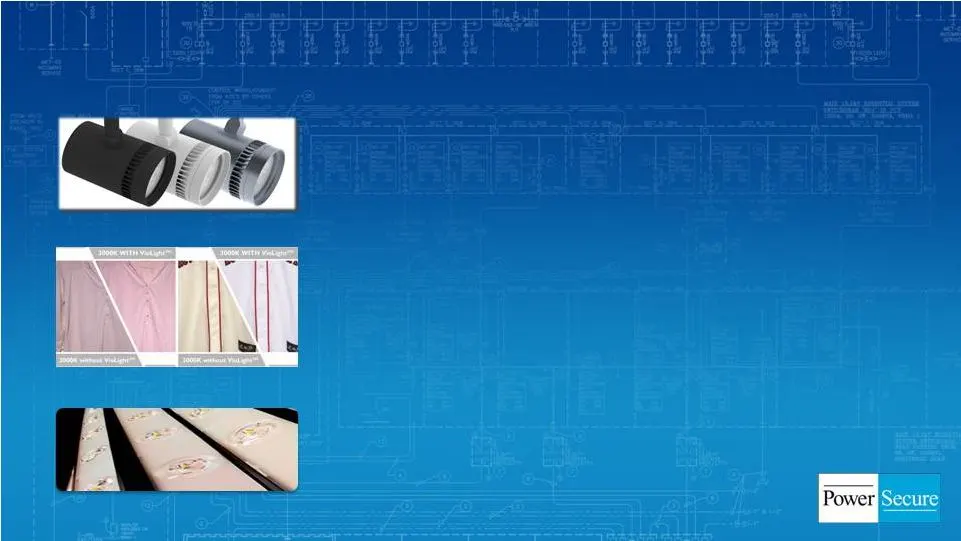
Energy Efficiency: LED Solutions • Department store/high-end retail lighting – Solais product line adds new customers • Utility lighting – Utilities and municipalities – Energy and maintenance savings drive payback – Opportunity: millions of lights across U.S. • Grocery, drug, and convenience stores
Slide 11: Acquisitions Add Value: Solais
11 Acquisitions Add Value: Solais • Significant sourcing and manufacturing expertise • Adding substantial efficiencies to manufacturing of PowerSecure’s existing LED solutions • Gross margins have expanded >10pp • Outstanding proprietary portfolio of LED lamps and fixtures for C&I applications • Sup
Slide 12: Acquisitions Add Value: Energy Efficiency Services
12 Acquisitions Add Value: Energy Efficiency Services • Serve super-ESCOs with lighting, mechanical, water and building envelope solutions to deliver savings • Added retail capability in 2014 • Opens new customer channels for DG and LED lighting solutions Paid ~$6M for EES capabilities in 2013/14
Slide 13: Acquisitions Add Value: Solar
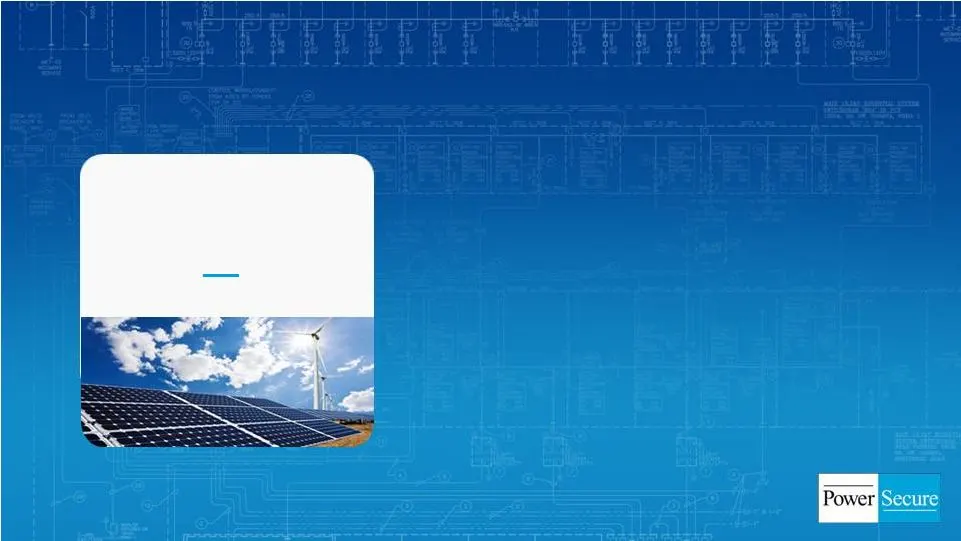
13 Acquisitions Add Value: Solar • + $240 M to backlog since mid-2014 - Includes >$200M w/large IOUs • Accretive to net income & EPS • In-house turnkey EPC capability • Strategic offering integrated into microgrid solutions Purchased solar business for $ 4M in June 2012
Slide 14: Where We Are Going: 2015 Focus Areas
14 Where We Are Going: 2015 Focus Areas 1. Relentless pursuit of operational excellence in everything we do 2. Expand our operating margins to drive EPS in 2015 and beyond 3. Grow pipeline of opportunities for 2016 and convert them to backlog
Slide 15: Where We Are Going: Building and Growing our Business
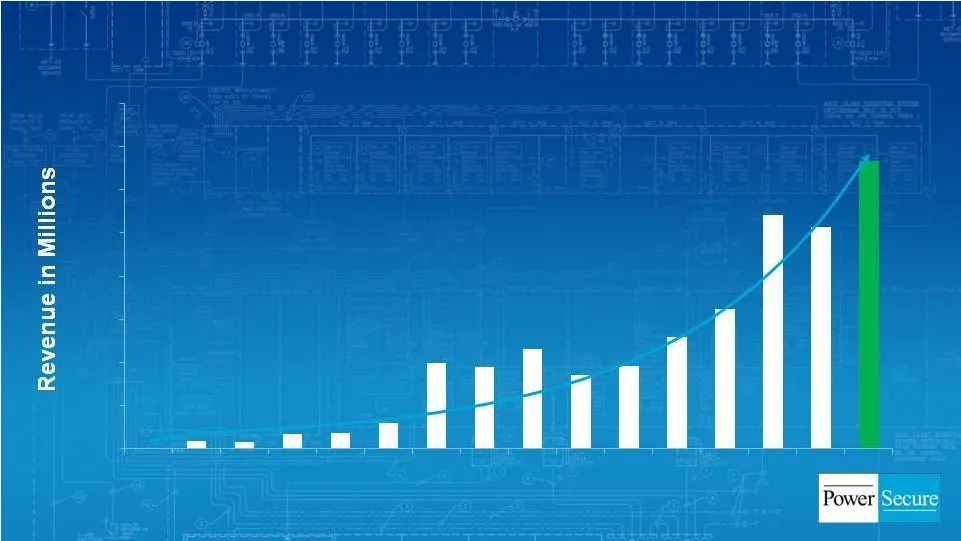
15 Where We Are Going: Building and Growing our Business 0 50 100 150 200 250 300 350 400 2000 2001 2002 2003 2004 2005 2006 2007 2008 2009 2010 2011 2012 2013 2014 TTM Historical CAGR: 29.4%
Slide 16: 16
16
Source: SEC EDGAR · 8-K filed Aug 10, 2015
More decks from PowerSecure International Inc
 Investor Presentation (January 2016)19 slides · Jan 13, 2016
 Q3 2015 Earnings Presentation19 slides · Nov 9, 2015
 Investor Presentation (September 2015)19 slides · Sep 2, 2015
 Investor Presentation (May 2015)21 slides · May 26, 2015
 Investor Presentation (May 2015)18 slides · May 6, 2015
 Investor Presentation (March 2015)15 slides · Mar 9, 2015