PowerSecure International — Investor Presentation (November 2014)
15 slides from PowerSecure International's investor presentation, Nov 19, 2014
Slide 1: November 2014
November 2014 Exhibit 99.2

Slide 2: Forward-Looking Statements
Forward-Looking Statements Safe Harbor– All forward-looking statements made or referred to in this presentation are made under the safe harbor provisions of the Private Securities Litigation Reform Act of 1995. Forward-looking statements, which are all statements other than statements of historical
Slide 3: PowerSecure: Who We Are Today
NYSE: POWR Record Backlog: $360M (50% YoY Growth) >700 Employees Growing Markets & differentiated solutions Strong Balance Sheet TTM Revenues: $248M Headquarters: Wake Forest, NC PowerSecure: Who We Are Today

Slide 4: Solid Q3 Execution
Revenues of $65.0 million (vs. guidance of $62-$67 million) Gross margin of 27.8% (vs. guidance of 22-24%) GAAP EPS of ($0.02) (vs. guidance of ($0.10)-($0.03)) Record backlog grows to $360 million (vs. $240 million at Nov 2013) $43.9 million in cash, $23.7 million in term debt and capital leases, n
Slide 5: PowerSecure: Utility Focused
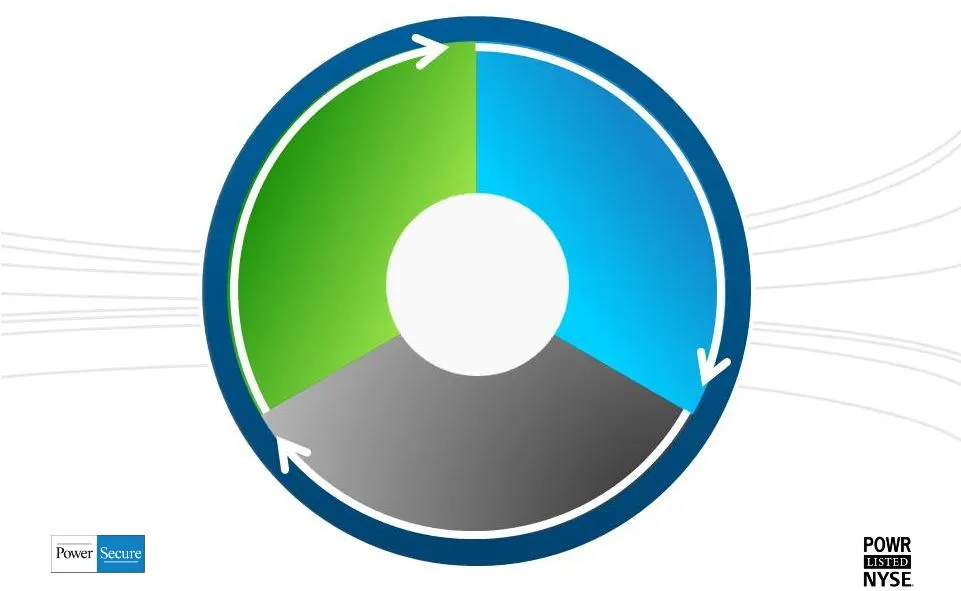
Energy Efficiency Products/Services Utility Infrastructure Solutions Distributed Generation Systems PowerSecure: Utility Focused Utilities and Their Large Customers
Slide 6: PowerSecure Distributed Generation: Differentiated Solution=Superior Reliability & ROI
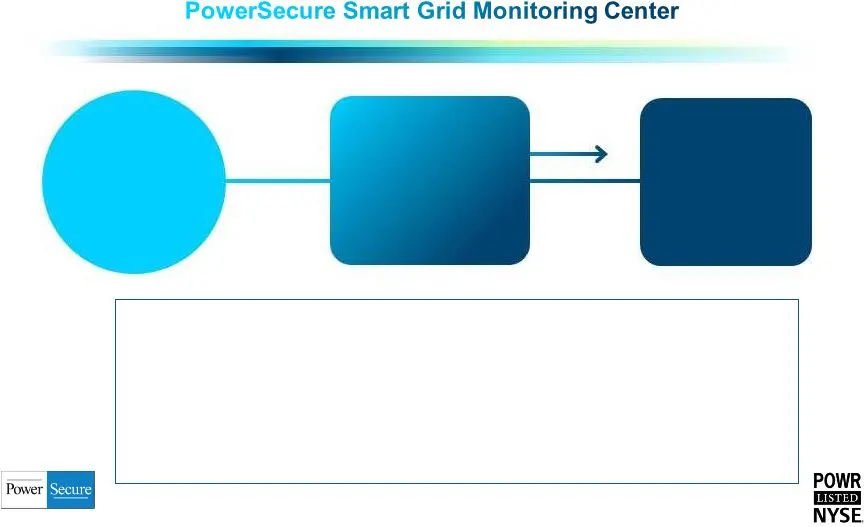
Electric Utility Interactive Distributed Generation ® System Customer Facility PowerSecure Distributed Generation: Differentiated Solution=Superior Reliability & ROI 24/7 monitoring: standby and peak shaving Proprietary internet-based monitoring, dispatch and control “No Pain” demand response 98.2%
Slide 7: DG: Hospital & Data Center Growth Drivers
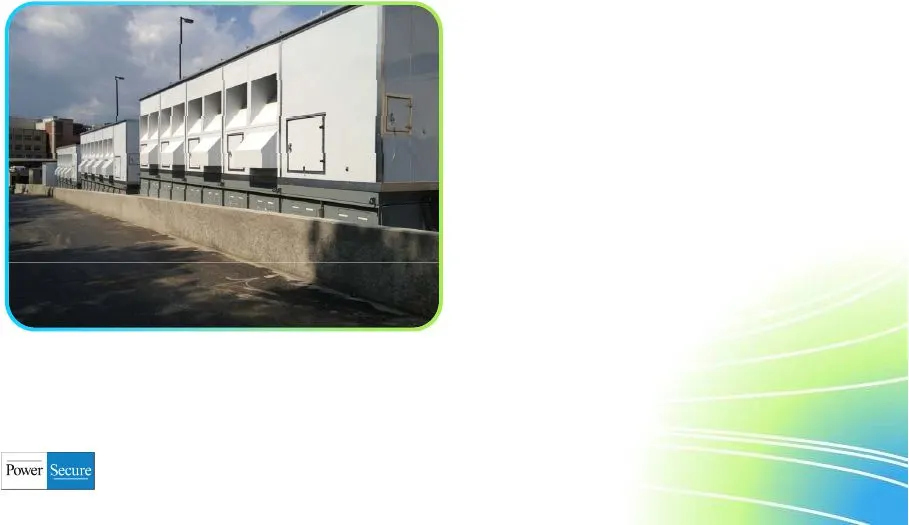
DG: Hospital & Data Center Growth Drivers Focused hospital and data center sales teams Proprietary PowerBlock solution drivers higher ROI for customers 70% bi-fuel capability delivers environmental & economic benefits 18-24 month sales cycle Mission critical acquisition expands data center capabilit
Slide 8: PDI Acquisition Enhances Data Center Team
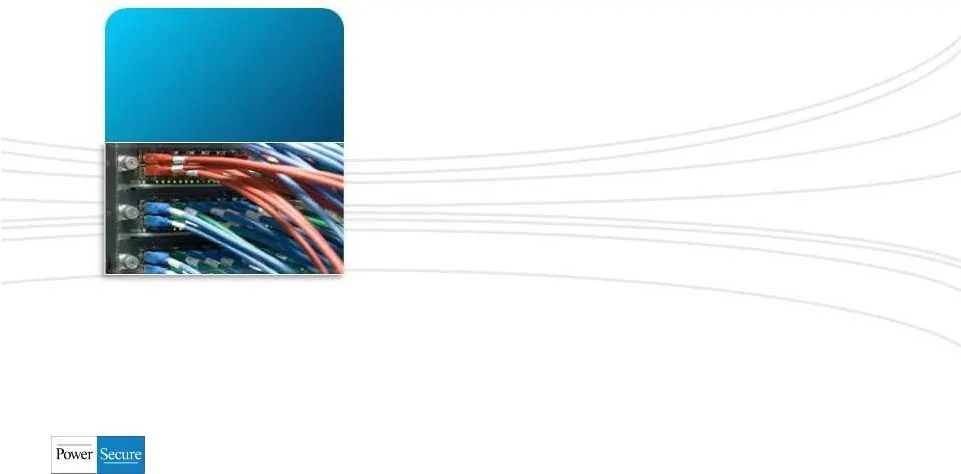
Purchased for $13M in October 2014 Full turnkey electrical infrastructure, design, implementation and commissioning to data center owners. Established market leader $24M in TTM revenue, generating $7.8M in operating income (unaudited) Anticipated to be slightly dilutive in Q4 2014, meaningfully accr
Slide 9: Integrated Solar Capability
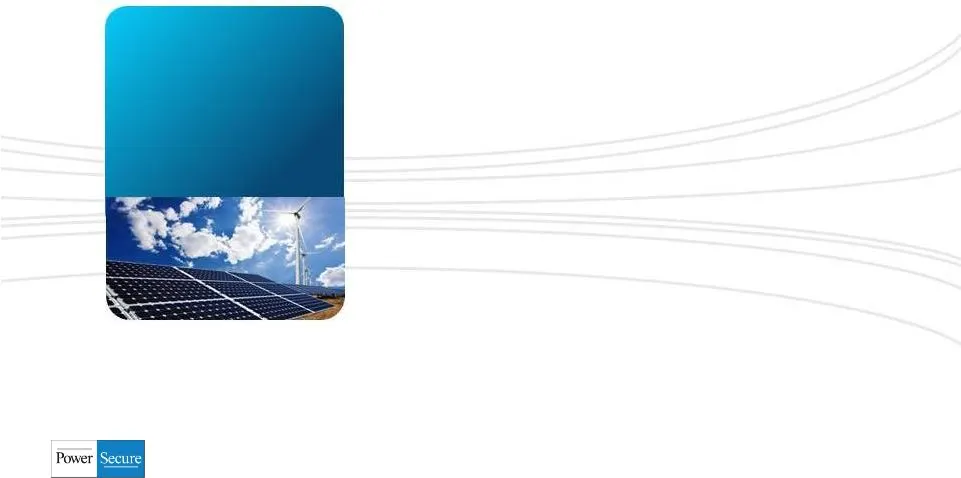
Purchased solar business for $4M in June 2012 In-house turnkey EPC capability Strategic offering integrated into microgrid solutions $120M in utility scale solar projects announced in July 2014 - Two $60M projects with one of largest IOUs in U.S. - Accretive to net income & EPS Integrated Solar Capa
Slide 10: Utility Infrastructure: Direct Service to our Utility Customers
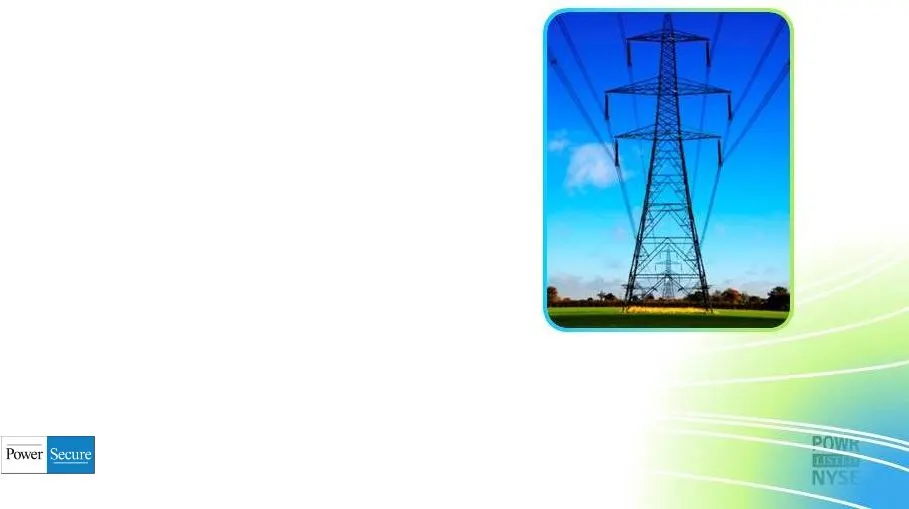
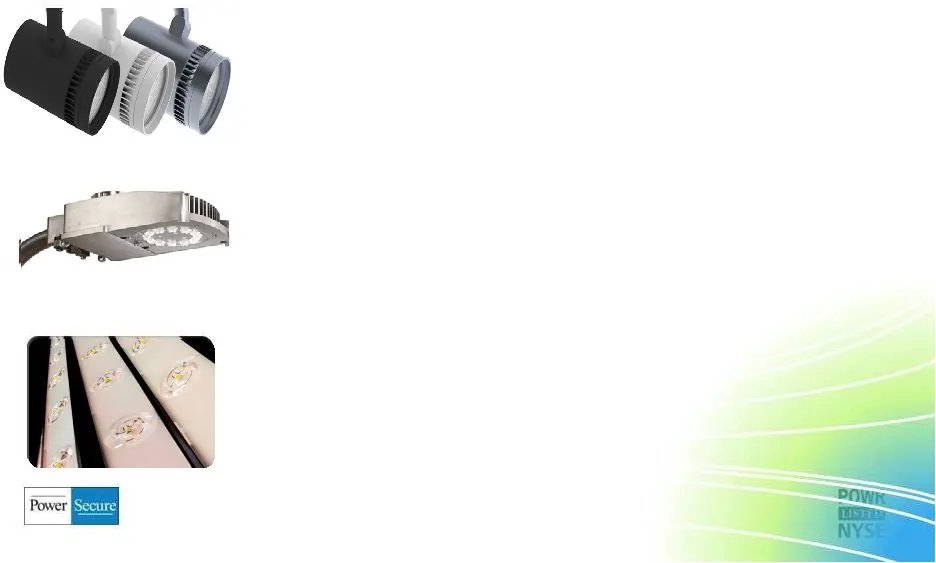
T&D maintenance and construction Substation products and services Advanced metering and lighting installation Storm repair and restoration Utility engineering and design Regulatory consulting and rate design Cyber security and NERC-CIP compliance consulting services Utility Infrastructure: Direct Se
Slide 11
Slide 12: Solais Acquisition Adds Value
Purchased Solais lighting business for $15 M April 2013 Solais Acquisition Adds Value Significant sourcing and manufacturing expertise Adding substantial efficiencies to manufacturing of PowerSecure’s existing LED solutions Q3 2014 LED gross margin: 39.2% = +13 percentage points y-o-y Outstanding pr
Slide 13: Energy Efficiency Services
Serve major energy services companies (ESCO) with lighting, mechanical, water and building envelope solutions to deliver energy efficiency savings Delivered $2.3M in profit in 2013 (following March 2013 acquisition) Opens new customer channels for DG and LED lighting solutions Recently sold 1 st DG
Slide 14: PowerSecure: Utility Focused
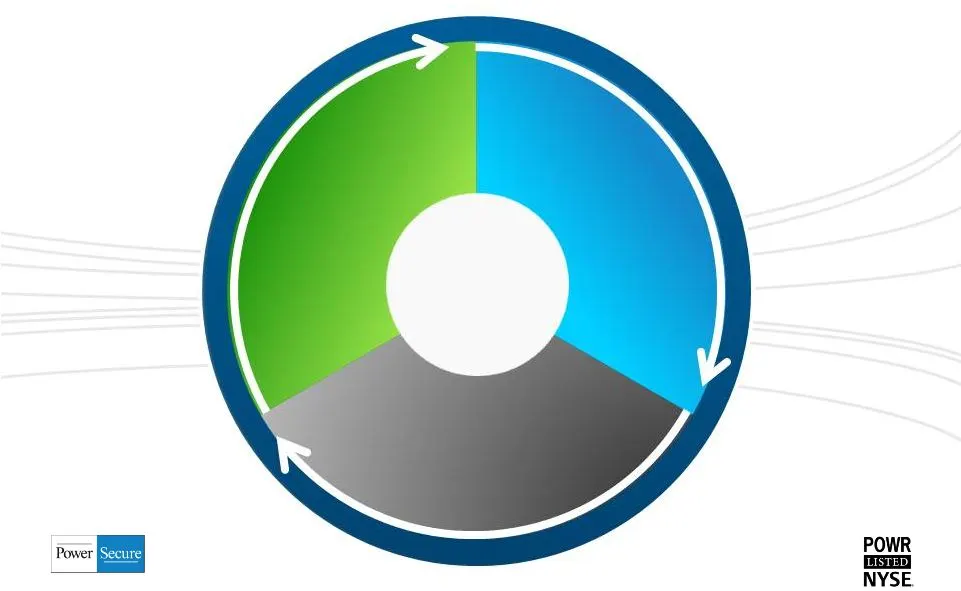
Energy Efficiency Products/Services Utility Infrastructure Solutions Distributed Generation Systems PowerSecure: Utility Focused Utilities And Their Large Customer
Slide 15: Thank you
Thank you
Source: SEC EDGAR · 8-K filed Nov 19, 2014
More decks from PowerSecure International Inc
 Investor Presentation (January 2016)19 slides · Jan 13, 2016
 Q3 2015 Earnings Presentation19 slides · Nov 9, 2015
 Investor Presentation (September 2015)19 slides · Sep 2, 2015
 Investor Presentation (August 2015)16 slides · Aug 10, 2015
 Investor Presentation (May 2015)21 slides · May 26, 2015
 Investor Presentation (May 2015)18 slides · May 6, 2015