Retail Properties of America Inc
Retail Properties of America — Inland Western Retail Real Estate Trust — Q2 2010 Earnings Presentation
24 slides from Retail Properties of America's earnings presentation, Sep 16, 2010
Slide 1: Inland Western Retail Real Estate Trust Second Quarter 2010 Update
INLAND WESTERN Retail Real Estate Trust, Inc. Second Quarter 2010 Update
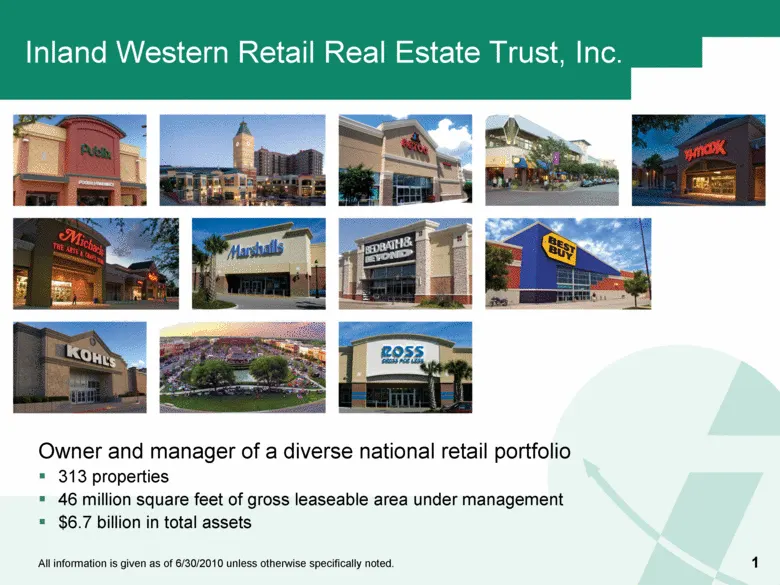
Slide 2: Owner and manager of a diverse national retail portfolio
Inland Western Retail Real Estate Trust, Inc. 1 Owner and manager of a diverse national retail portfolio 313 properties 46 million square feet of gross leaseable area under management $6.7 billion in total assets All information is given as of 6/30/2010 unless otherwise specifically noted.
Slide 3: Strategic Business Plan
Strategic Business Plan 2 Diversify portfolio geographically by tenant base and by retail property type to reduce risk Maintain asset management focus throughout property ownership - including regular review of opportunities as well as monitoring tenant credit, risk and exposure Strengthen the balan
Slide 4: 2010 Goals and Initiatives
2010 Goals and Initiatives 3 Complete the refinancing of 2010 maturing debt Execute new leases and renewals to achieve 90% leased rate1 by year-end with stabilizing average base rents Generate operating cash flows of $200 million for the year Seek to position company for future growth Leased rate in
Slide 5: 2010 Accomplishments
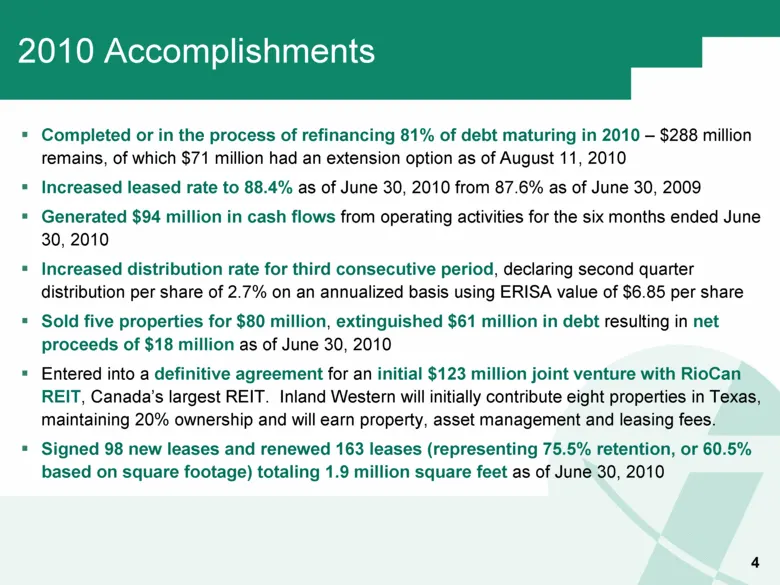
2010 Accomplishments 4 Completed or in the process of refinancing 81% of debt maturing in 2010 – $288 million remains, of which $71 million had an extension option as of August 11, 2010 Increased leased rate to 88.4% as of June 30, 2010 from 87.6% as of June 30, 2009 Generated $94 million in cash fl
Slide 6: Financial Update
5 FINANCIAL UPDATE
Slide 7: Refinancing and Balancing Debt Maturities
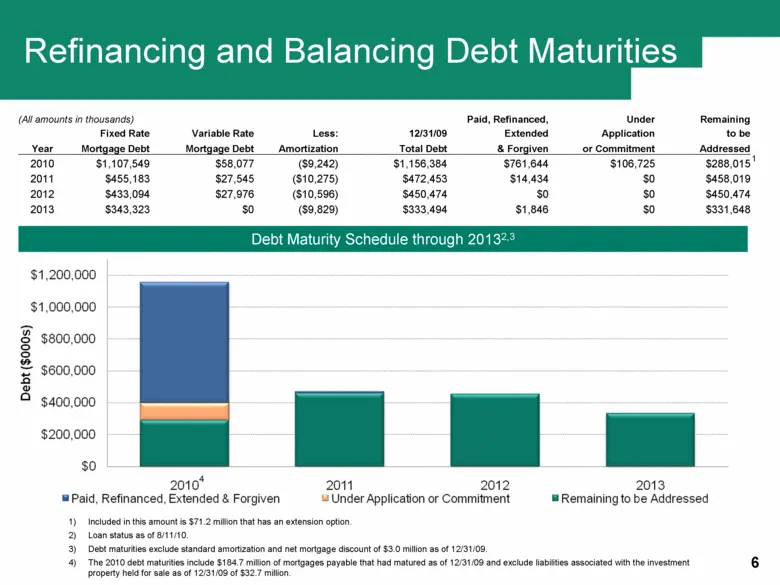
Refinancing and Balancing Debt Maturities Included in this amount is $71.2 million that has an extension option. Loan status as of 8/11/10. Debt maturities exclude standard amortization and net mortgage discount of $3.0 million as of 12/31/09. The 2010 debt maturities include $184.7 million of mortg
Slide 8: Financial Highlights
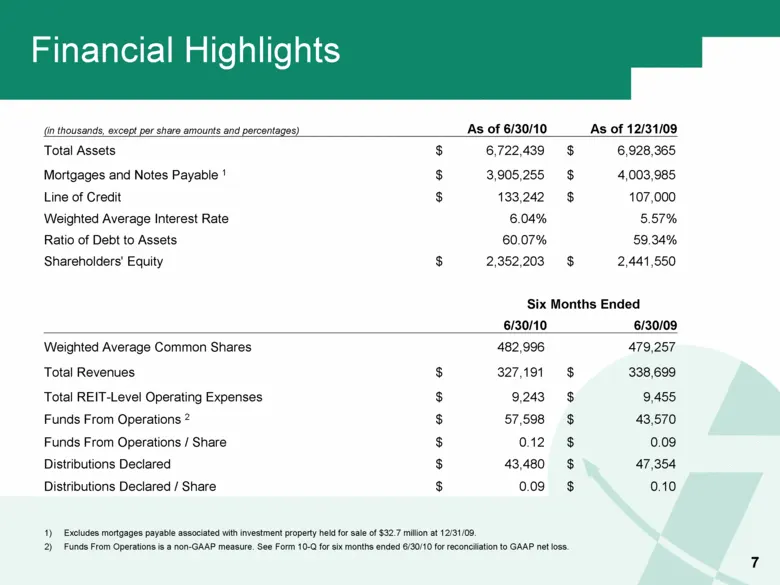
Financial Highlights Excludes mortgages payable associated with investment property held for sale of $32.7 million at 12/31/09. Funds From Operations is a non-GAAP measure. See Form 10-Q for six months ended 6/30/10 for reconciliation to GAAP net loss. 7 (in thousands, except per share amounts and p
Slide 9: FFO and Cash Flows From Operations
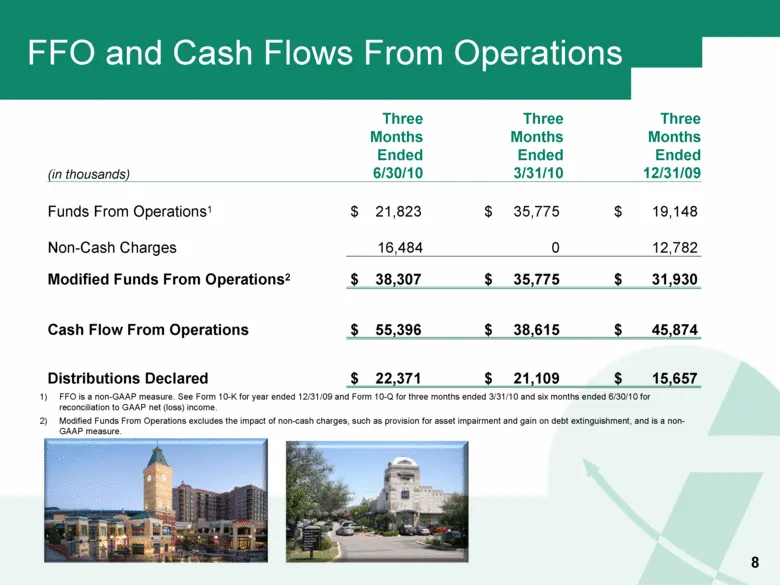
FFO and Cash Flows From Operations FFO is a non-GAAP measure. See Form 10-K for year ended 12/31/09 and Form 10-Q for three months ended 3/31/10 and six months ended 6/30/10 for reconciliation to GAAP net (loss) income. Modified Funds From Operations excludes the impact of non-cash charges, such as

Slide 10: Portfolio Update
9 PORTFOLIO UPDATE
Slide 11: Quality Portfolio Highlighted by Strong Anchors
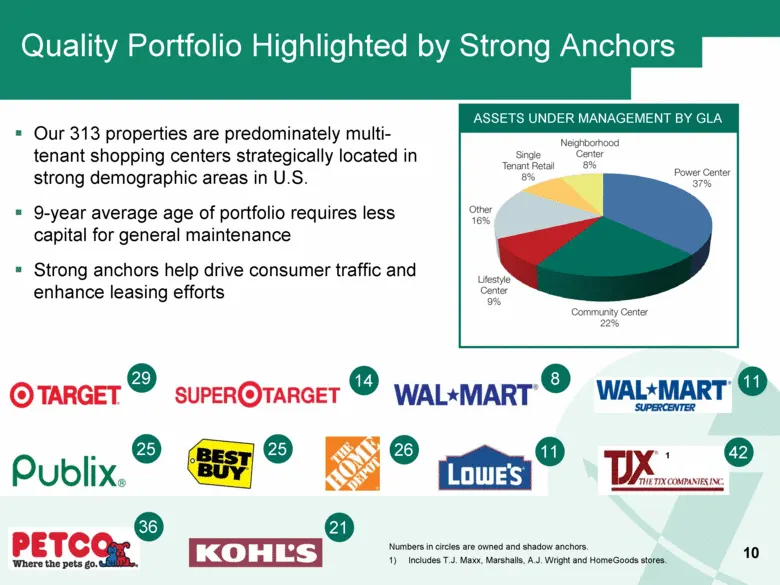
Quality Portfolio Highlighted by Strong Anchors 10 Our 313 properties are predominately multi-tenant shopping centers strategically located in strong demographic areas in U.S. 9-year average age of portfolio requires less capital for general maintenance Strong anchors help drive consumer traffic and
Slide 12: Tenant Diversification Reduces Risk
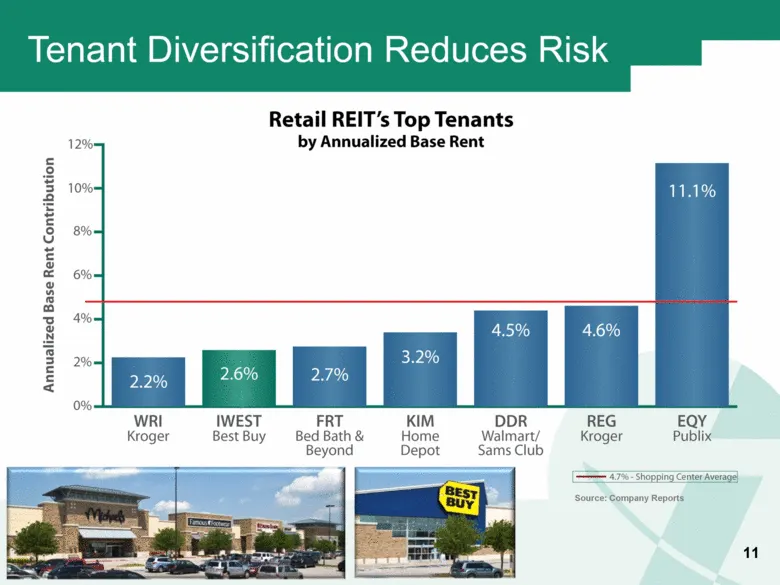
11 Tenant Diversification Reduces Risk Retail REIT’s Top Tenants by Annualized Base Rent Annualized Base Rent Contribution 12% 10% 8% 6% 4% 2% 0% 2.2% 2.6% 2.7% 3.2% 4.5% 4.6% 11.1% WRI Kroger IWEST Best Buy FRT Bed Bath & Beyond KIM Home Depot DDR Walmart/Sams Club REG Kroger EQY Publix 4.7% - Shop

Slide 13: Award Winning Marketing Programs Benefit Retailers and Consumers
12 Inland Western’s marketing team partners with retailers and community groups to create one of a kind marketing programs intended to drive traffic, enhance retail sales and make an impact on the community The marketing team was recognized by the International Council of Shopping Centers with 7 Sil
Slide 14: Property Management Goals and Initiatives
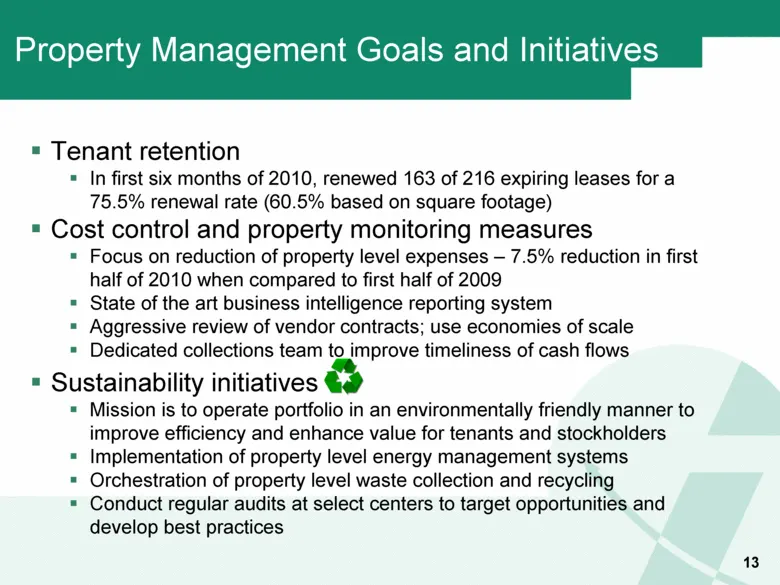
Property Management Goals and Initiatives Tenant retention In first six months of 2010, renewed 163 of 216 expiring leases for a 75.5% renewal rate (60.5% based on square footage) Cost control and property monitoring measures Focus on reduction of property level expenses – 7.5% reduction in first ha
Slide 15: Leasing & Asset Management Update
14 LEASING & ASSET MANAGEMENT UPDATE
Slide 16: Assets Under Management
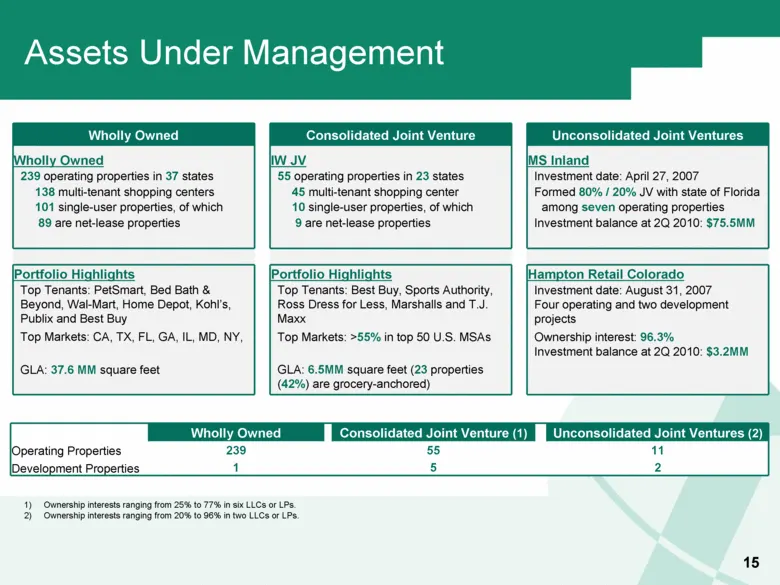
15 Assets Under Management Wholly Owned Consolidated Joint Venture Unconsolidated Joint Ventures Wholly Owned IW JV MS Inland 239 operating properties in 37 states 55 operating properties in 23 states Investment date: April 27, 2007 138 multi-tenant shopping centers 45 multi-tenant shopping center F
Slide 17: Core Portfolio Comprised of Necessity-Based Multi-Tenant Shopping Centers
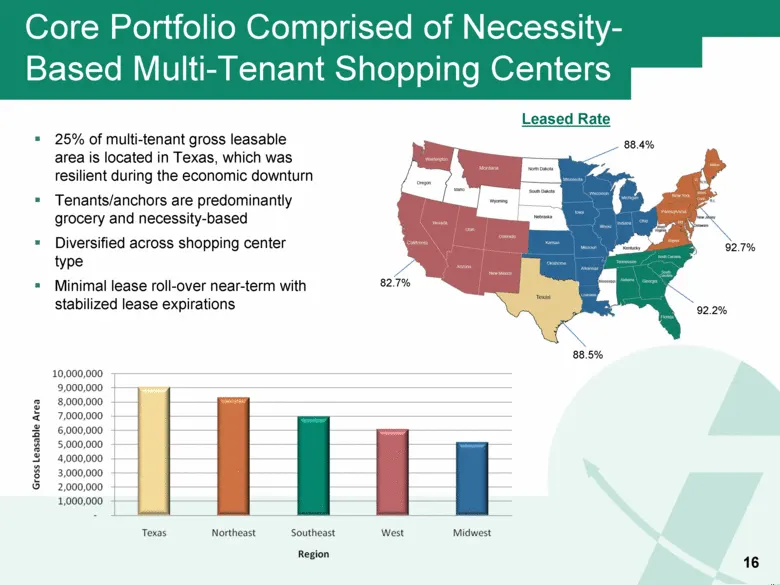
Core Portfolio Comprised of Necessity-Based Multi-Tenant Shopping Centers 25% of multi-tenant gross leasable area is located in Texas, which was resilient during the economic downturn Tenants/anchors are predominantly grocery and necessity-based Diversified across shopping center type Minimal lease
Slide 18: Asset Management Goals & Initiatives
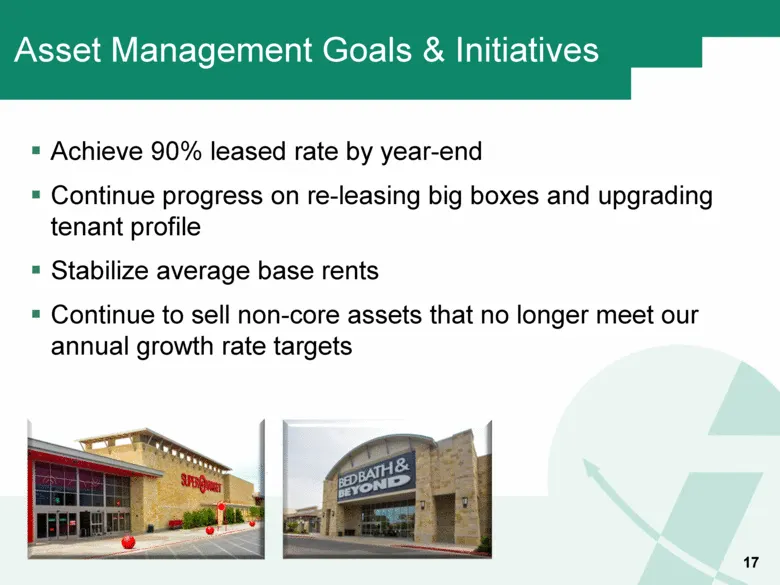
Asset Management Goals & Initiatives Achieve 90% leased rate by year-end Continue progress on re-leasing big boxes and upgrading tenant profile Stabilize average base rents Continue to sell non-core assets that no longer meet our annual growth rate targets 17
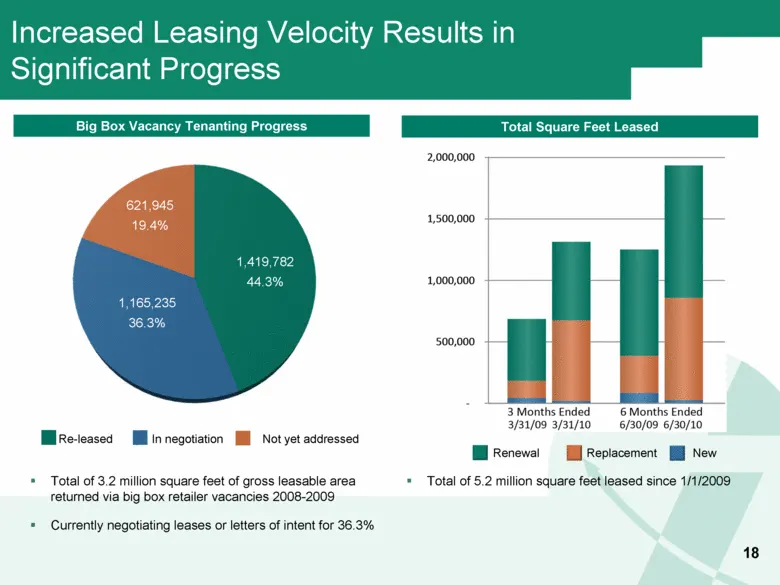
Slide 19: Increased Leasing Velocity Results in Significant Progress
18 Increased Leasing Velocity Results in Significant Progress Big Box Vacancy Tenanting Progress Re-leased In negotiation Not yet addressed 621,945 19.4% 1,419,782 44.3% 1,165,235 36.3% Total Square Feet Leased Renewal Replacement New Total of 3.2 million square feet of gross leasable area returned
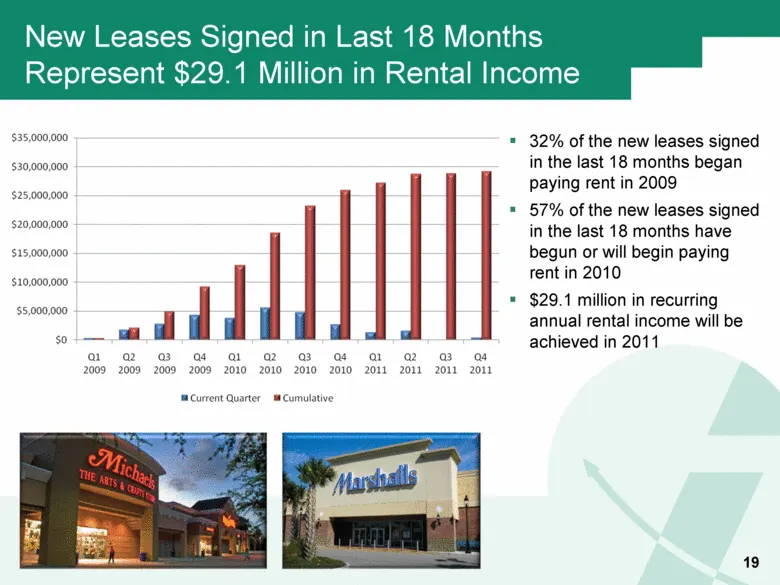
Slide 20: New Leases Signed Represent $29.1 Million in Rental Income
New Leases Signed in Last 18 Months Represent $29.1 Million in Rental Income 19 32% of the new leases signed in the last 18 months began paying rent in 2009 57% of the new leases signed in the last 18 months have begun or will begin paying rent in 2010 $29.1 million in recurring annual rental income
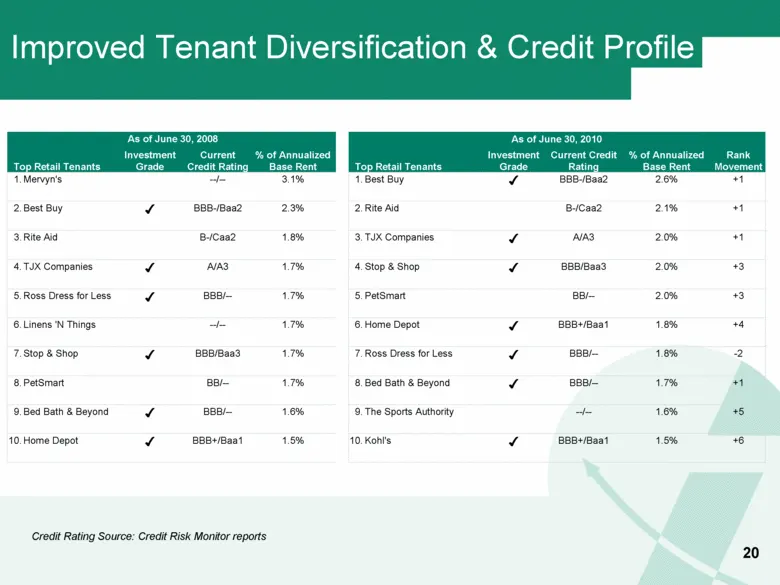
Slide 21: Improved Tenant Diversification & Credit Profile
Improved Tenant Diversification & Credit Profile 20 Credit Rating Source: Credit Risk Monitor reports As of June 30, 2008 As of June 30, 2010 Top Retail Tenants Investment Grade Current Credit Rating % of Annualized Base Rent Top Retail Tenants Investment Grade Current Credit Rating % of Annualized
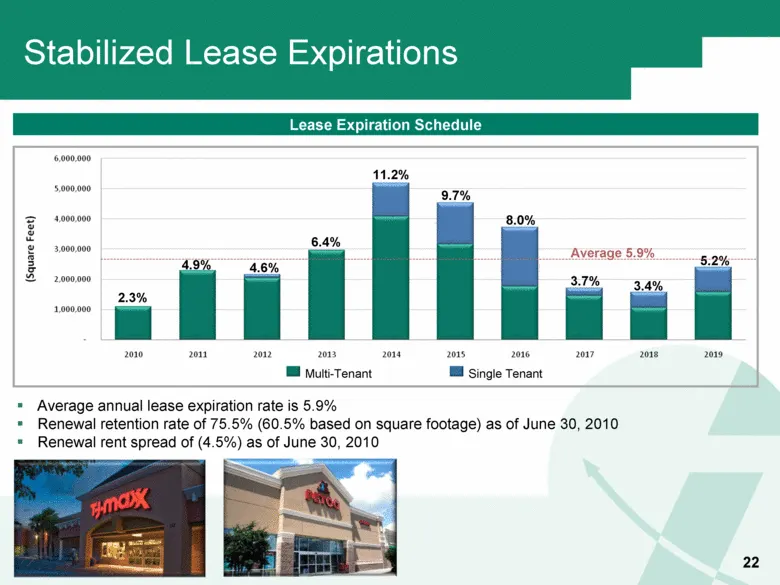
Slide 22: Stabilized Lease Expirations
Multi-Tenant Single Tenant 2.3% 6.4% 11.2% 9.7% 8.0% 3.7% 3.4% 22 Stabilized Lease Expirations Lease Expiration Schedule Average annual lease expiration rate is 5.9% Renewal retention rate of 75.5% (60.5% based on square footage) as of June 30, 2010 Renewal rent spread of (4.5%) as of June 30, 2010
Slide 23: Key Takeaways
Key Takeaways We believe we have made solid progress on 2010 corporate initiatives We believe we have significantly stabilized the balance sheet Leases signed should translate into increasing revenue flow in latter 2010 and into 2011 We are aggressively working to manage the improving leasing trends
Slide 24: Forward-Looking Statements
Forward-Looking Statements Certain statements in this presentation may constitute “forward-looking statements.” Forward-looking statements are statements that are not historical, including statements regarding management’s intentions, beliefs, expectations, representations, plans or predictions of t
Source: SEC EDGAR · 8-K filed Sep 16, 2010
More decks from Retail Properties of America Inc
 Merger or Acquisition (July 2021)17 slides · Jul 19, 2021
 Investor Presentation (July 2020)23 slides · Jul 17, 2020
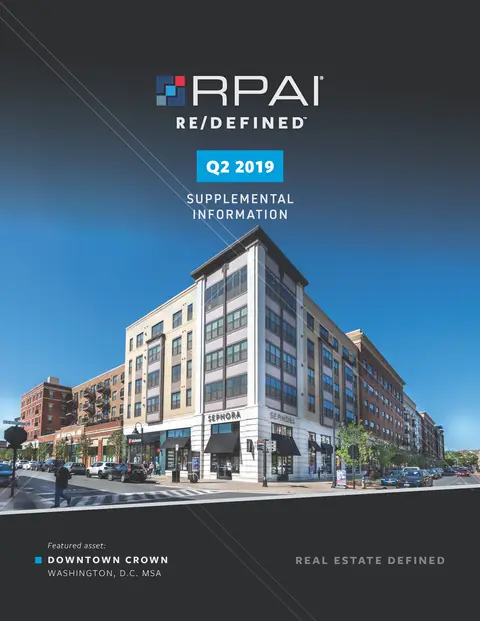 Q2 2019 Earnings Presentation5 slides · Jul 30, 2019
 Investor Day (September 2016)100 slides · Sep 21, 2016
 Investor Day (June 2013)68 slides · Jun 27, 2013
 Q4 2012 Earnings Presentation21 slides · Feb 26, 2013