Retail Properties of America Inc
Retail Properties of America — Investor Day (June 2013)
68 slides from Retail Properties of America's investor day presentation, Jun 27, 2013
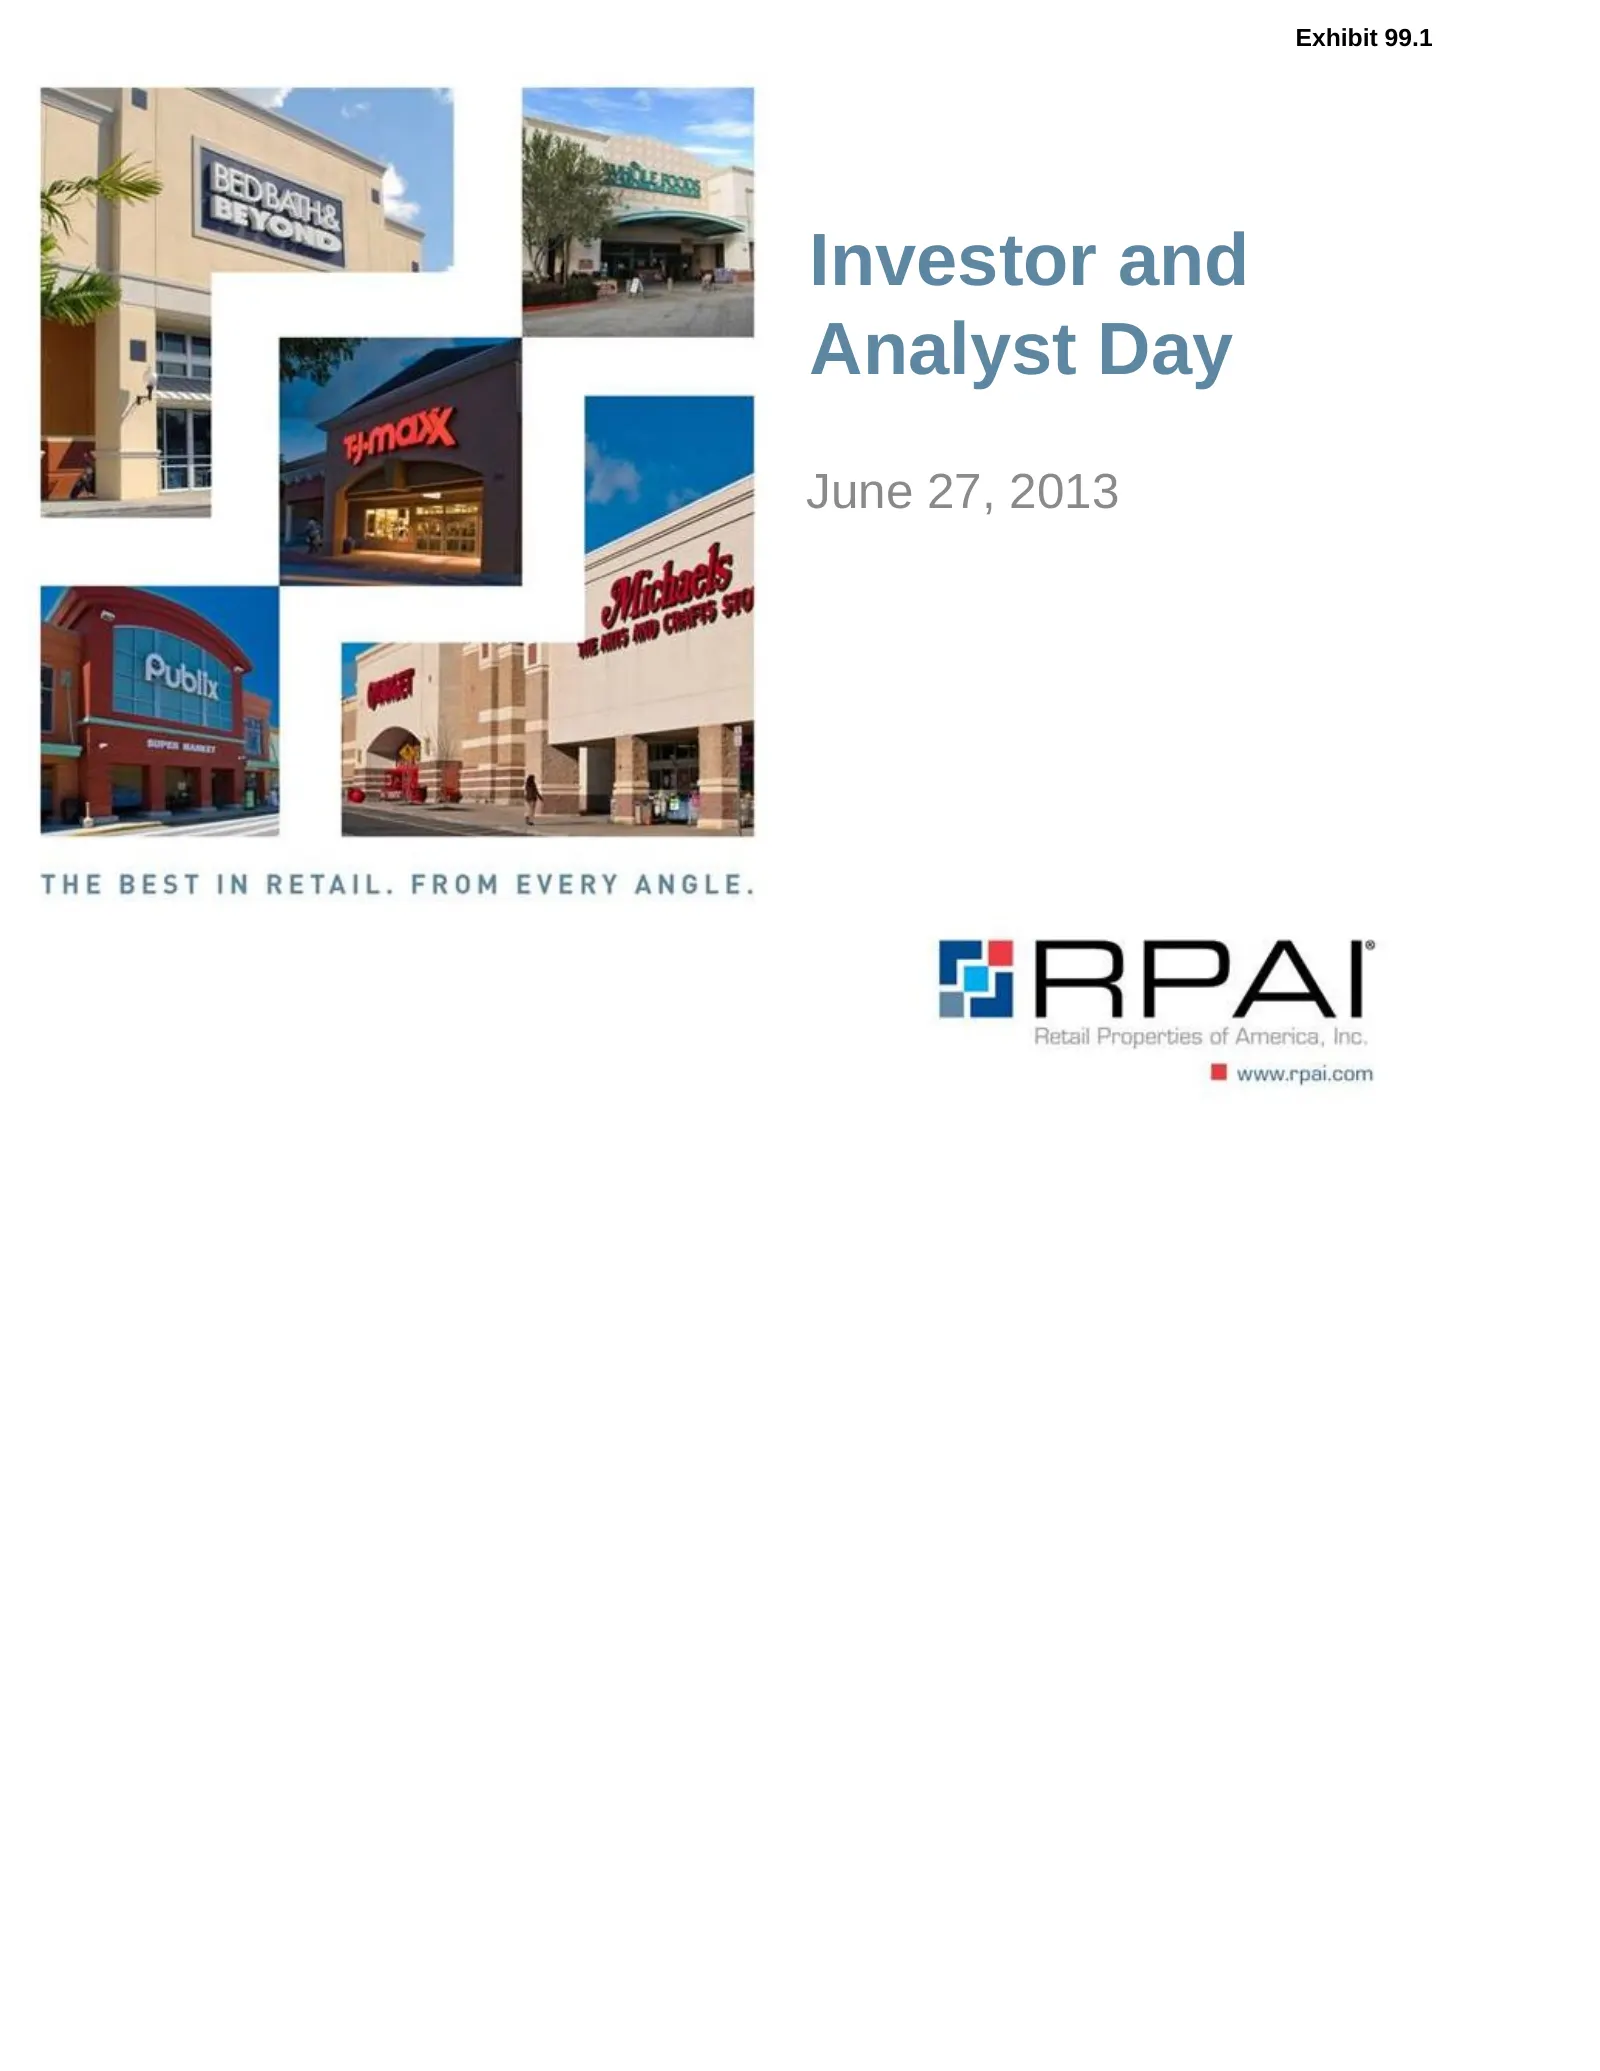
Slide 1: Investor and Analyst Day
Exhibit 99.1 Investor and Analyst Day June 27, 2013
Slide 2: Disclaimer
Disclaimer This presentation contains “forward-looking statements” within the meaning of the safe harbor from civil liability provided for such statements by the Private Securities Litigation Reform Act of 1995 (set forth in Section 27A of the Securities Act of 1933, as amended, or the Securities Ac
Slide 3: Agenda
Agenda Welcome and Introduction – Mike Fitzmaurice, Vice President Finance - RPAI Overview and Strategy – Steve Grimes, Chief Executive Officer Target Market Approach – Shane Garrison, Chief Operating Officer and Chief Investment Officer Balance Sheet Strategy – Angela Aman, Chief Financial Officer
Slide 4: RPAI Overview and Strategy
RPAI Overview and Strategy Steve Grimes
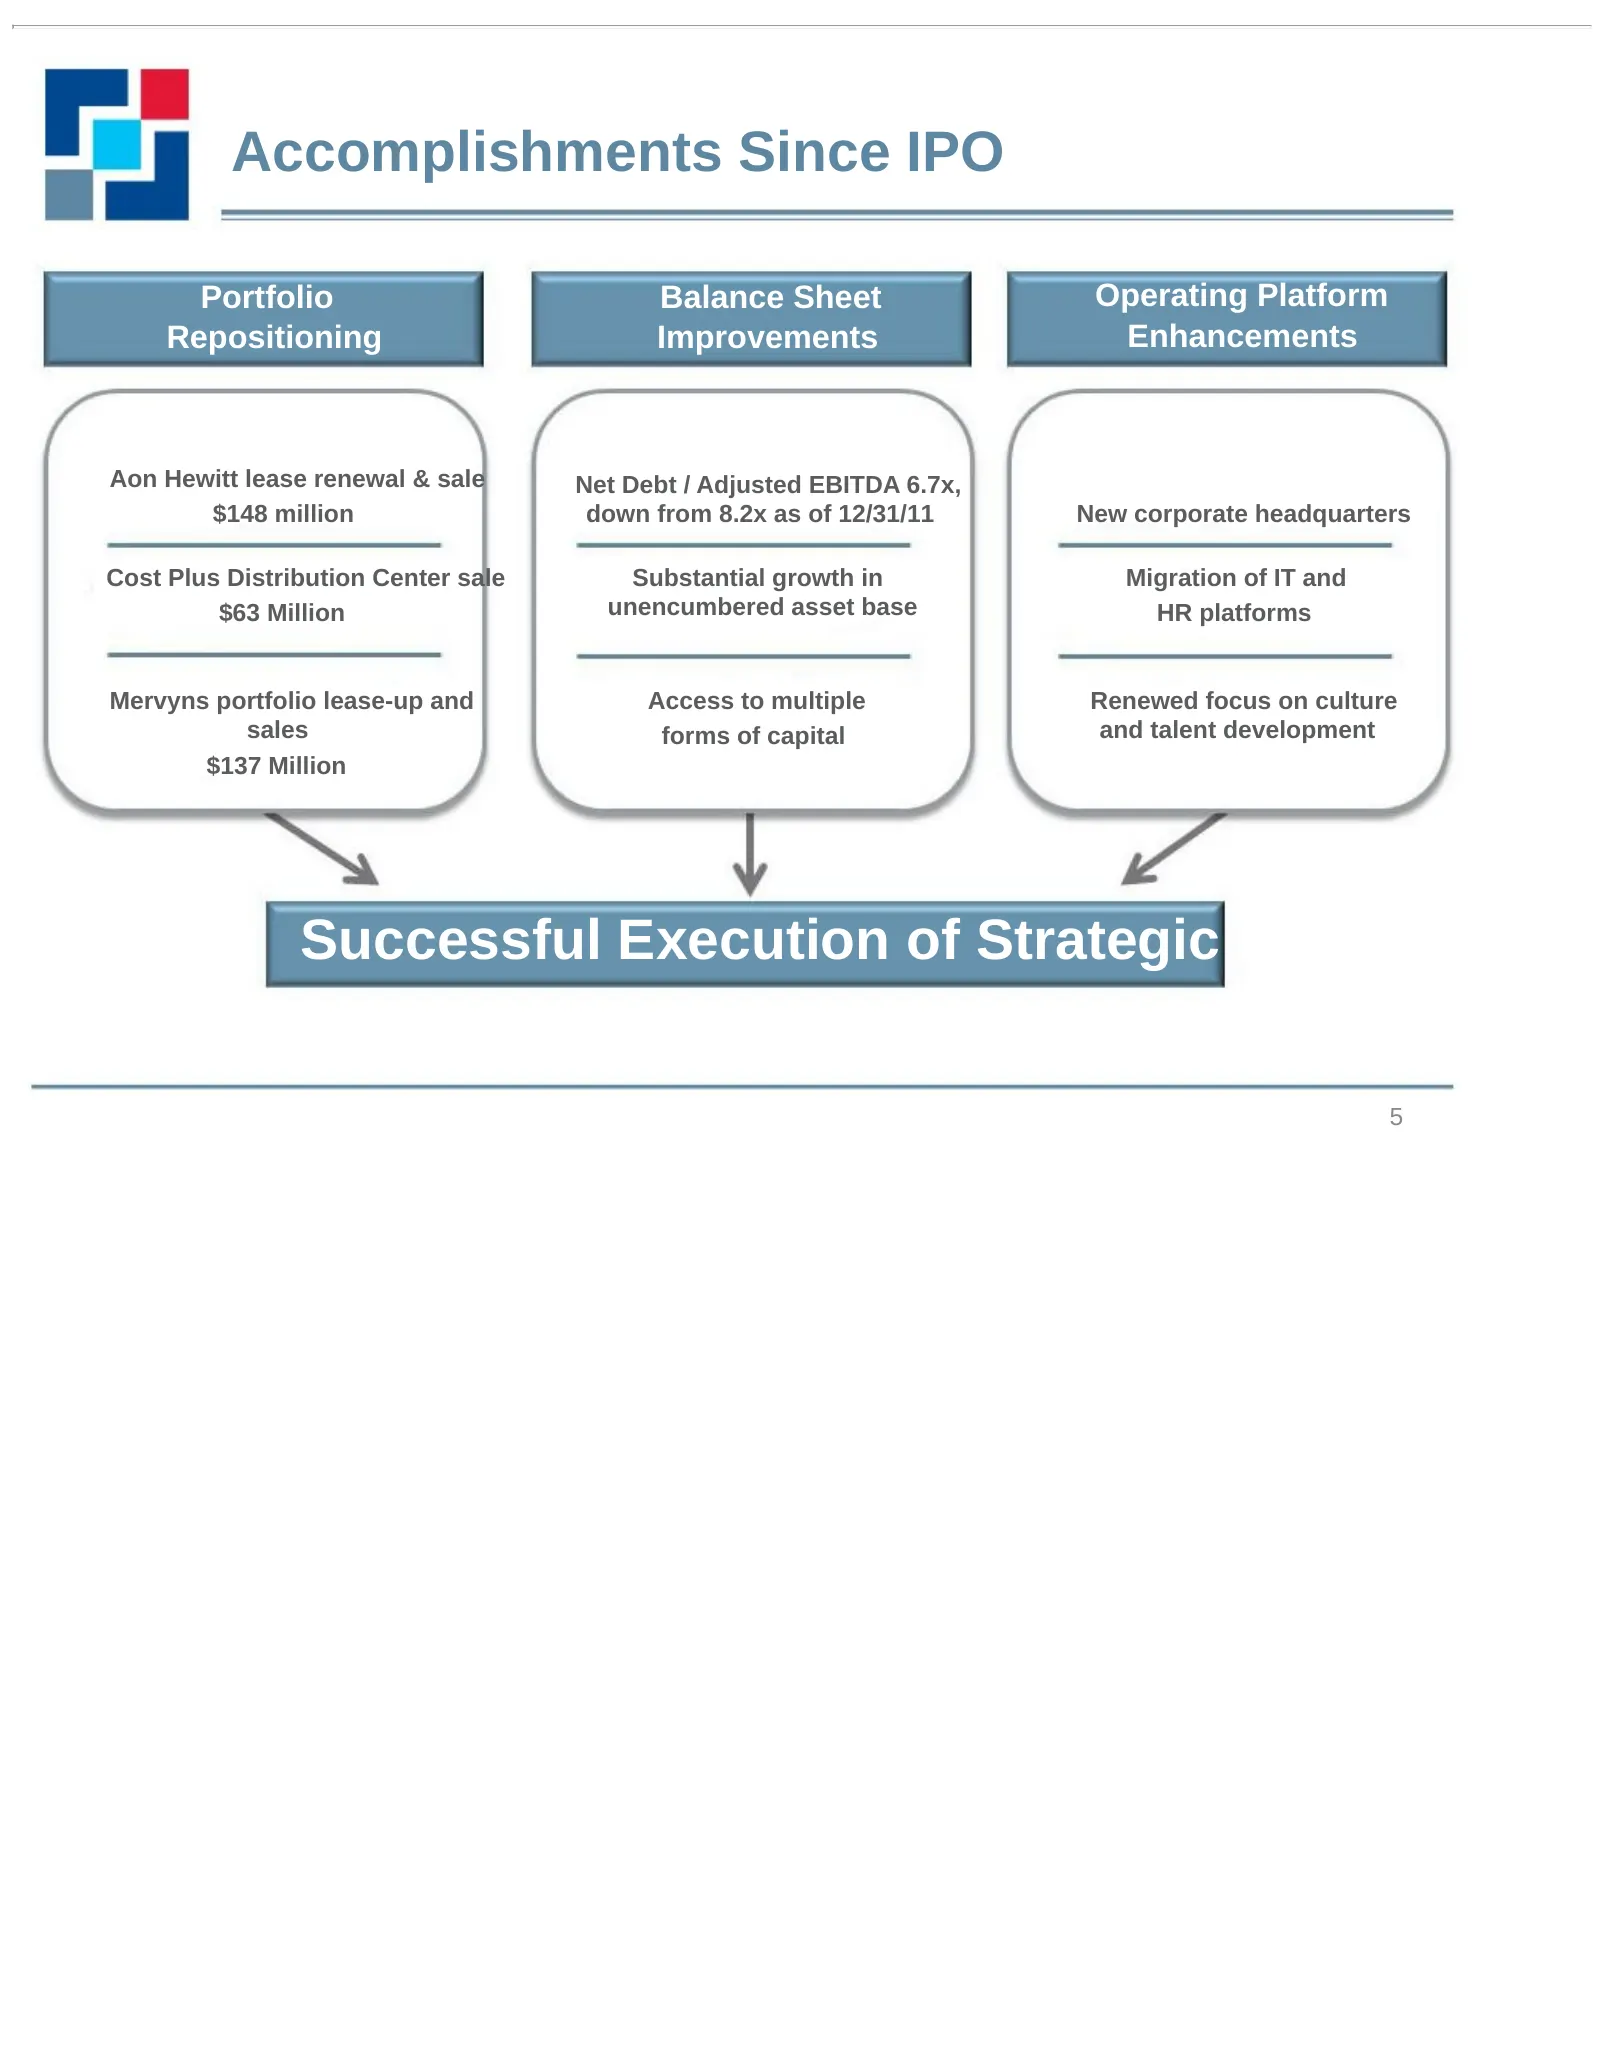
Slide 5: Accomplishments Since IPO
Accomplishments Since IPO Portfolio Balance Sheet Operating Platform Repositioning Improvements Enhancements Aon Hewitt lease renewal & sale Net Debt / Adjusted EBITDA 6.7x, $148 million down from 8.2x as of 12/31/11 New corporate headquarters Cost Plus Distribution Center sale Substantial growth in
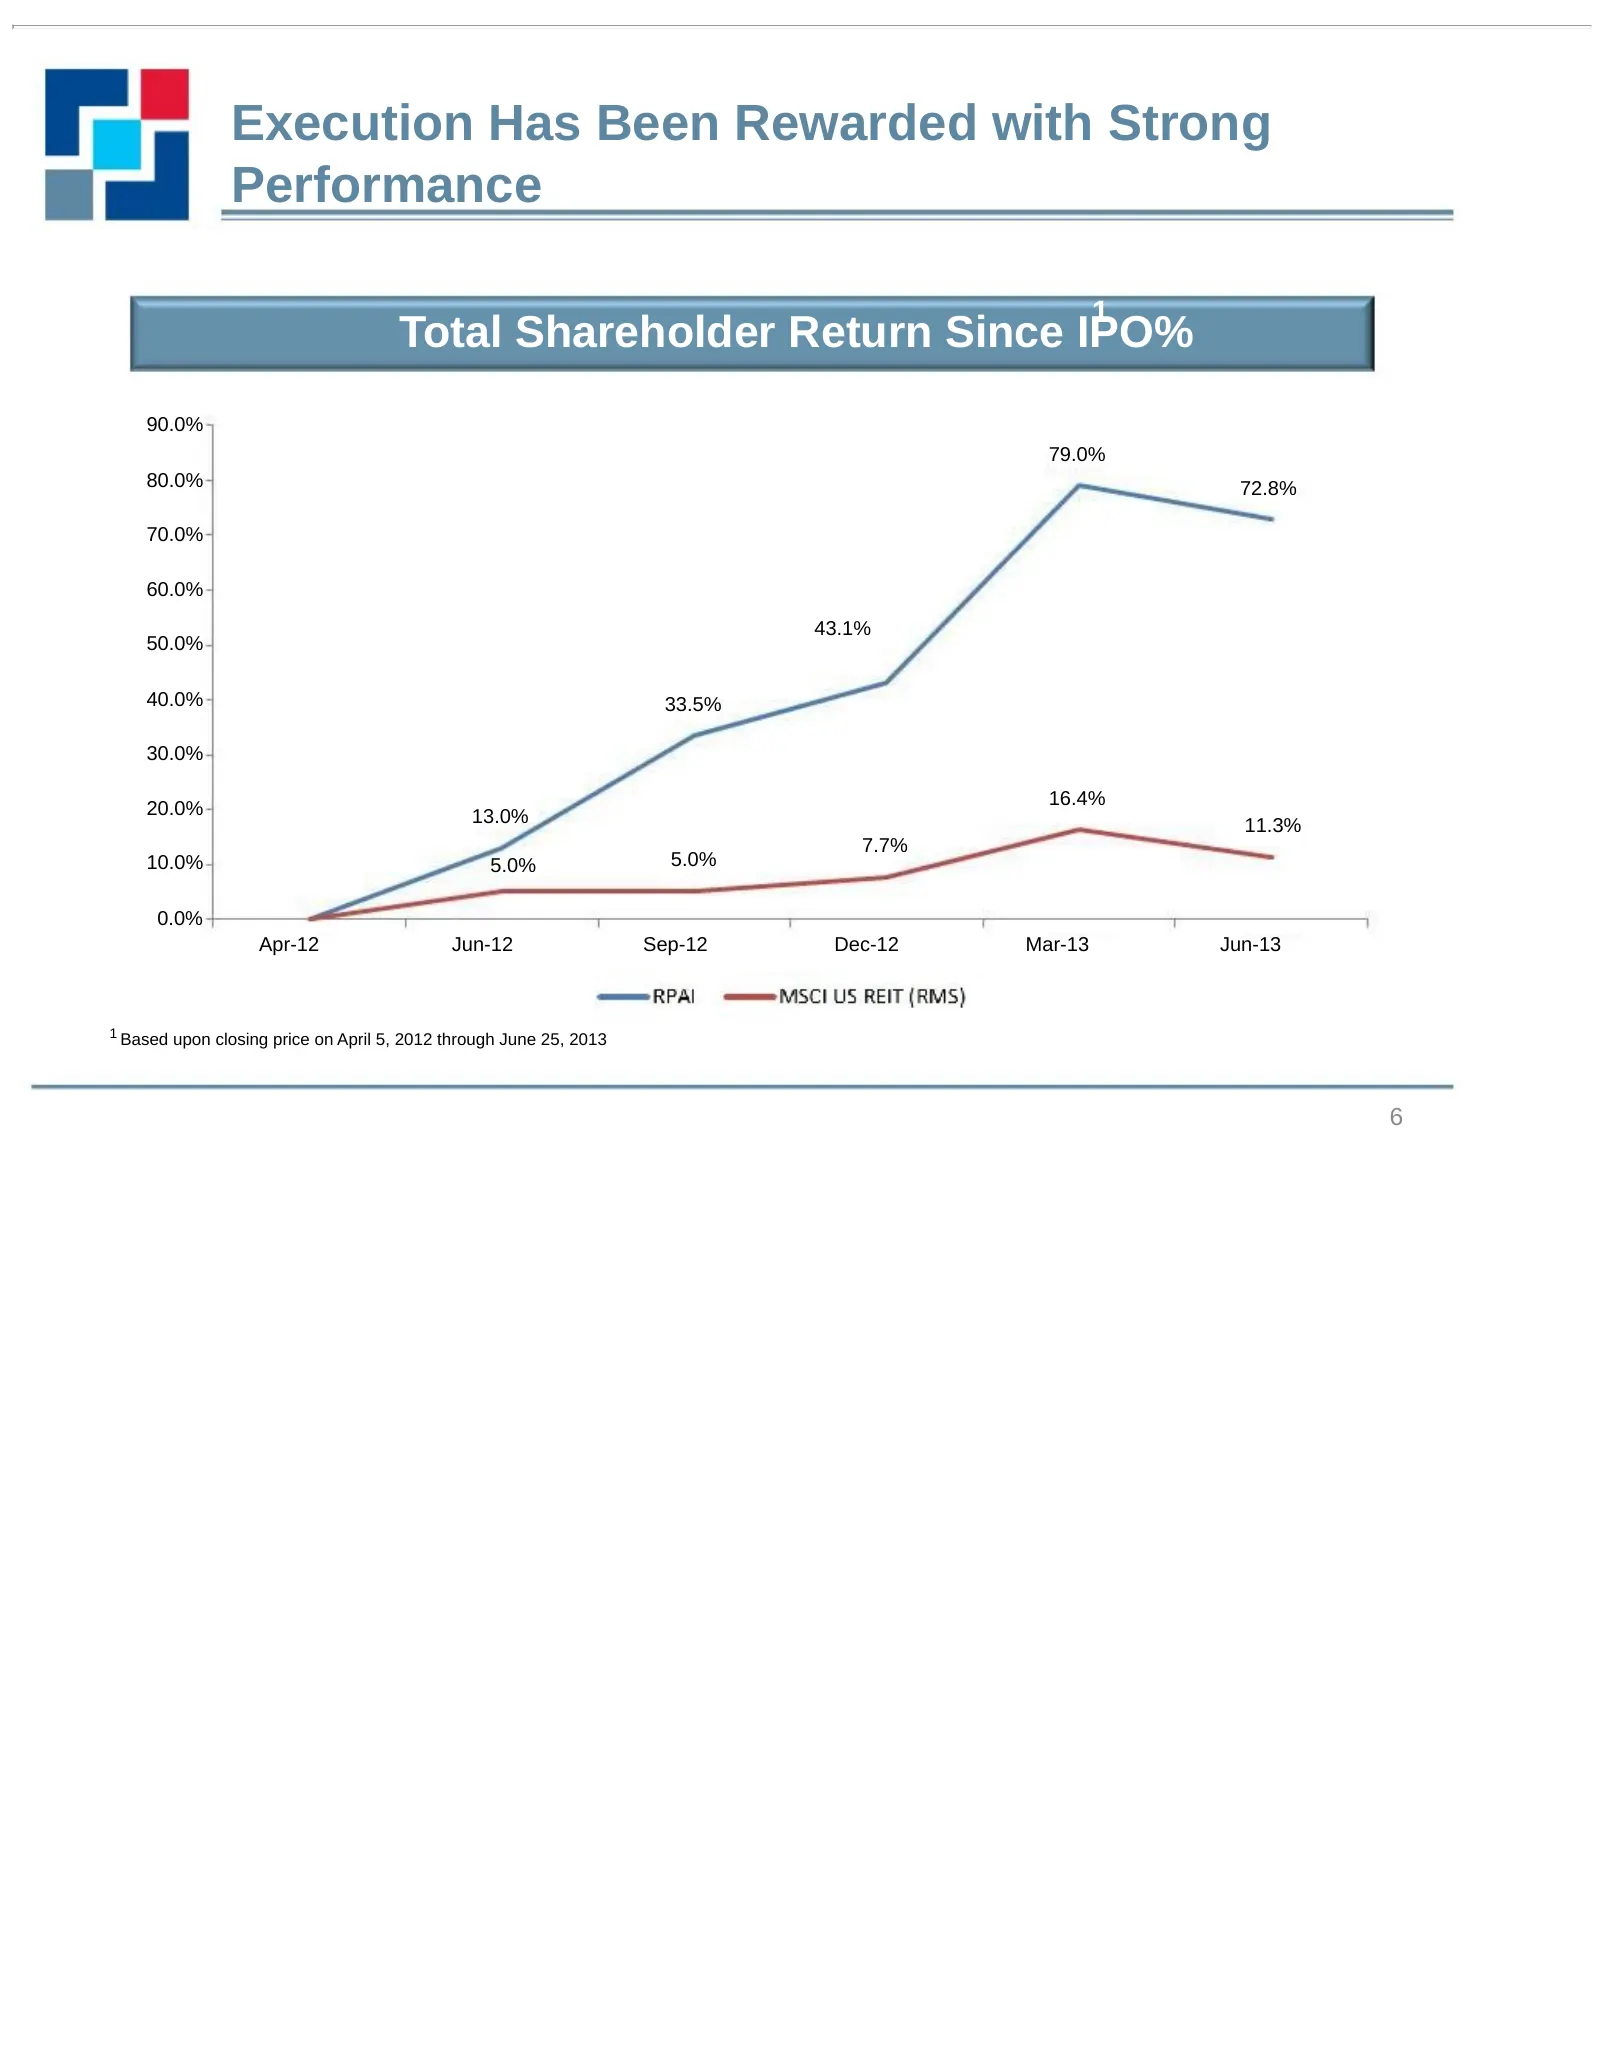
Slide 6: Execution Has Been Rewarded with Strong Performance
Execution Has Been Rewarded with Strong Performance 1 Total Shareholder Return Since IPO% 90.0% 79.0% 80.0% 72.8% 70.0% 60.0% 43.1% 50.0% 40.0% 33.5% 30.0% 16.4% 20.0% 13.0% 11.3% 7.7% 10.0% 5.0% 5.0% 0.0% Apr-12 Jun-12 Sep-12 Dec-12 Mar-13 Jun-13 1 Based upon closing price on April 5, 2012 through
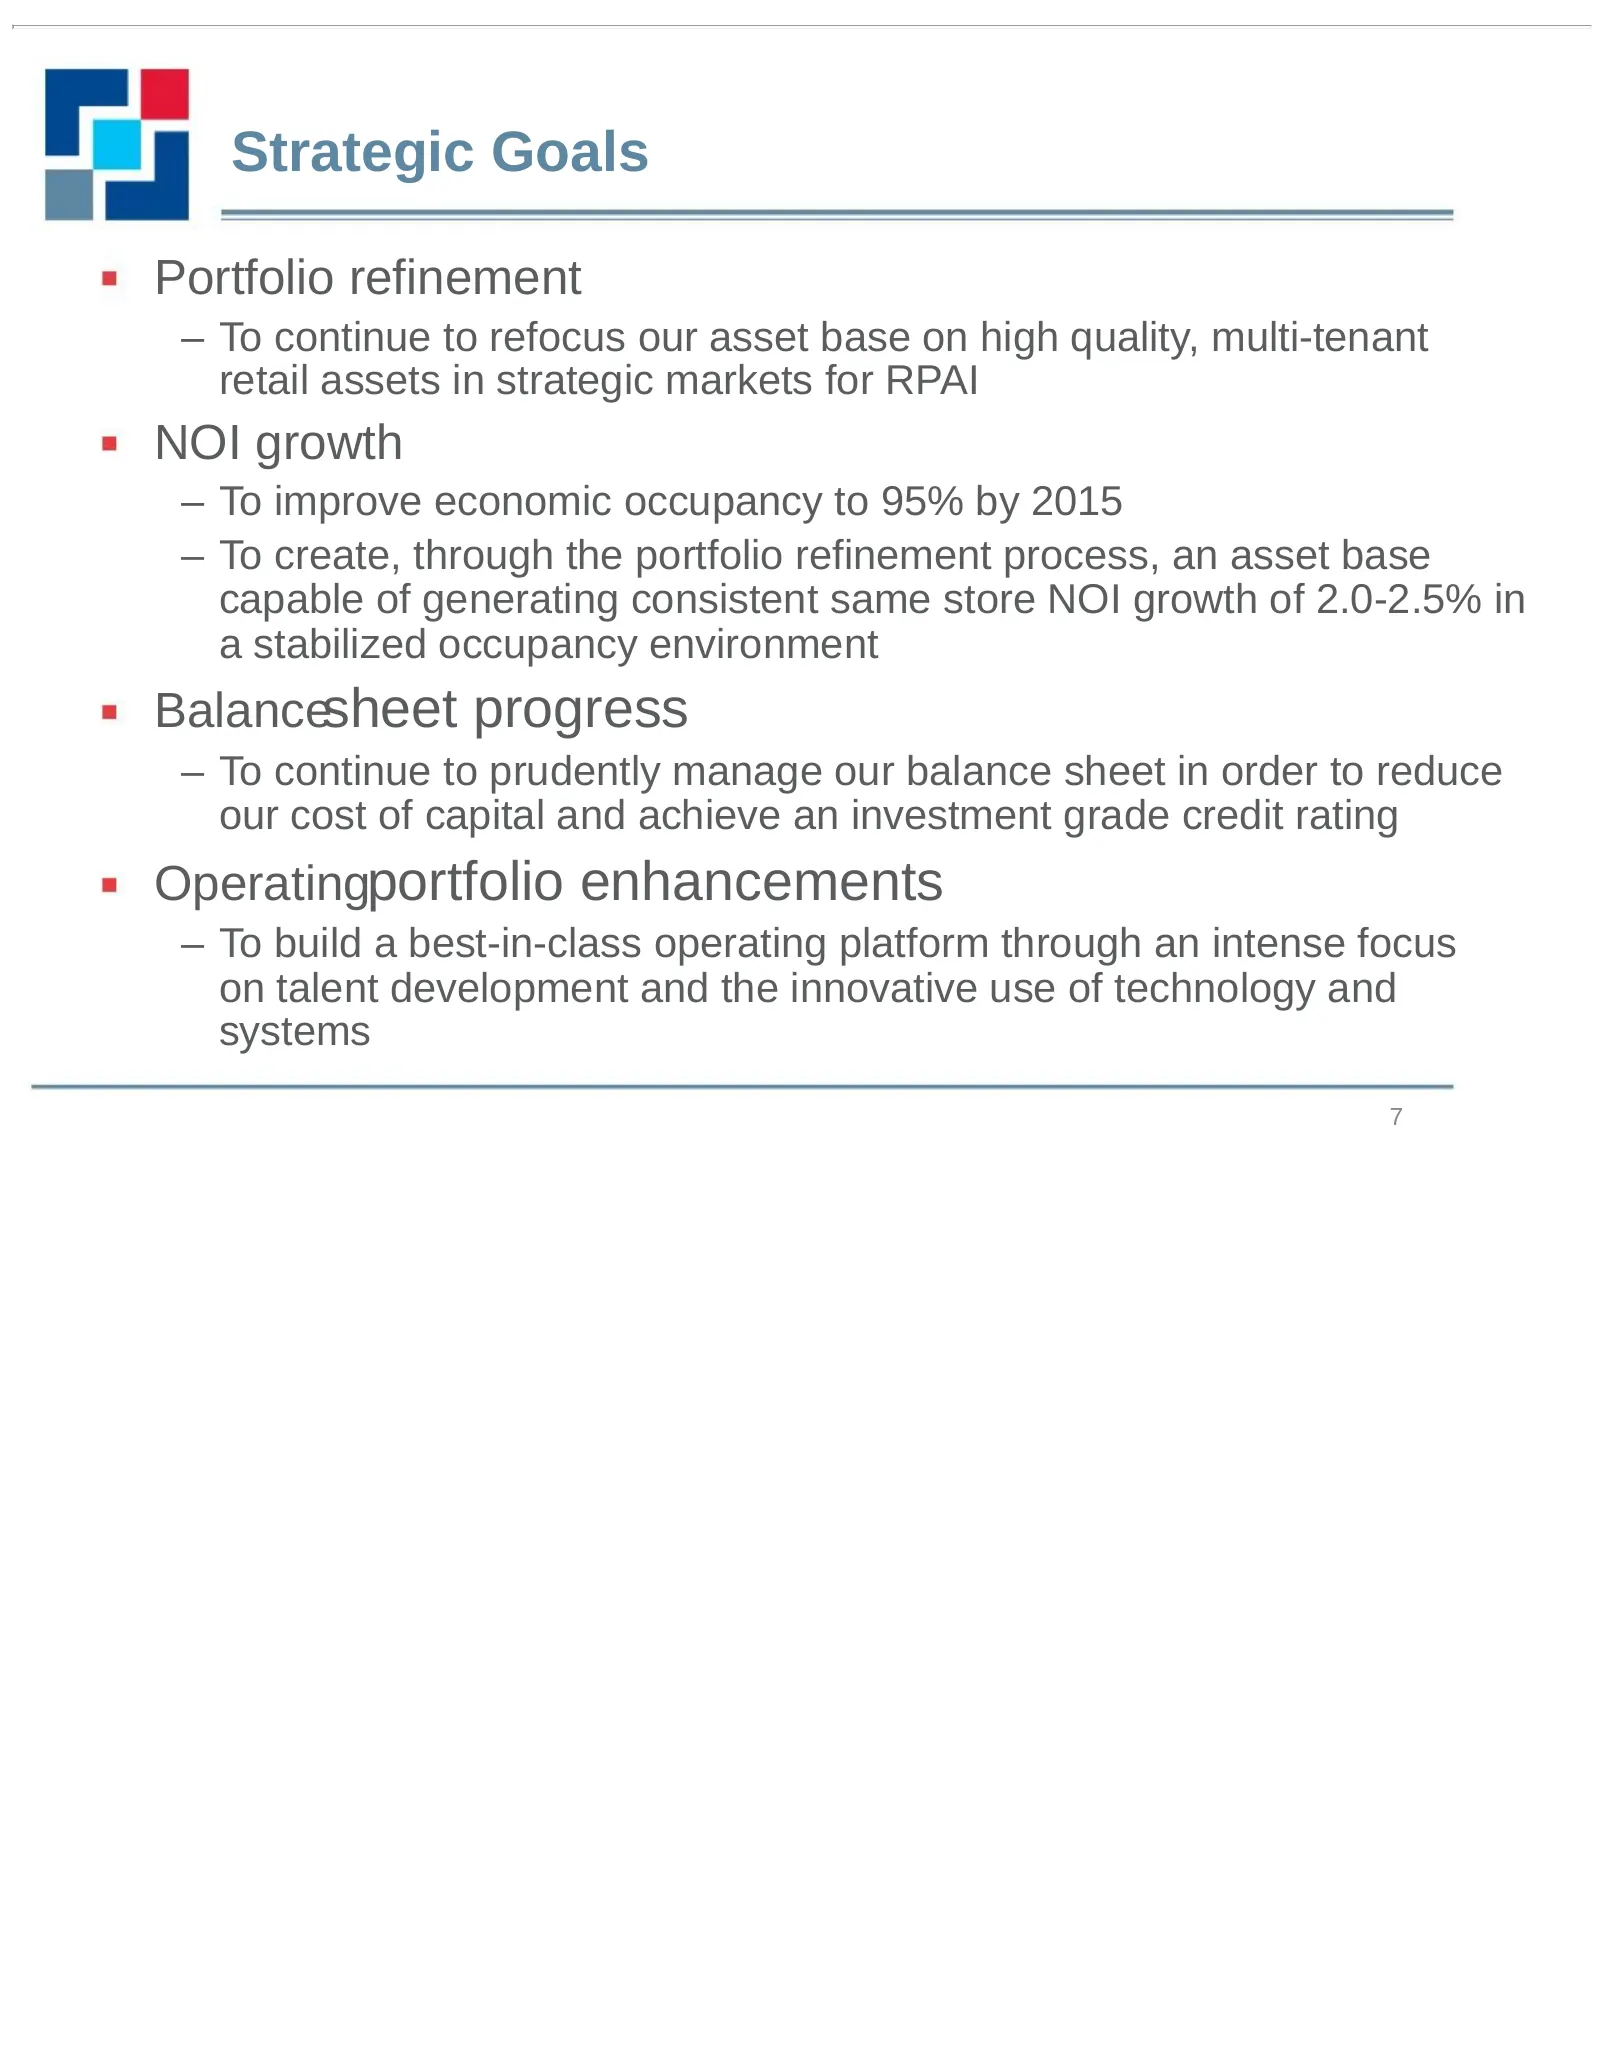
Slide 7: Strategic Goals
Strategic Goals Portfolio refinement – To continue to refocus our asset base on high quality, multi-tenant retail assets in strategic markets for RPAI NOI growth – To improve economic occupancy to 95% by 2015 – To create, through the portfolio refinement process, an asset base capable of generating
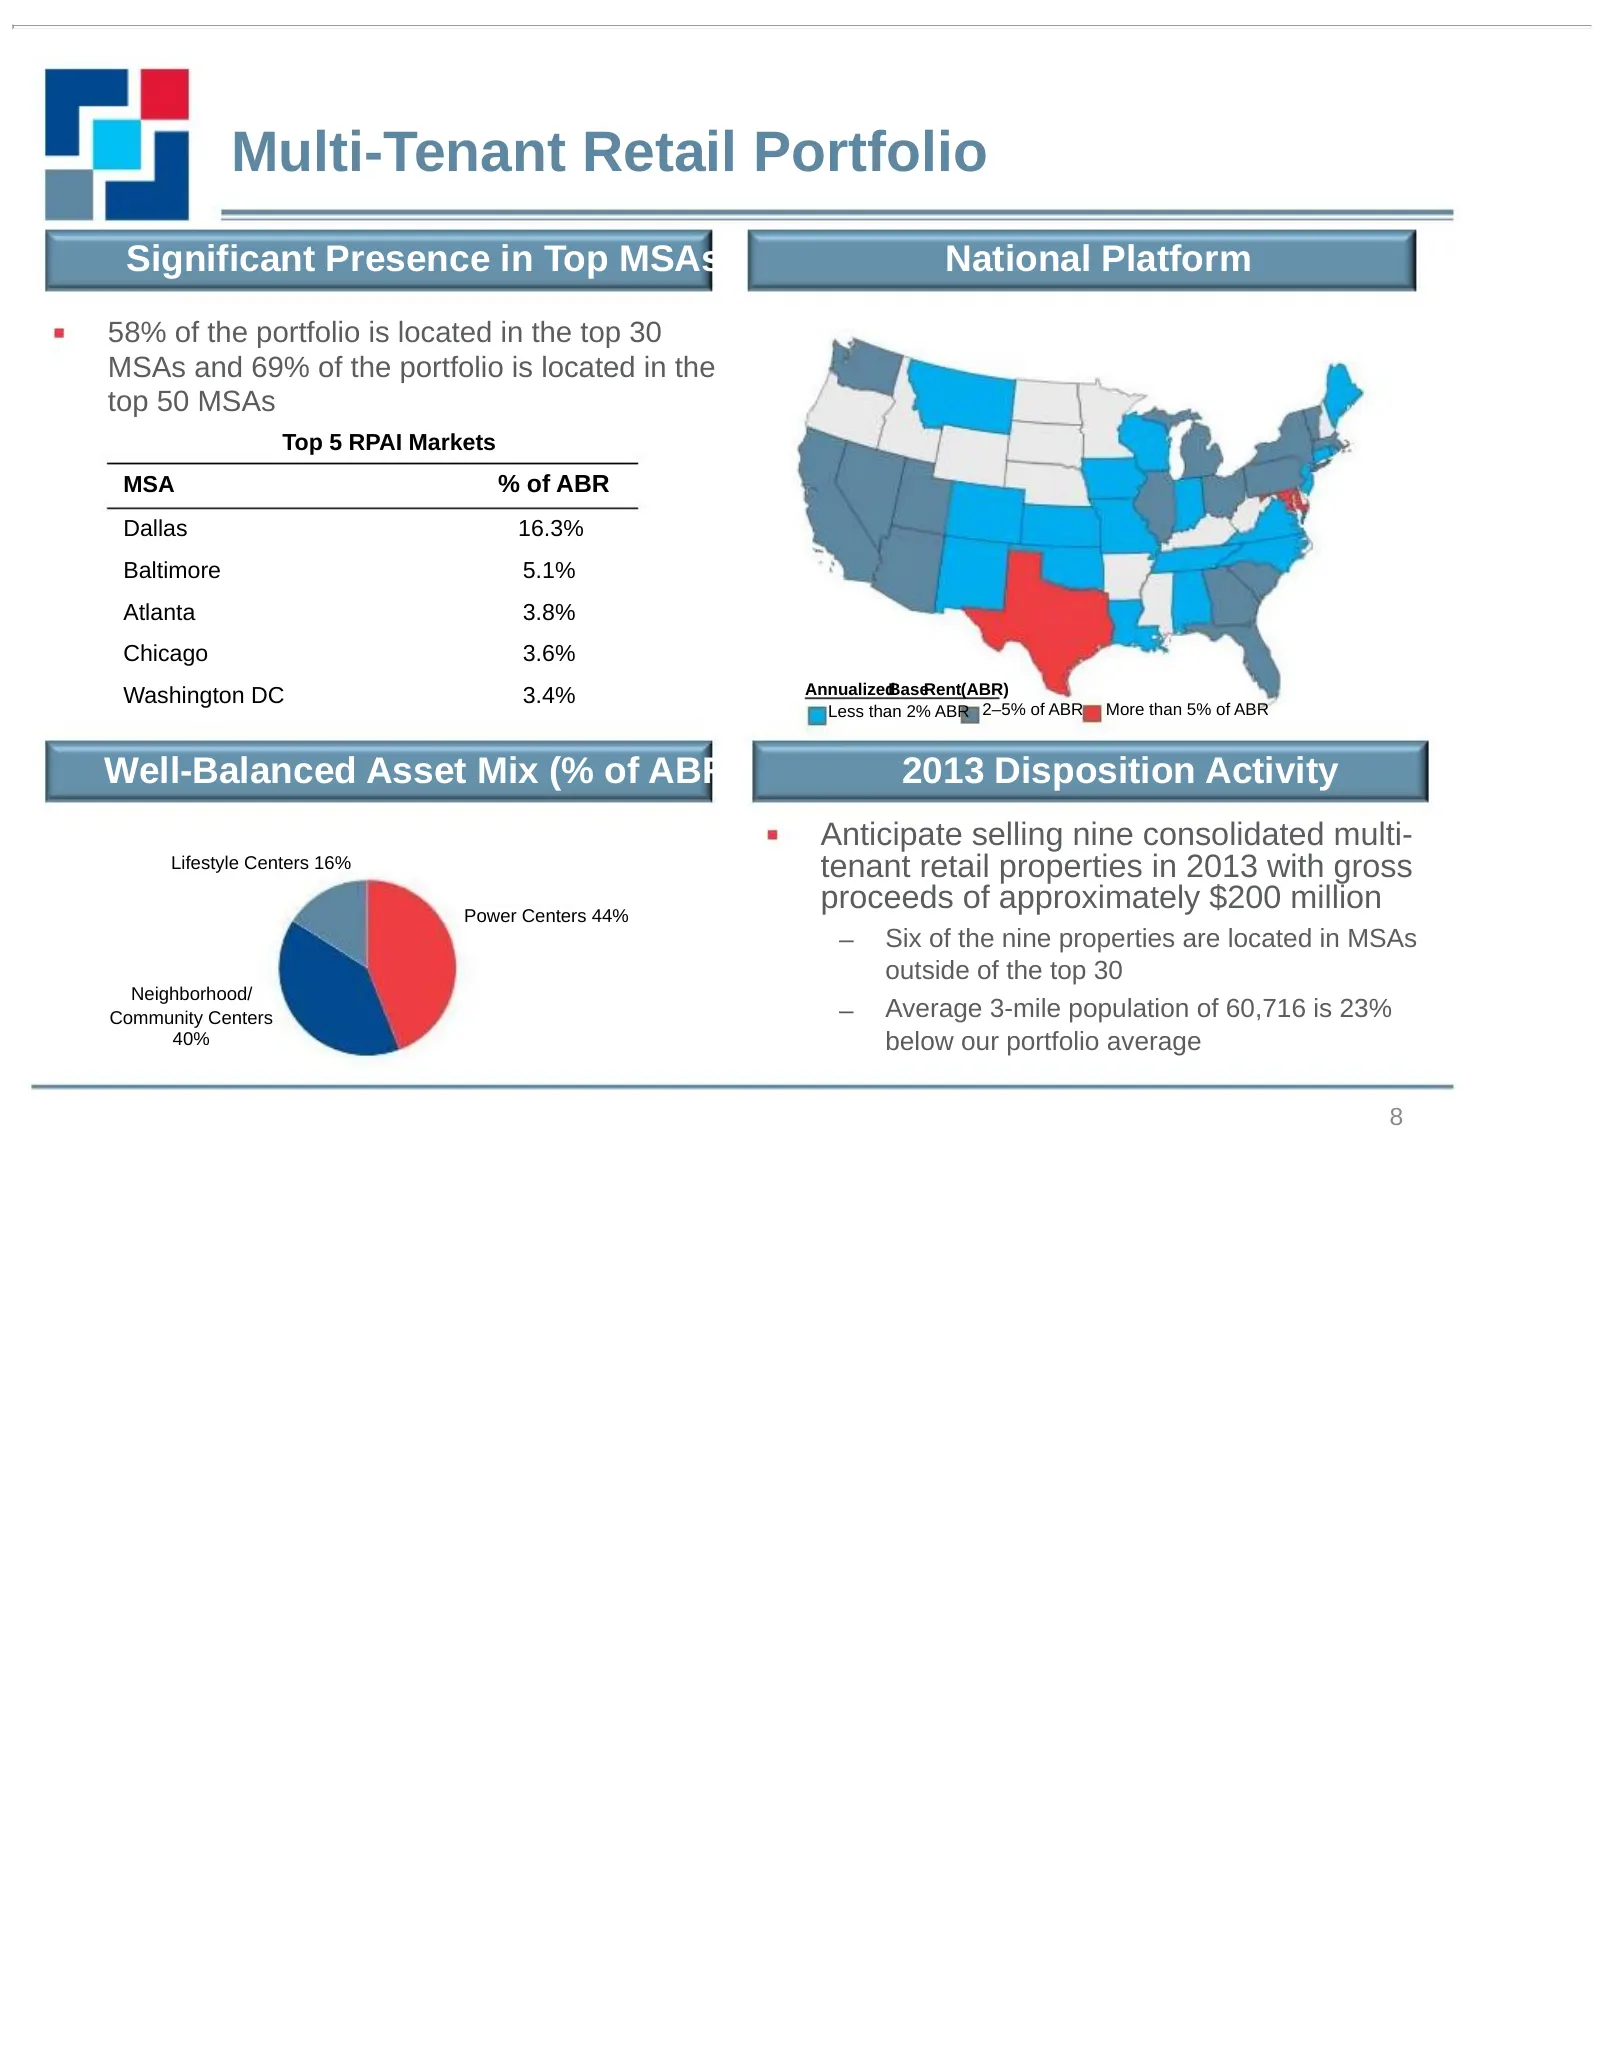
Slide 8: Multi-Tenant Retail Portfolio
Multi-Tenant Retail Portfolio Significant Presence in Top MSAs National Platform 58% of the portfolio is located in the top 30 MSAs and 69% of the portfolio is located in the top 50 MSAs Top 5 RPAI Markets MSA % of ABR Dallas 16.3% Baltimore 5.1% Atlanta 3.8% Chicago 3.6% Washington DC 3.4% Annualiz
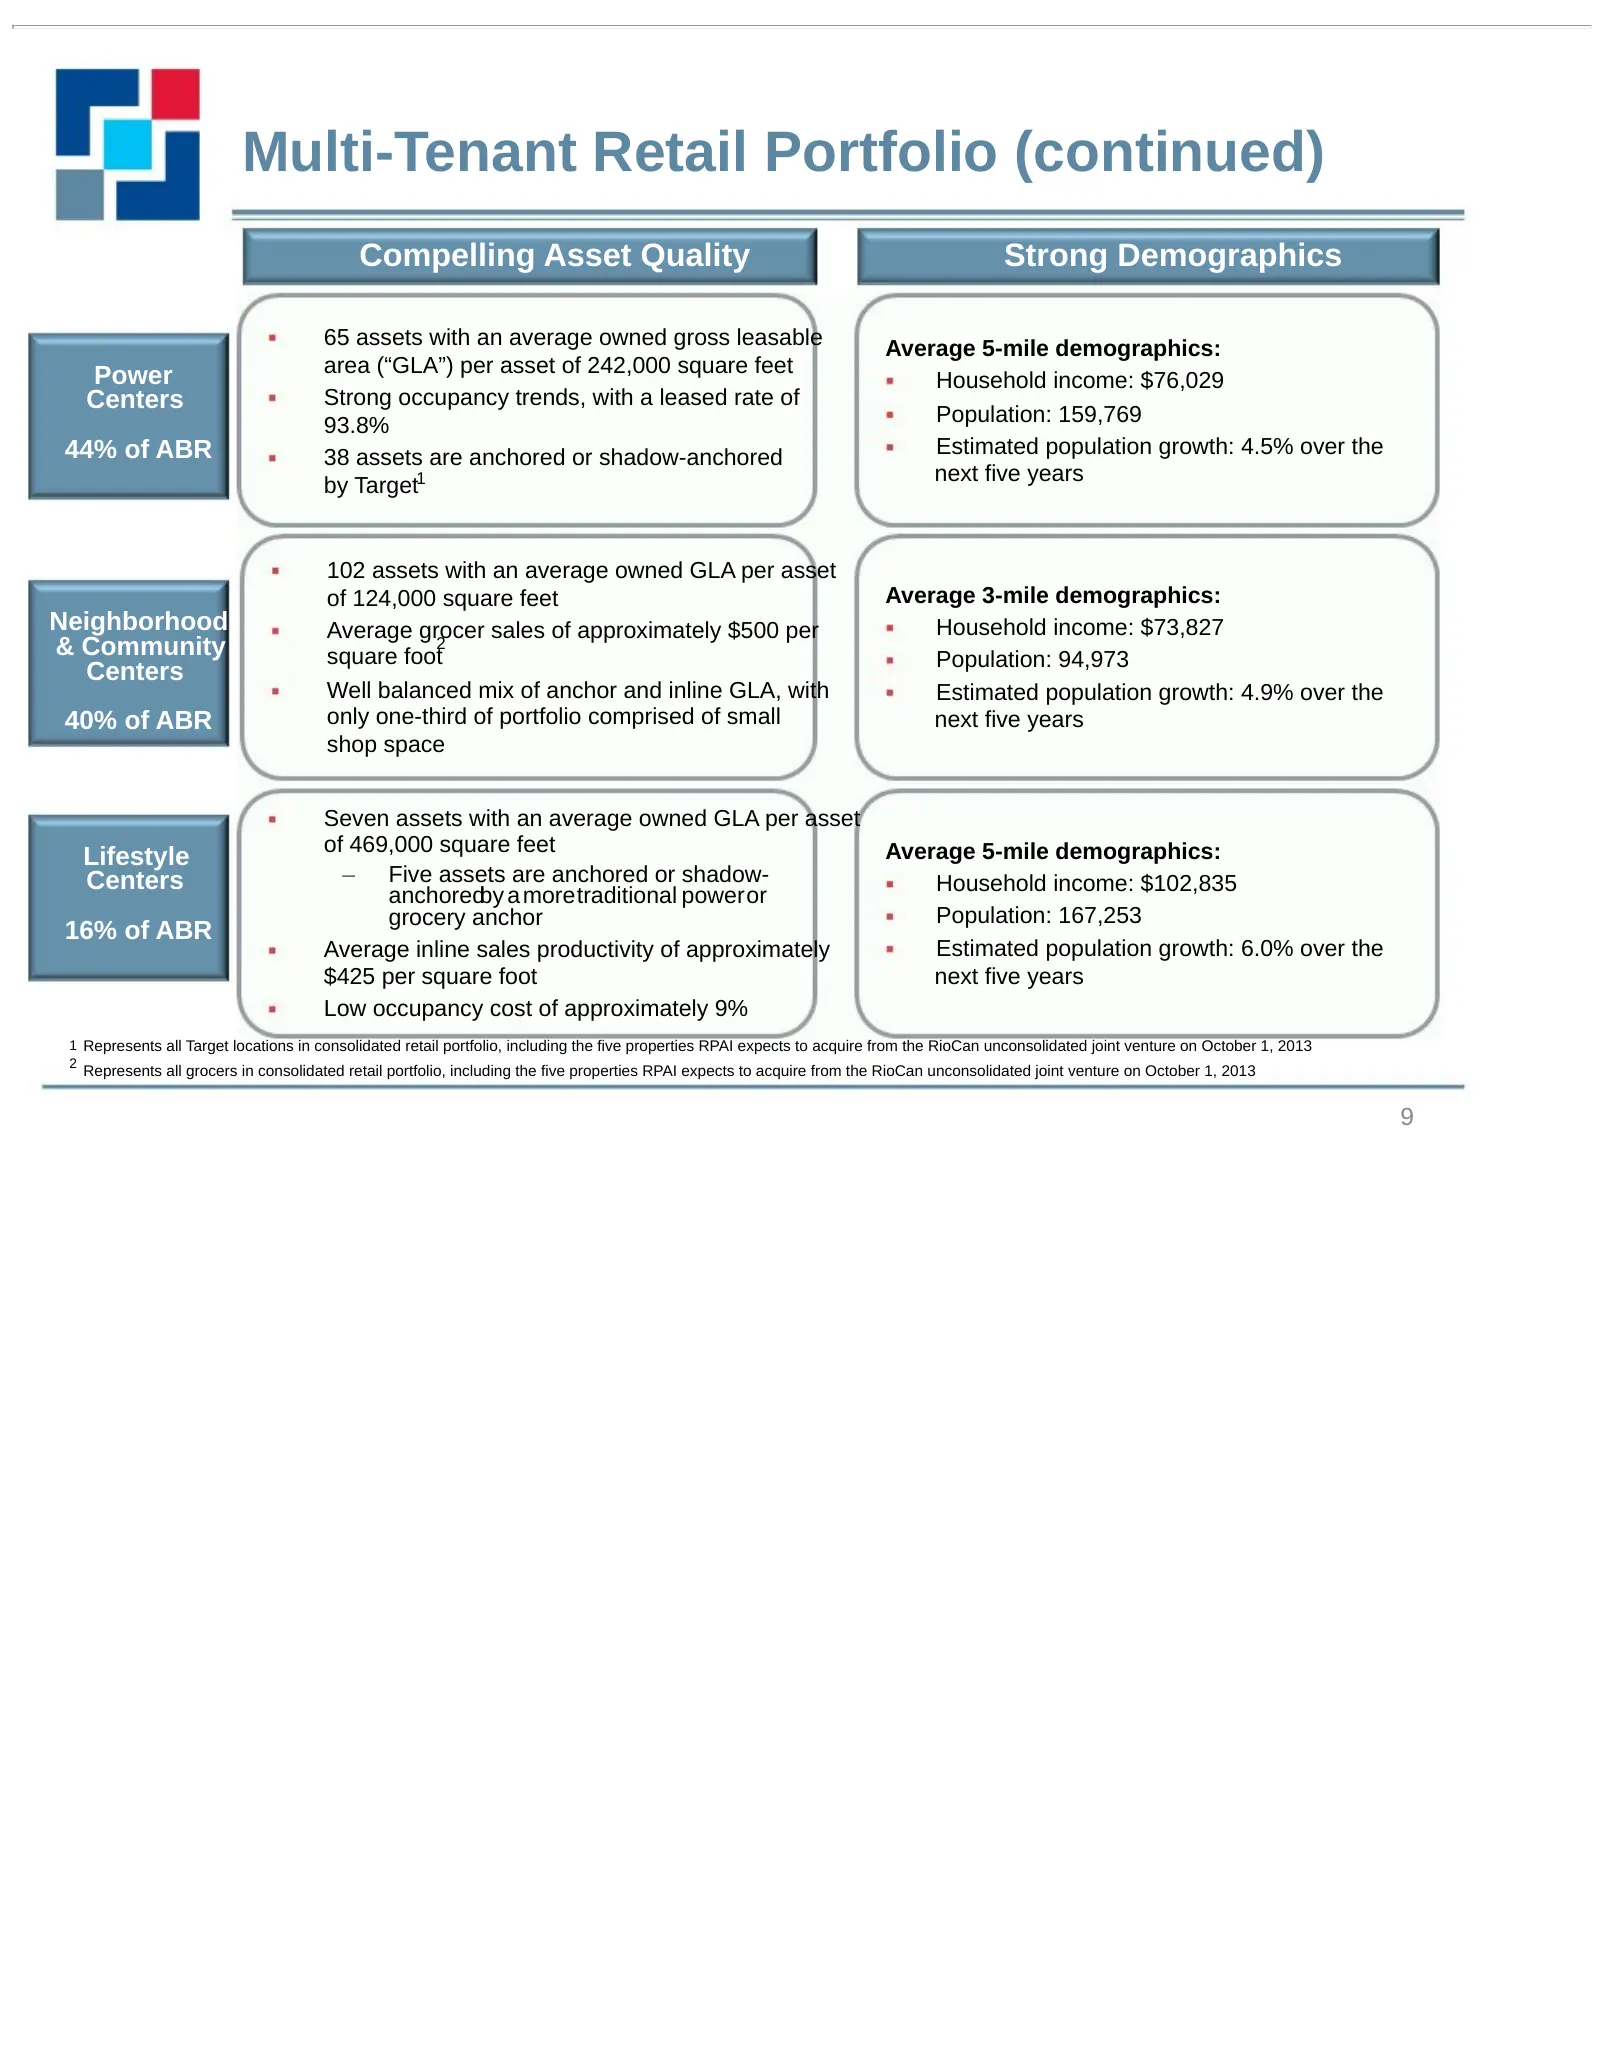
Slide 9: Multi-Tenant Retail Portfolio (continued)
Multi-Tenant Retail Portfolio (continued) Compelling Asset Quality Strong Demographics 65 assets with an average owned gross leasable Average 5-mile demographics: Power area (“GLA”) per asset of 242,000 square feet Household income: $76,029 Centers Strong occupancy trends, with a leased rate of 93.8
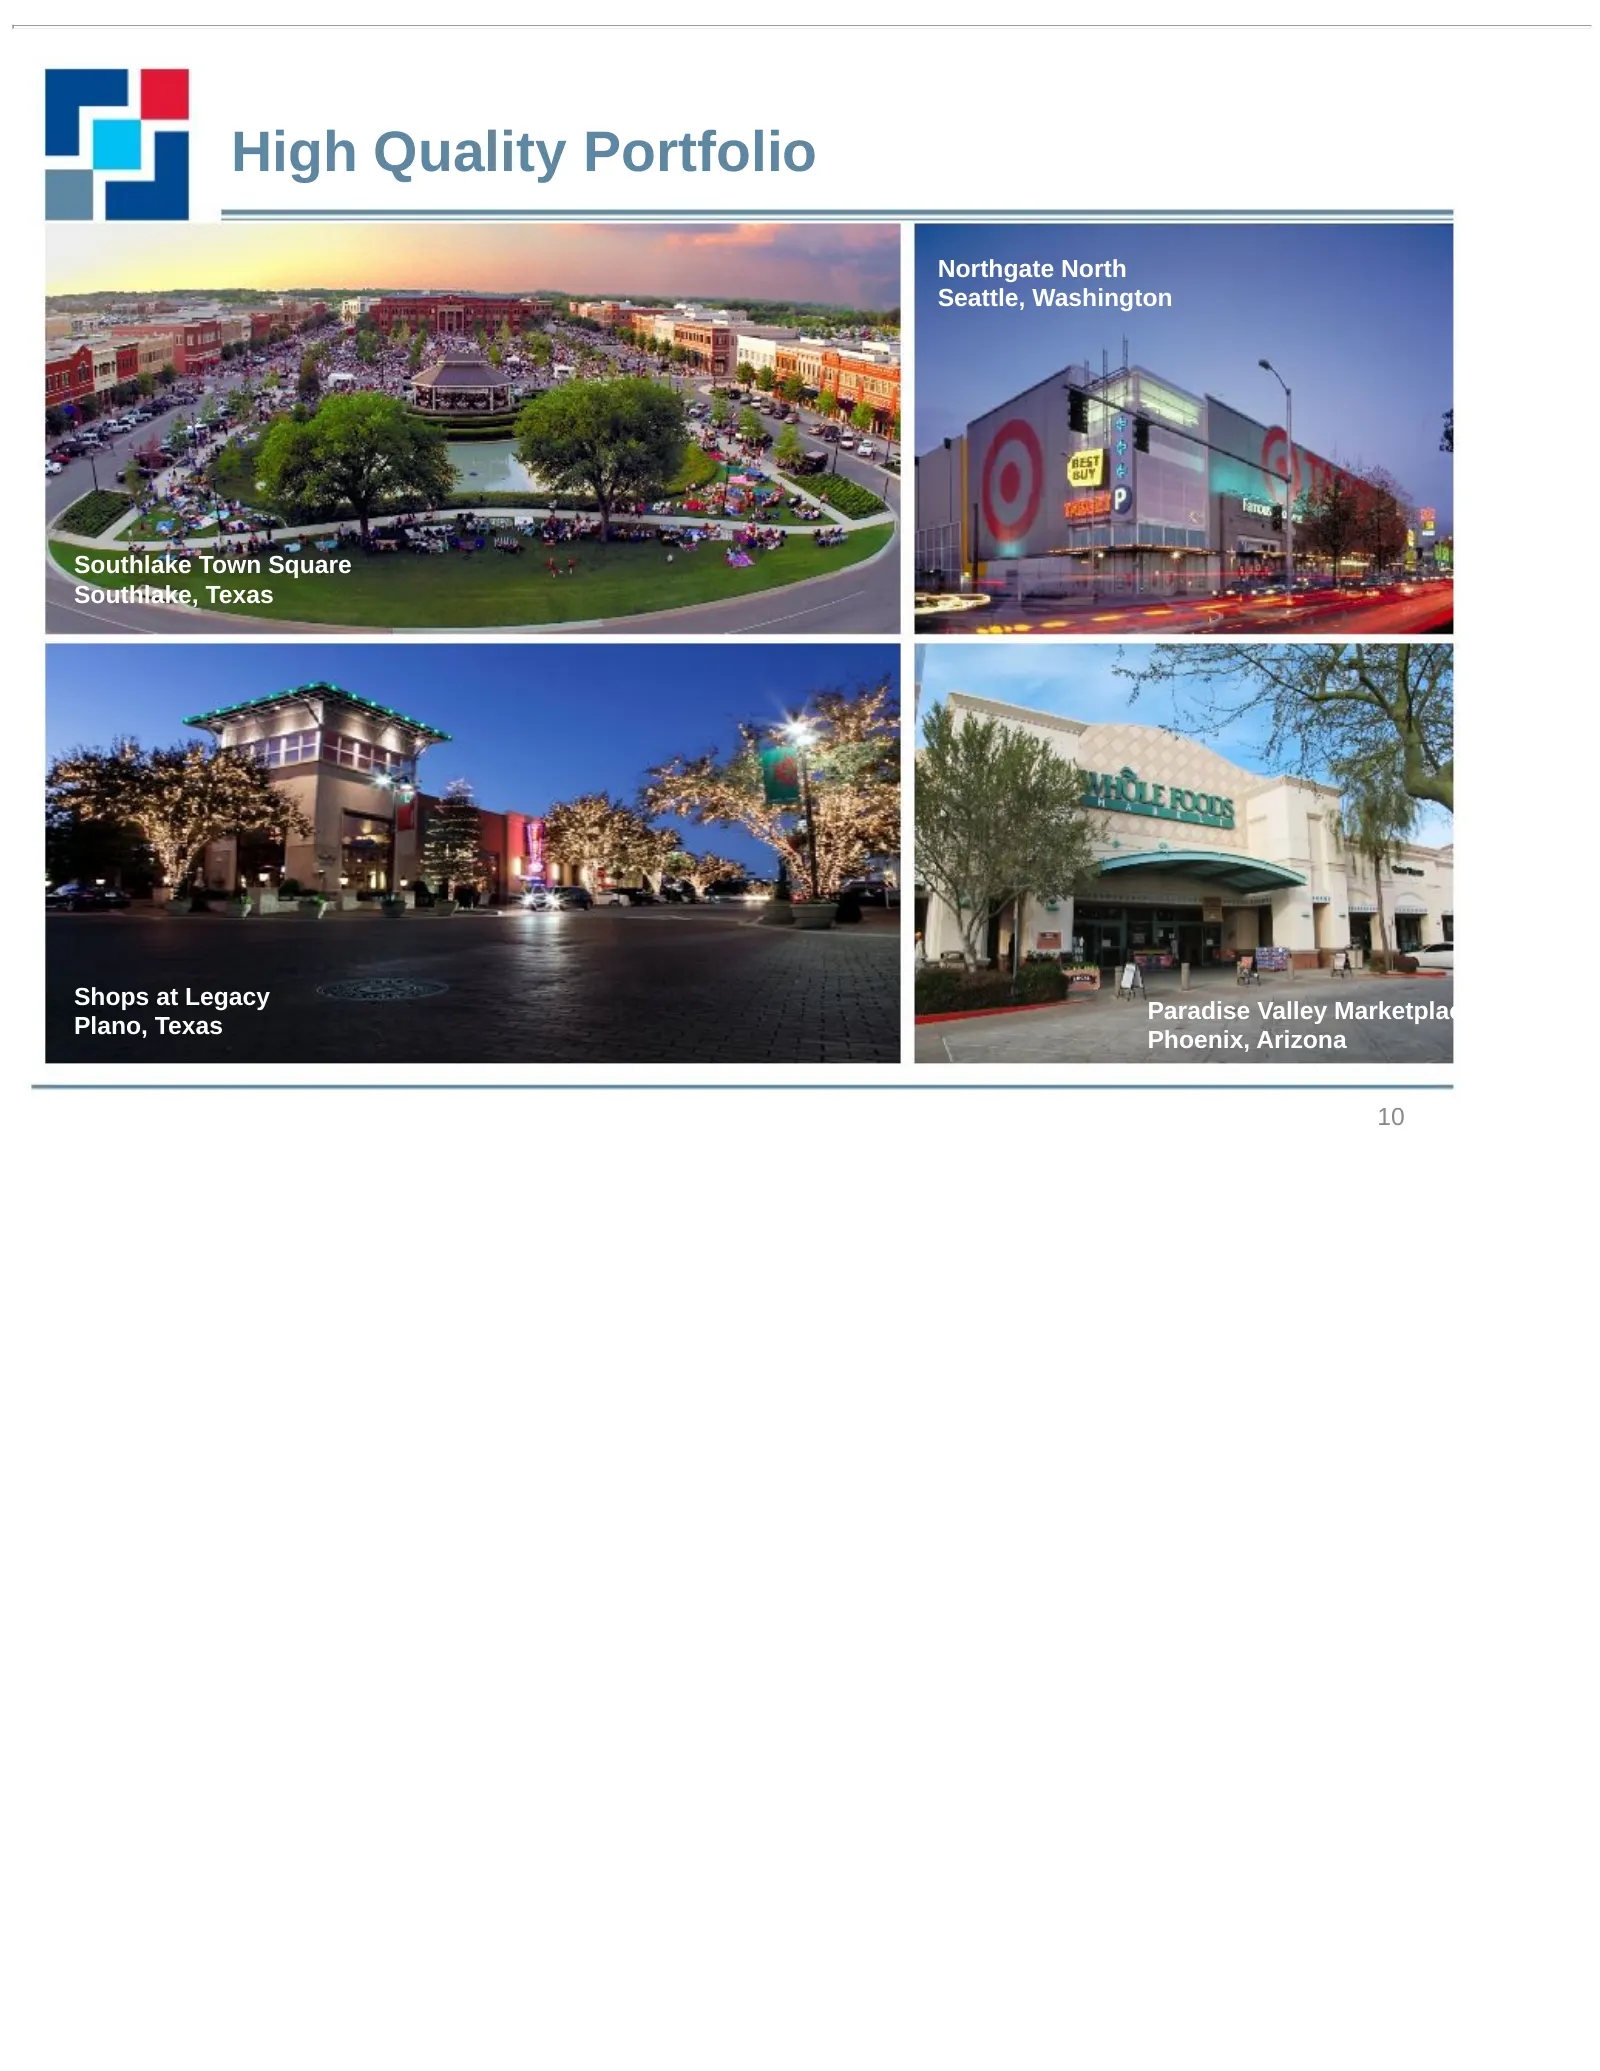
Slide 10: High Quality Portfolio
High Quality Portfolio Northgate North Seattle, Washington Southlake Town Square Southlake, Texas Shops at Legacy Paradise Valley Marketplace Plano, Texas Phoenix, Arizona 10
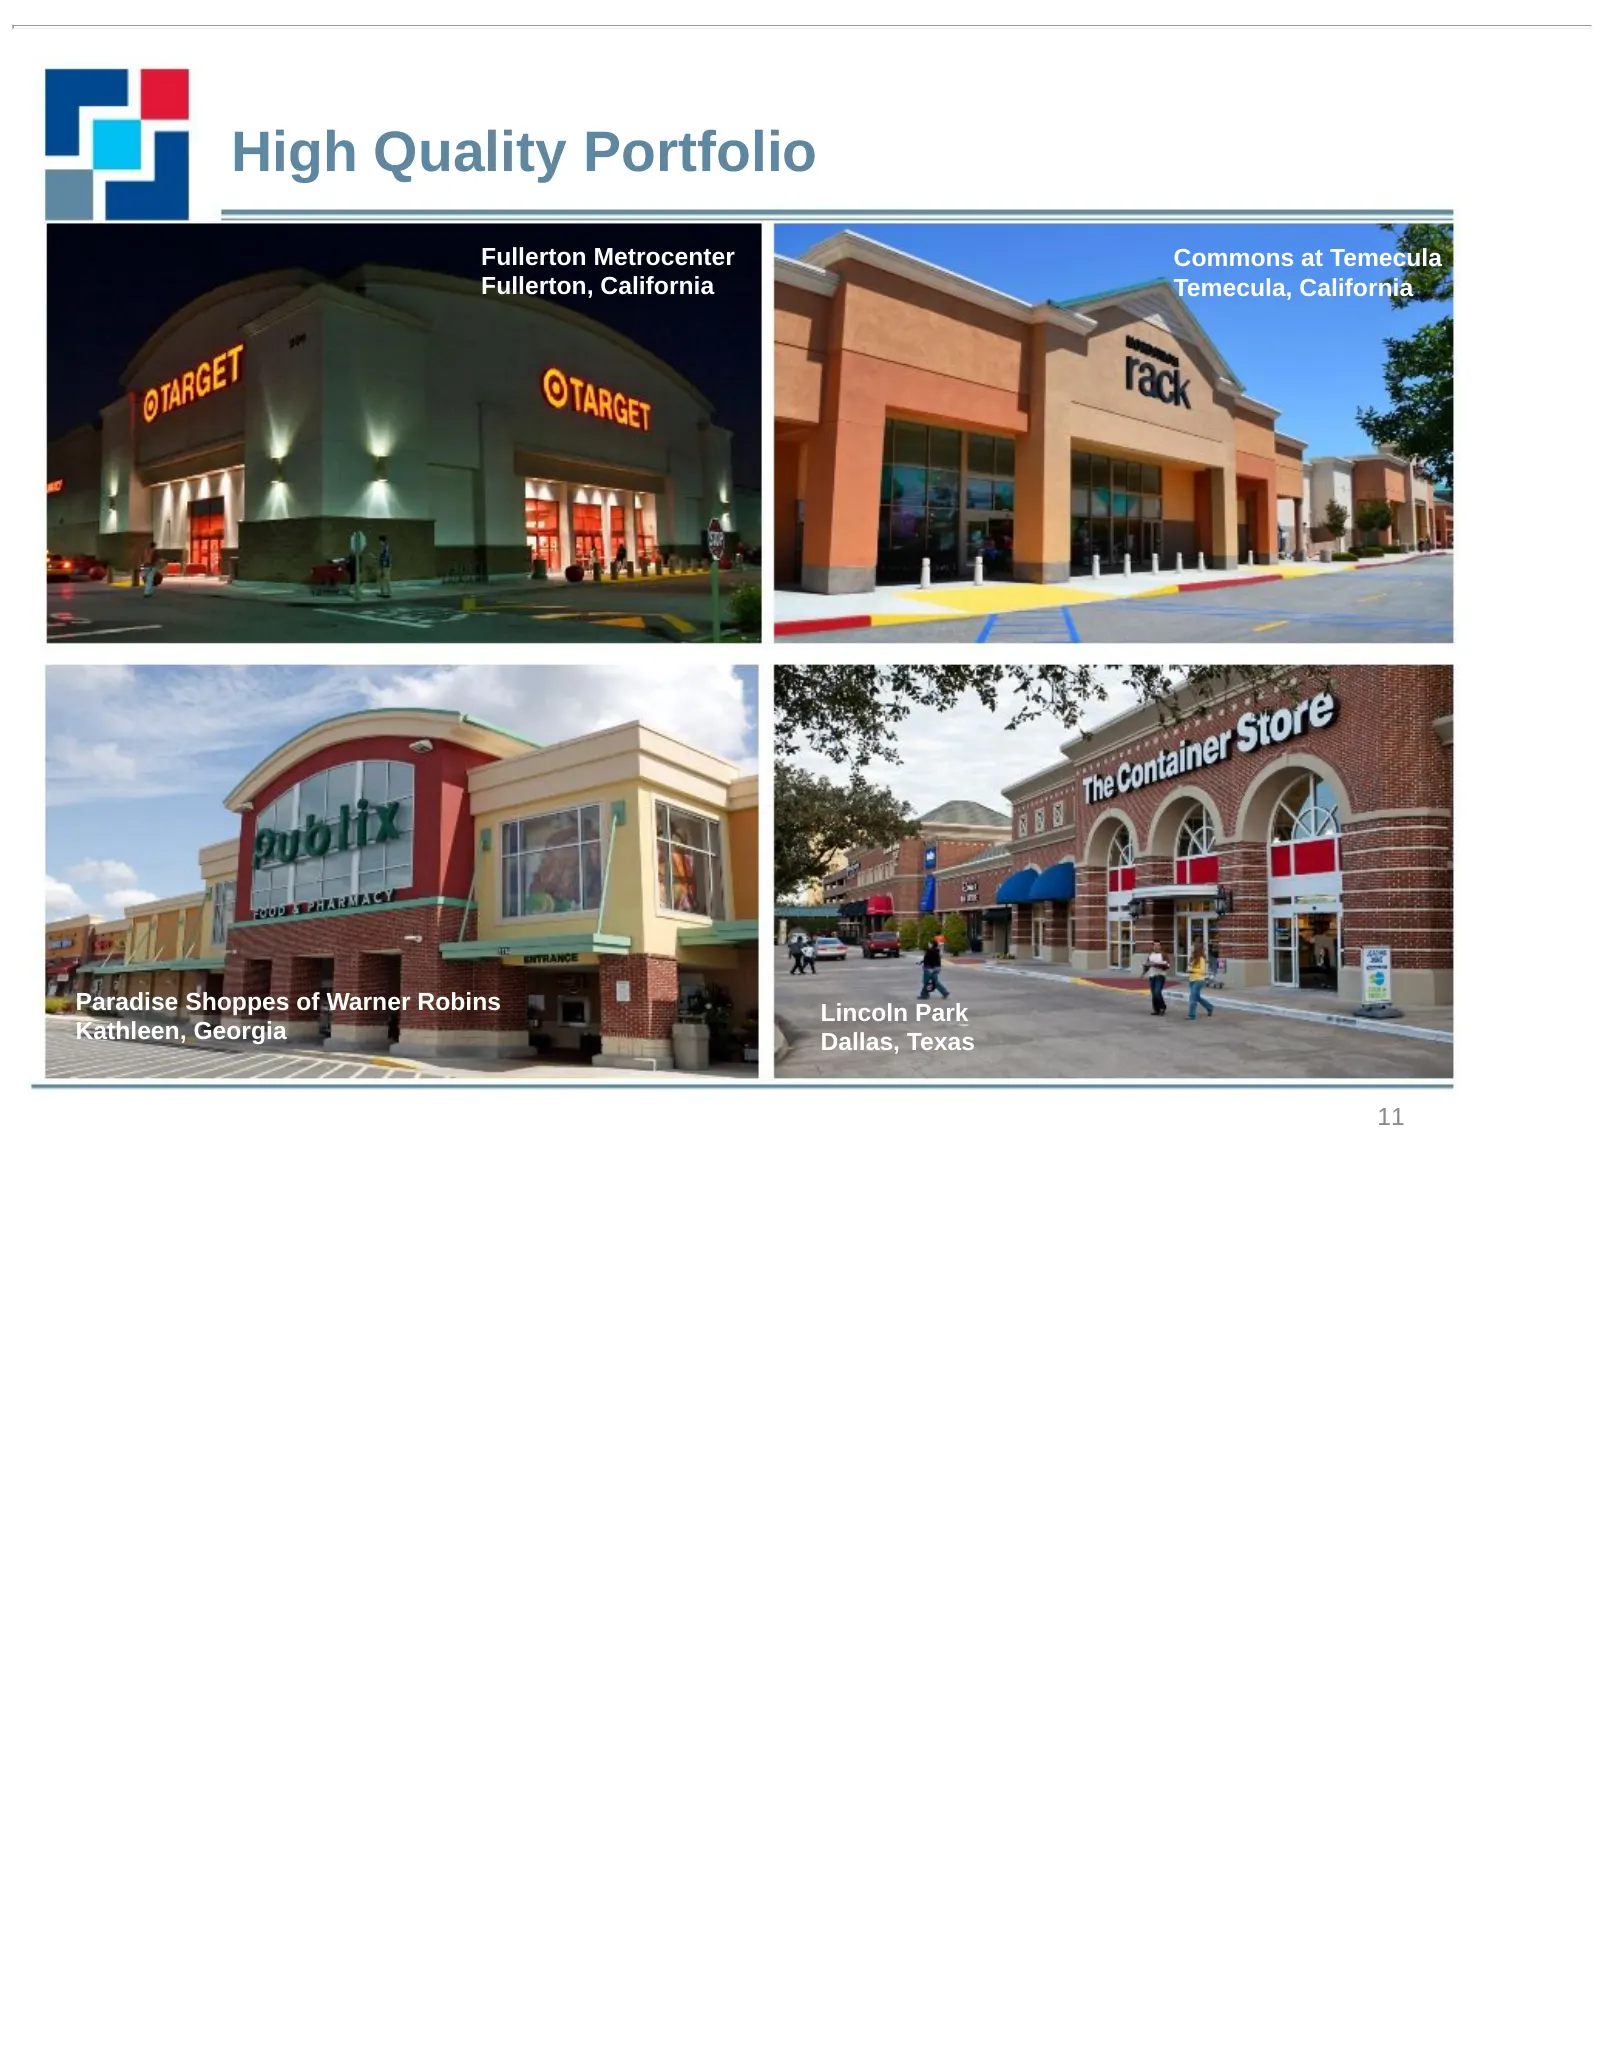
Slide 11: High Quality Portfolio
High Quality Portfolio Fullerton Metrocenter Commons at Temecula Fullerton, California Temecula, California Paradise Shoppes of Warner Robins Lincoln Park Kathleen, Georgia Dallas, Texas 11
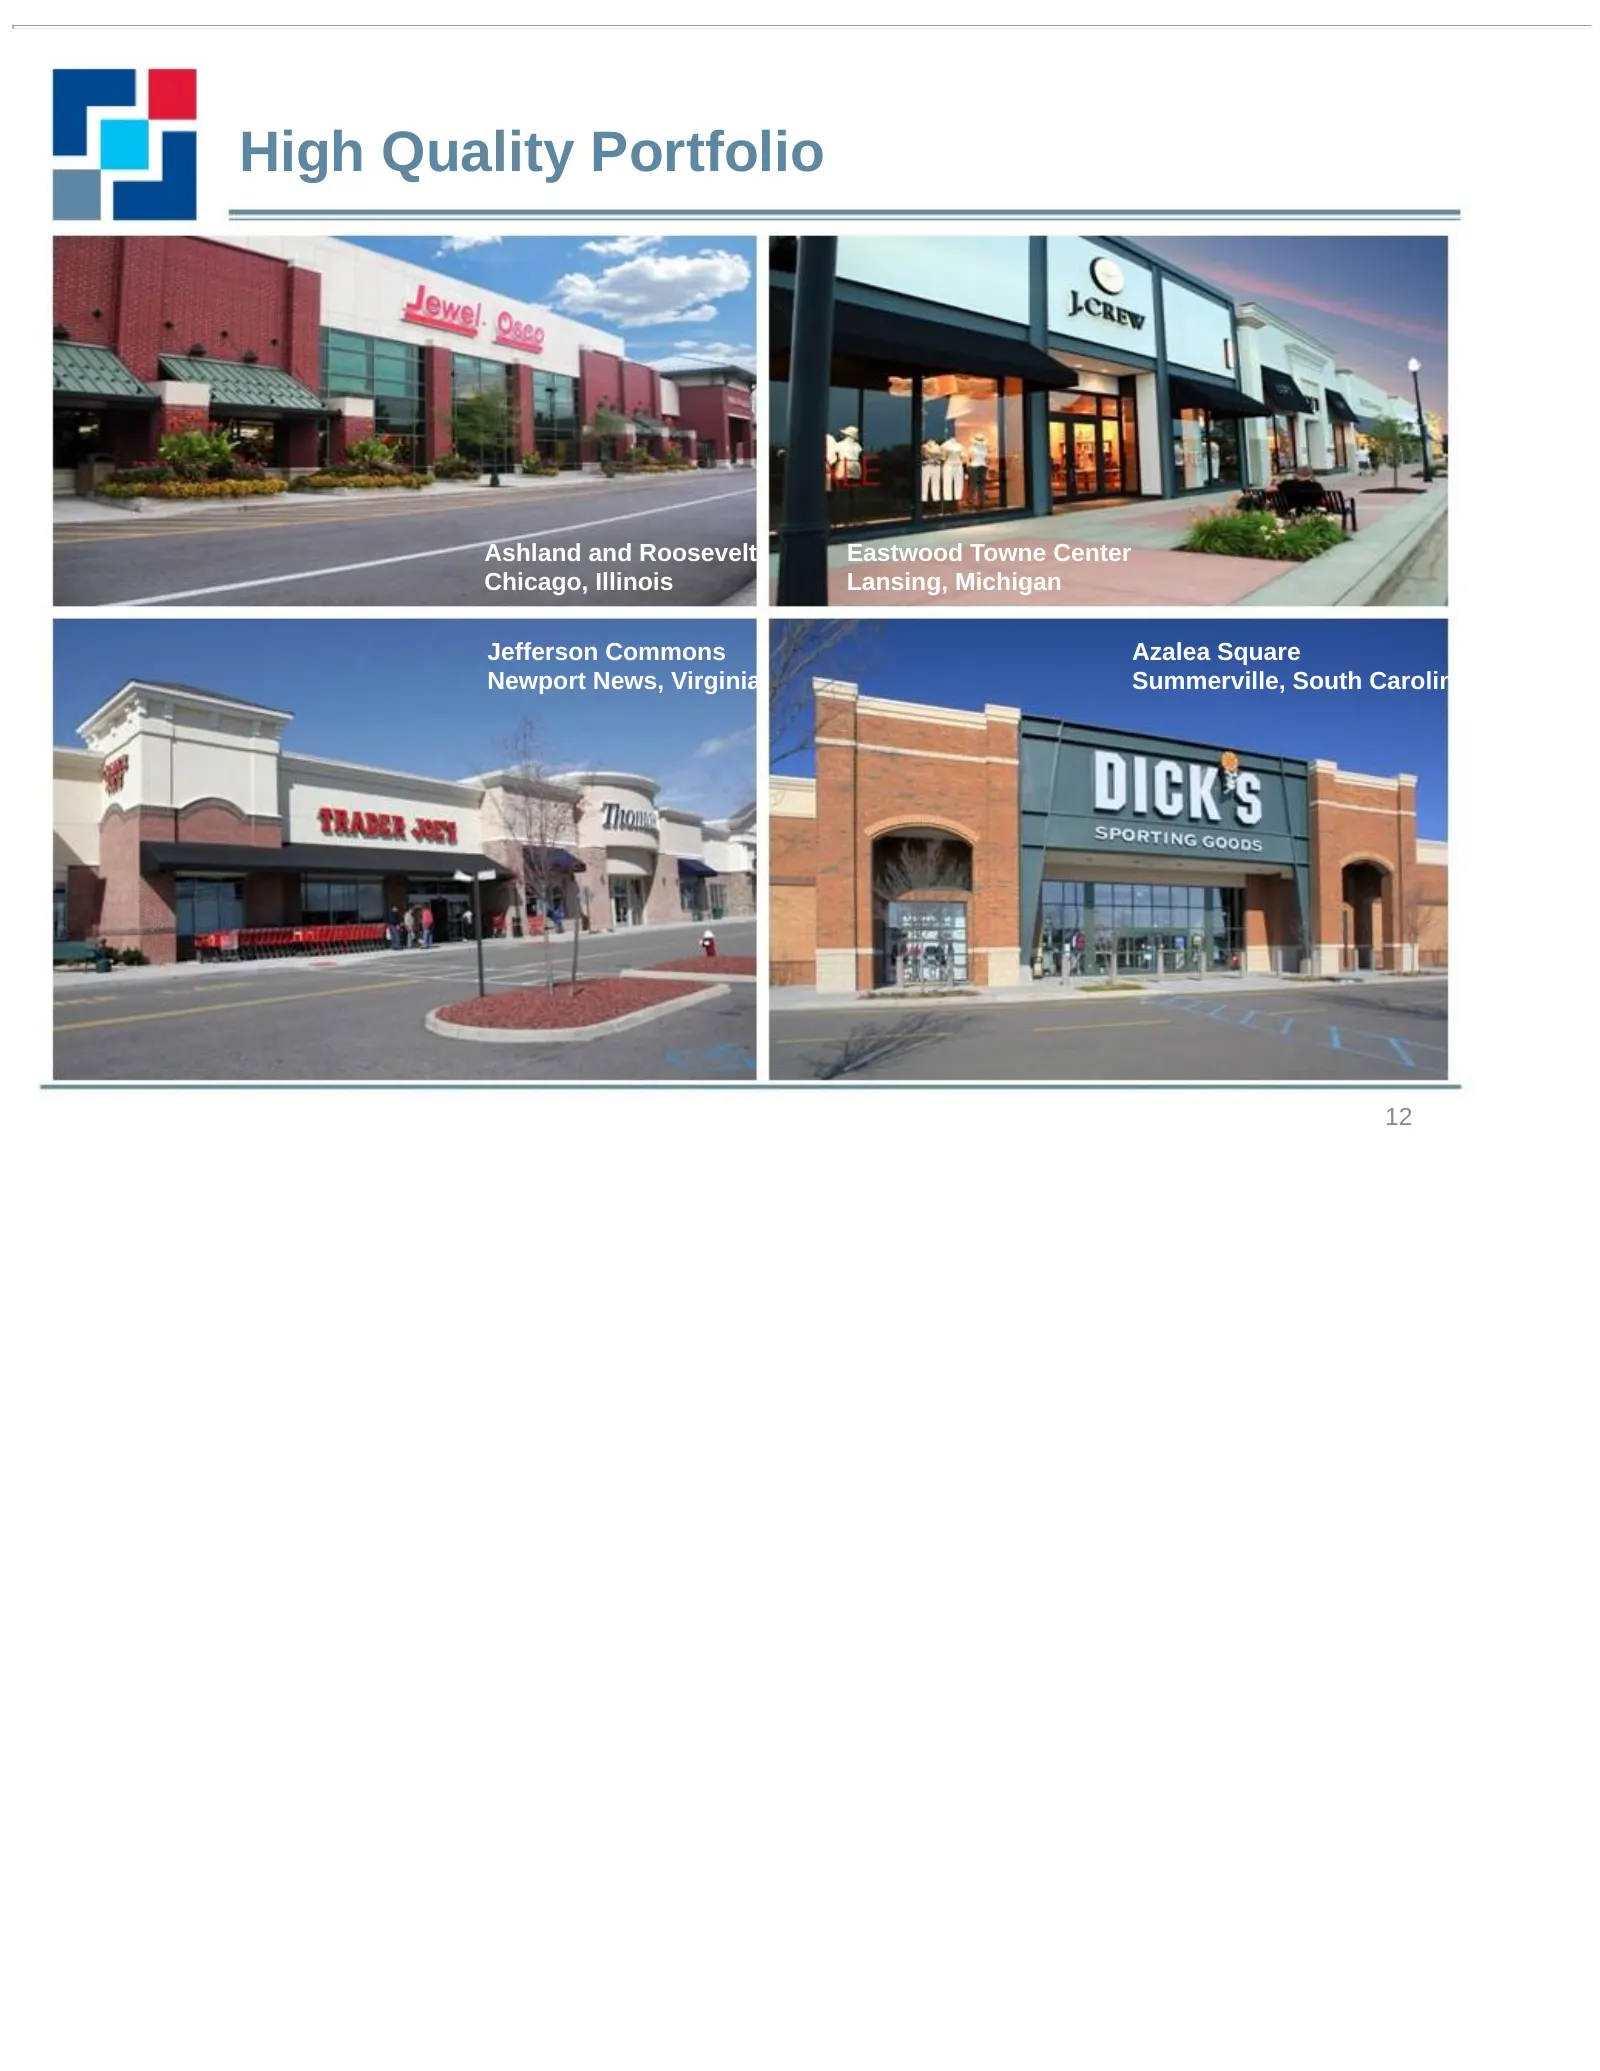
Slide 12: High Quality Portfolio
High Quality Portfolio Ashland and Roosevelt Eastwood Towne Center Chicago, Illinois Lansing, Michigan Jefferson Commons Azalea Square Newport News, Virginia Summerville, South Carolina 12
Slide 13: Our Repositioning Objective
Our Repositioning Objective To become the dominant shopping center owner in 10-15 target markets, owning 3-5 million square feet in each market. 13
Slide 14: Repositioning Rationale
Repositioning Rationale At our scale we are large enough to be relevant to our retailer partners – We have an open dialogue with national retailers regarding store opening and expansion plans – We have a seat at the table in times of distress We believe that the path to maximizing same store NOI per
Slide 15: Execution Plan: Near-term goals
Execution Plan Near-term goals – Dispositions • 2013 is expected to be our last year as a net seller • We anticipate selling approximately nine consolidated multi- tenant retail assets this year, exiting four markets including Davenport, IA, Warner Robins, GA, Sarasota, FL, and Boston, MA – Acquisit
Slide 16: Execution Plan: Intermediate to long-term goals
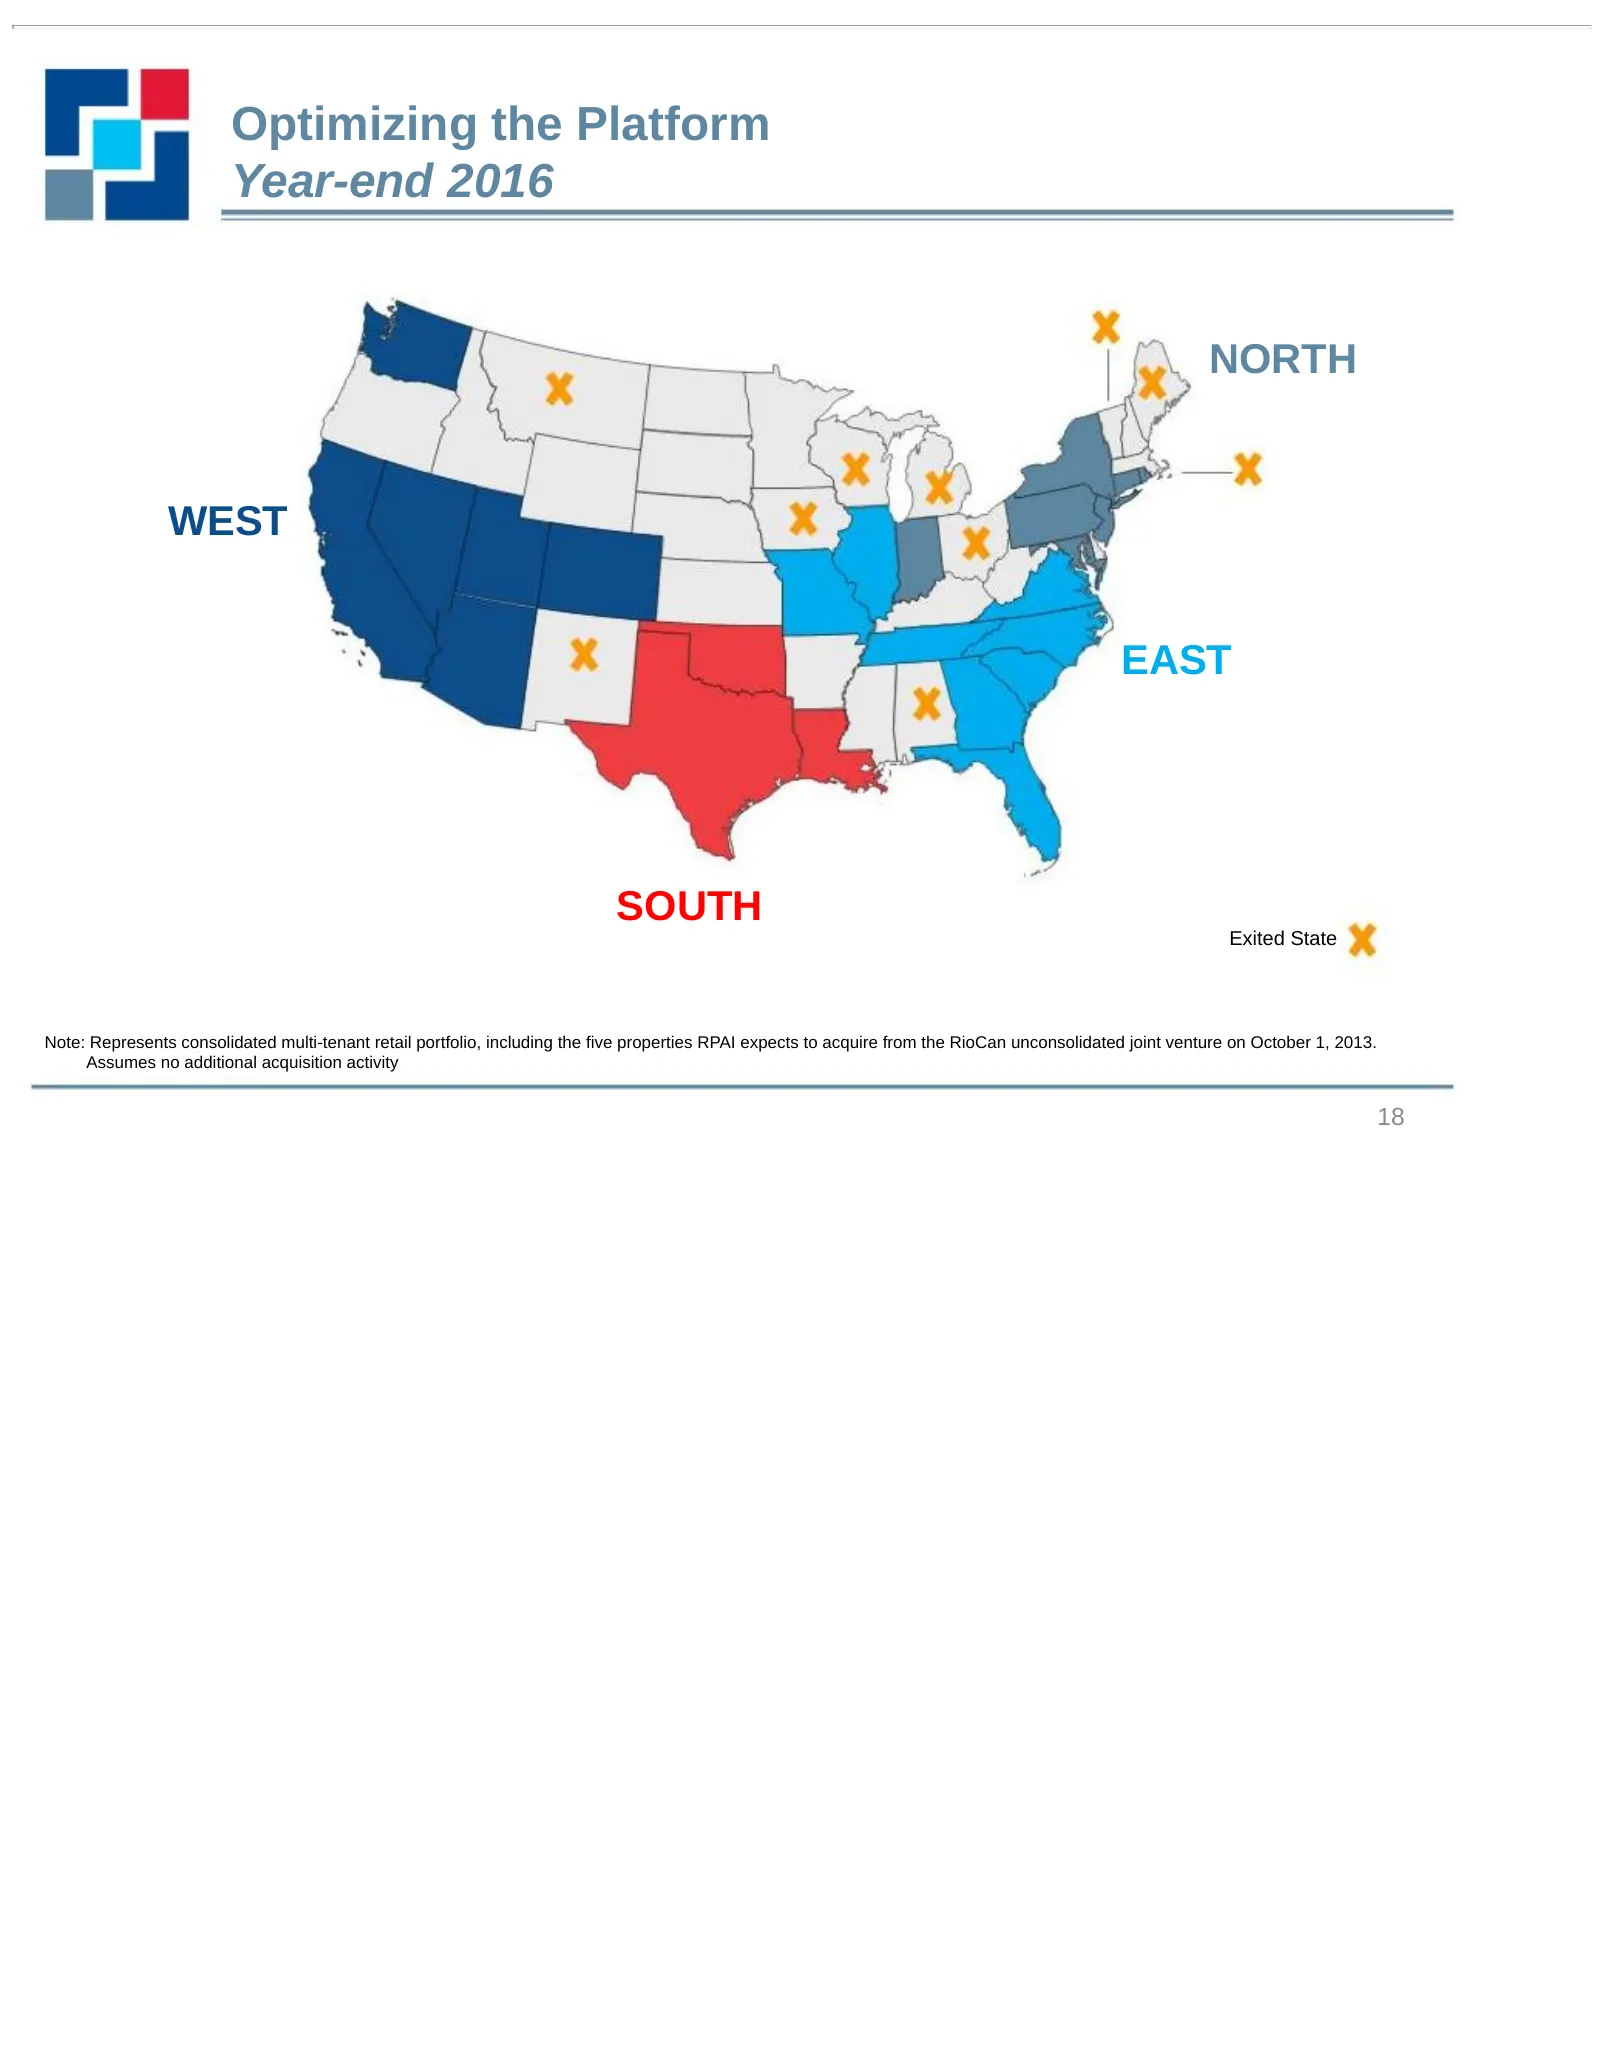
Execution Plan (continued) Intermediate to long-term goals – Dispositions • Going forward, we will continue to dispose of assets outside of our target markets • Over the next three years, we can realistically exit as many as 10 states and 40 MSAs, improving portfolio concentration, demographics, and
Slide 17: Optimizing the Platform Today
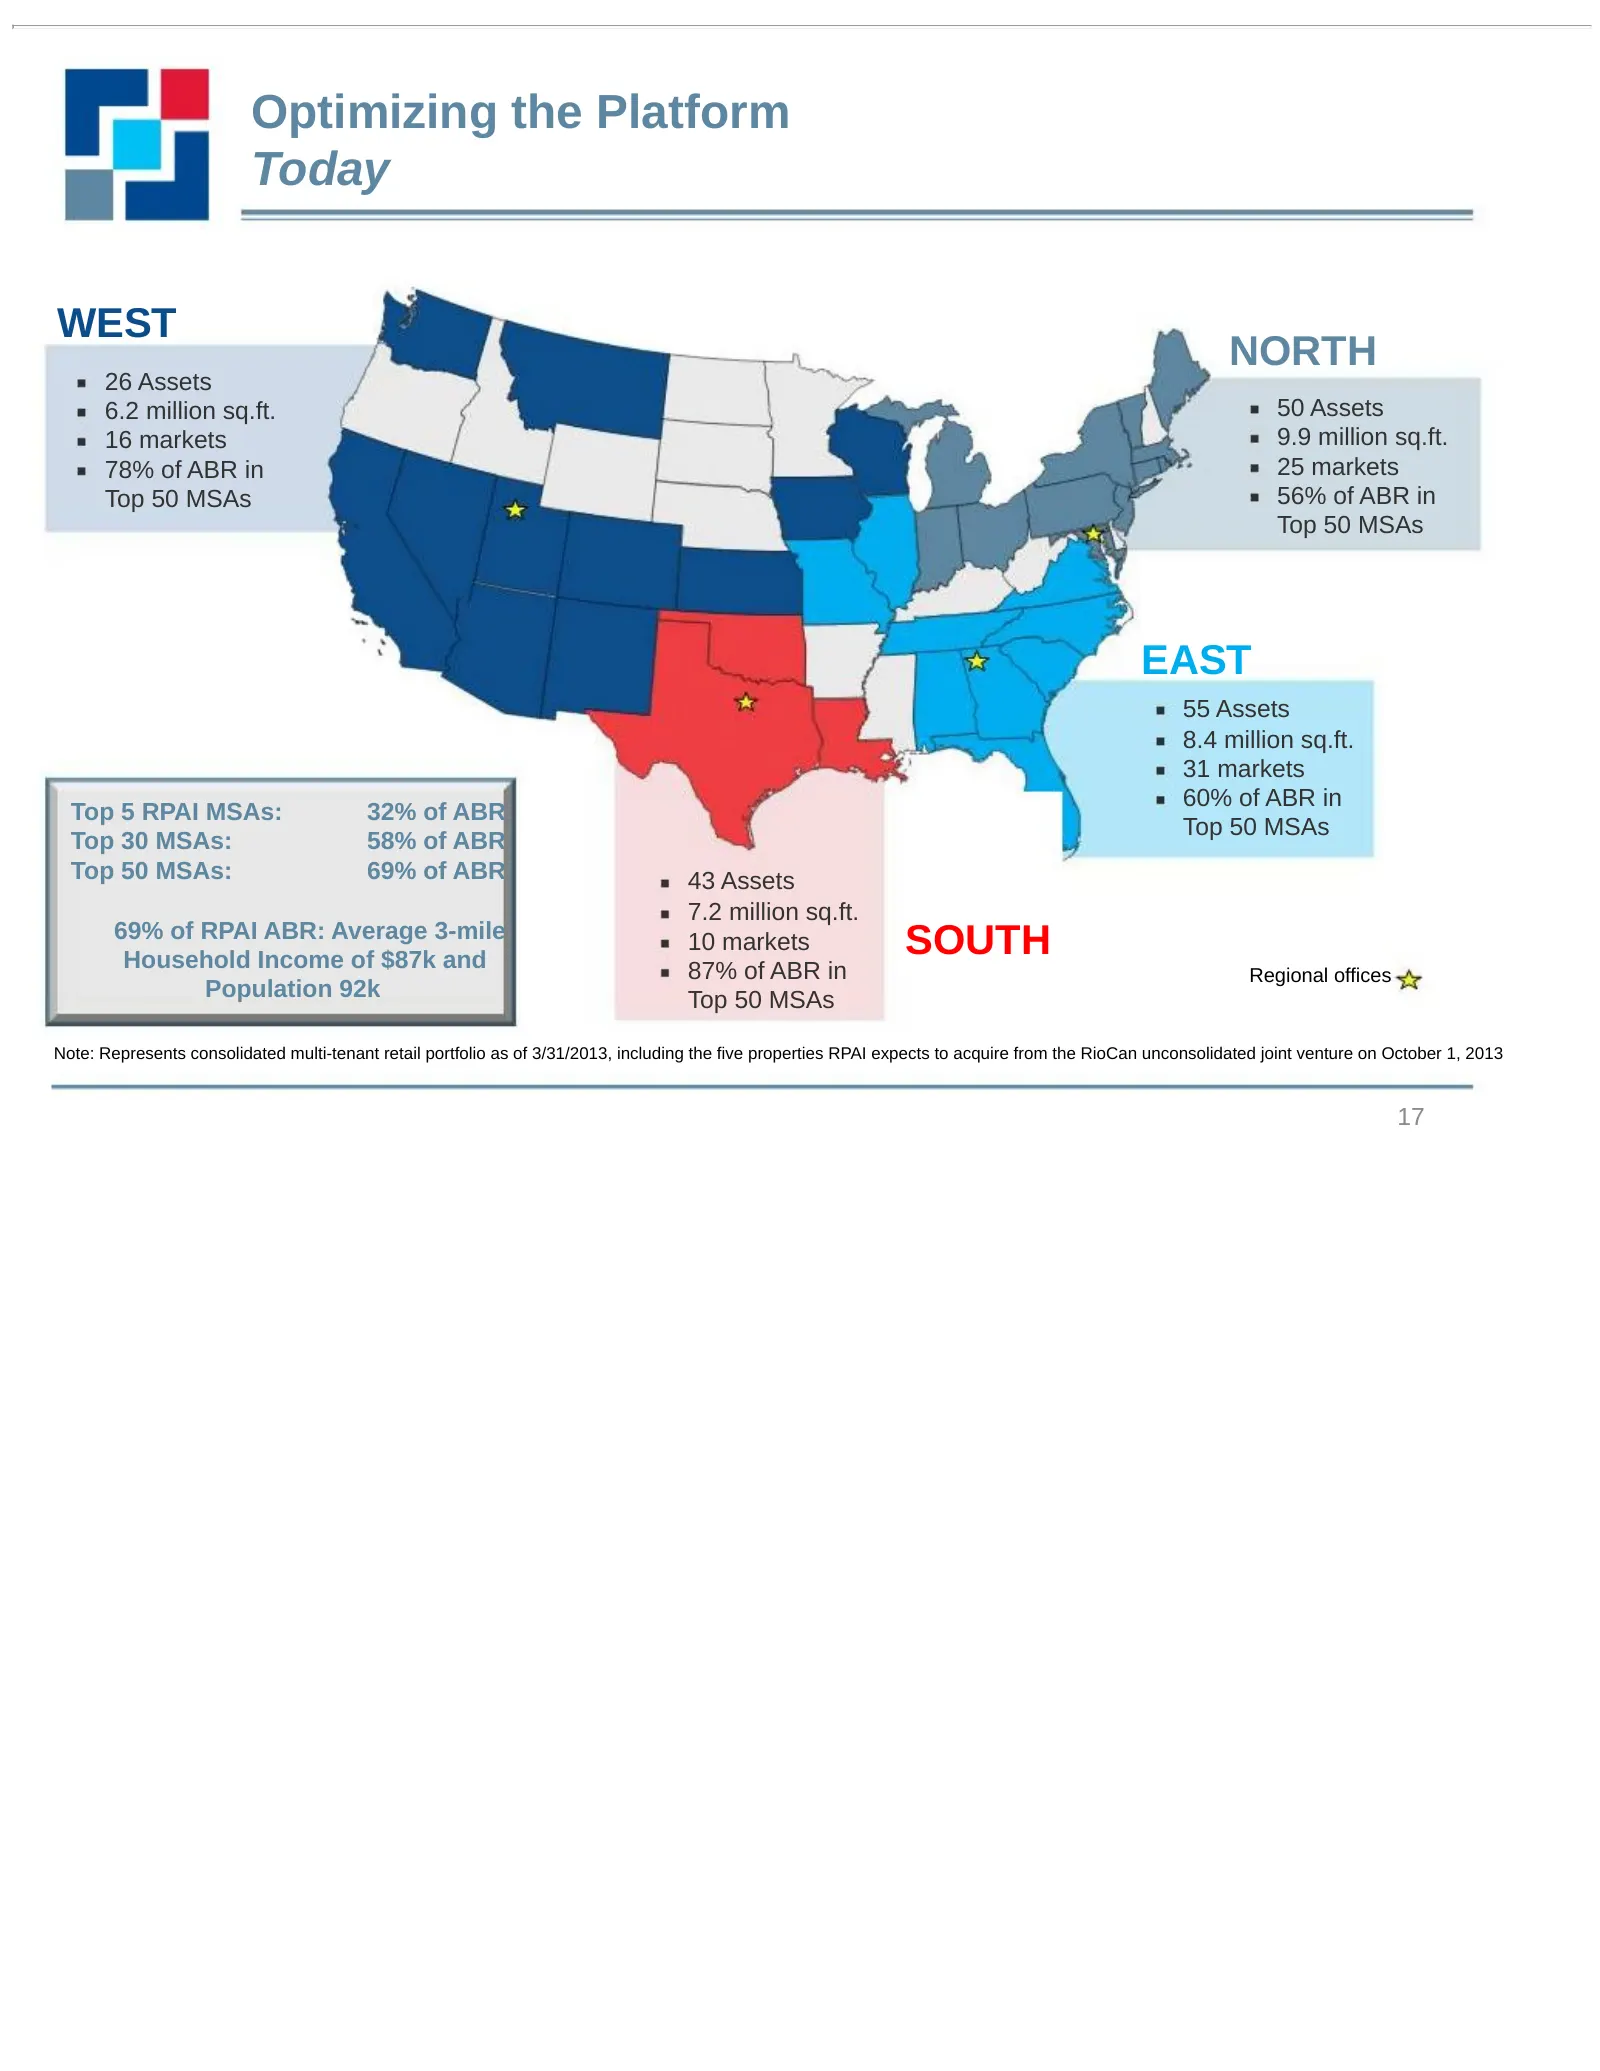
Optimizing the Platform Today WEST NORTH 26 Assets 6.2 million sq.ft. 50 Assets 16 markets 9.9 million sq.ft. 78% of ABR in 25 markets Top 50 MSAs 56% of ABR in Top 50 MSAs EAST 55 Assets 8.4 million sq.ft. 31 markets 60% of ABR in Top 5 RPAI MSAs: 32% of ABR Top 50 MSAs Top 30 MSAs: 58% of ABR Top
Slide 18: Optimizing the Platform Year-end 2016
Optimizing the Platform Year-end 2016 NORTH WEST EAST SOUTH Exited State Note: Represents consolidated multi-tenant retail portfolio, including the five properties RPAI expects to acquire from the RioCan unconsolidated joint venture on October 1, 2013. Assumes no additional acquisition activity 18
Slide 19: Target Market Characteristics
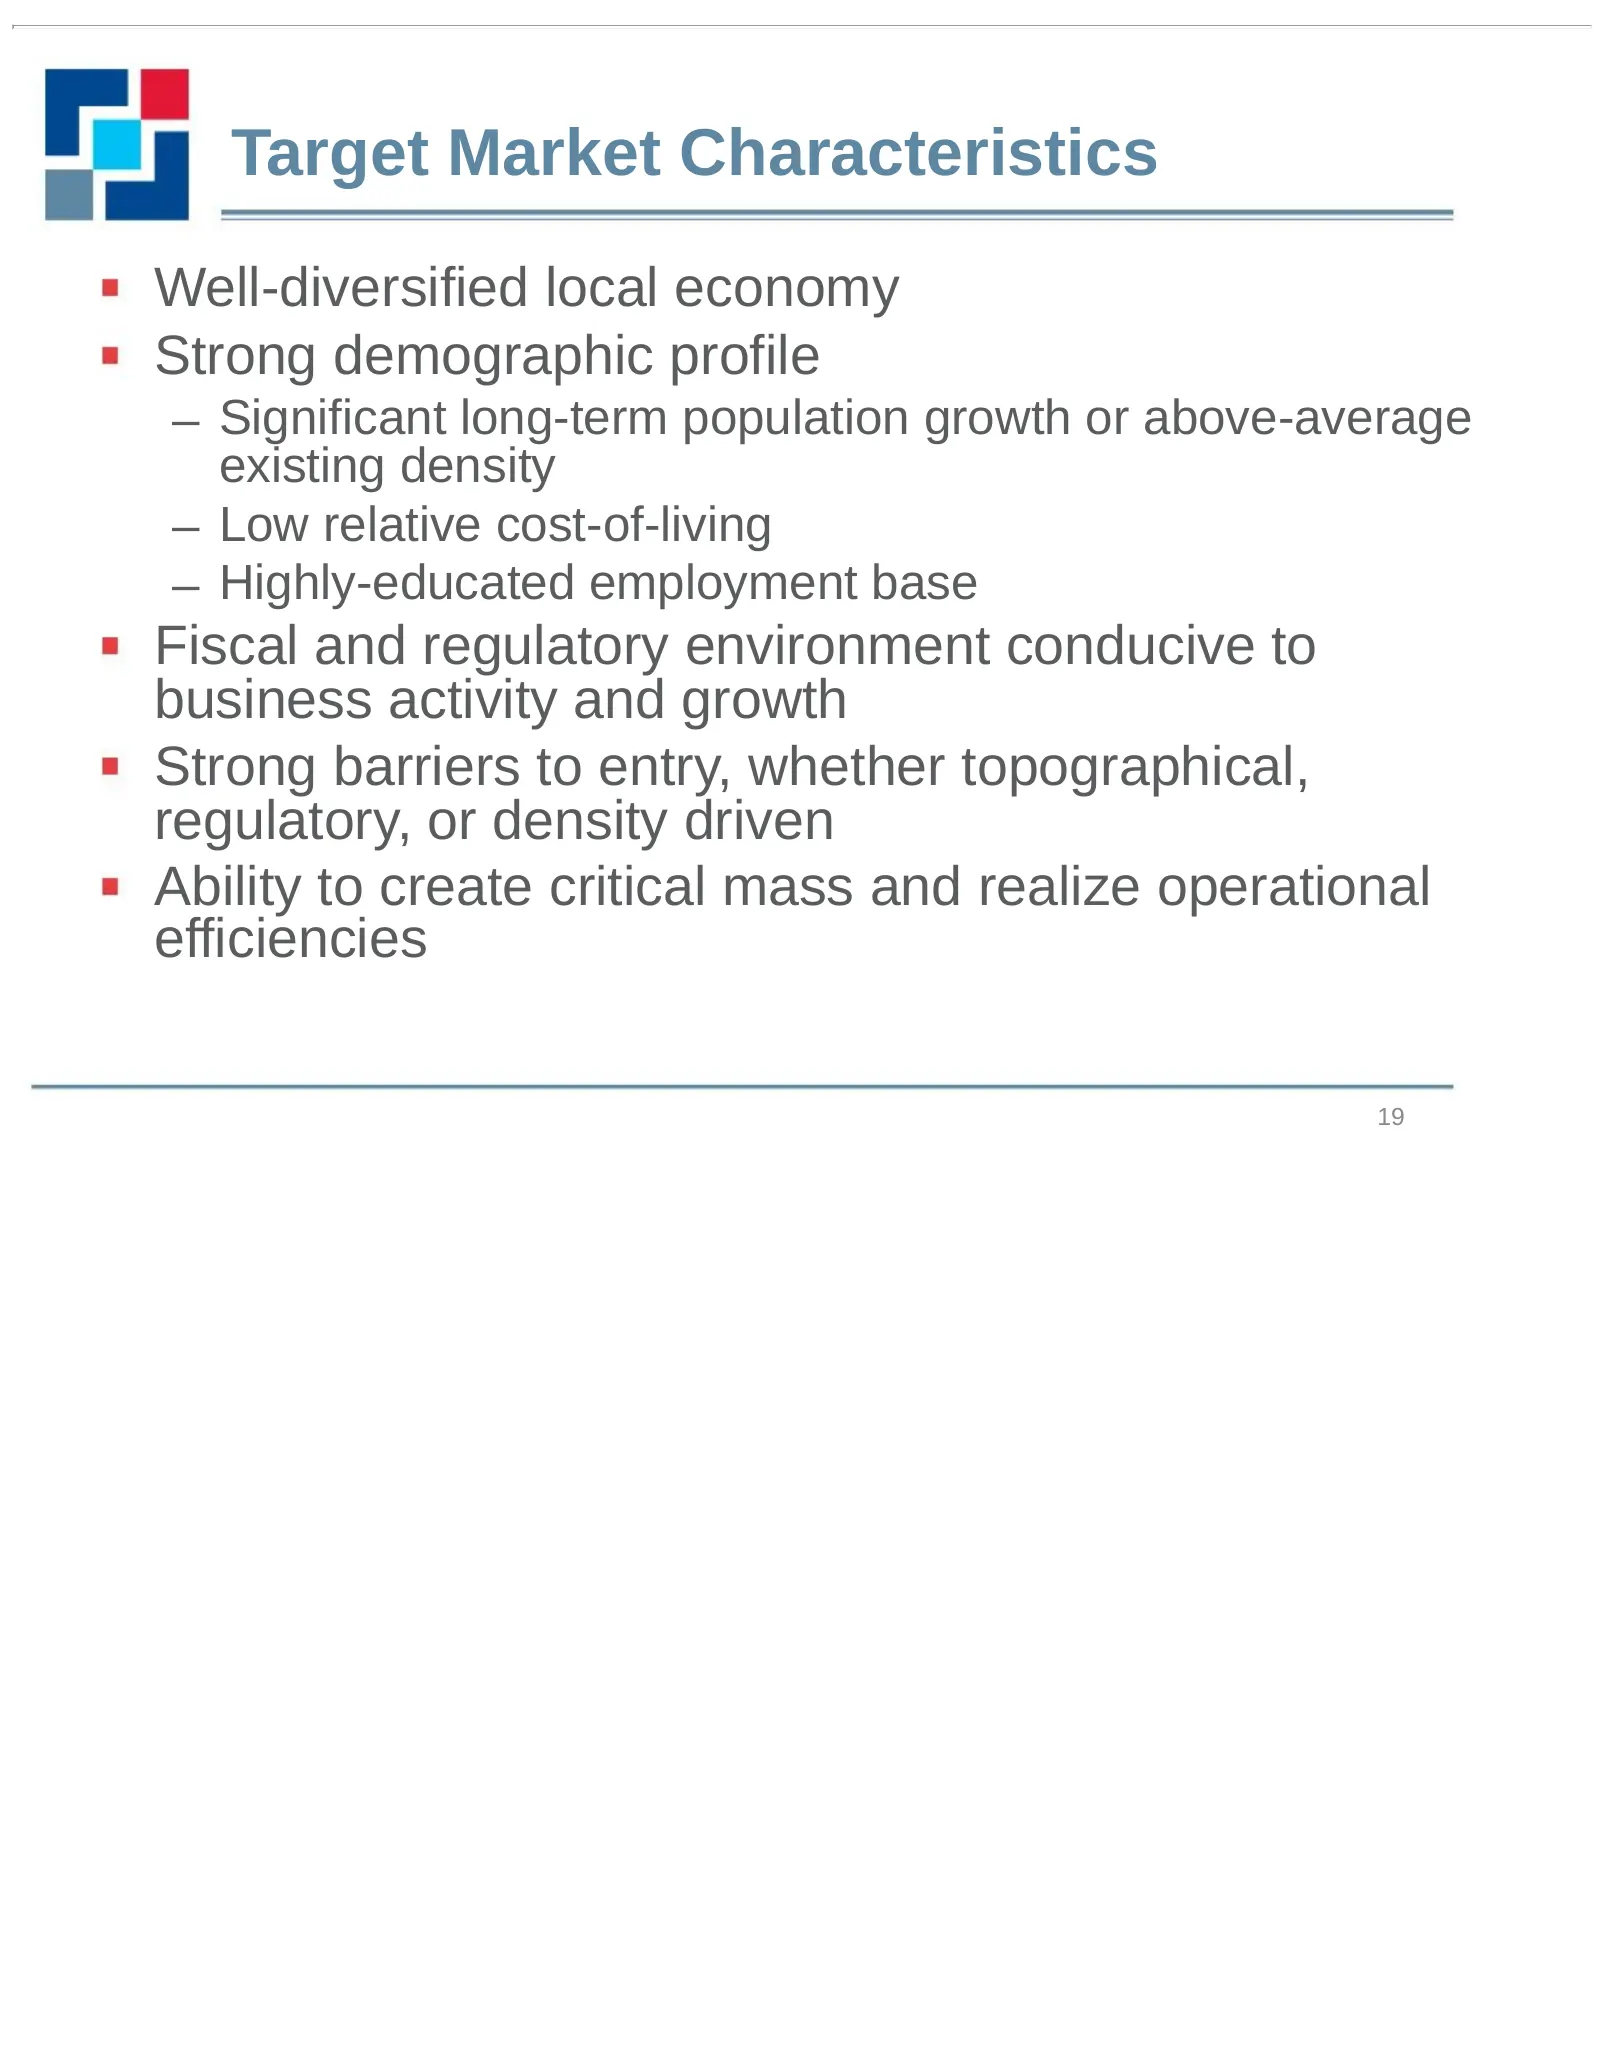
Target Market Characteristics Well-diversified local economy Strong demographic profile – Significant long-term population growth or above-average existing density – Low relative cost-of-living – Highly-educated employment base Fiscal and regulatory environment conducive to business activity and gro

Slide 20: Target Market Approach
Target Market Approach Shane Garrison
Slide 21: Texas
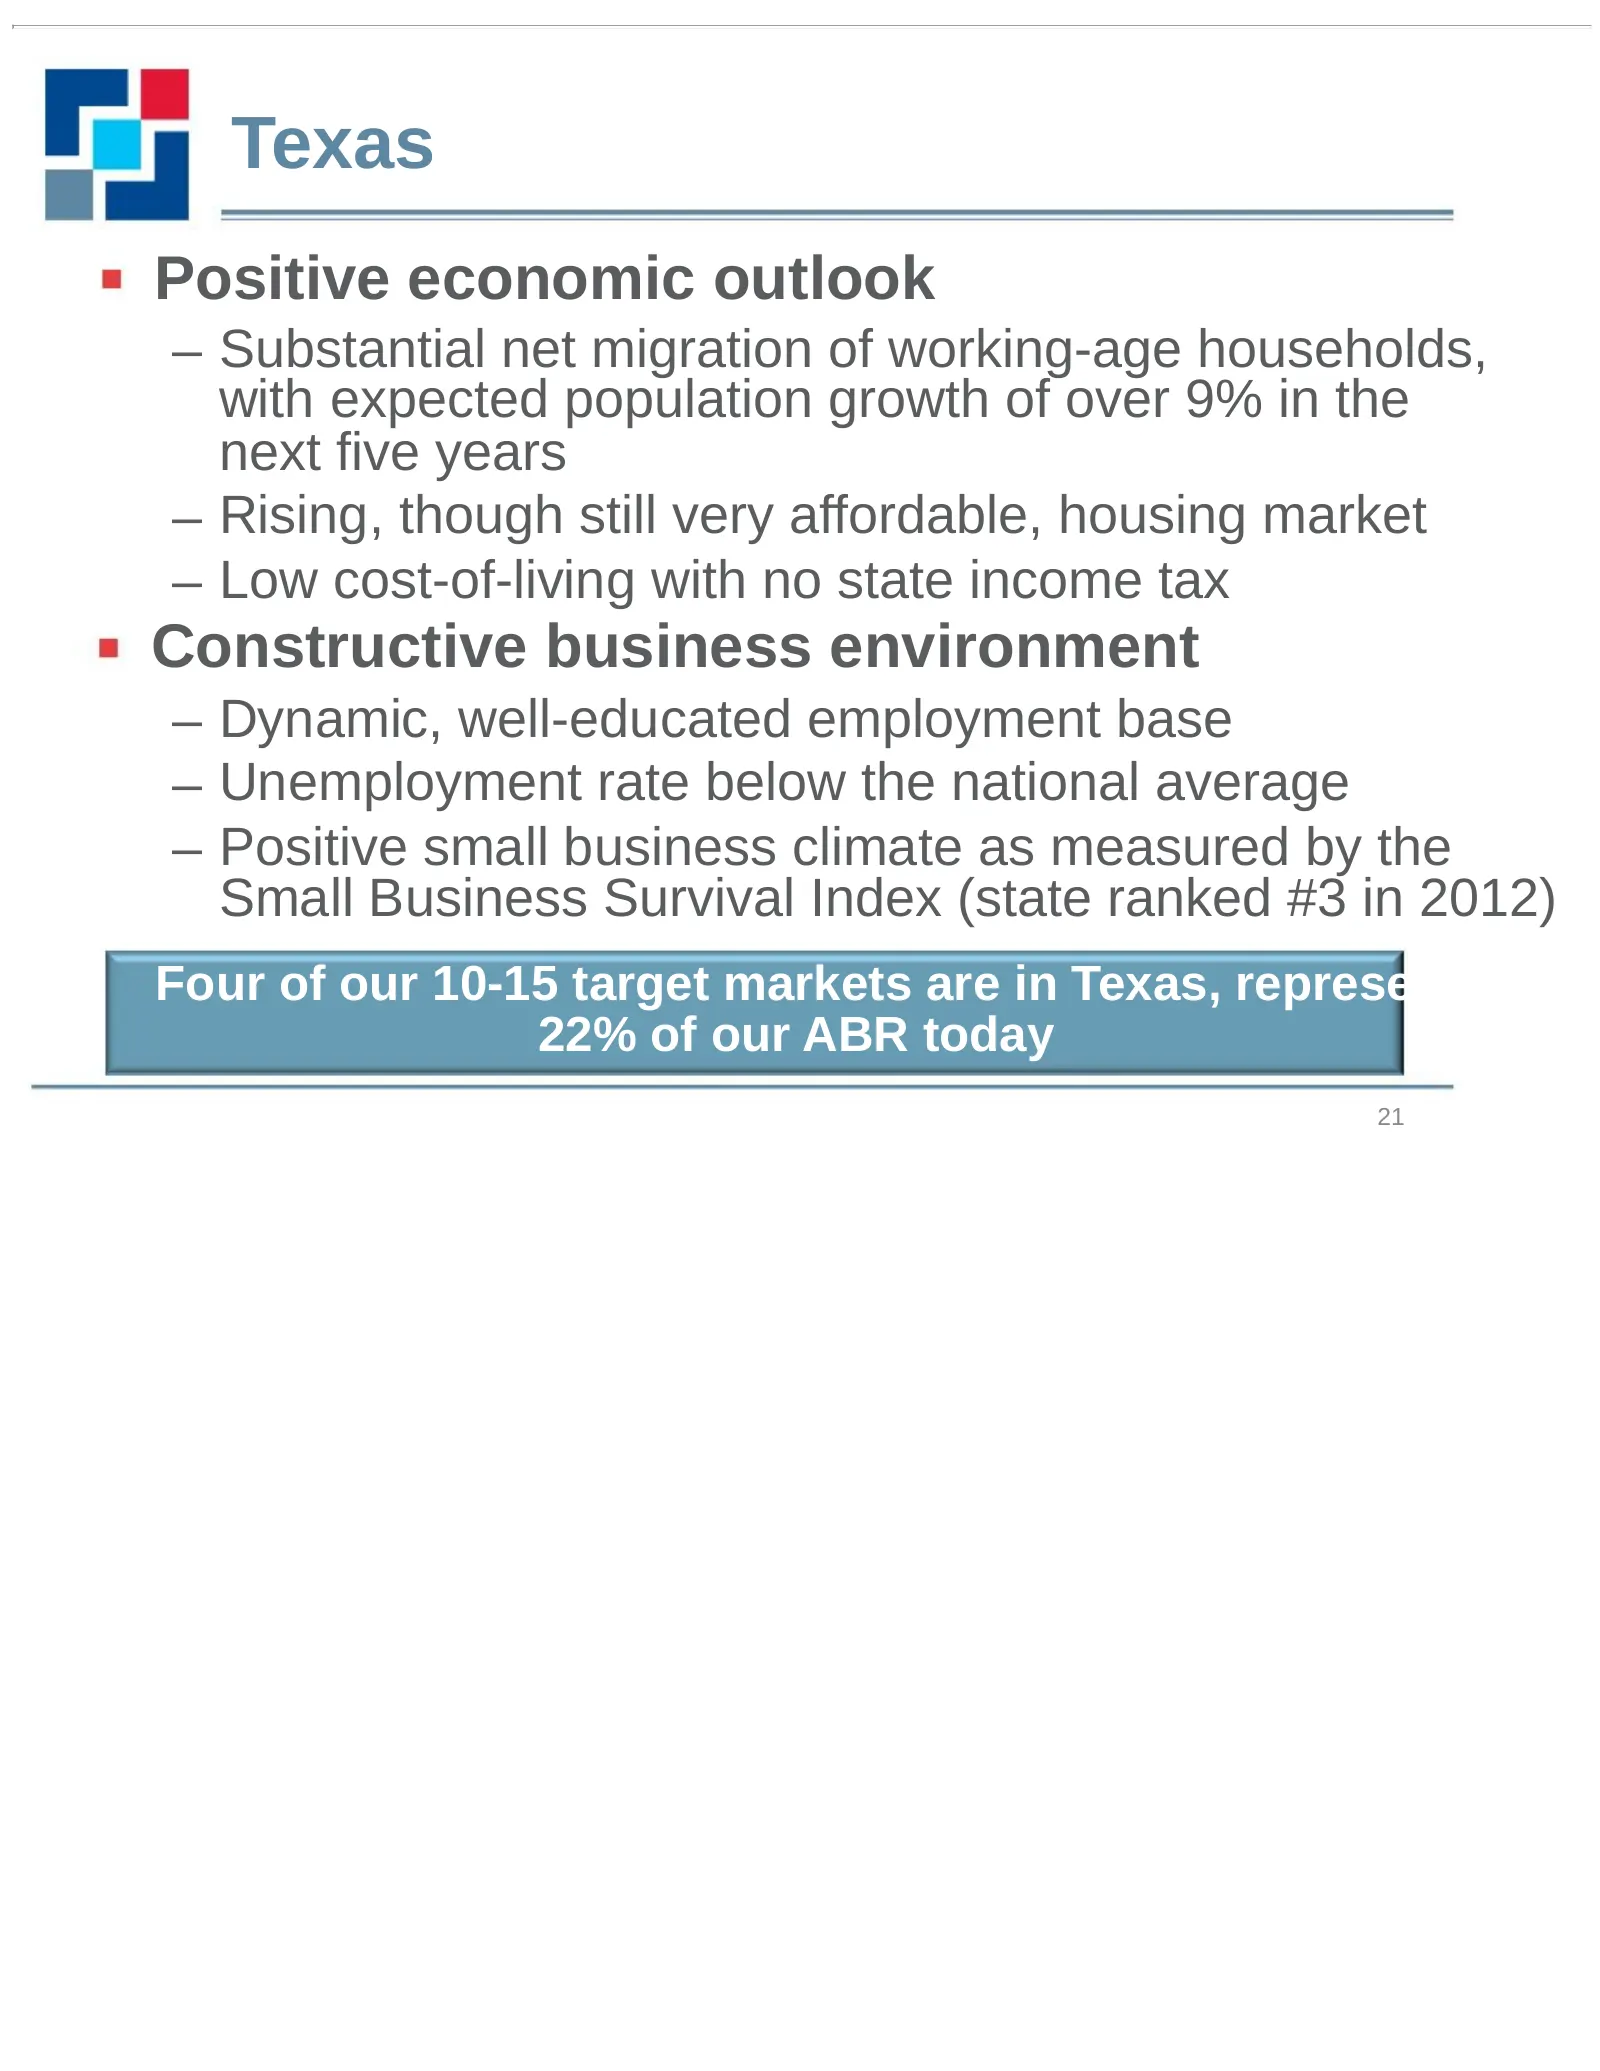
Texas Positive economic outlook – Substantial net migration of working-age households, with expected population growth of over 9% in the next five years – Rising, though still very affordable, housing market – Low cost-of-living with no state income tax Constructive business environment – Dynamic, w
Slide 22: Target Market Approach
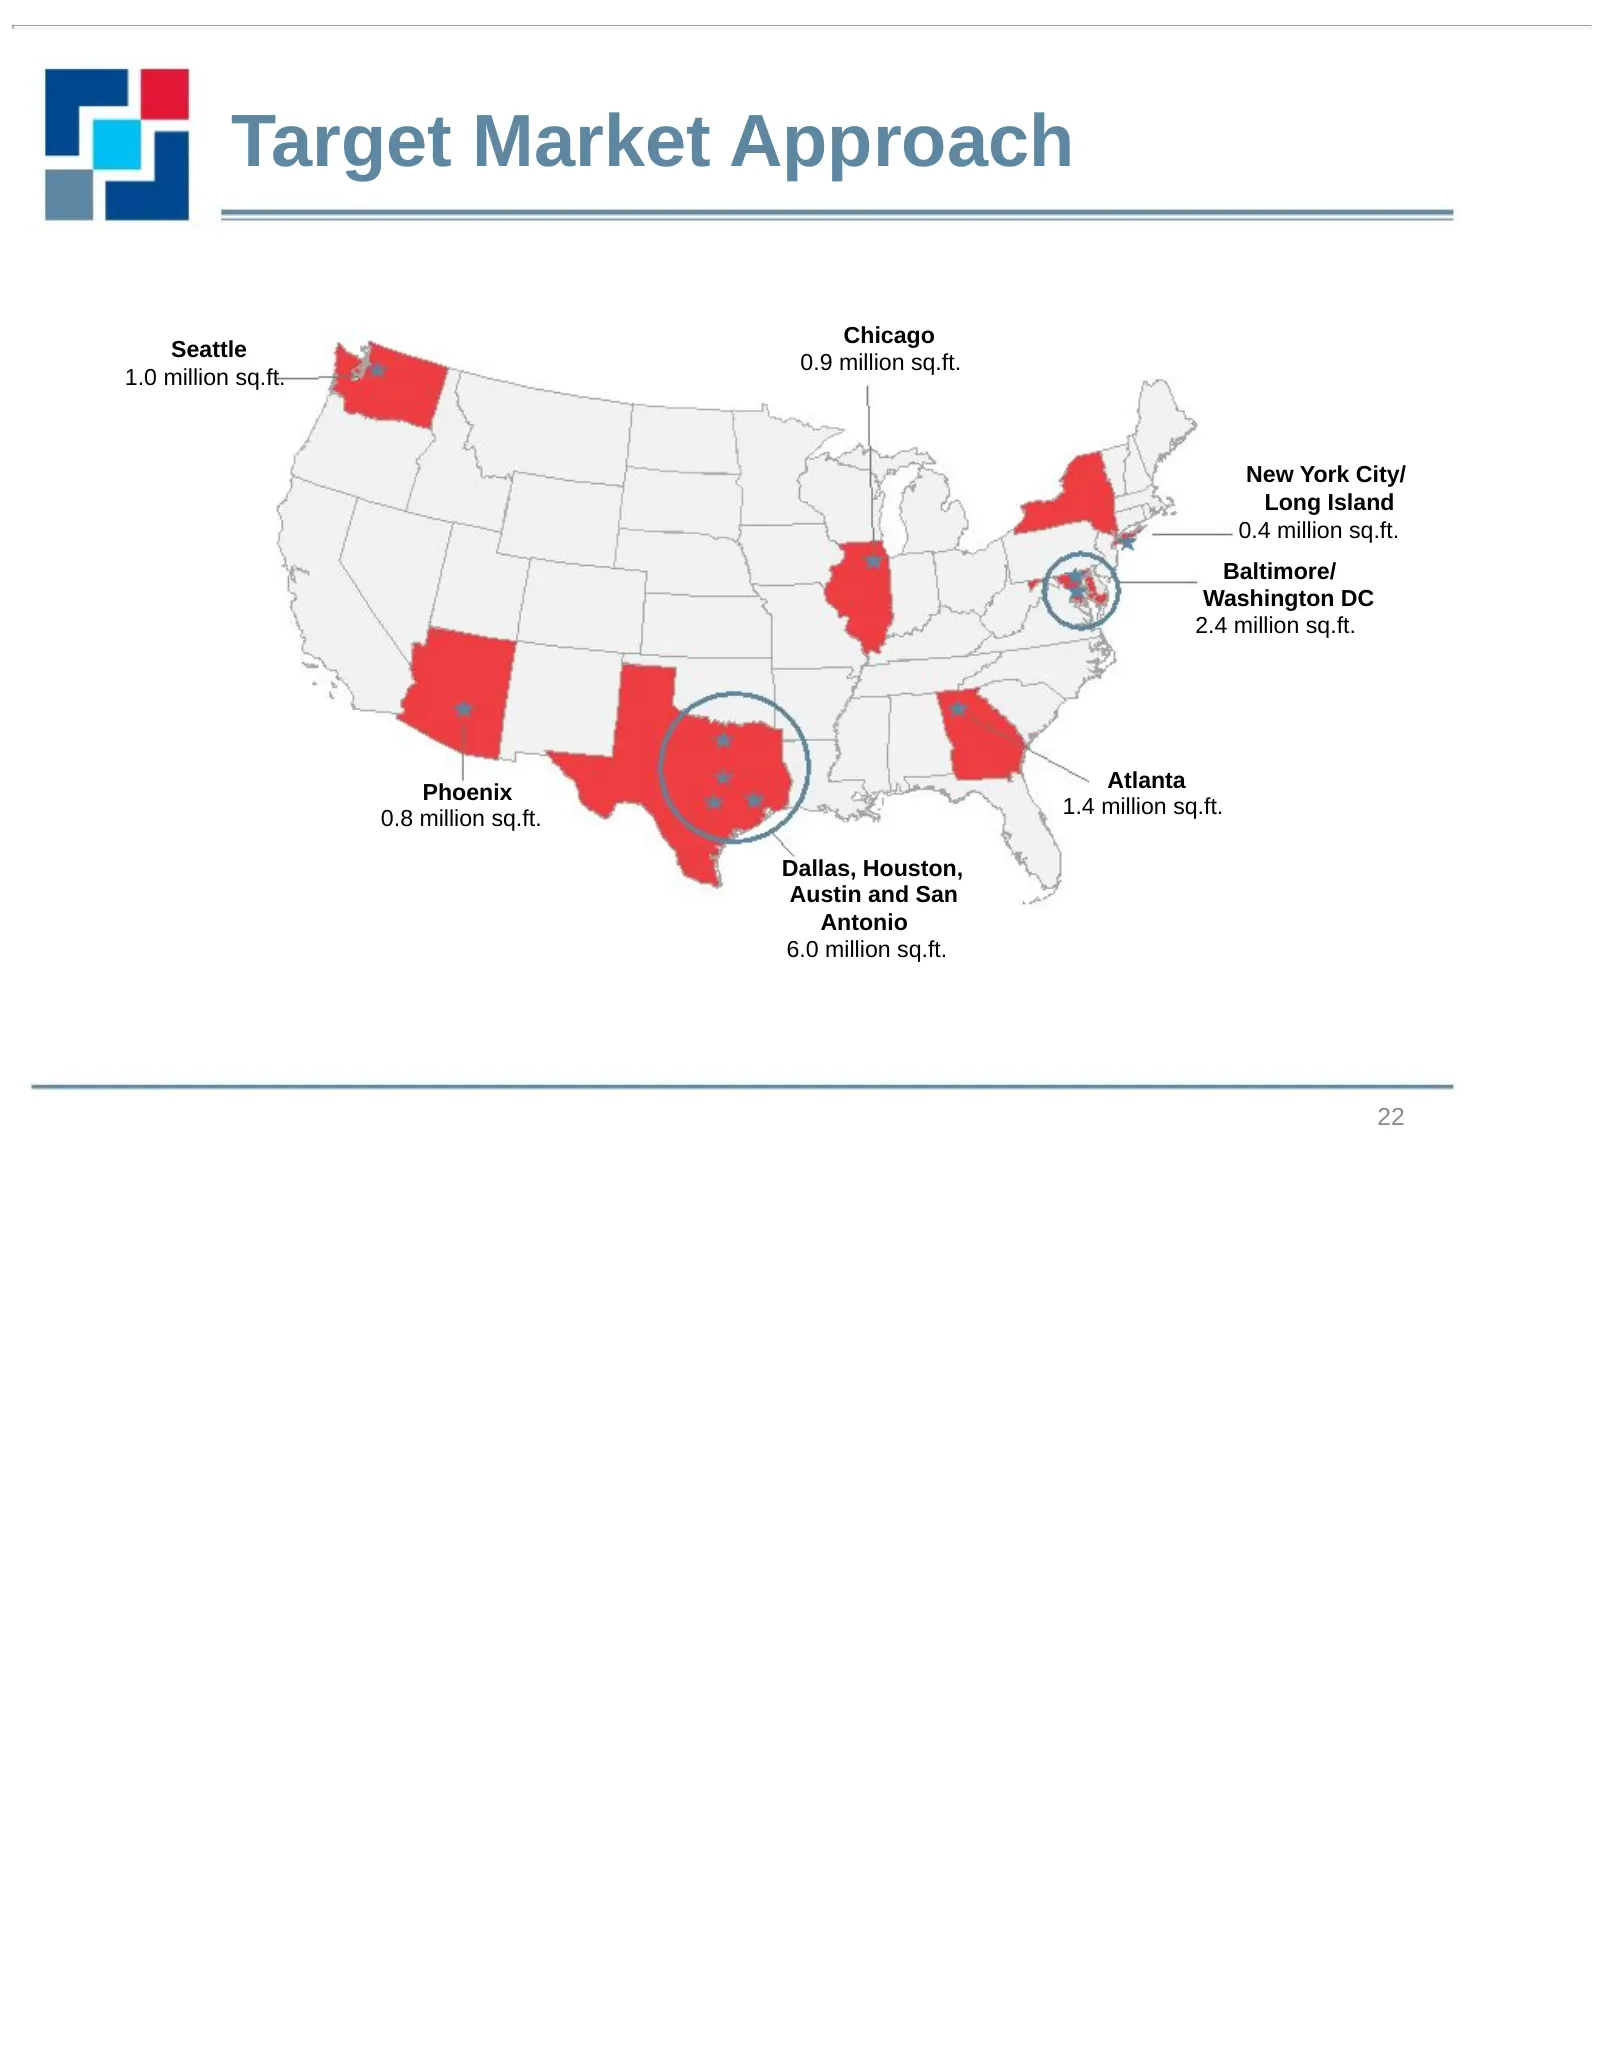
Target Market Approach Chicago Seattle 0.9 million sq.ft. 1.0 million sq.ft. New York City/ Long Island 0.4 million sq.ft. Baltimore/ Washington DC 2.4 million sq.ft. Atlanta Phoenix 1.4 million sq.ft. 0.8 million sq.ft. Dallas, Houston, Austin and San Antonio 6.0 million sq.ft. 22
Slide 23: Improved Demographic Profile
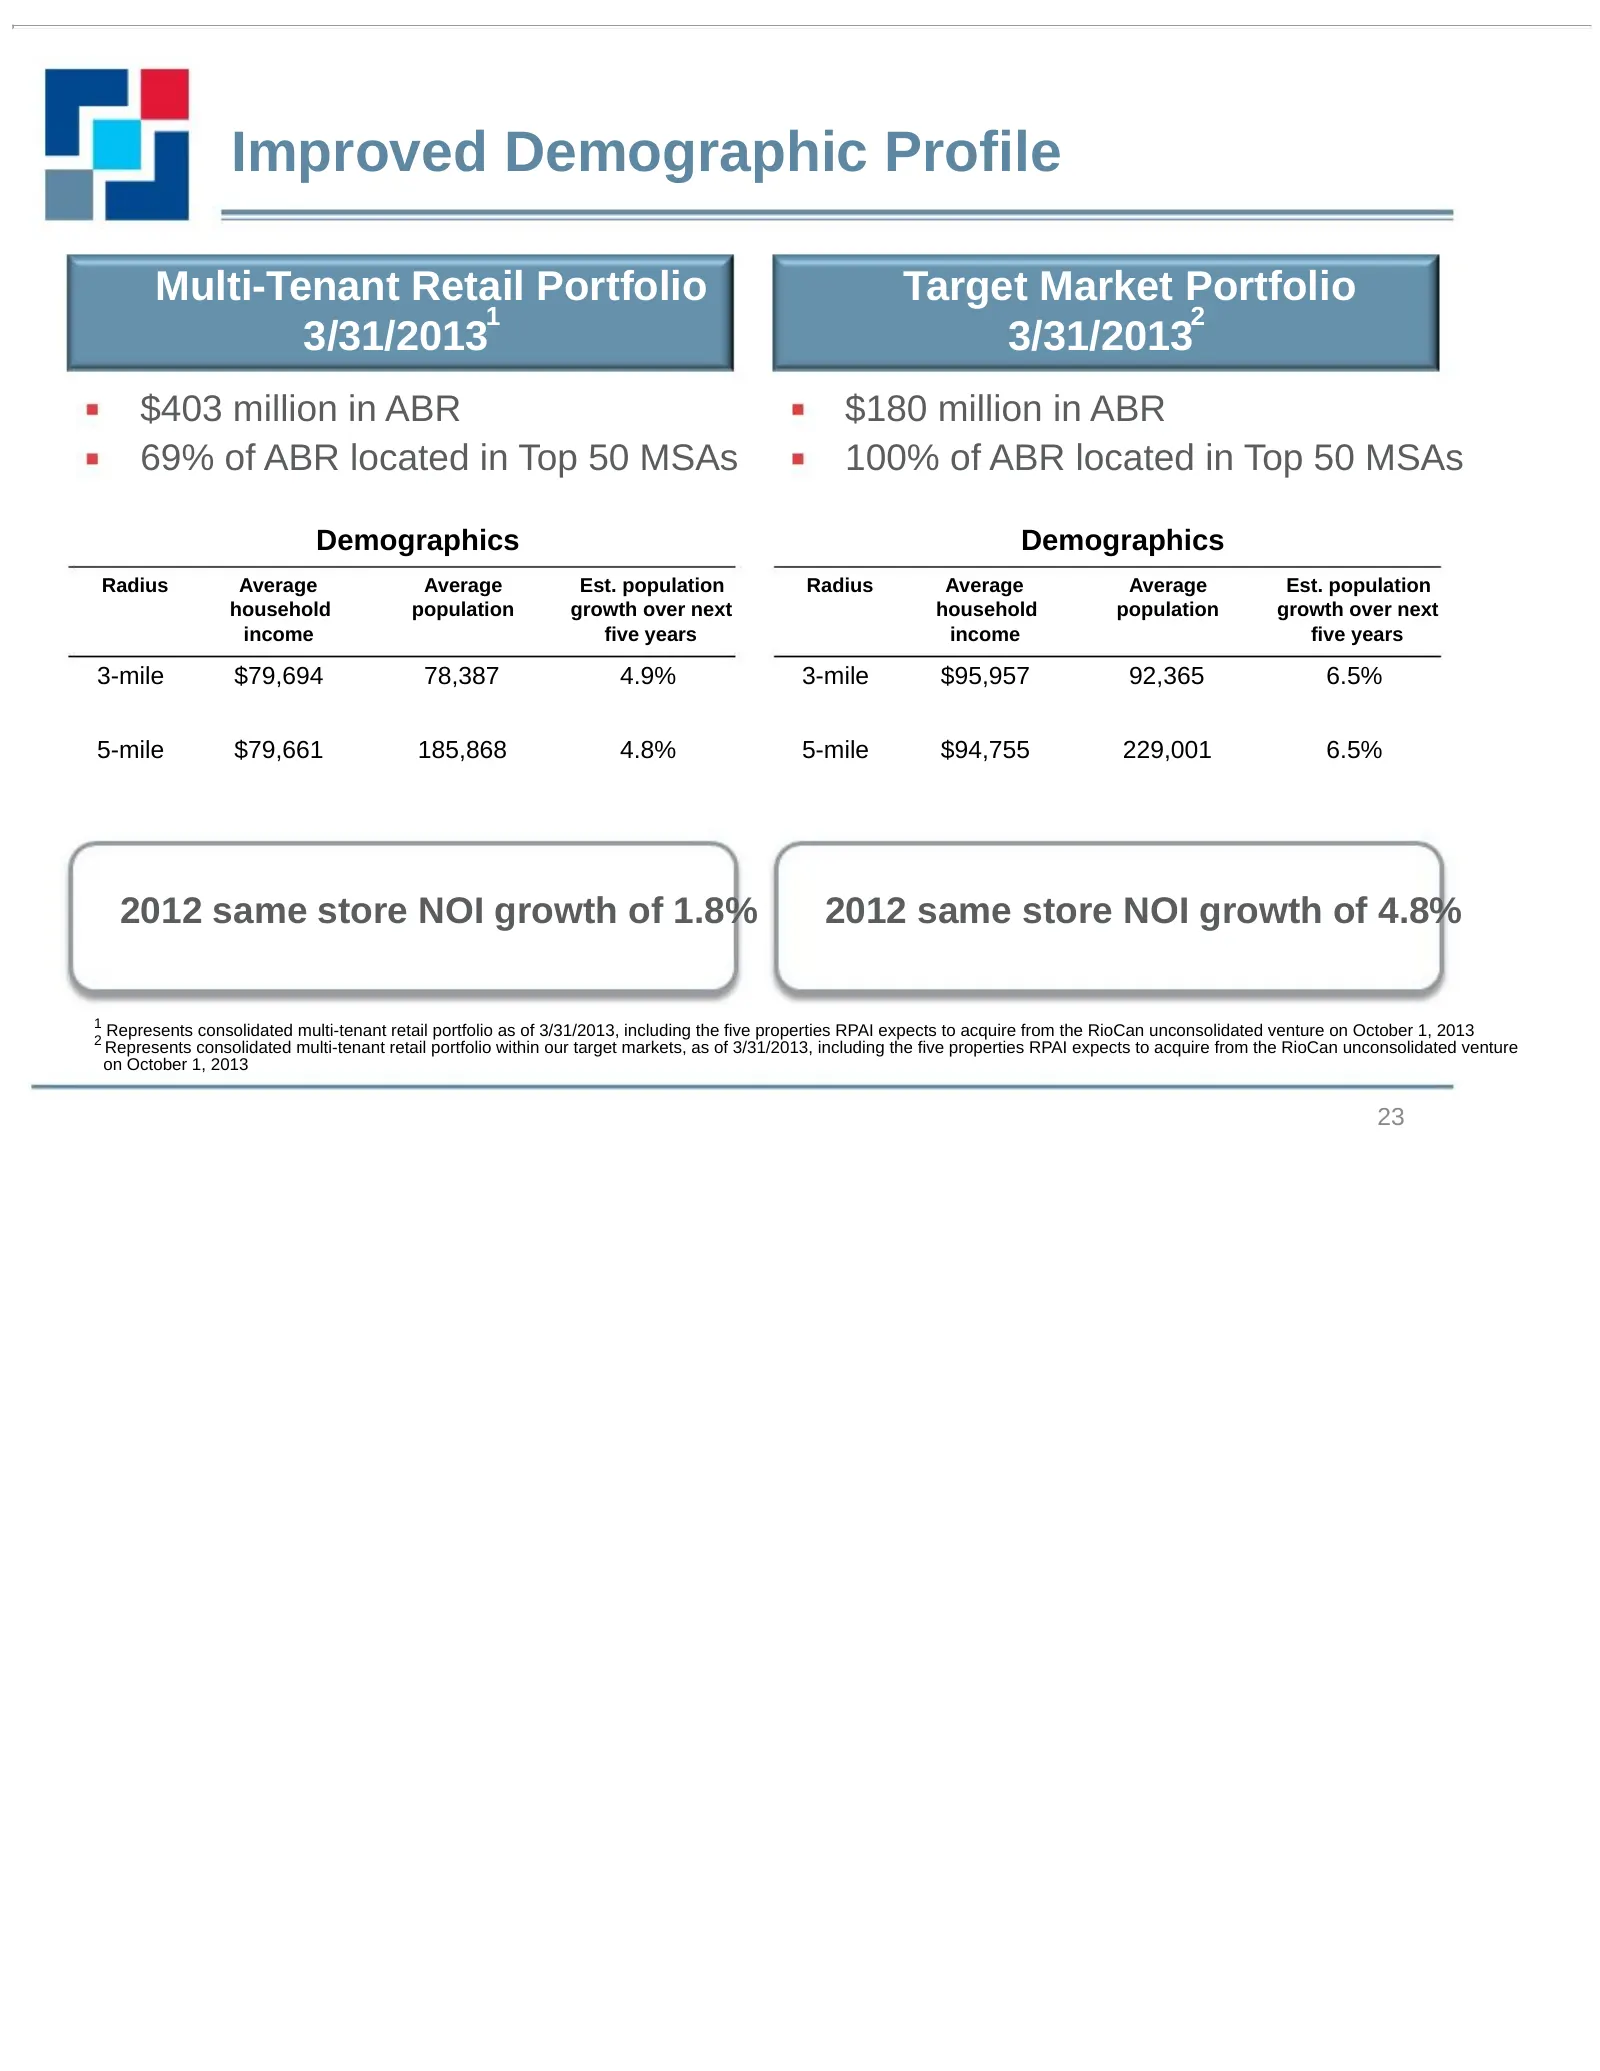
Improved Demographic Profile Multi-Tenant Retail Portfolio Target Market Portfolio 1 2 3/31/2013 3/31/2013 $403 million in ABR $180 million in ABR 69% of ABR located in Top 50 MSAs 100% of ABR located in Top 50 MSAs Demographics Demographics Radius Average Average Est. population Radius Average Aver
Slide 24: Long-Term Disposition Profile
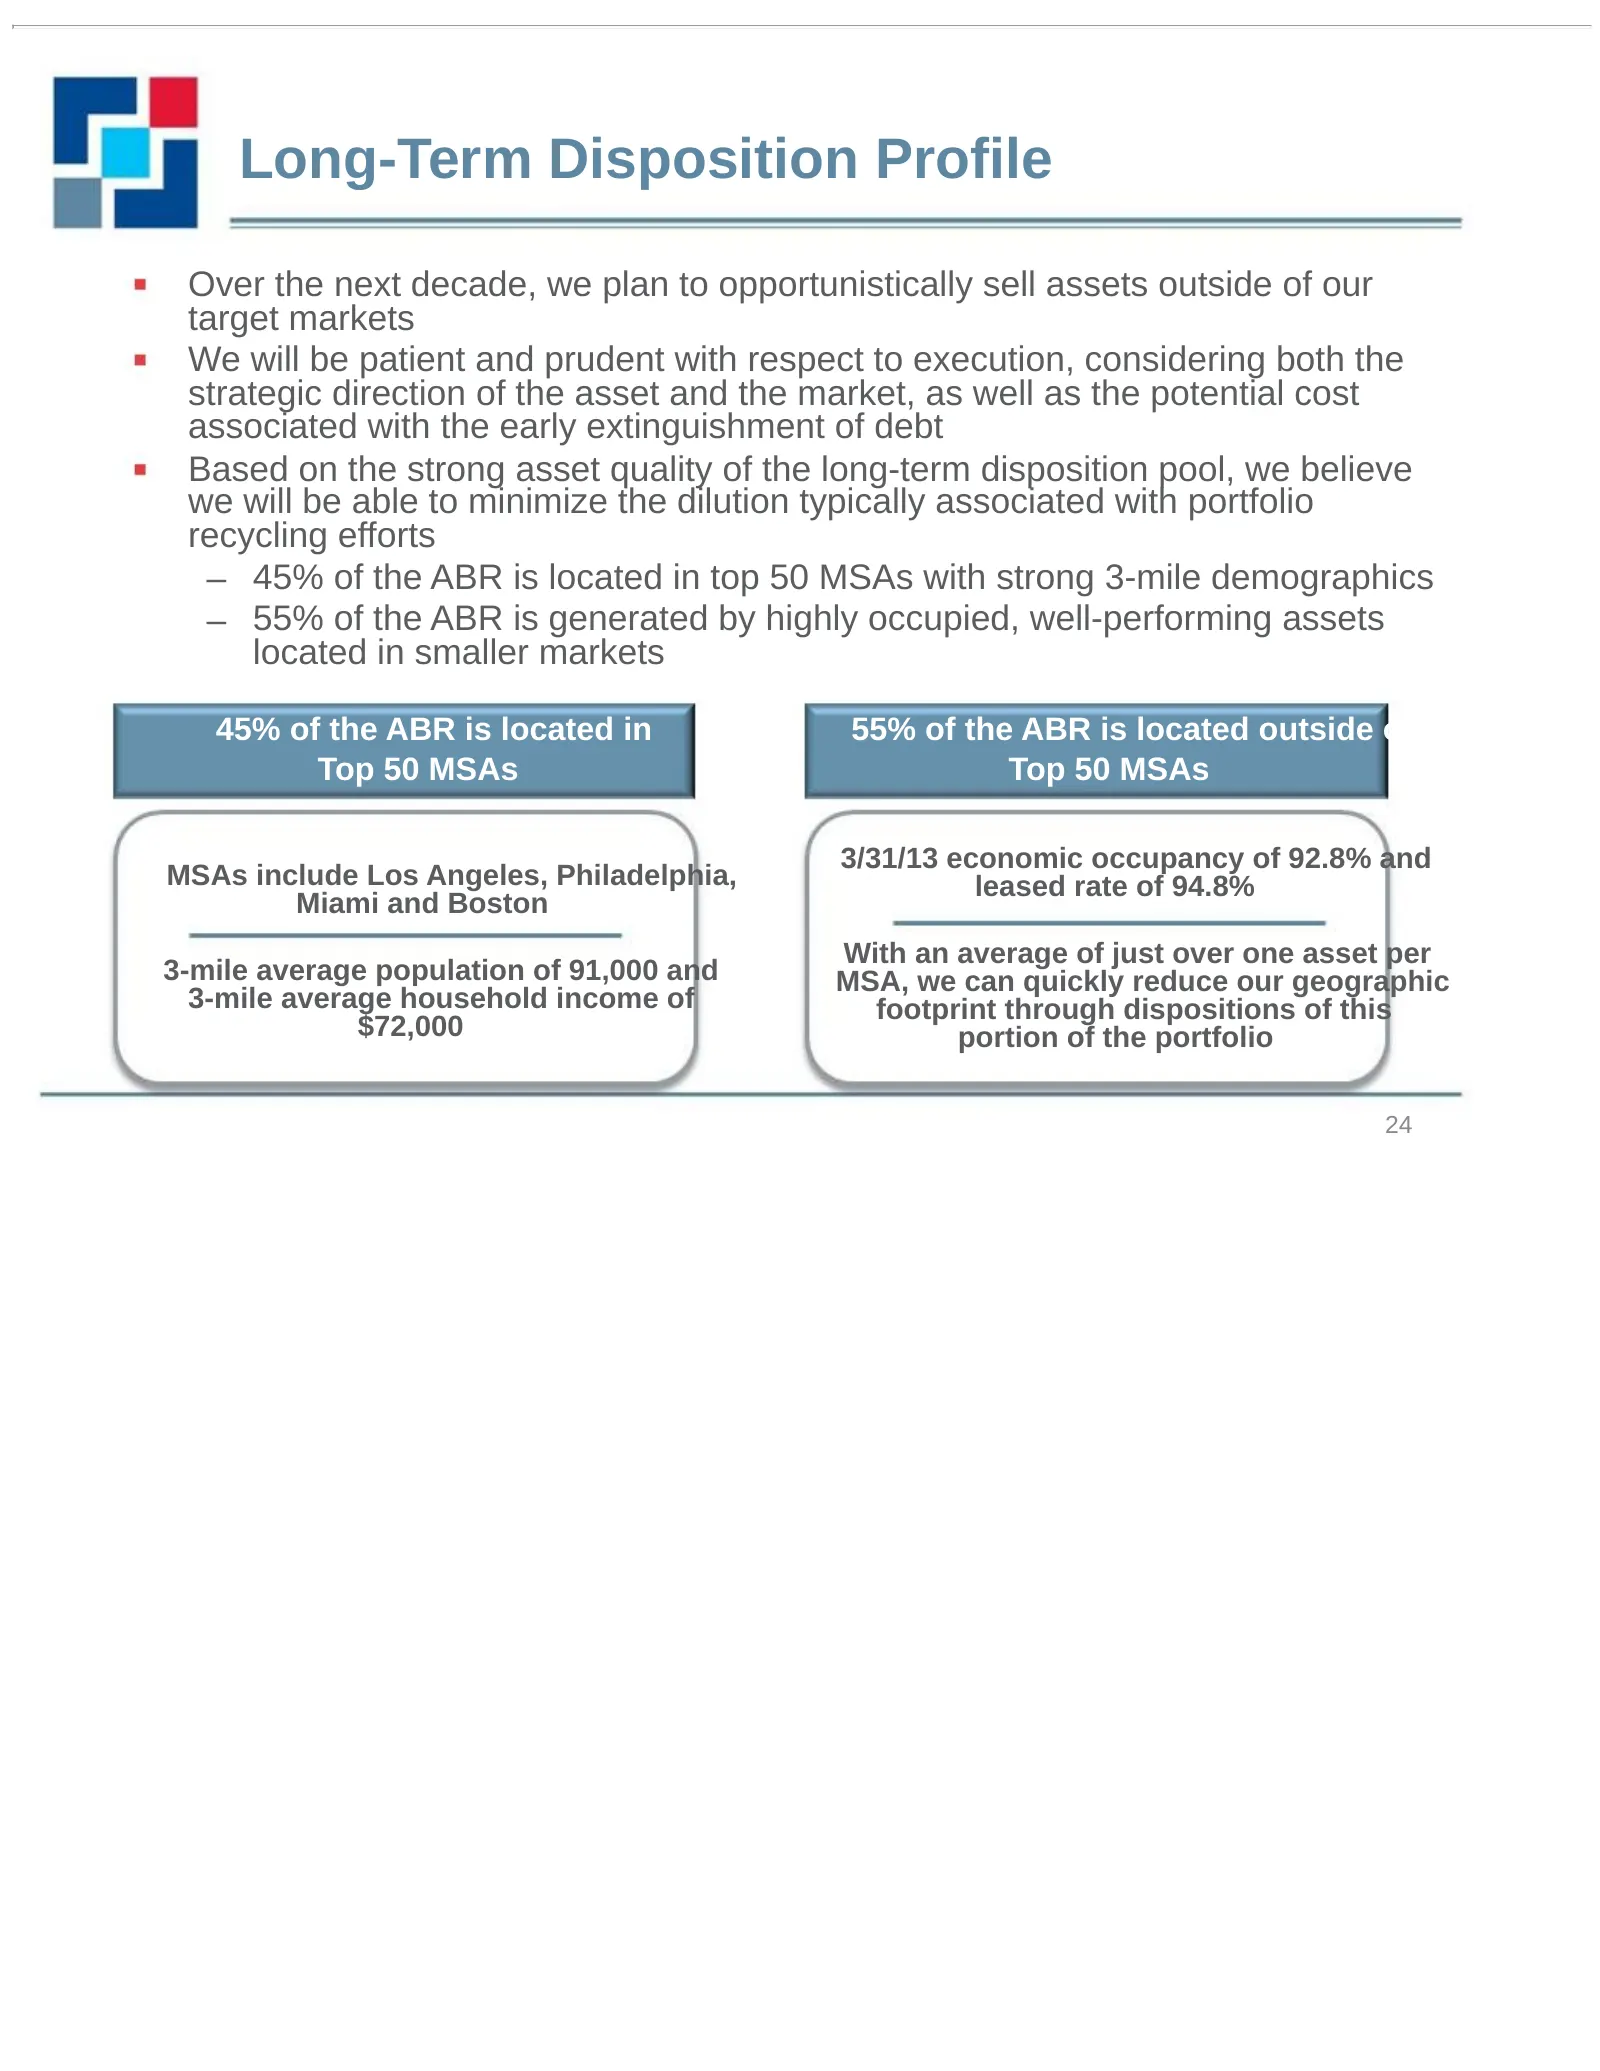
Long-Term Disposition Profile Over the next decade, we plan to opportunistically sell assets outside of our target markets We will be patient and prudent with respect to execution, considering both the strategic direction of the asset and the market, as well as the potential cost associated with the
Slide 25: Dallas Portfolio
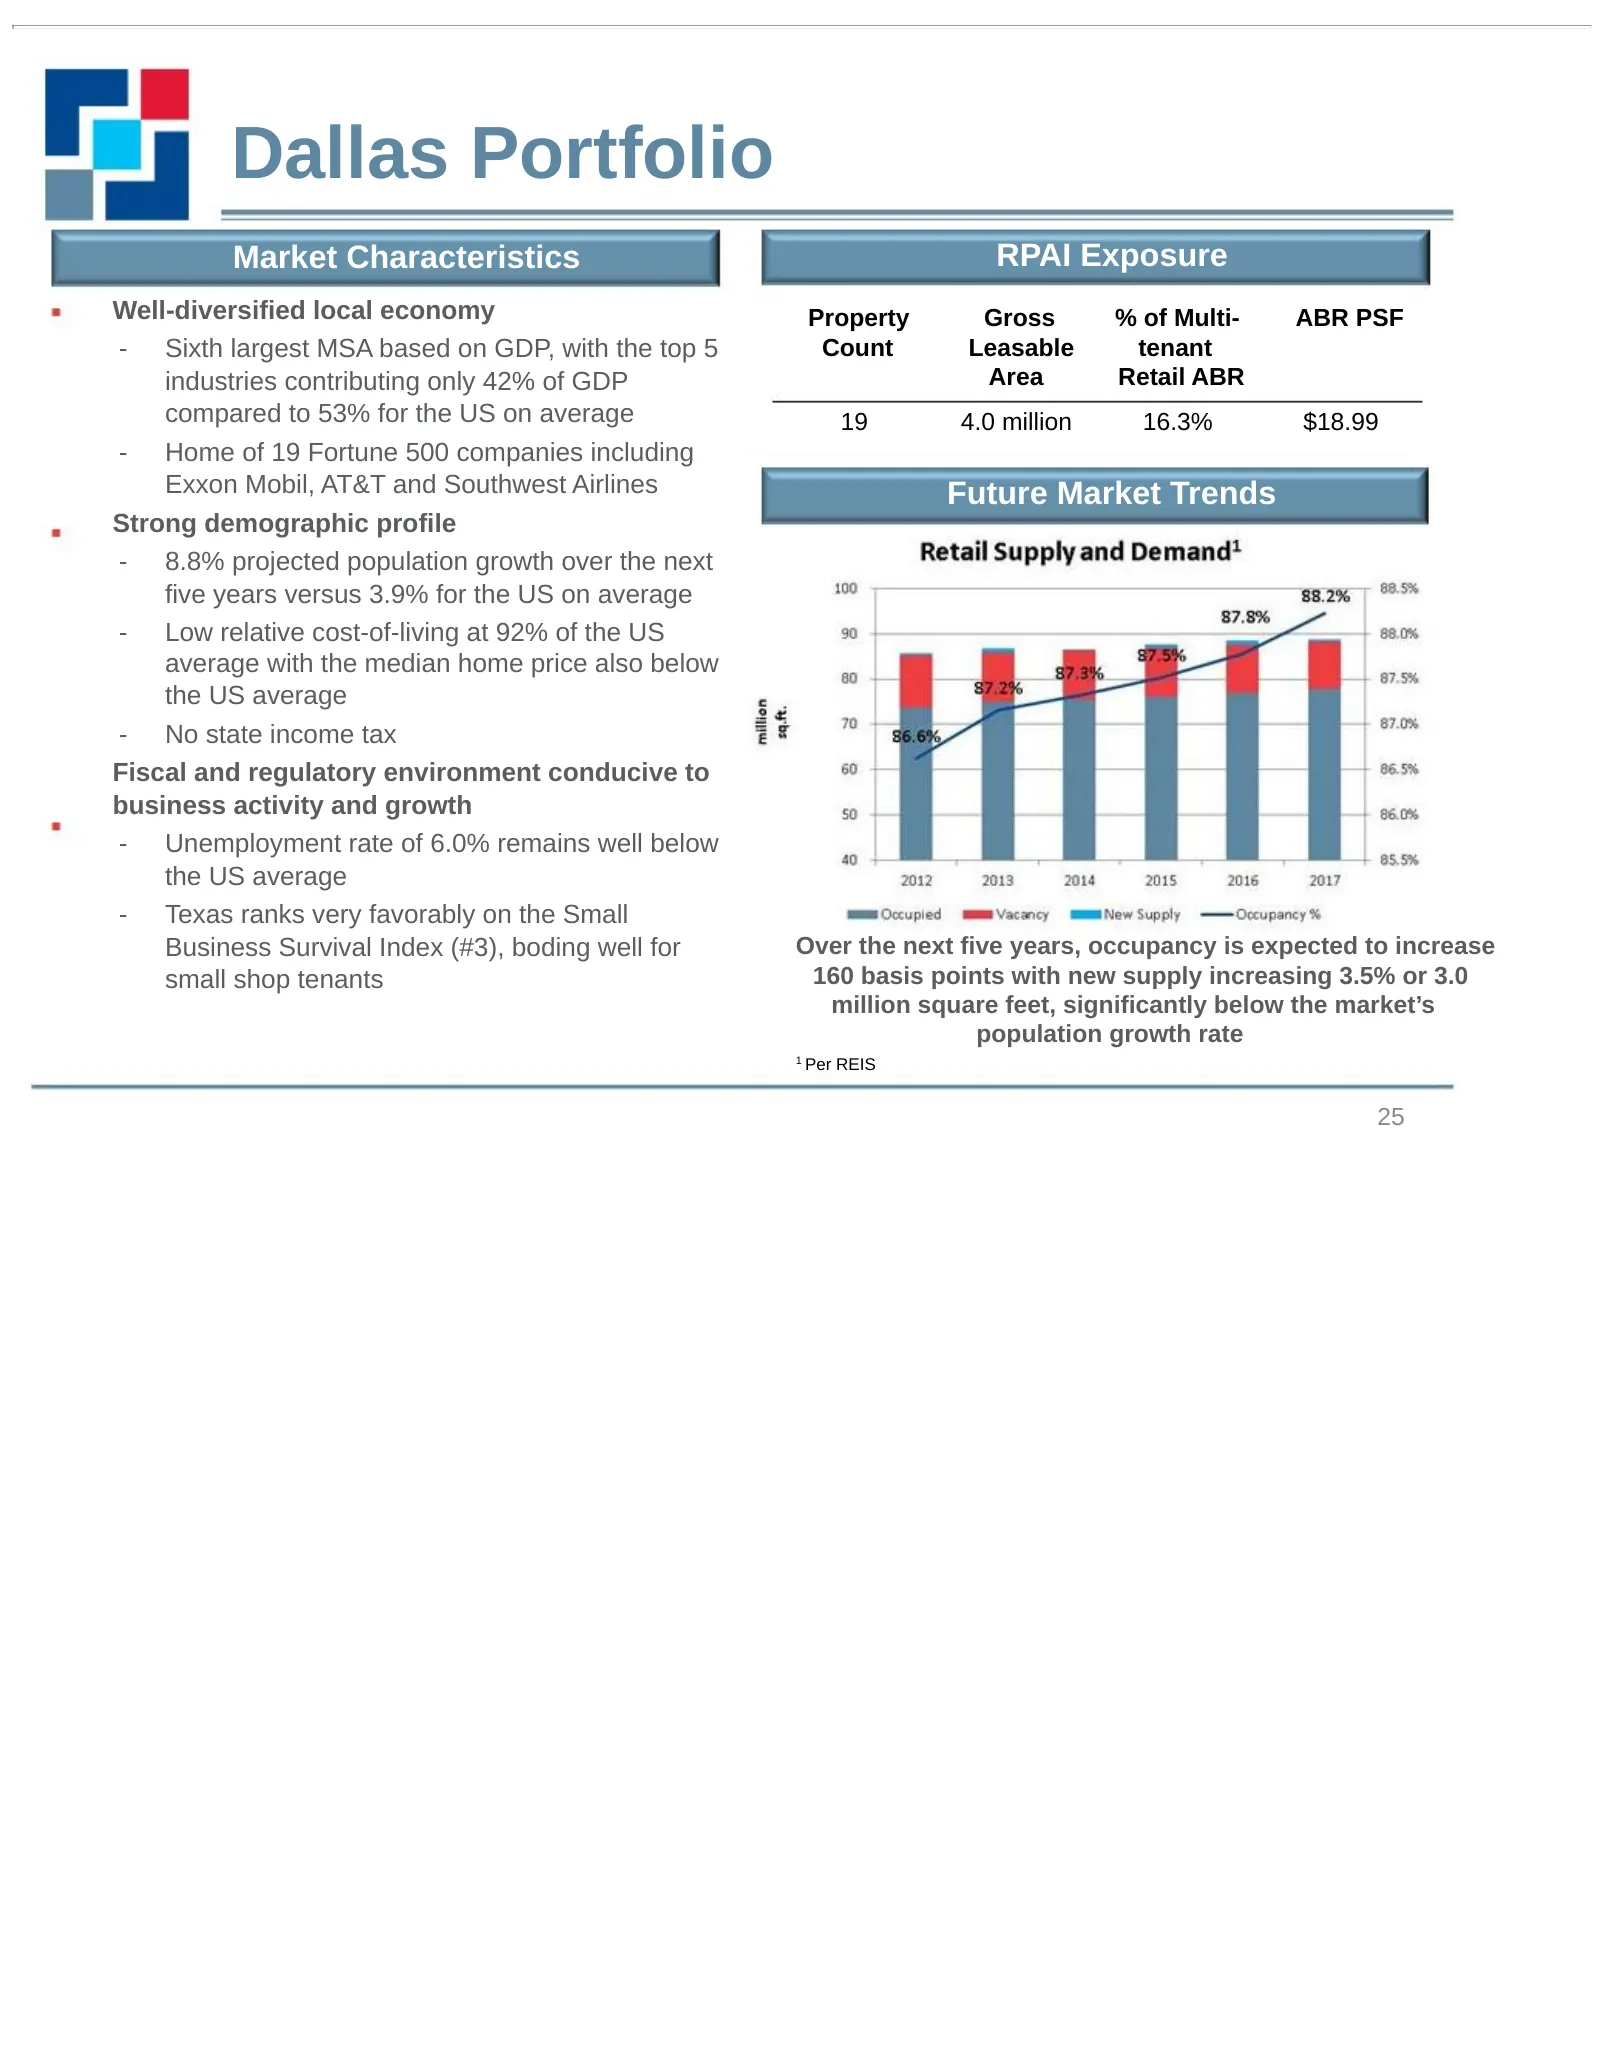
Dallas Portfolio Market Characteristics RPAI Exposure Well-diversified local economy Property Gross % of Multi- ABR PSF - Sixth largest MSA based on GDP, with the top 5 Count Leasable tenant industries contributing only 42% of GDP Area Retail ABR compared to 53% for the US on average 19 4.0 million
Slide 26: Southlake Town Square
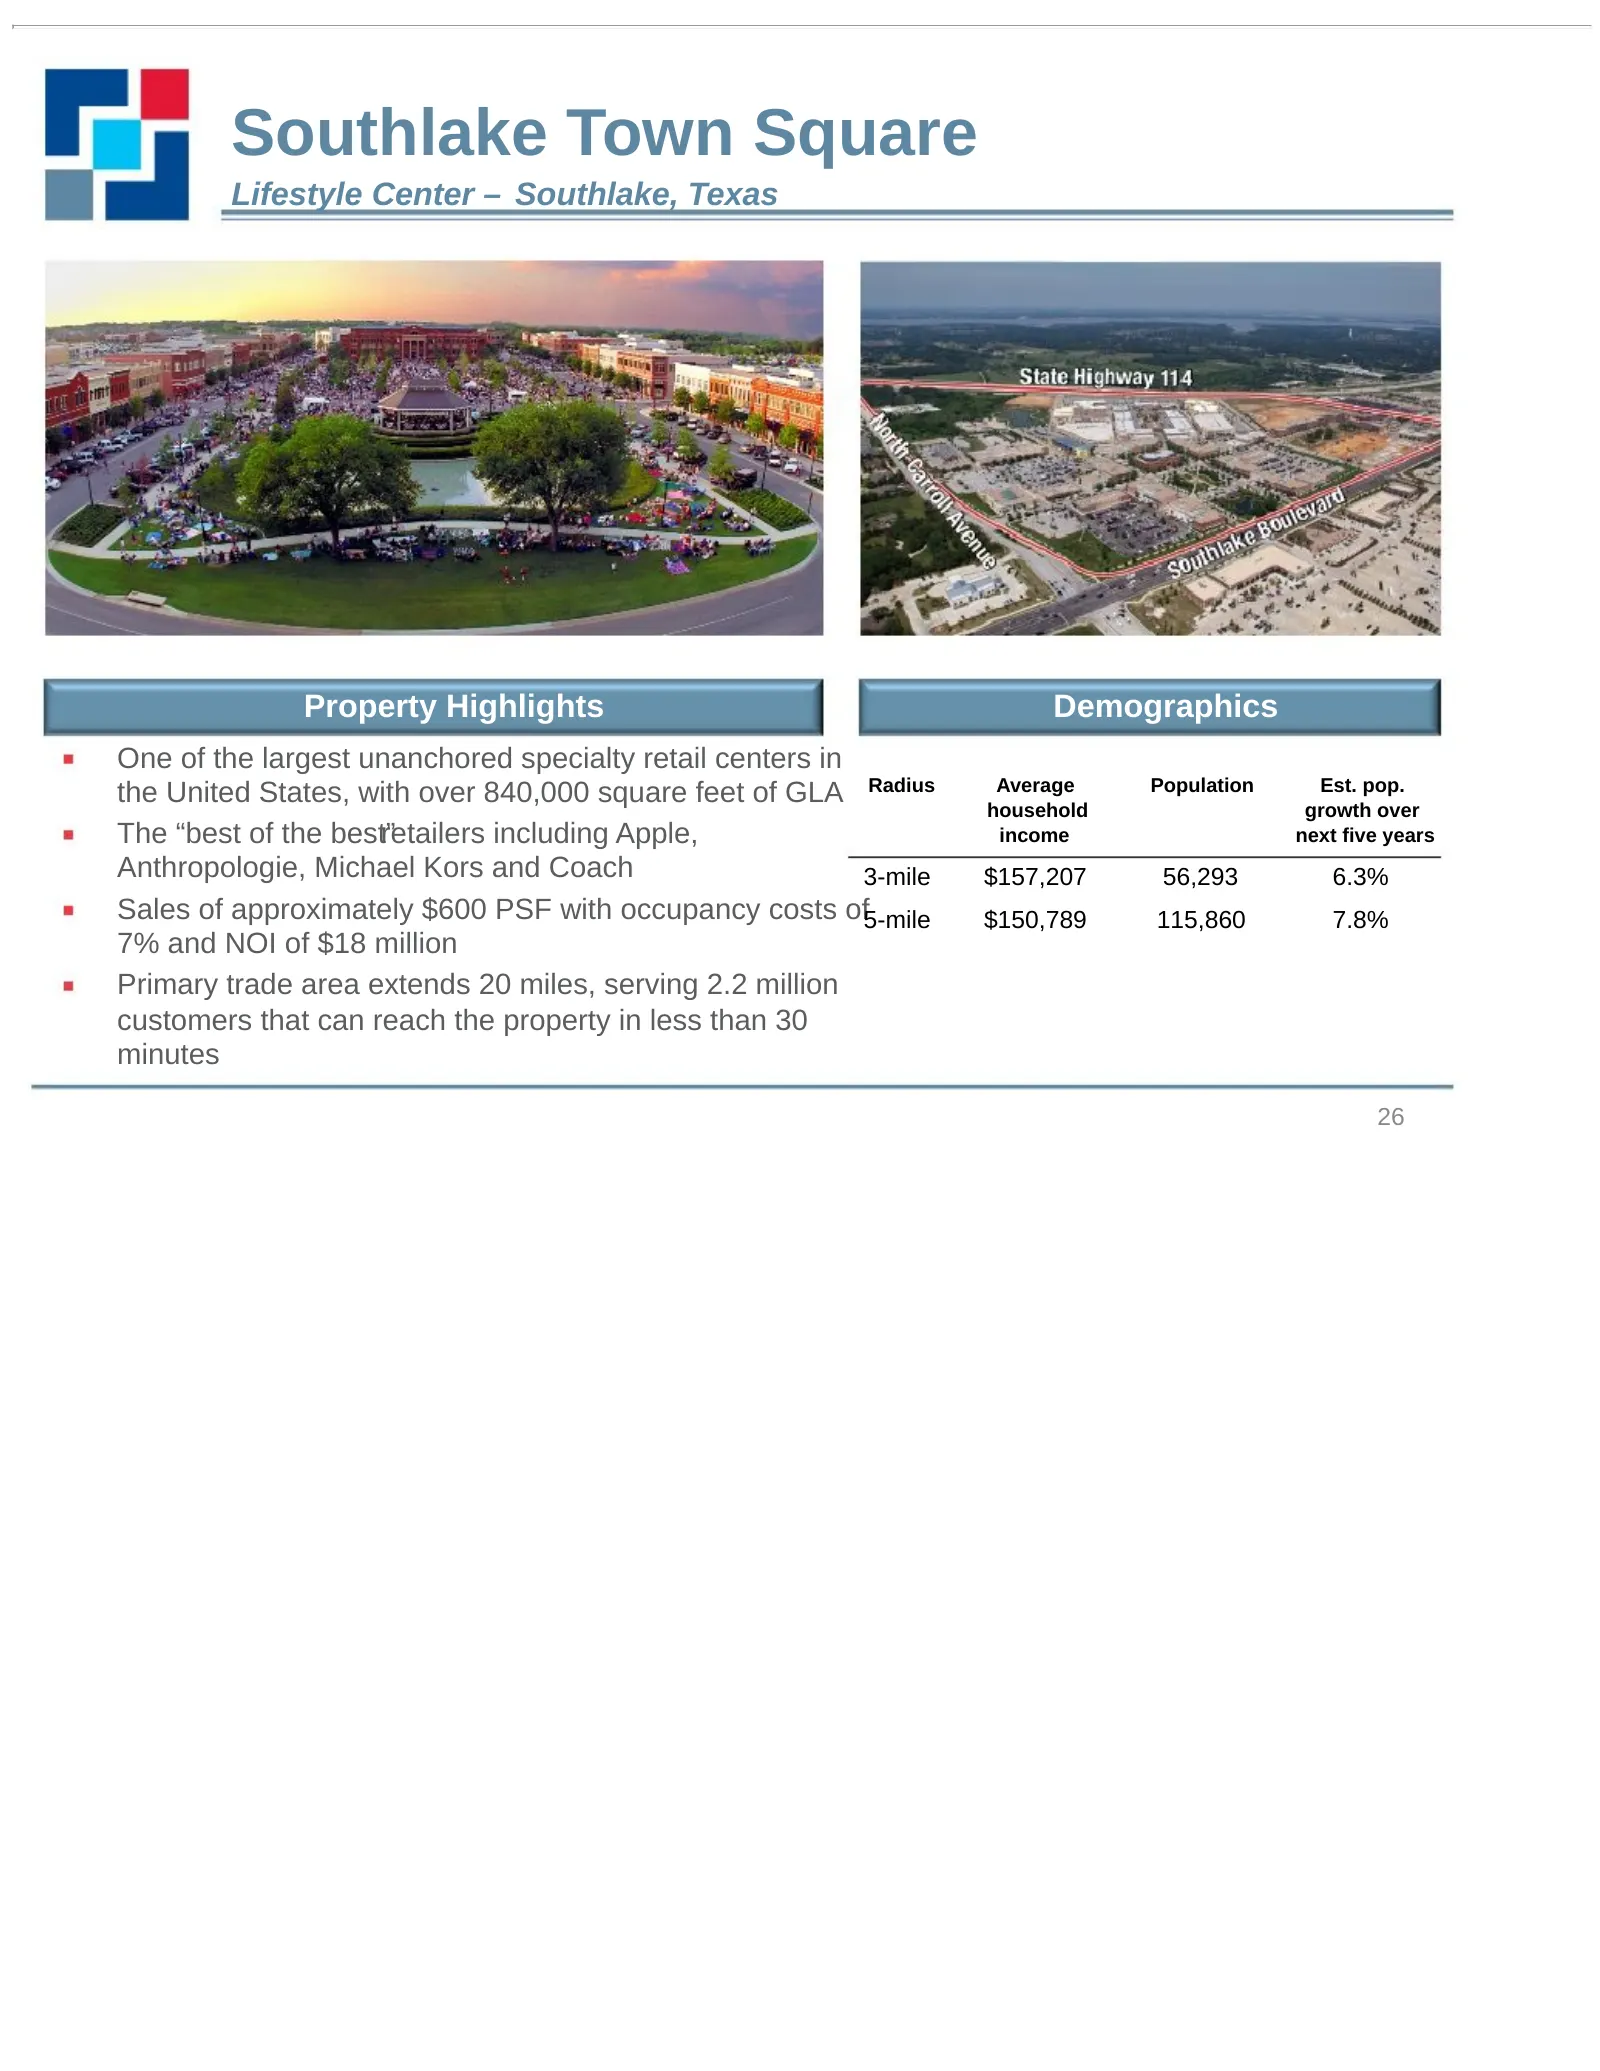
Southlake Town Square Lifestyle Center – Southlake, Texas Property Highlights Demographics One of the largest unanchored specialty retail centers in the United States, with over 840,000 square feet of GLA Radius Average Population Est. pop. household growth over The “best of the best” retailers incl
Slide 27: Southlake Town Square Site Plan
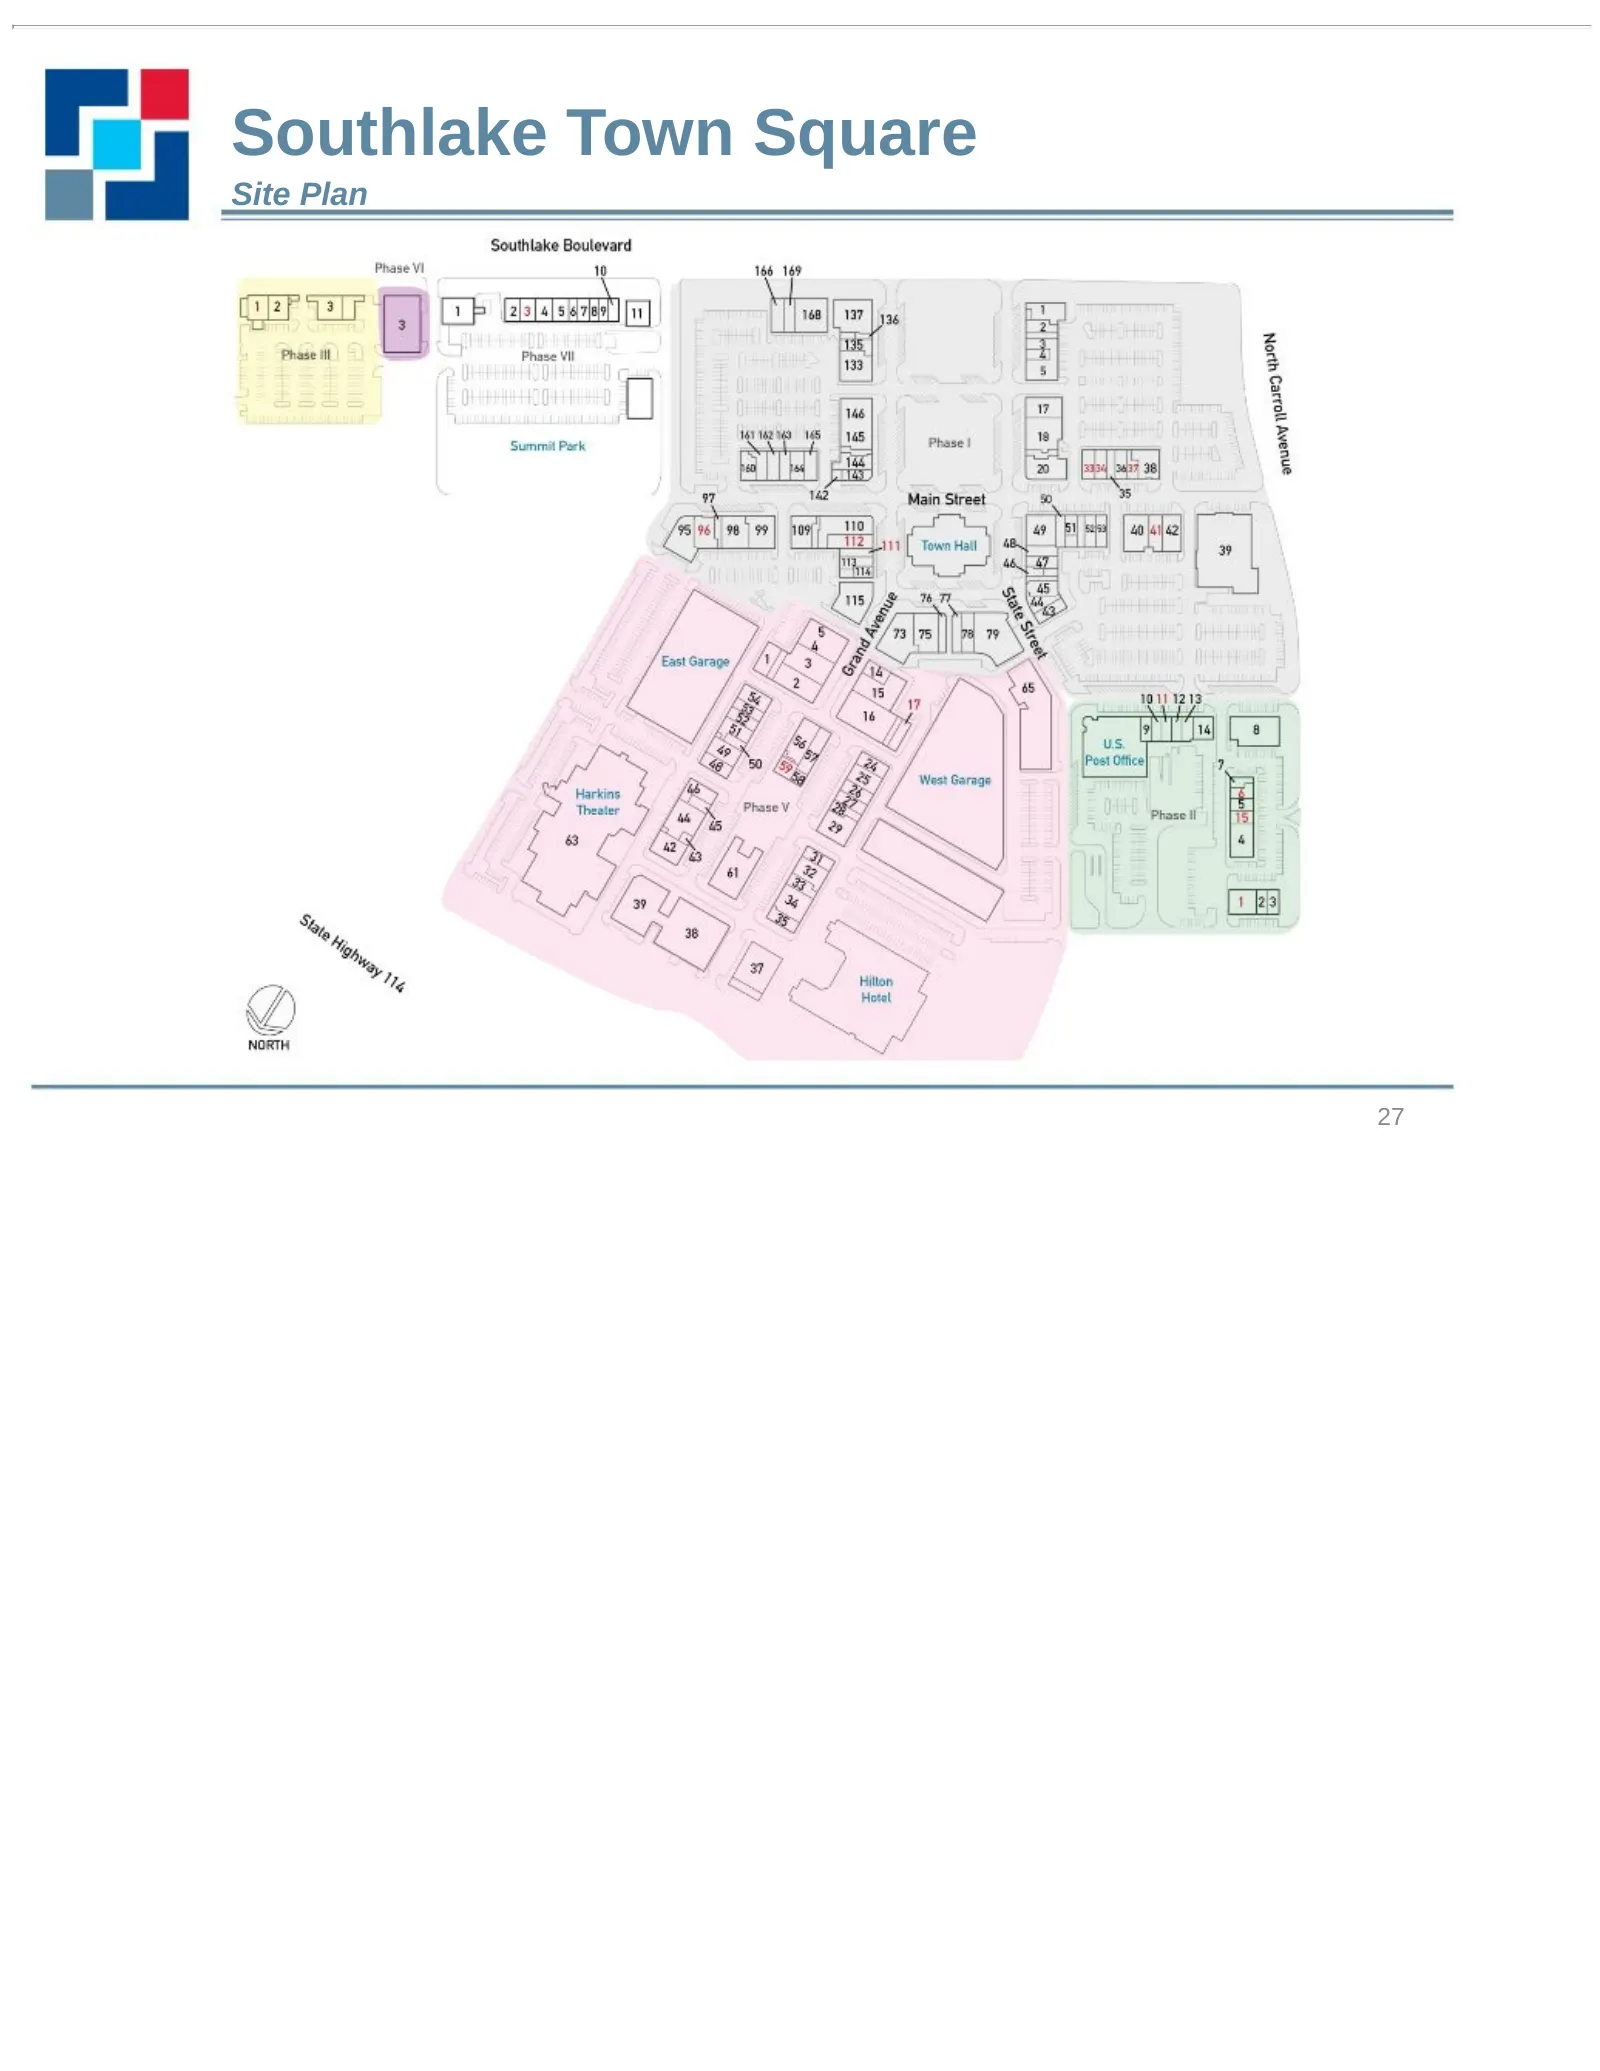
Southlake Town Square Site Plan 27
Slide 28: Houston Portfolio
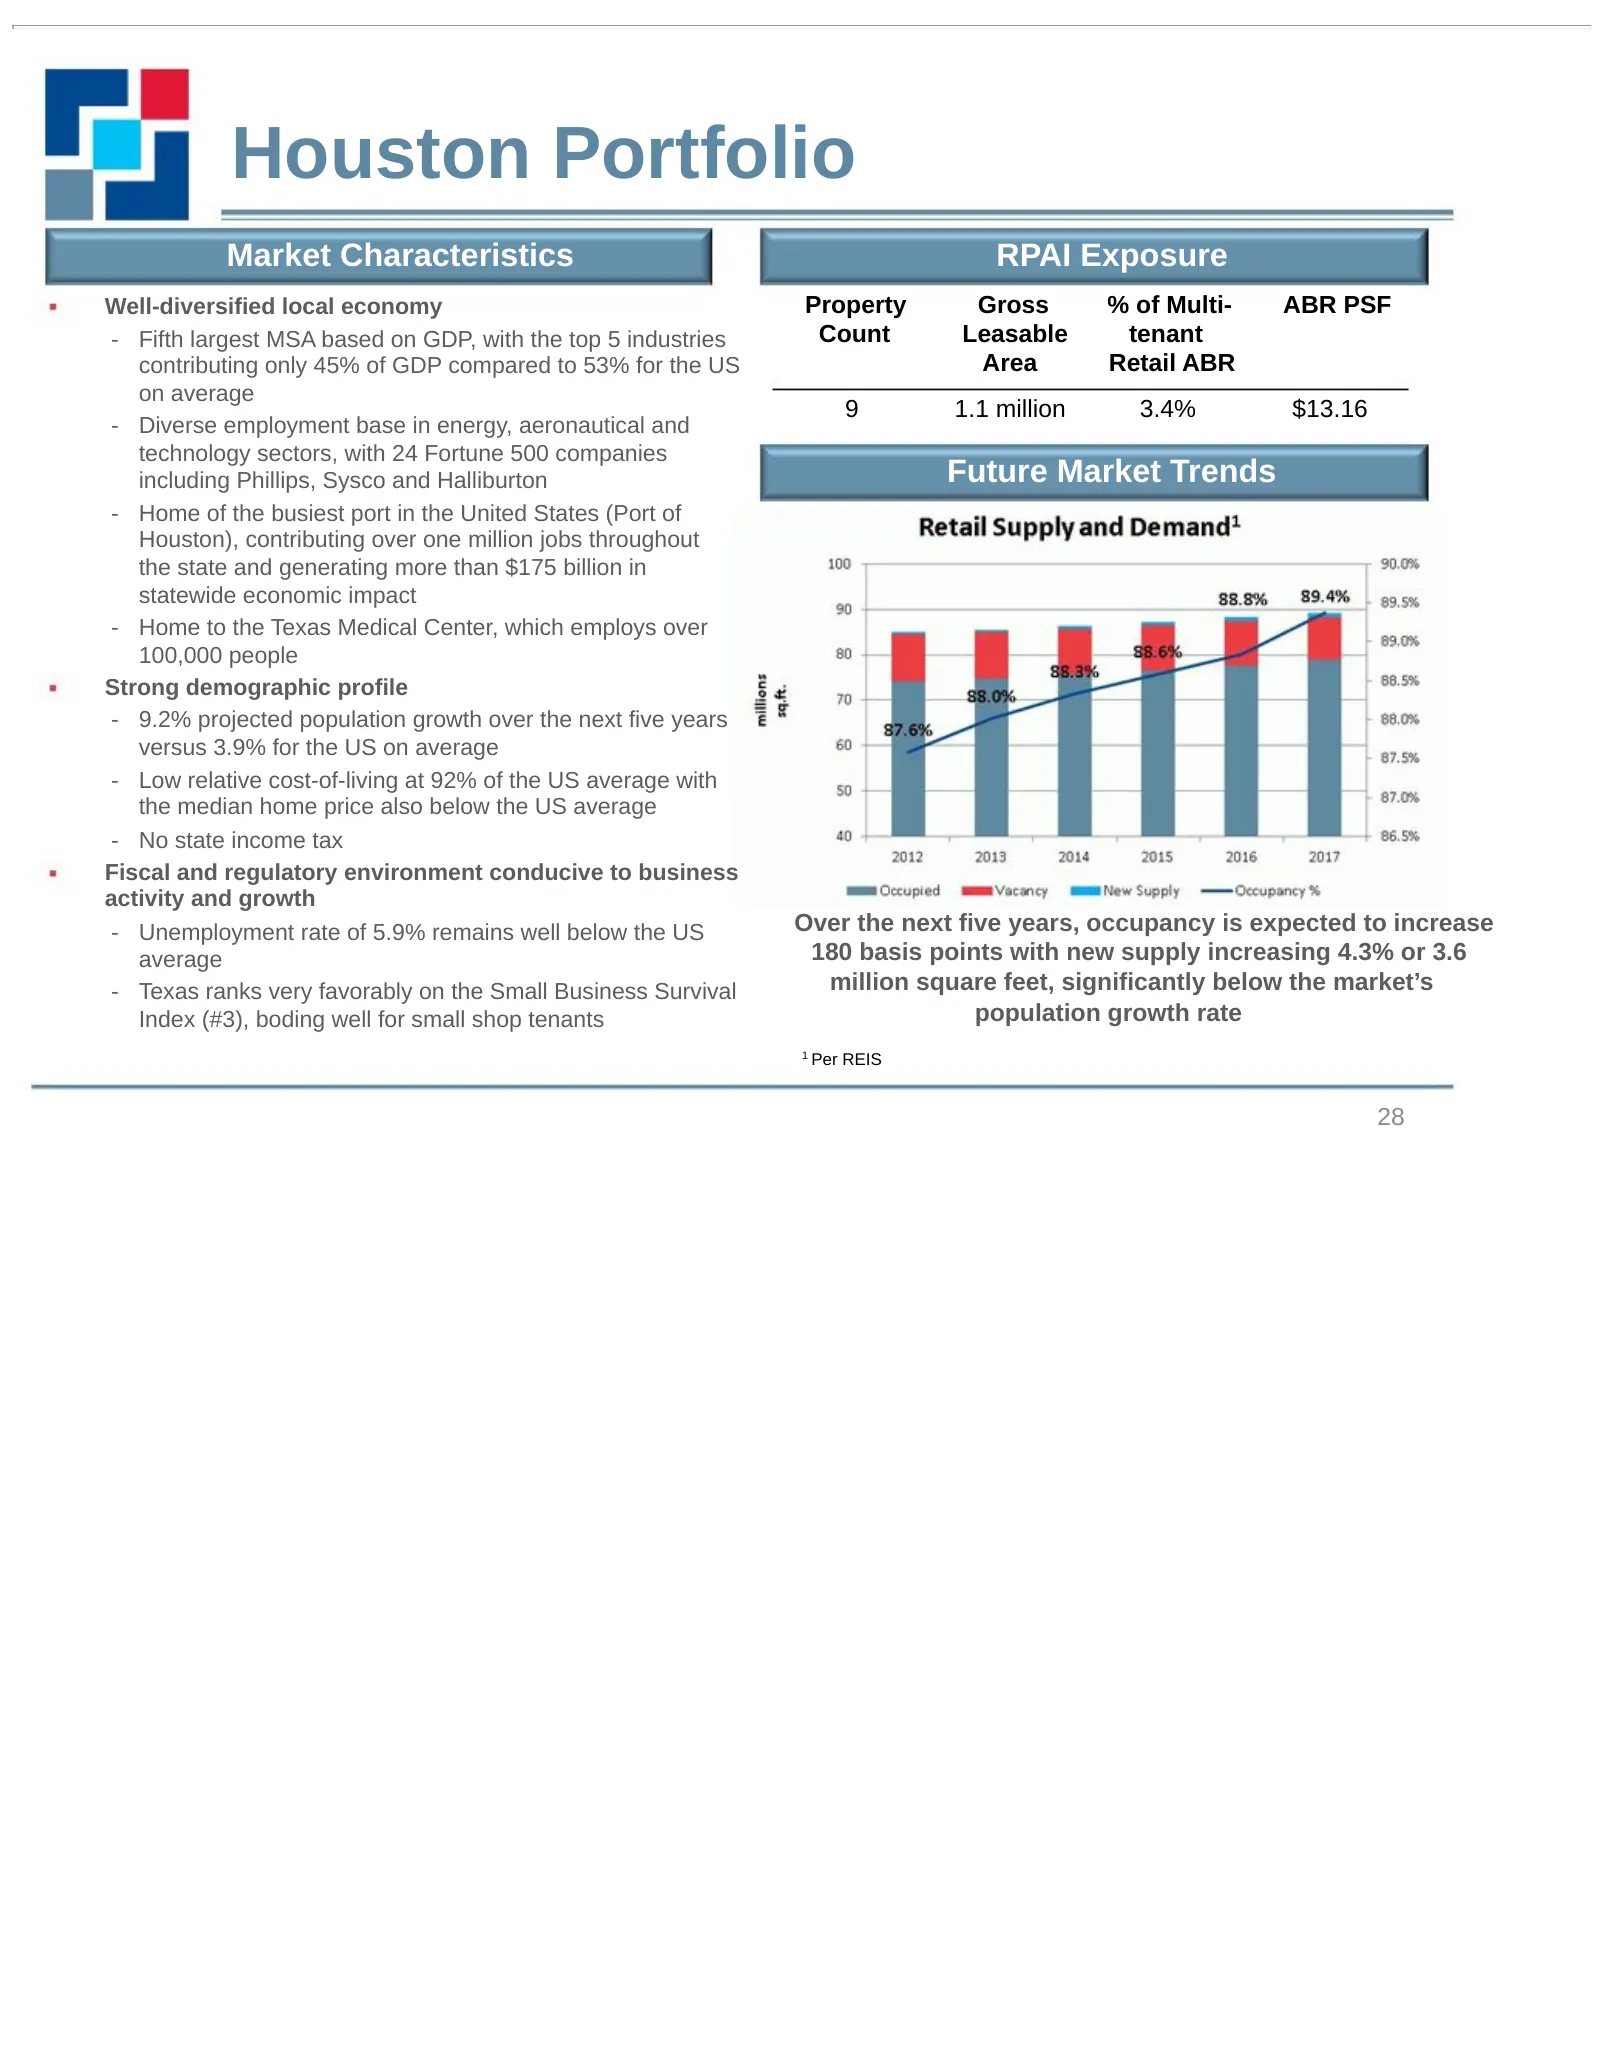
Houston Portfolio Market Characteristics RPAI Exposure Well-diversified local economy Property Gross % of Multi- ABR PSF - Fifth largest MSA based on GDP, with the top 5 industries Count Leasable tenant contributing only 45% of GDP compared to 53% for the US Area Retail ABR on average 9 1.1 million
Slide 29: Sawyer Heights
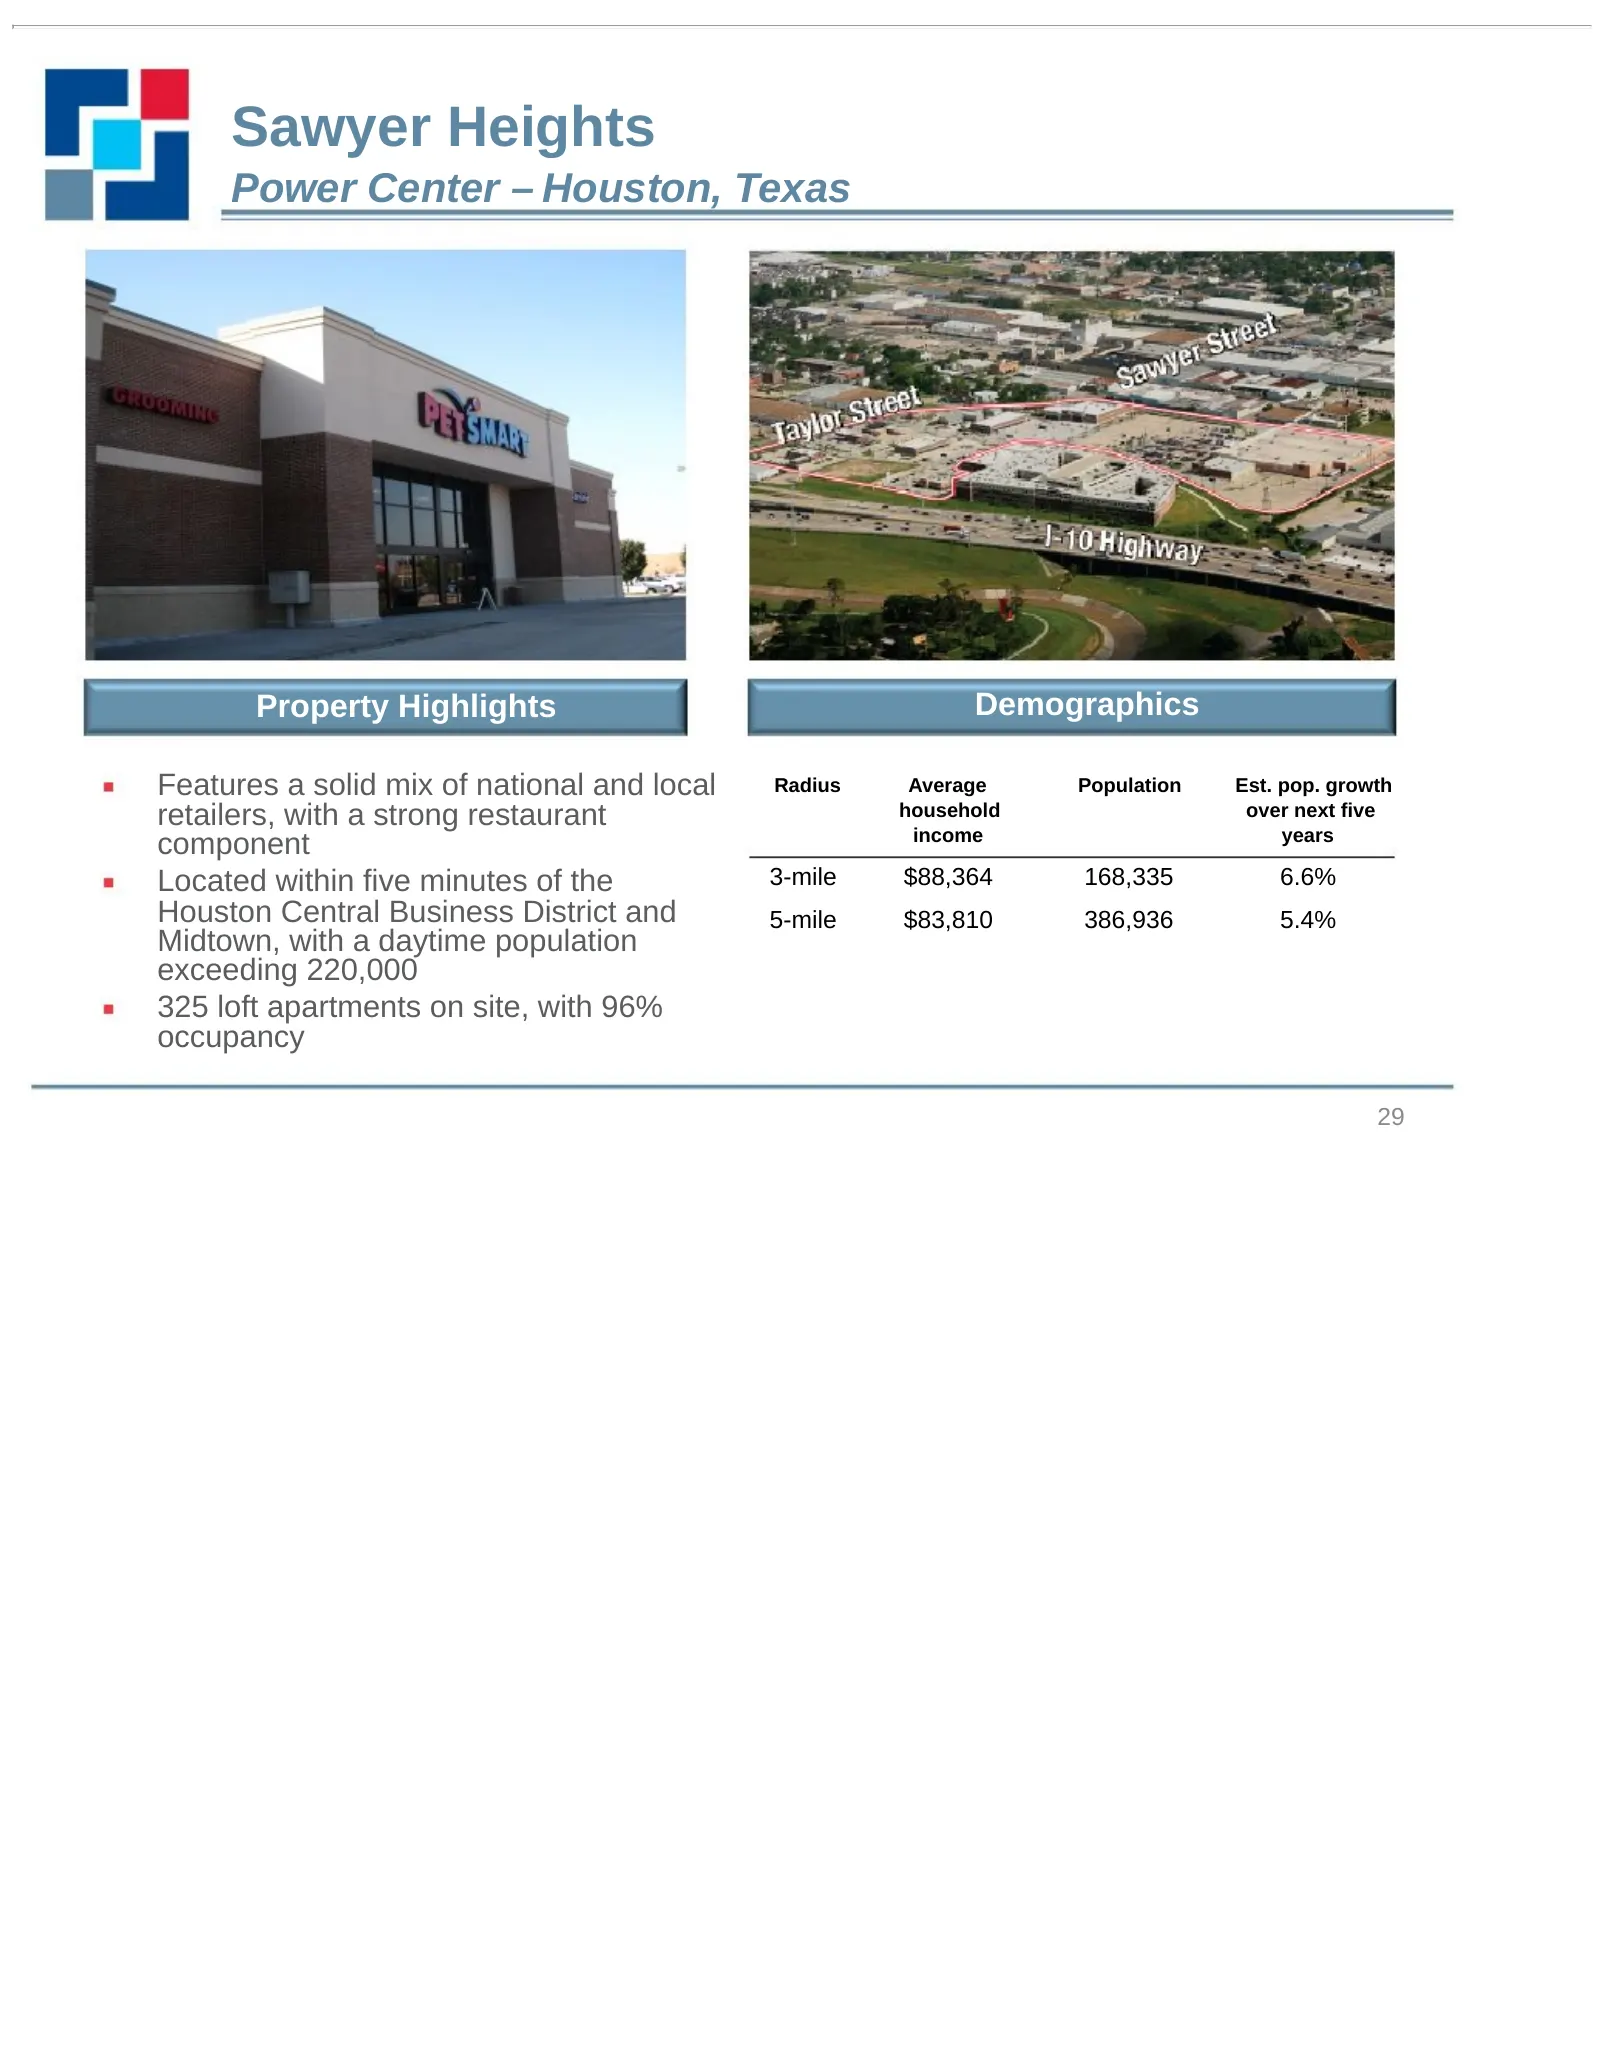
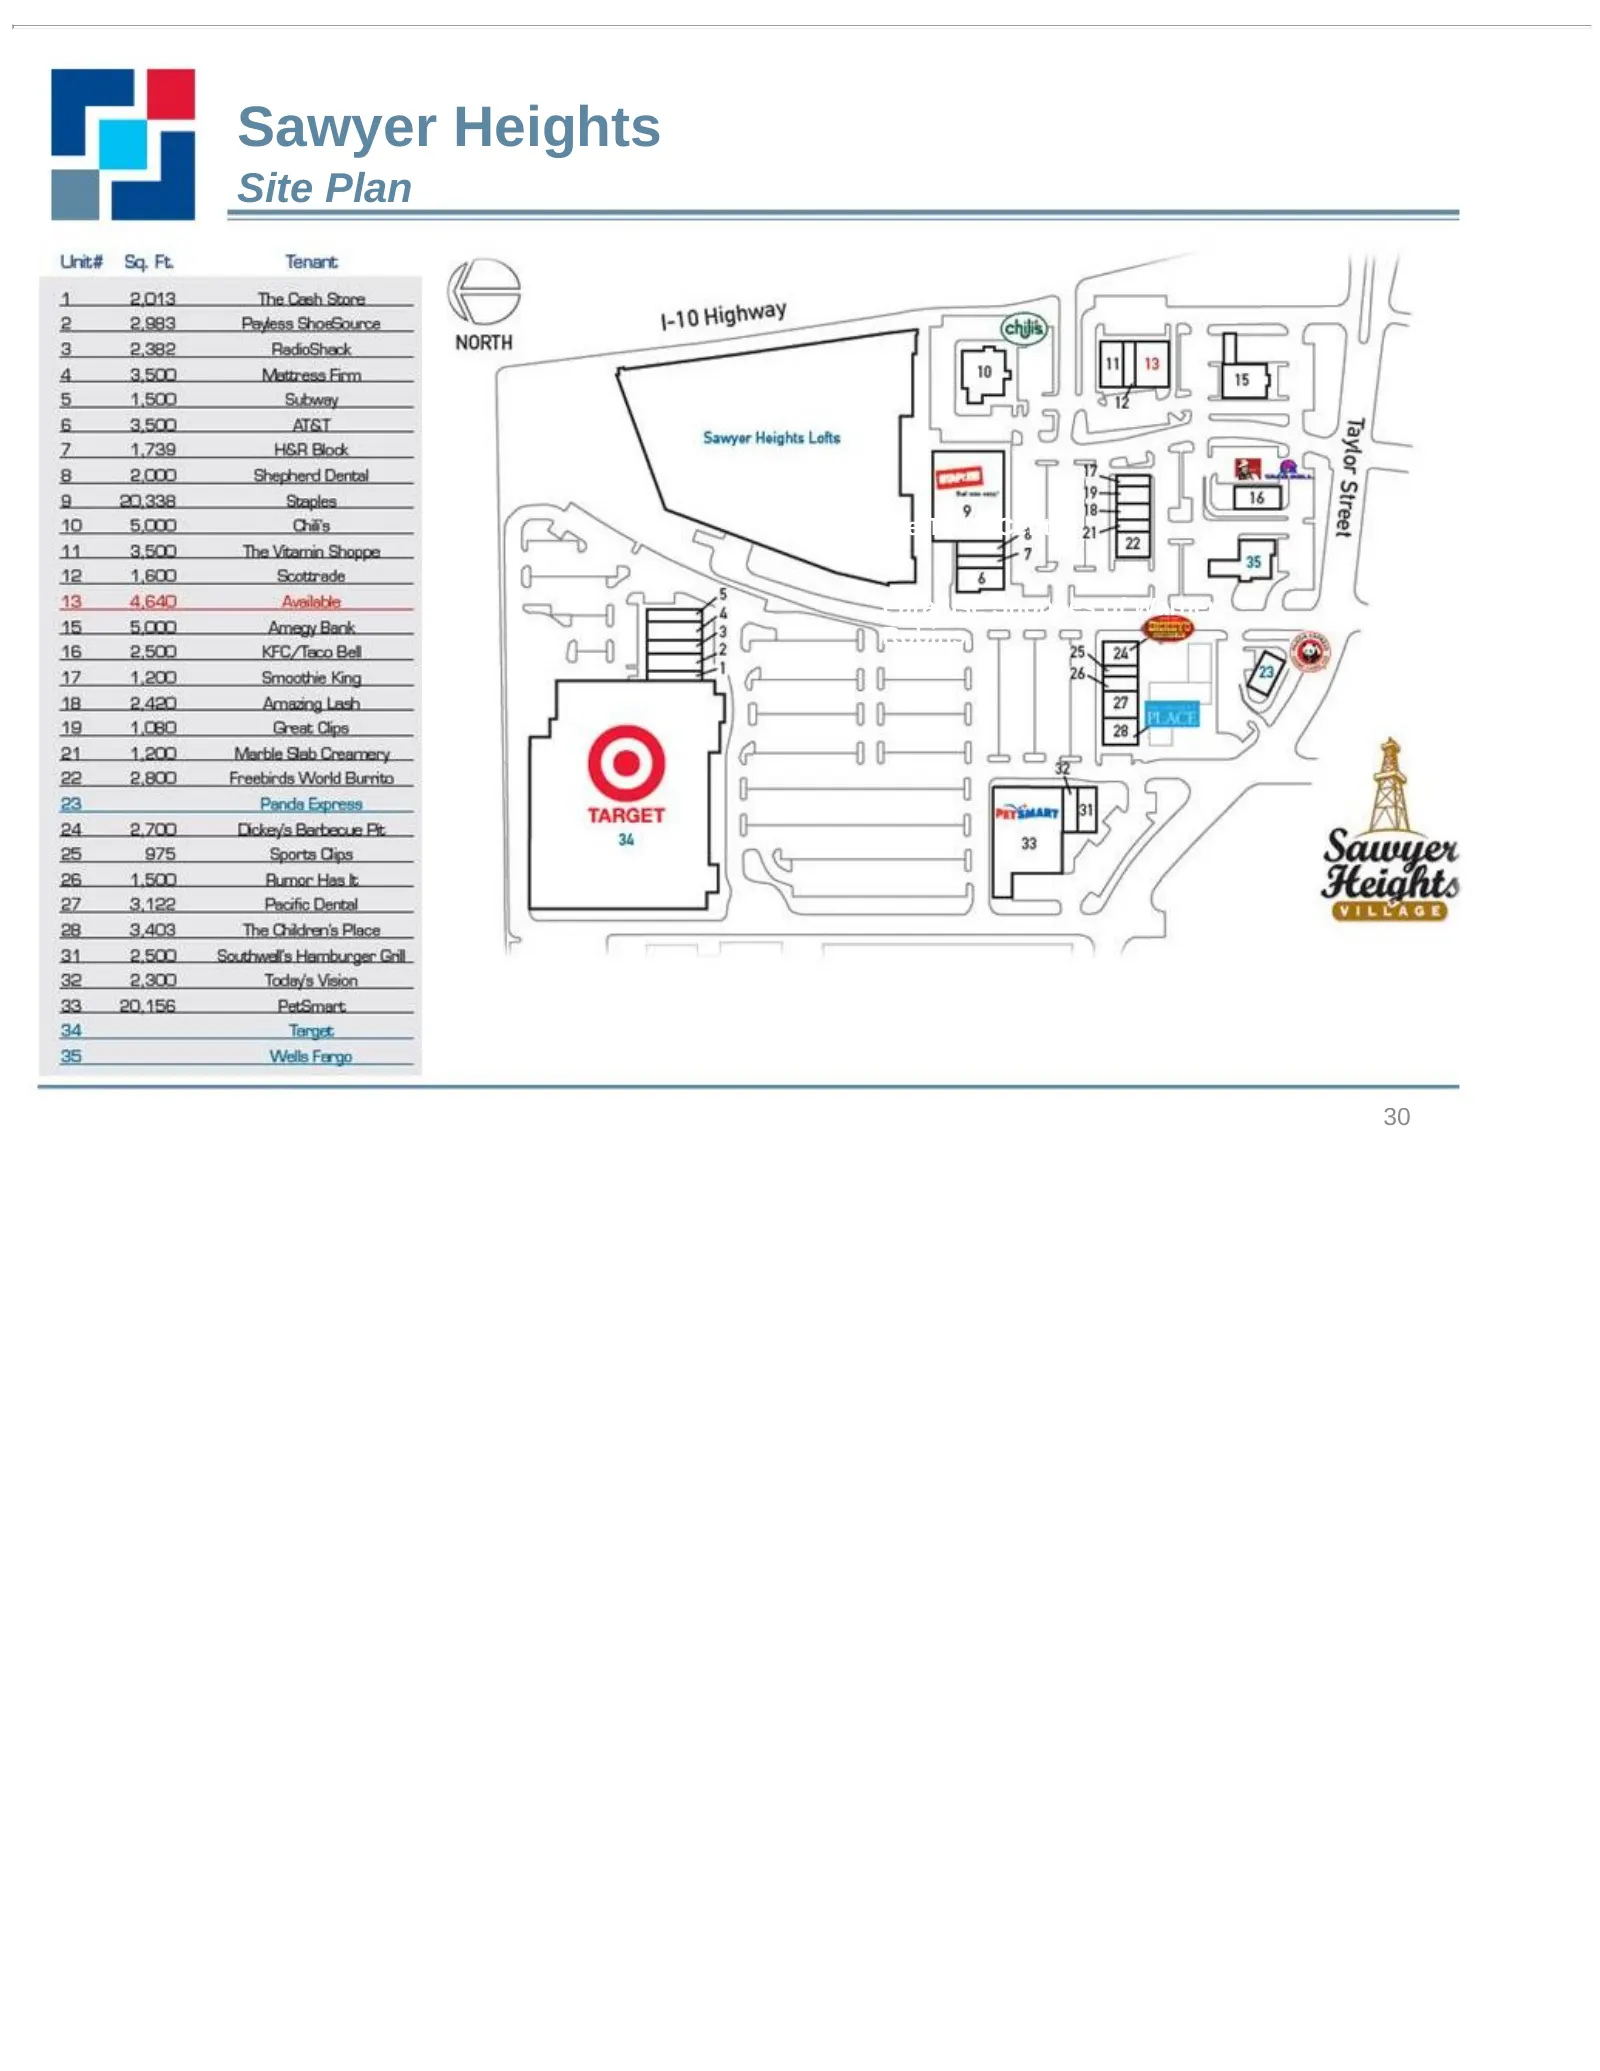
Sawyer Heights Power Center – Houston, Texas Property Highlights Demographics Features a solid mix of national and local Radius Average Population Est. pop. growth retailers, with a strong restaurant household over next five income years component Located within five minutes of the 3-mile $88,364 16
Slide 30: Sawyer Heights Site Plan
Sawyer Heights Site Plan Southlake Town Center Paradise Shoppes of Warner Robins 30
Slide 31: San Antonio Portfolio
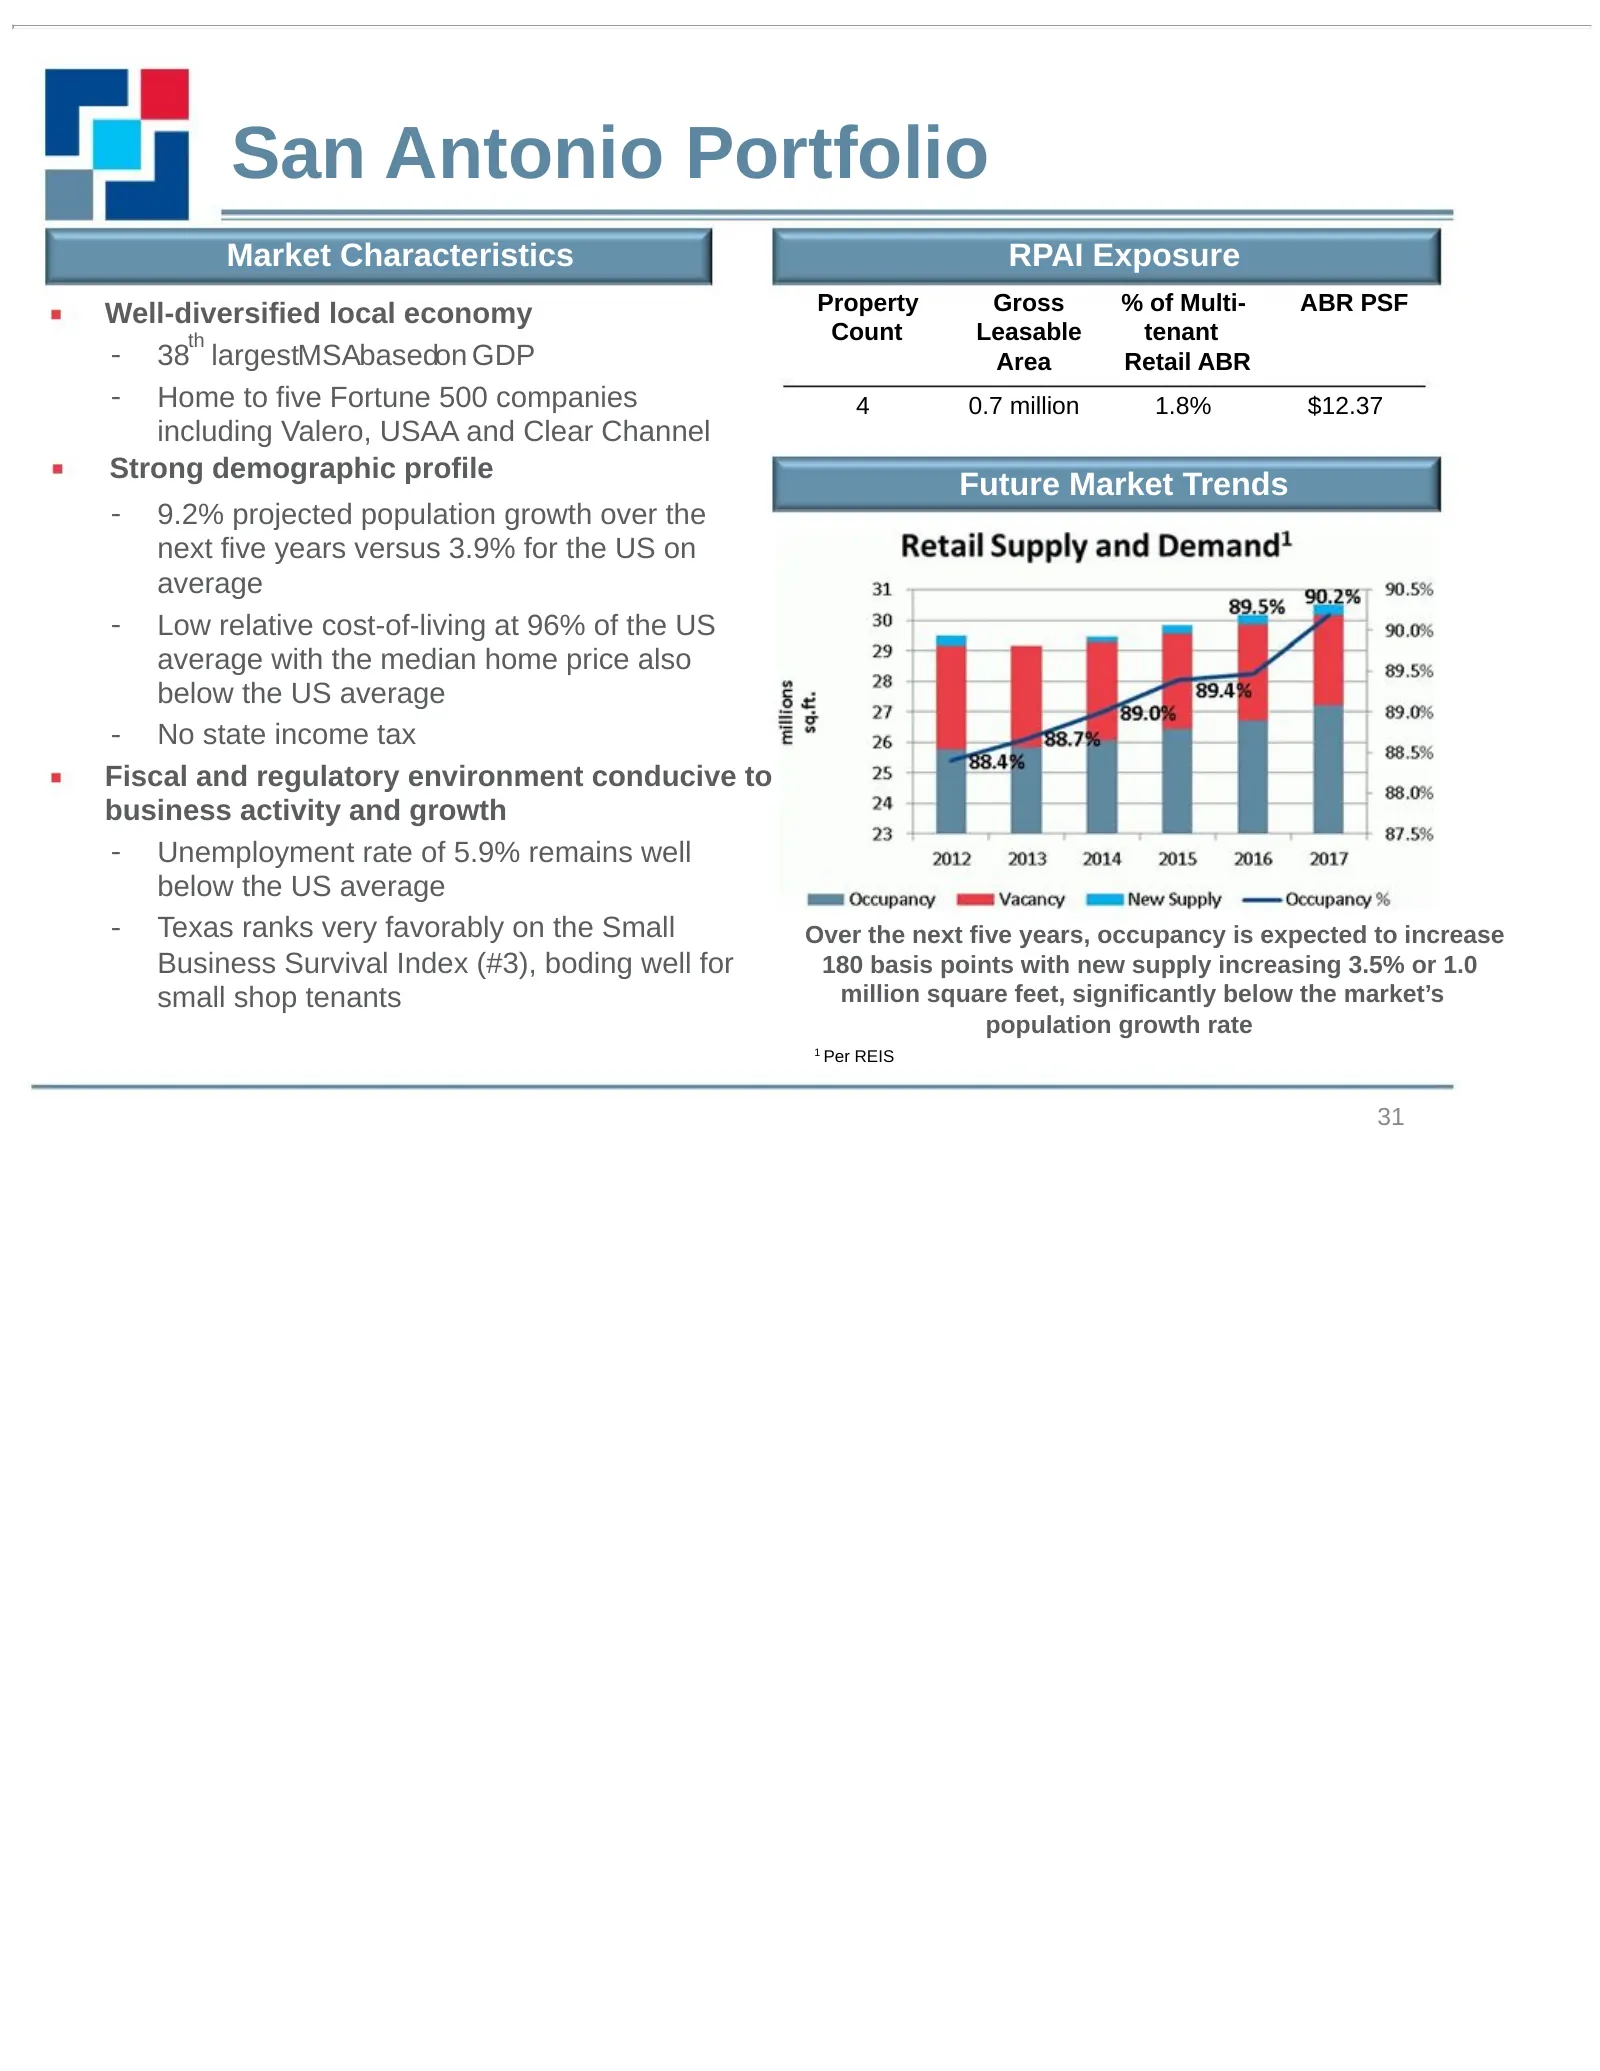
San Antonio Portfolio Market Characteristics RPAI Exposure Well-diversified local economy Property Gross % of Multi- ABR PSF th Count Leasable tenant - 38 largestMSAbasedon GDP Area Retail ABR - Home to five Fortune 500 companies 4 0.7 million 1.8% $12.37 including Valero, USAA and Clear Channel Str
Slide 32: La Plaza Del Norte
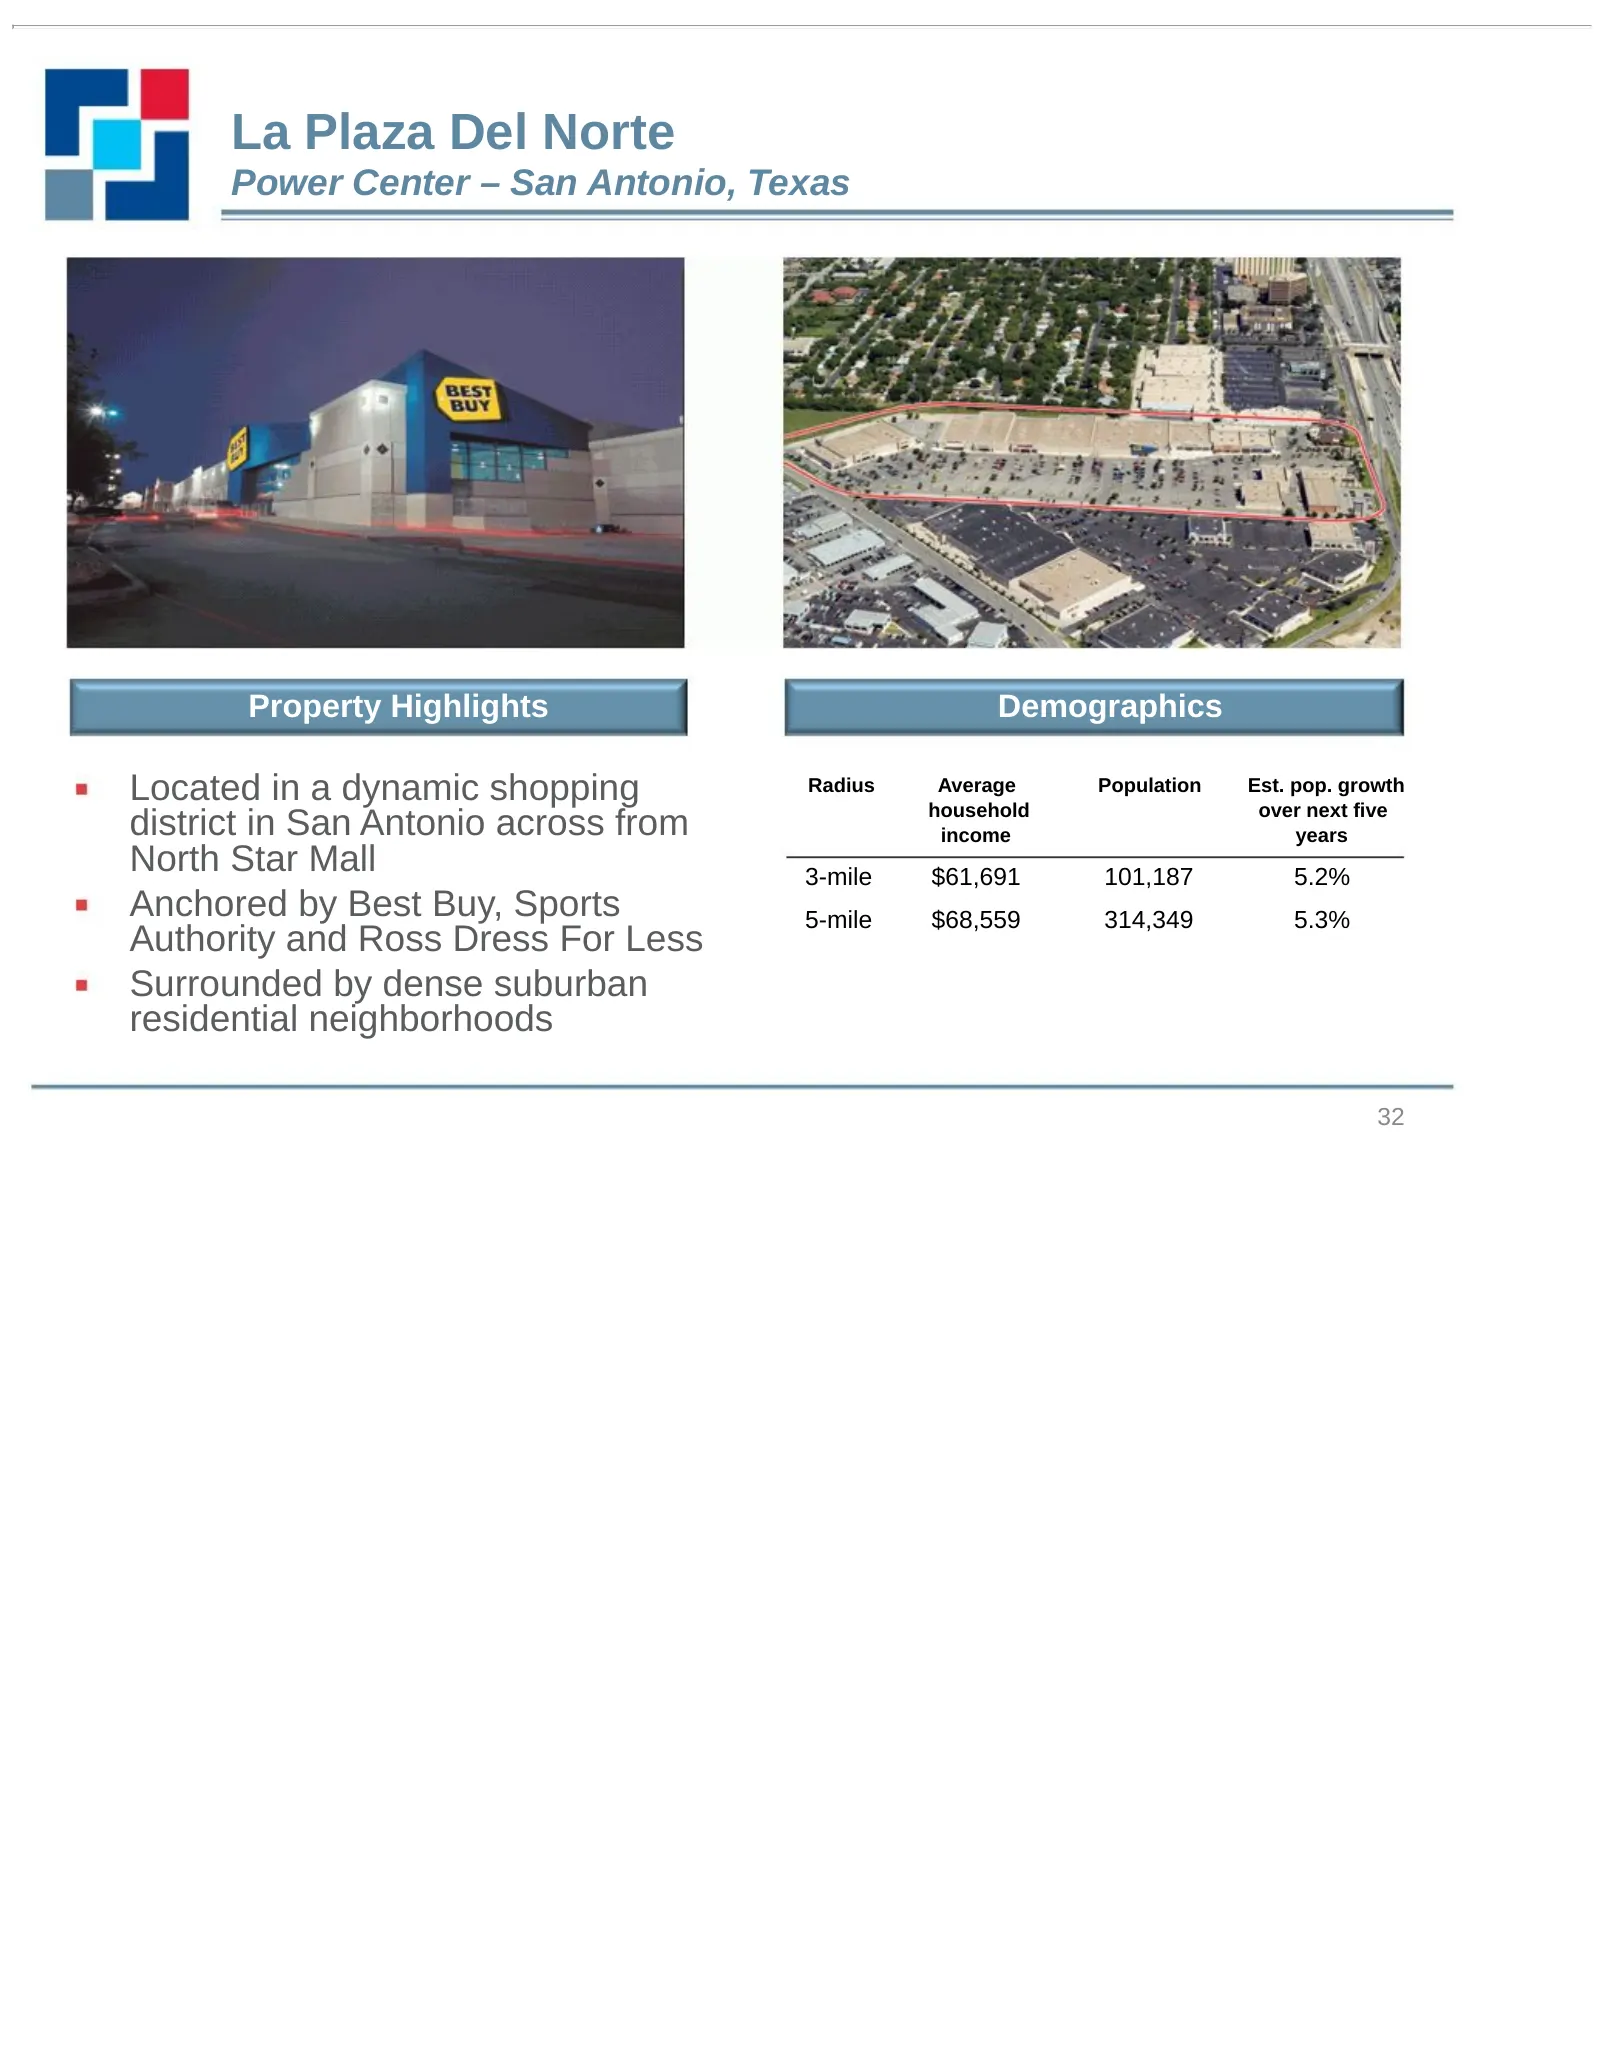
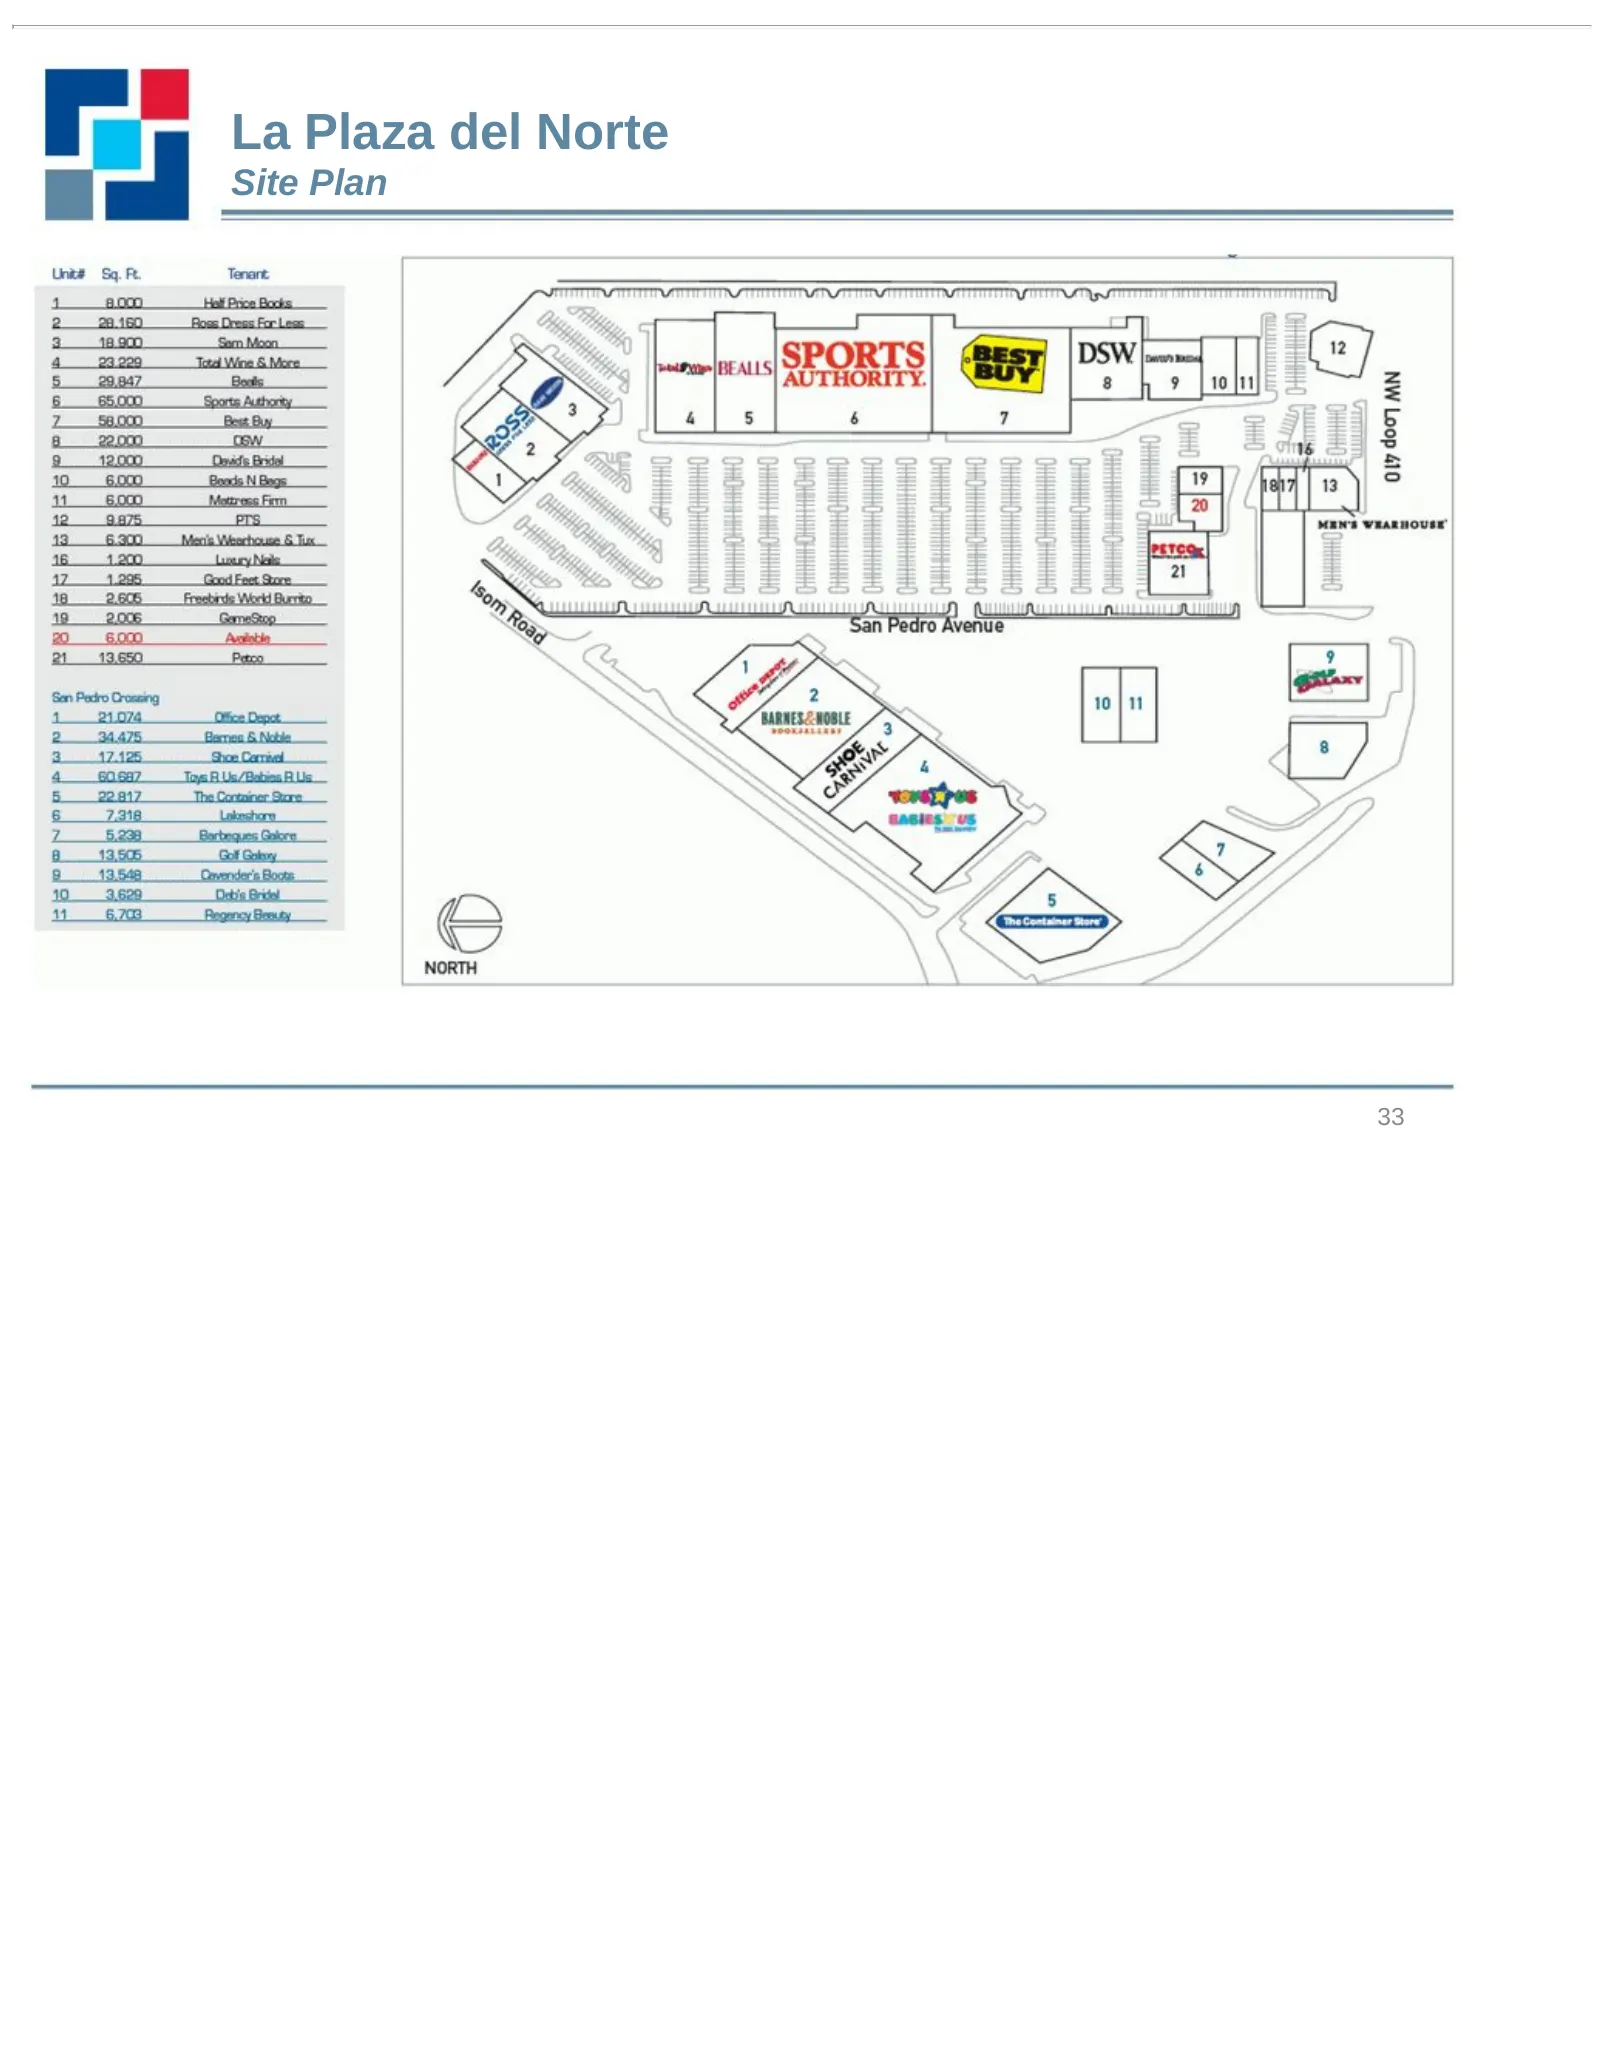
La Plaza Del Norte Power Center – San Antonio, Texas Property Highlights Demographics Located in a dynamic shopping Radius Average household Population Est. pop. growth over next five district in San Antonio across from income years North Star Mall 3-mile $61,691 101,187 5.2% Anchored by Best Buy, S
Slide 33: La Plaza del Norte Site Plan
La Plaza del Norte Site Plan 33
Slide 34: Austin Portfolio
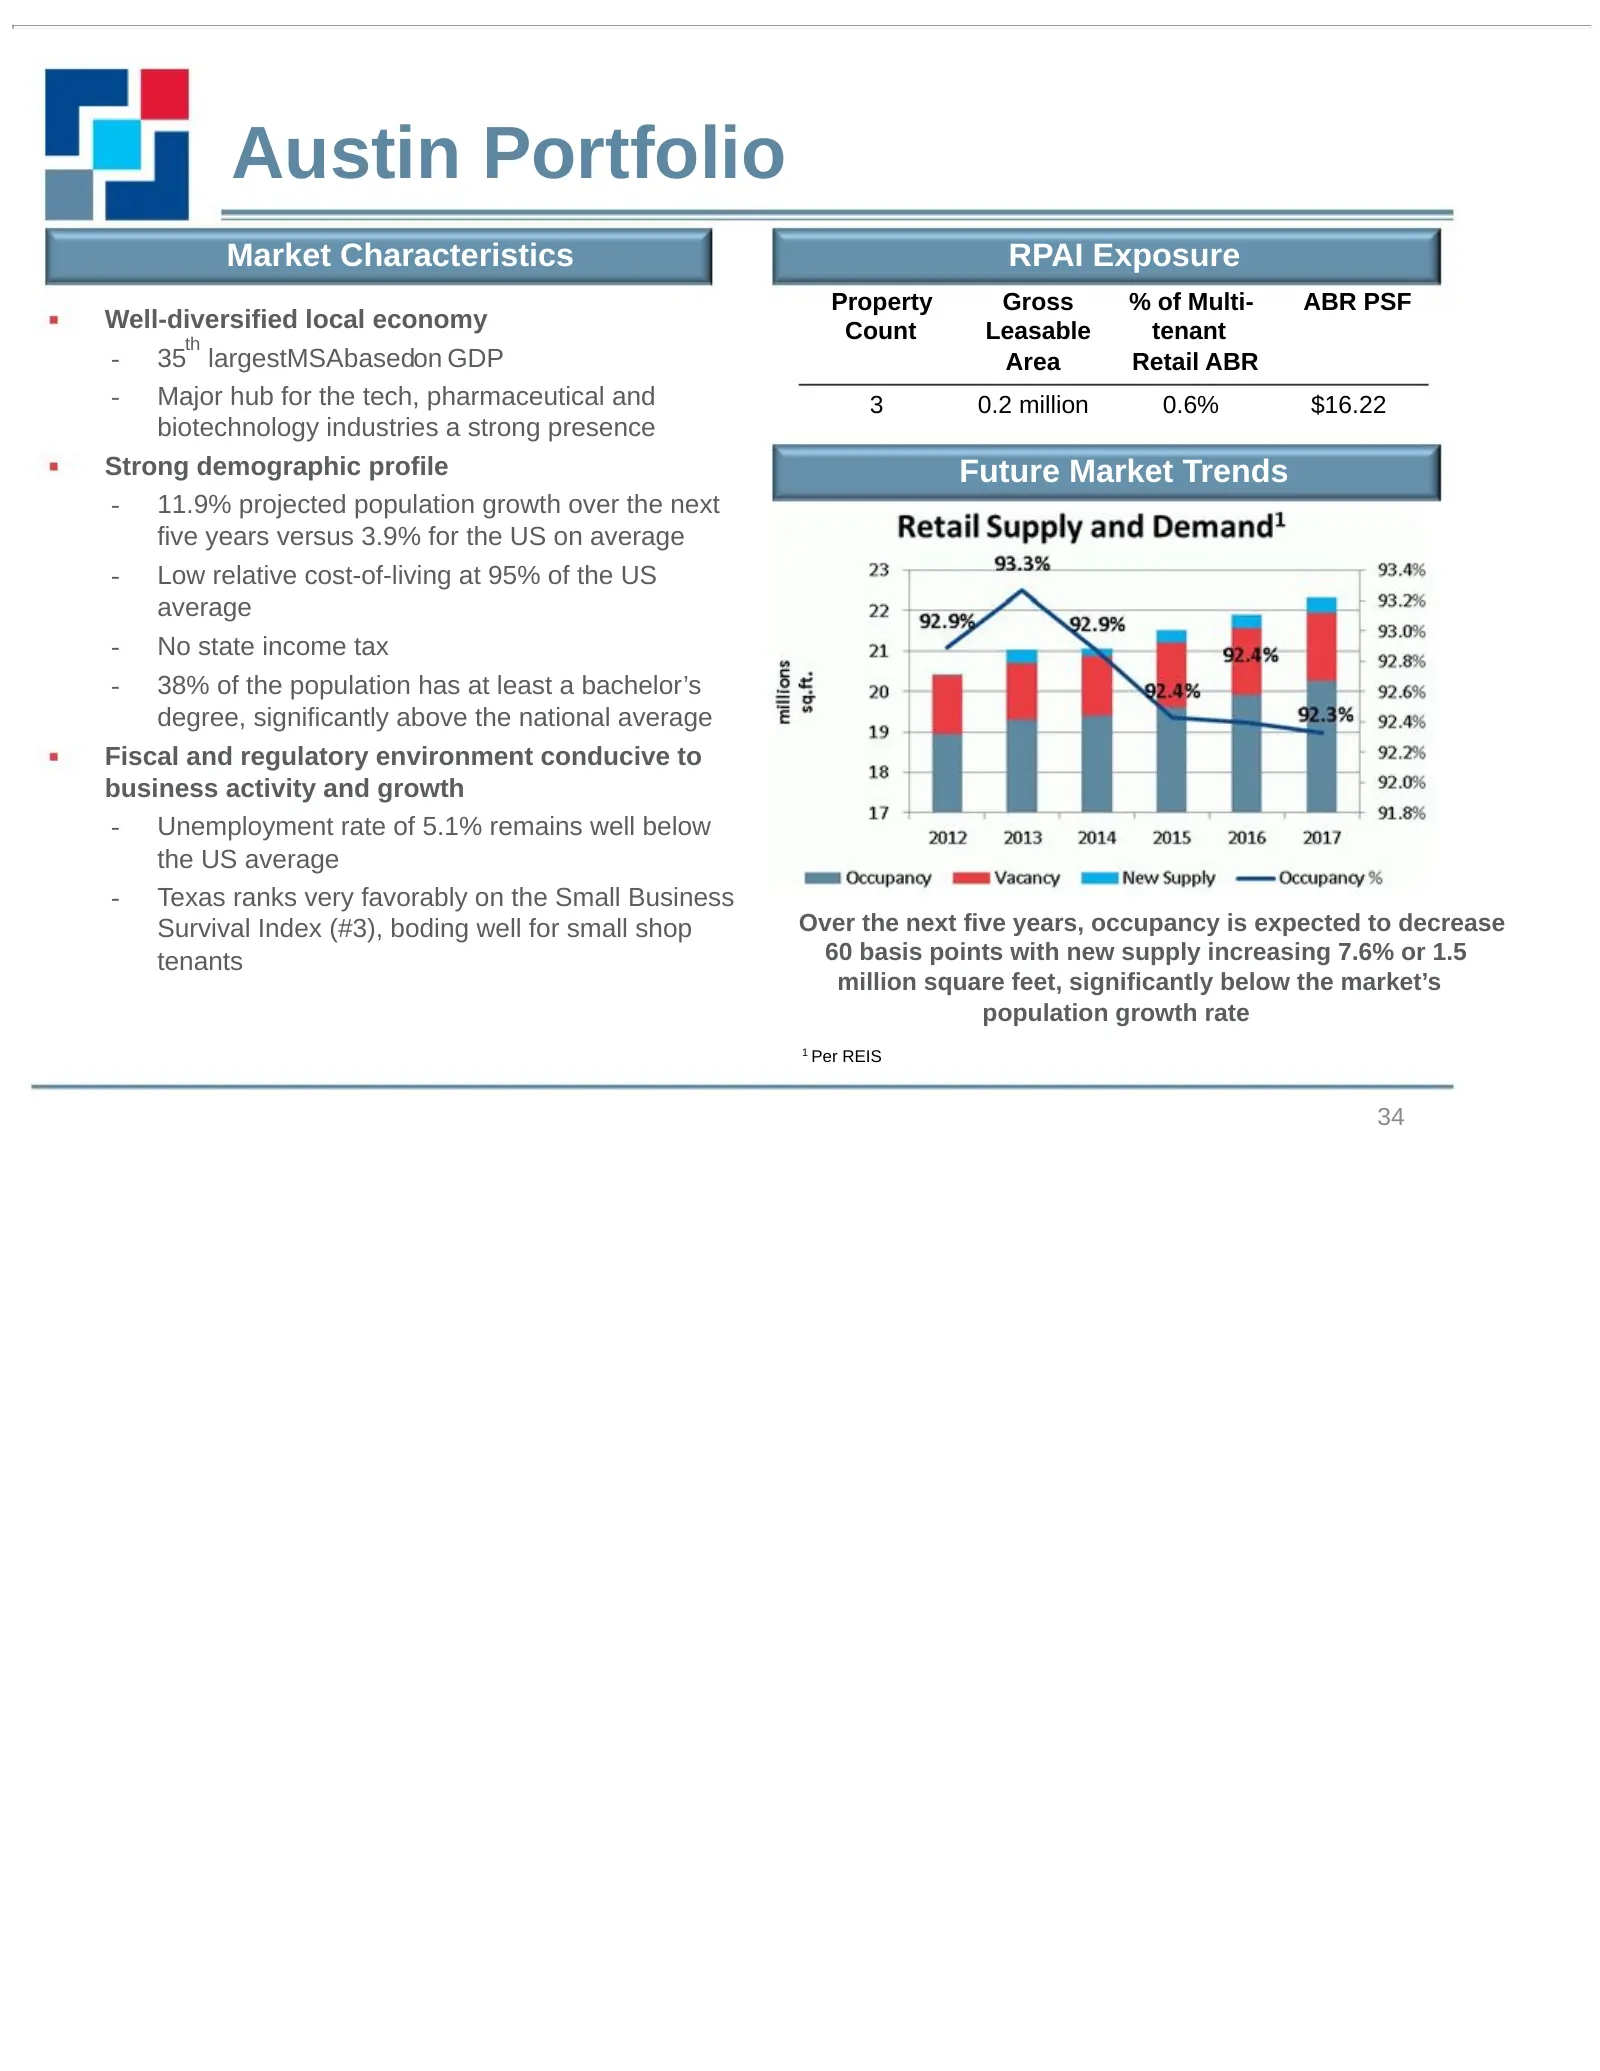
Austin Portfolio Market Characteristics RPAI Exposure Property Gross % of Multi- ABR PSF Well-diversified local economy Count Leasable tenant th - 35 largestMSAbasedon GDP Area Retail ABR - Major hub for the tech, pharmaceutical and 3 0.2 million 0.6% $16.22 biotechnology industries a strong presenc
Slide 35: Shops at Forest Commons
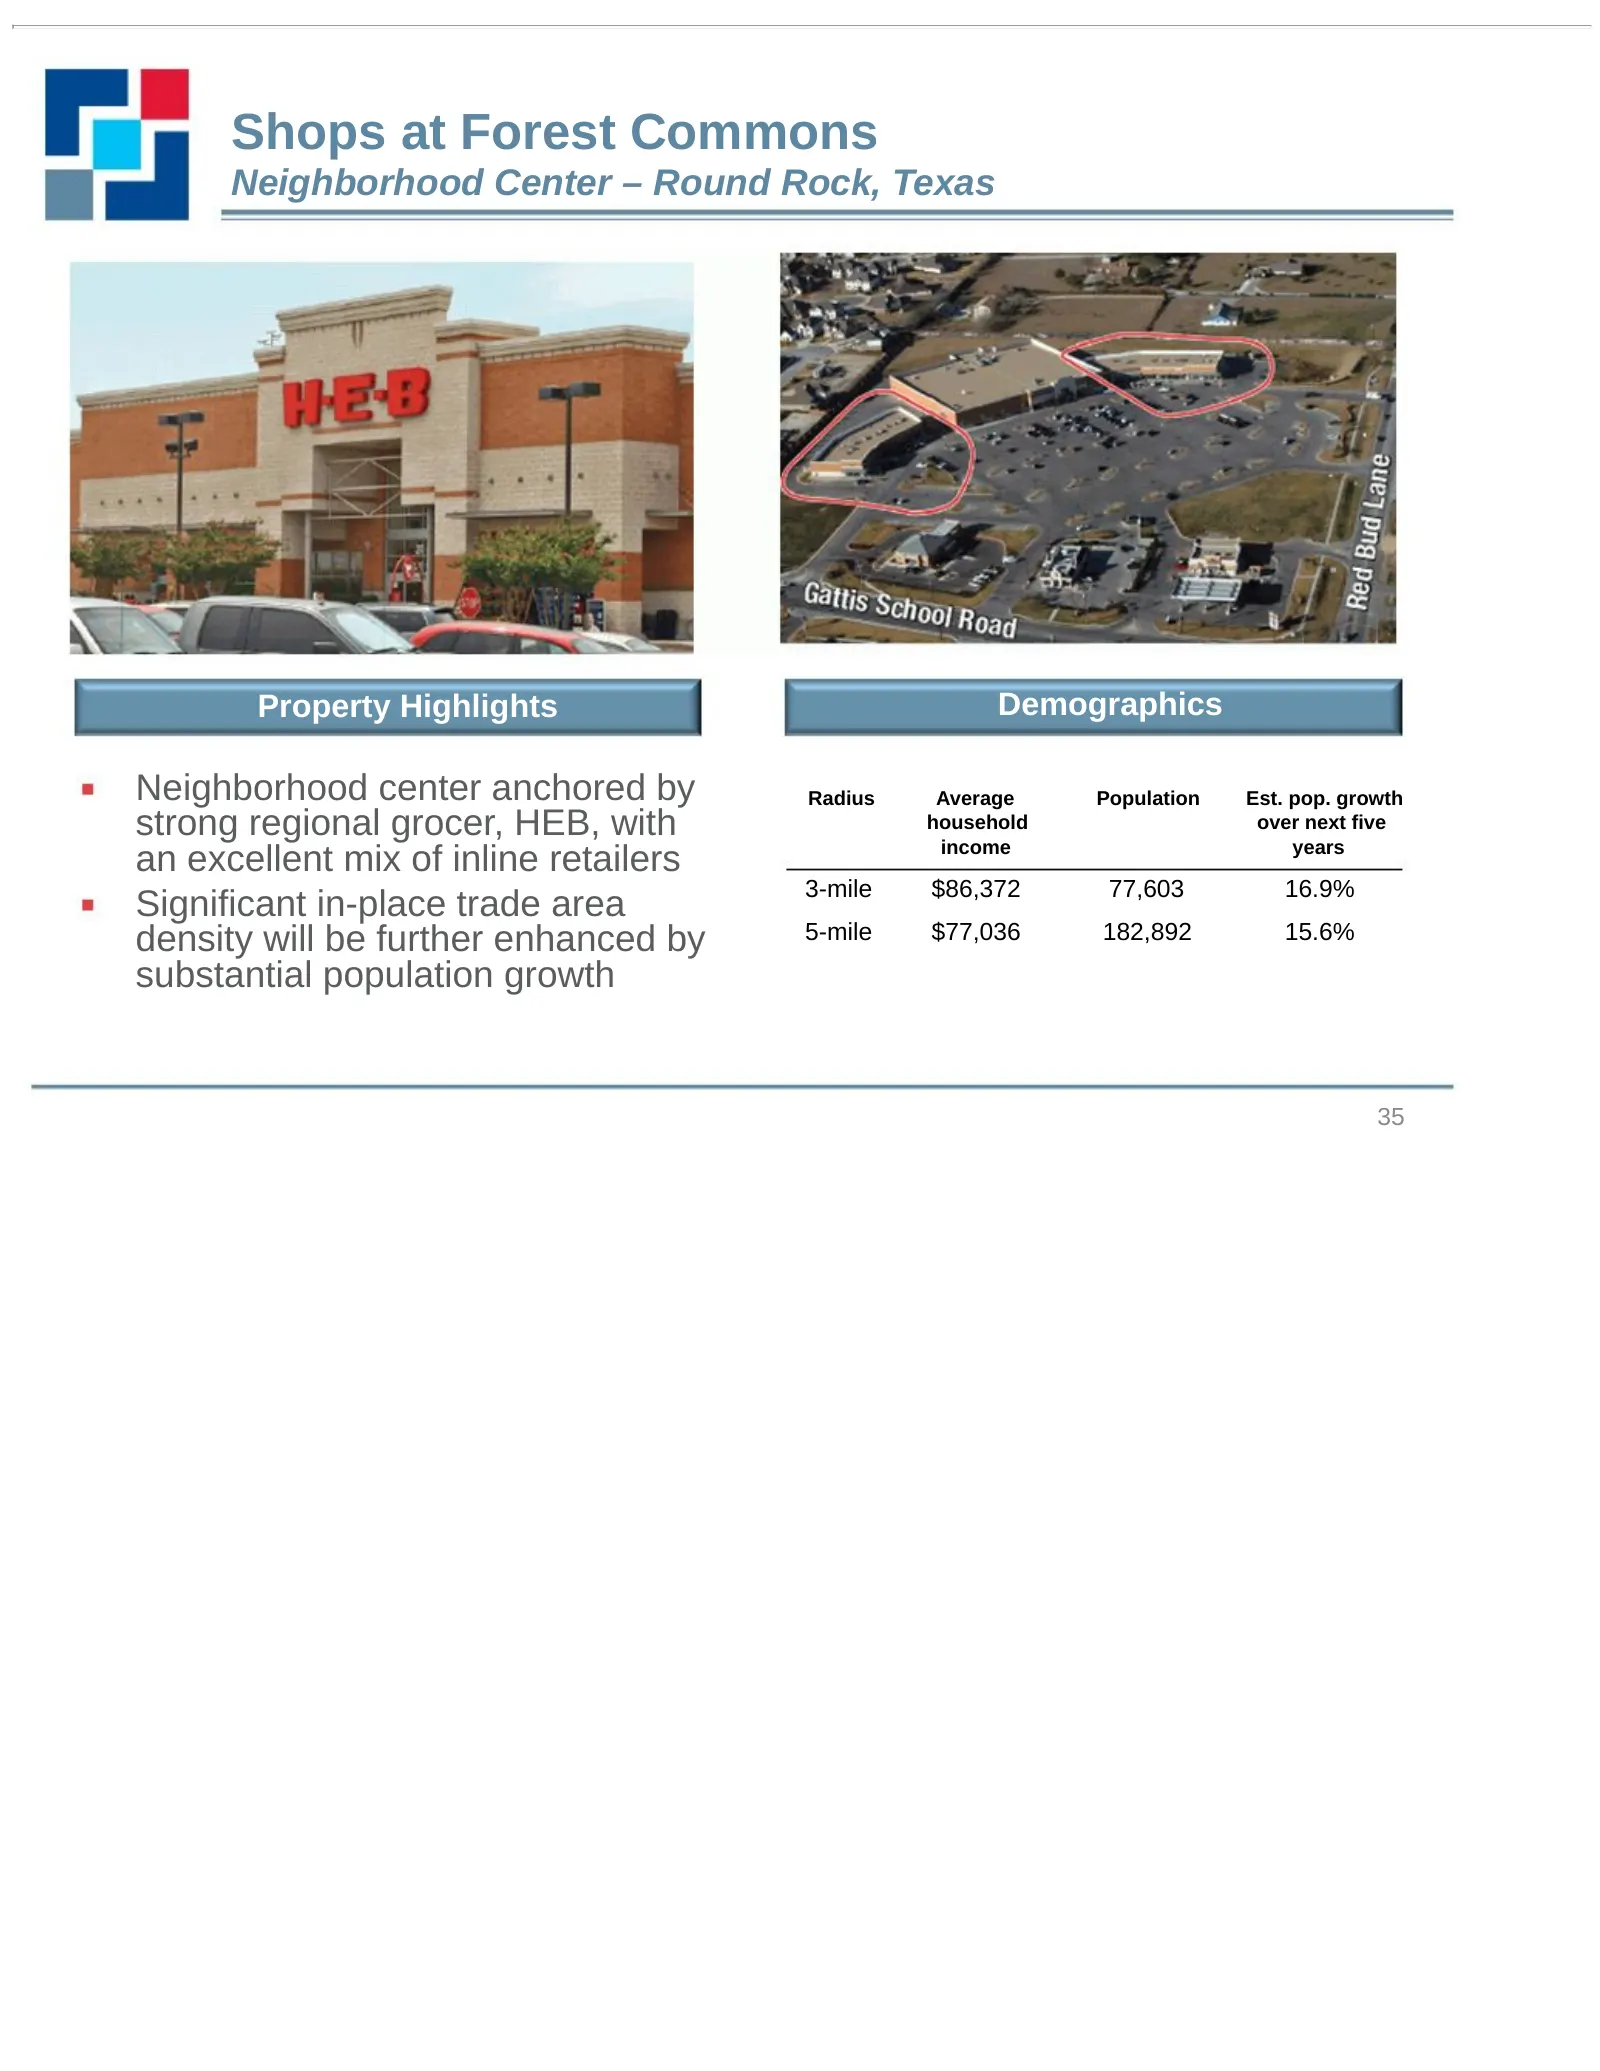
Shops at Forest Commons Neighborhood Center – Round Rock, Texas Property Highlights Demographics Neighborhood center anchored by Radius Average Population Est. pop. growth strong regional grocer, HEB, with household income over next five years an excellent mix of inline retailers 3-mile $86,372 77,6
Slide 36: Shops at Forest Commons Site Plan
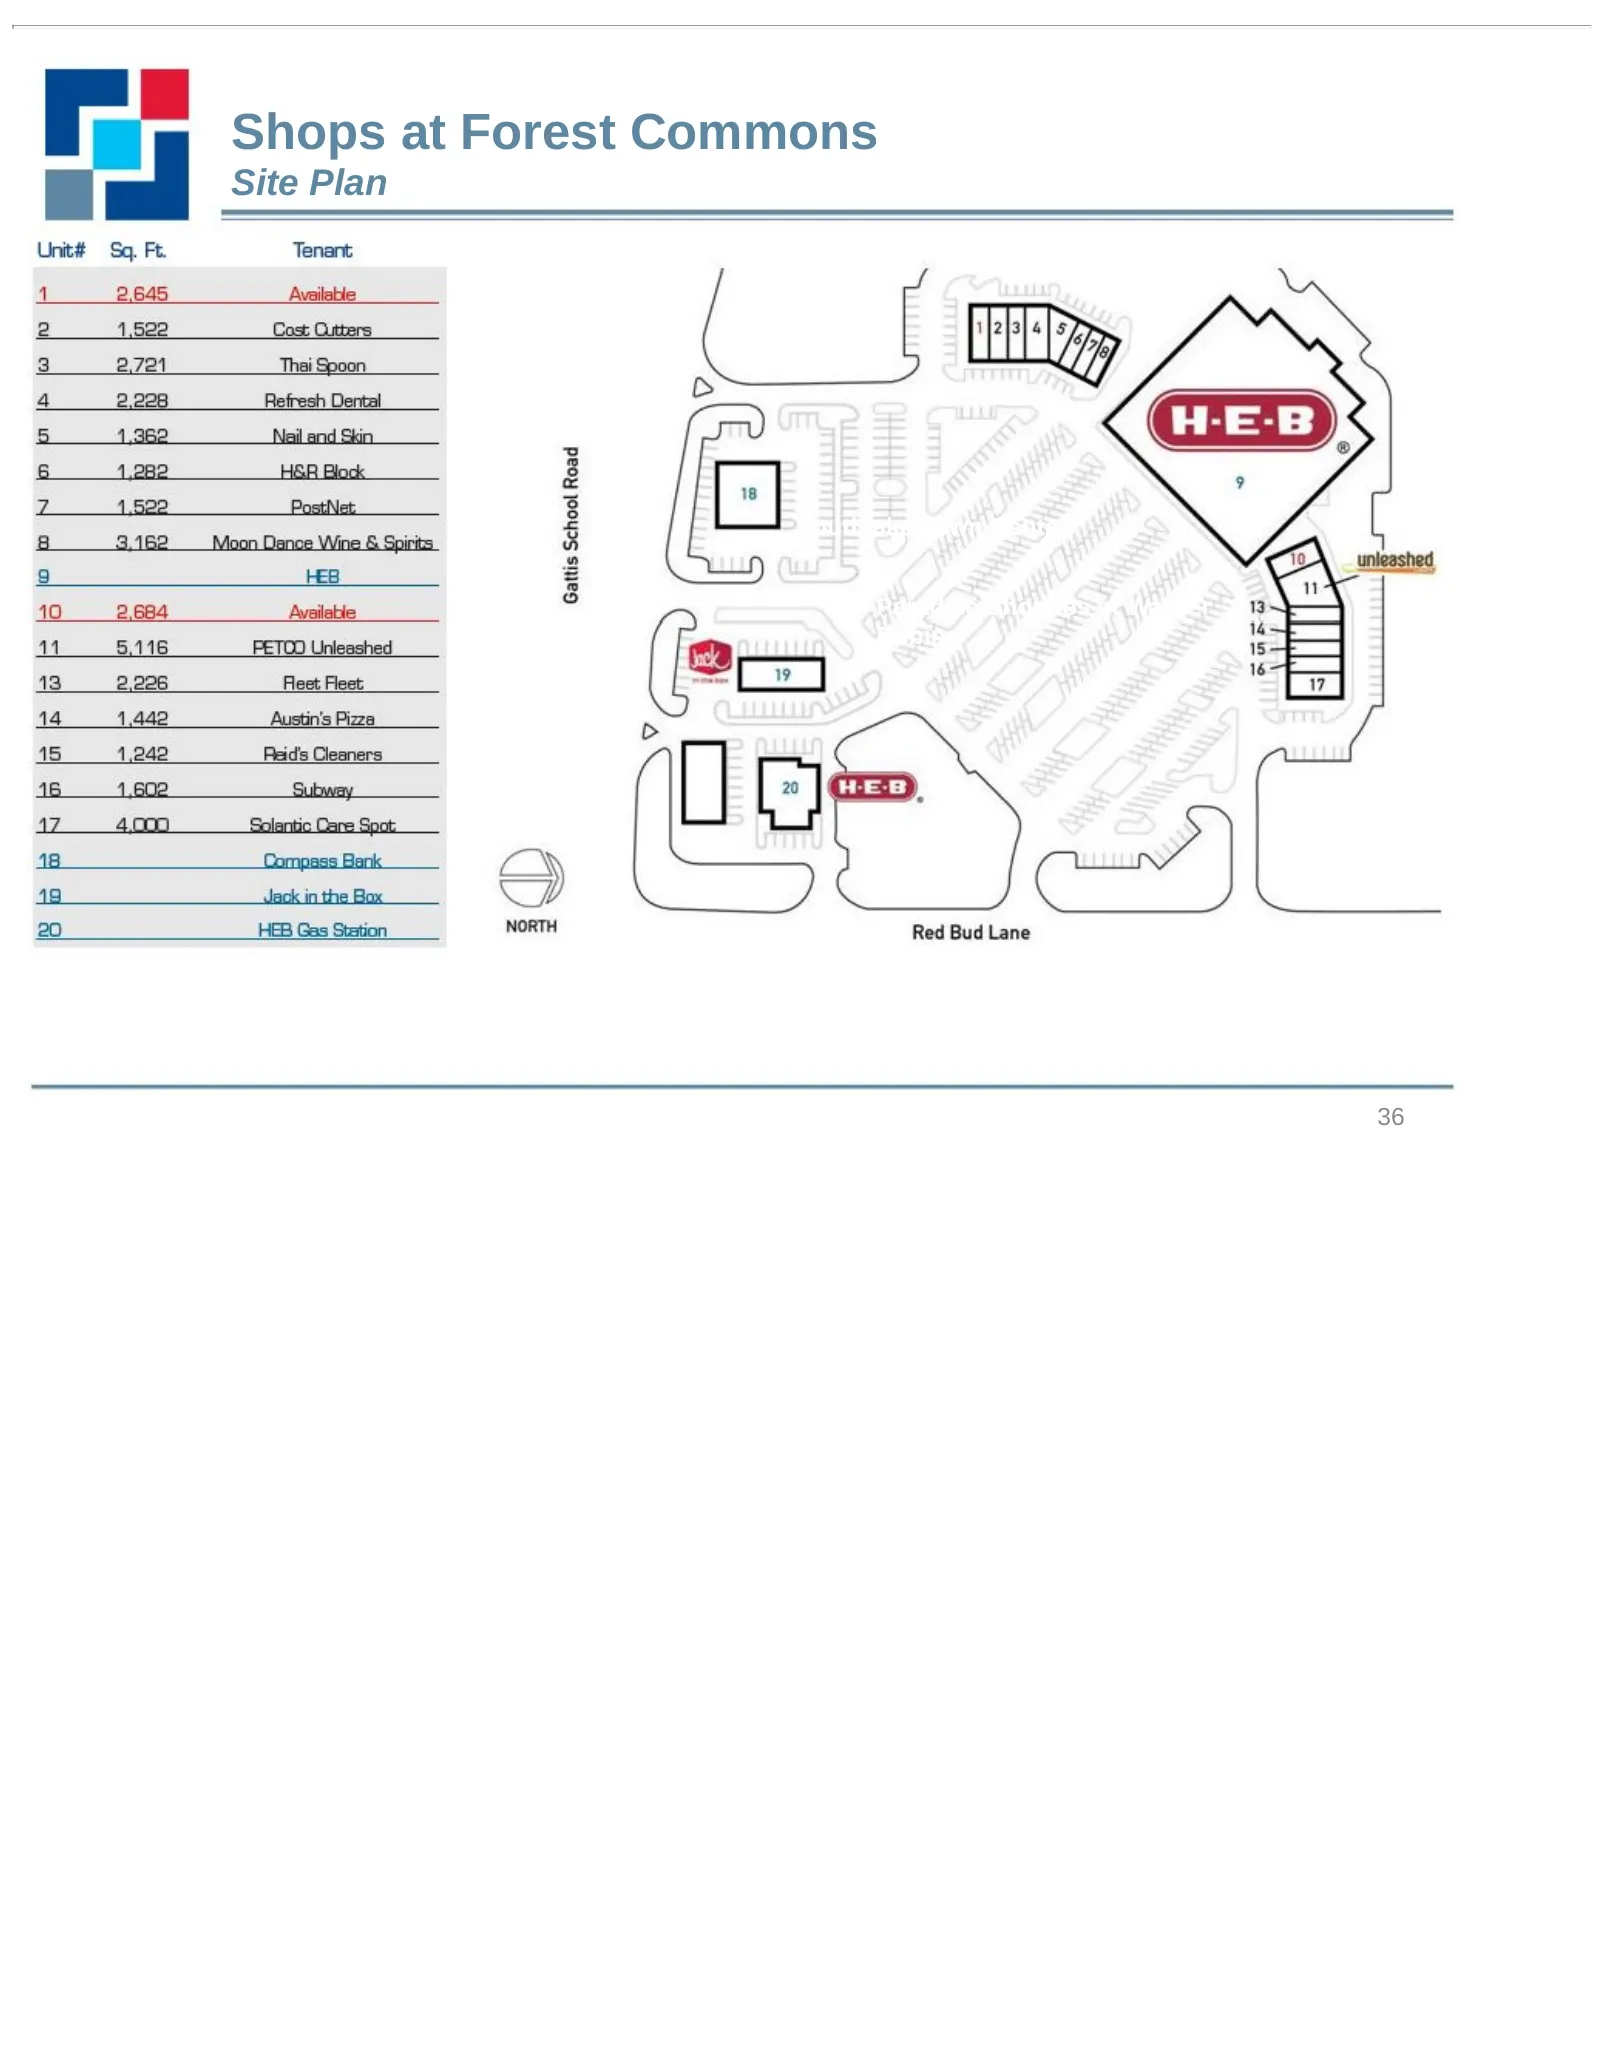
Shops at Forest Commons Site Plan Southlake Town Center Paradise Shoppes of Warner Robins 36
Slide 37: Seattle Portfolio
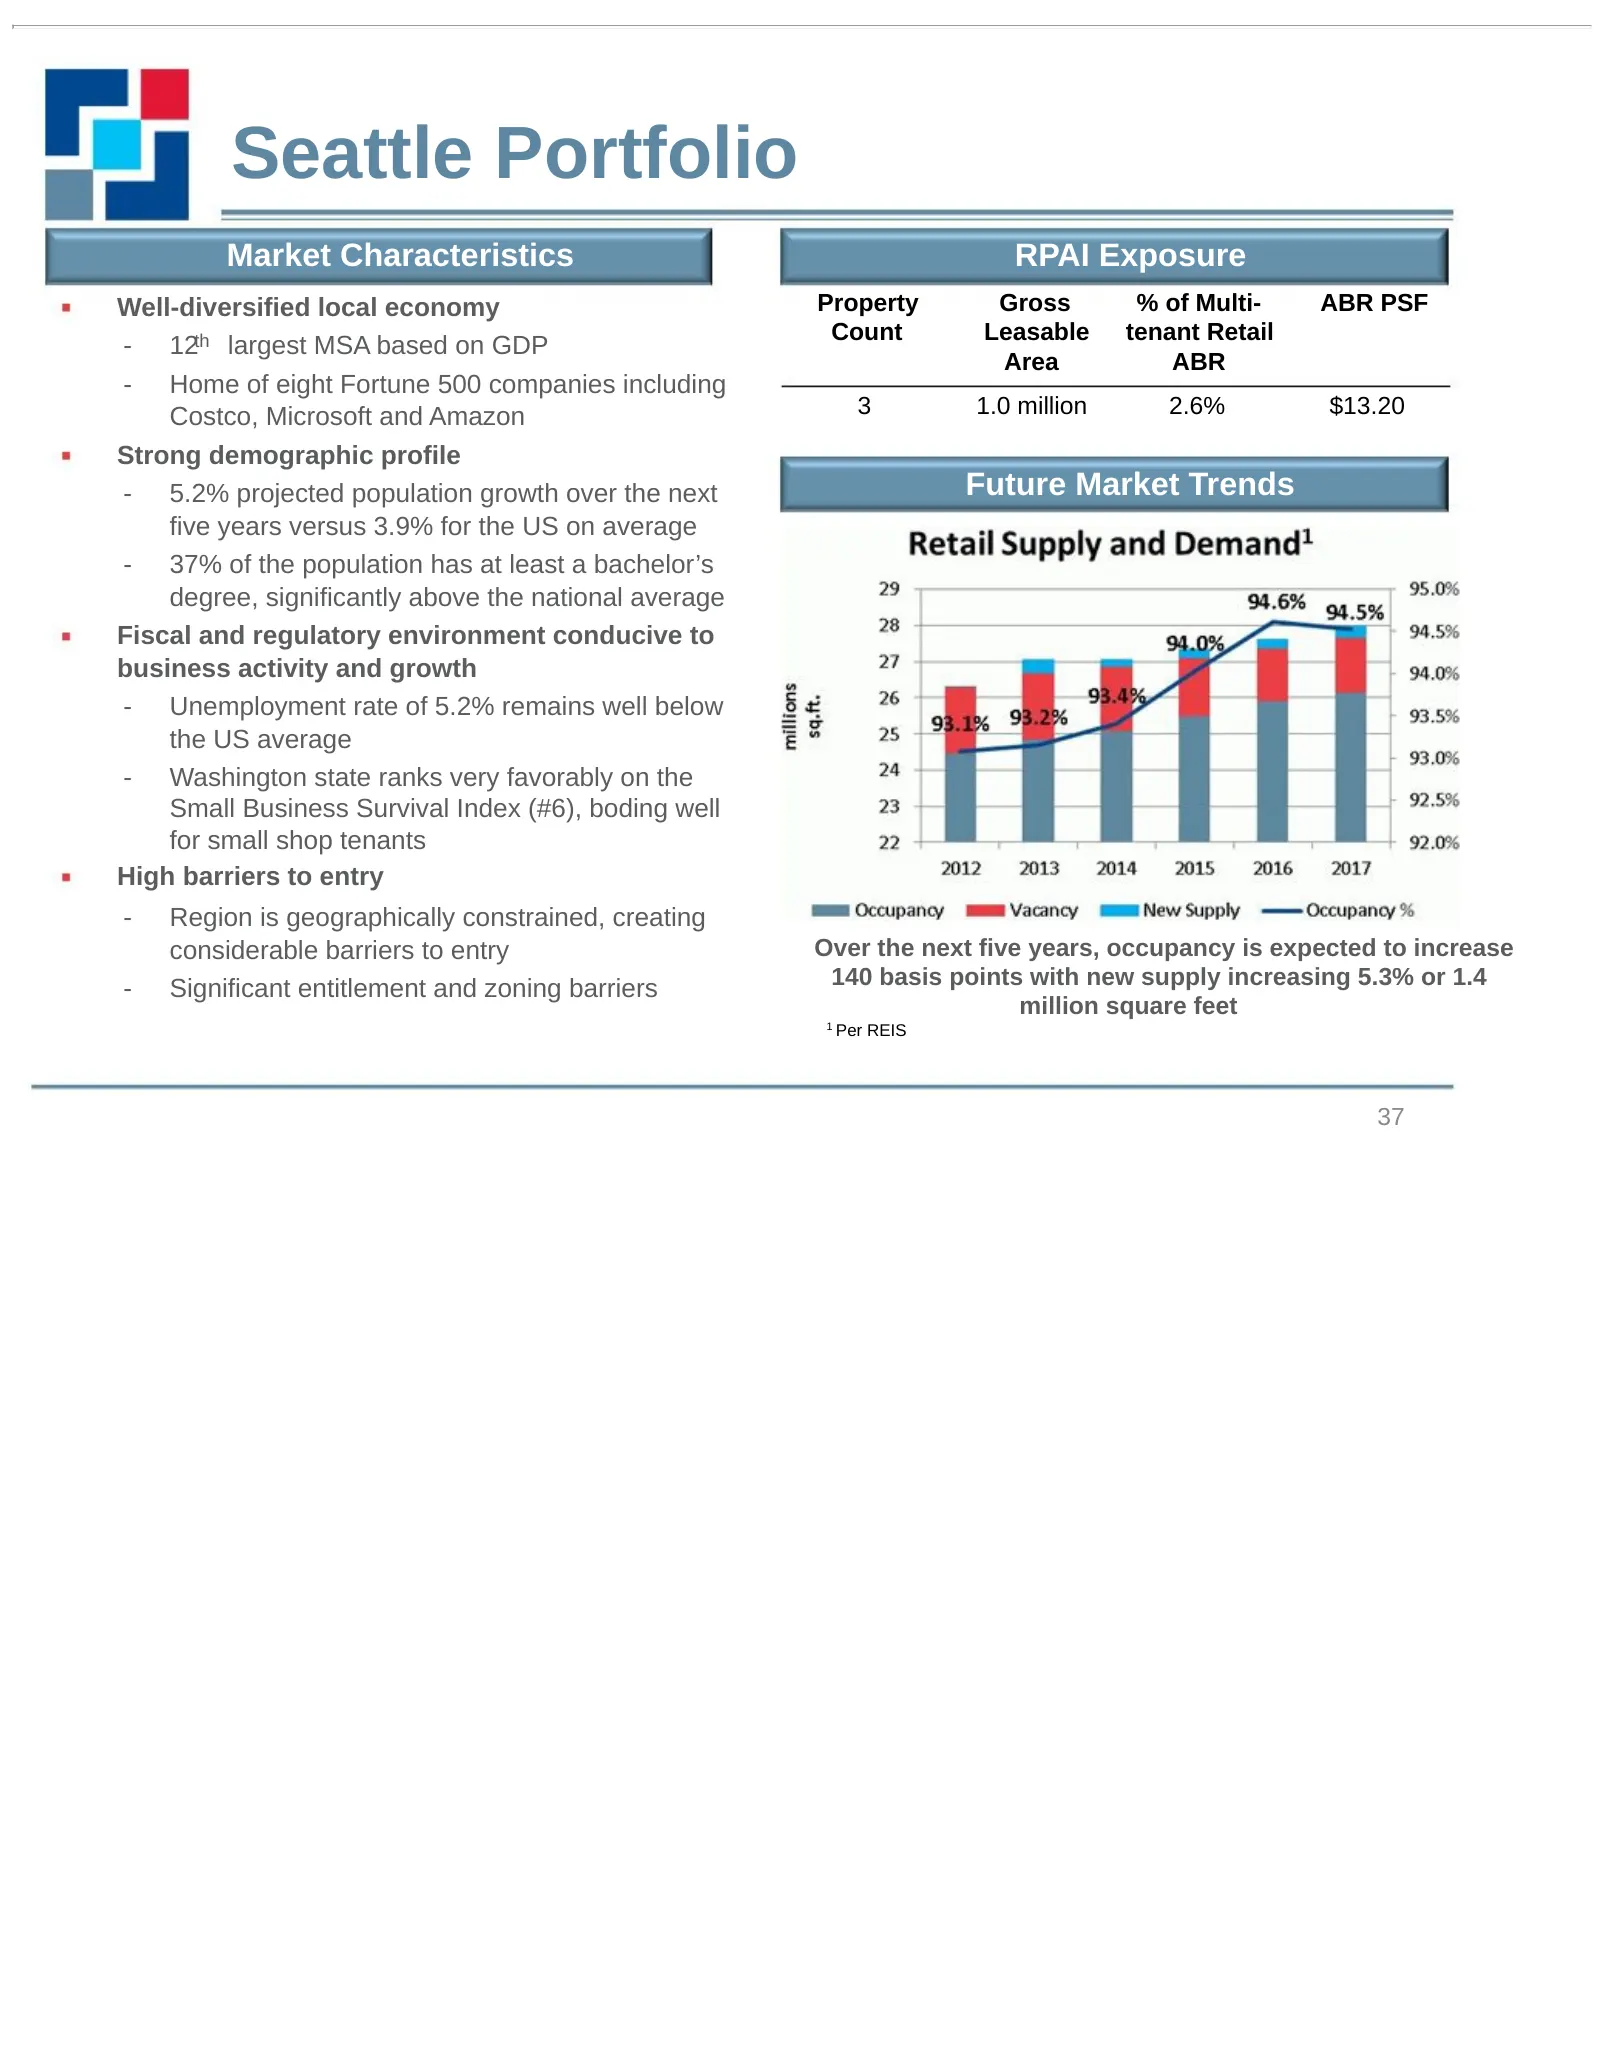
Seattle Portfolio Market Characteristics RPAI Exposure Well-diversified local economy Property Gross % of Multi- ABR PSF Count Leasable tenant Retail - 12th largest MSA based on GDP Area ABR - Home of eight Fortune 500 companies including Costco, Microsoft and Amazon 3 1.0 million 2.6% $13.20 Strong
Slide 38: Northgate North
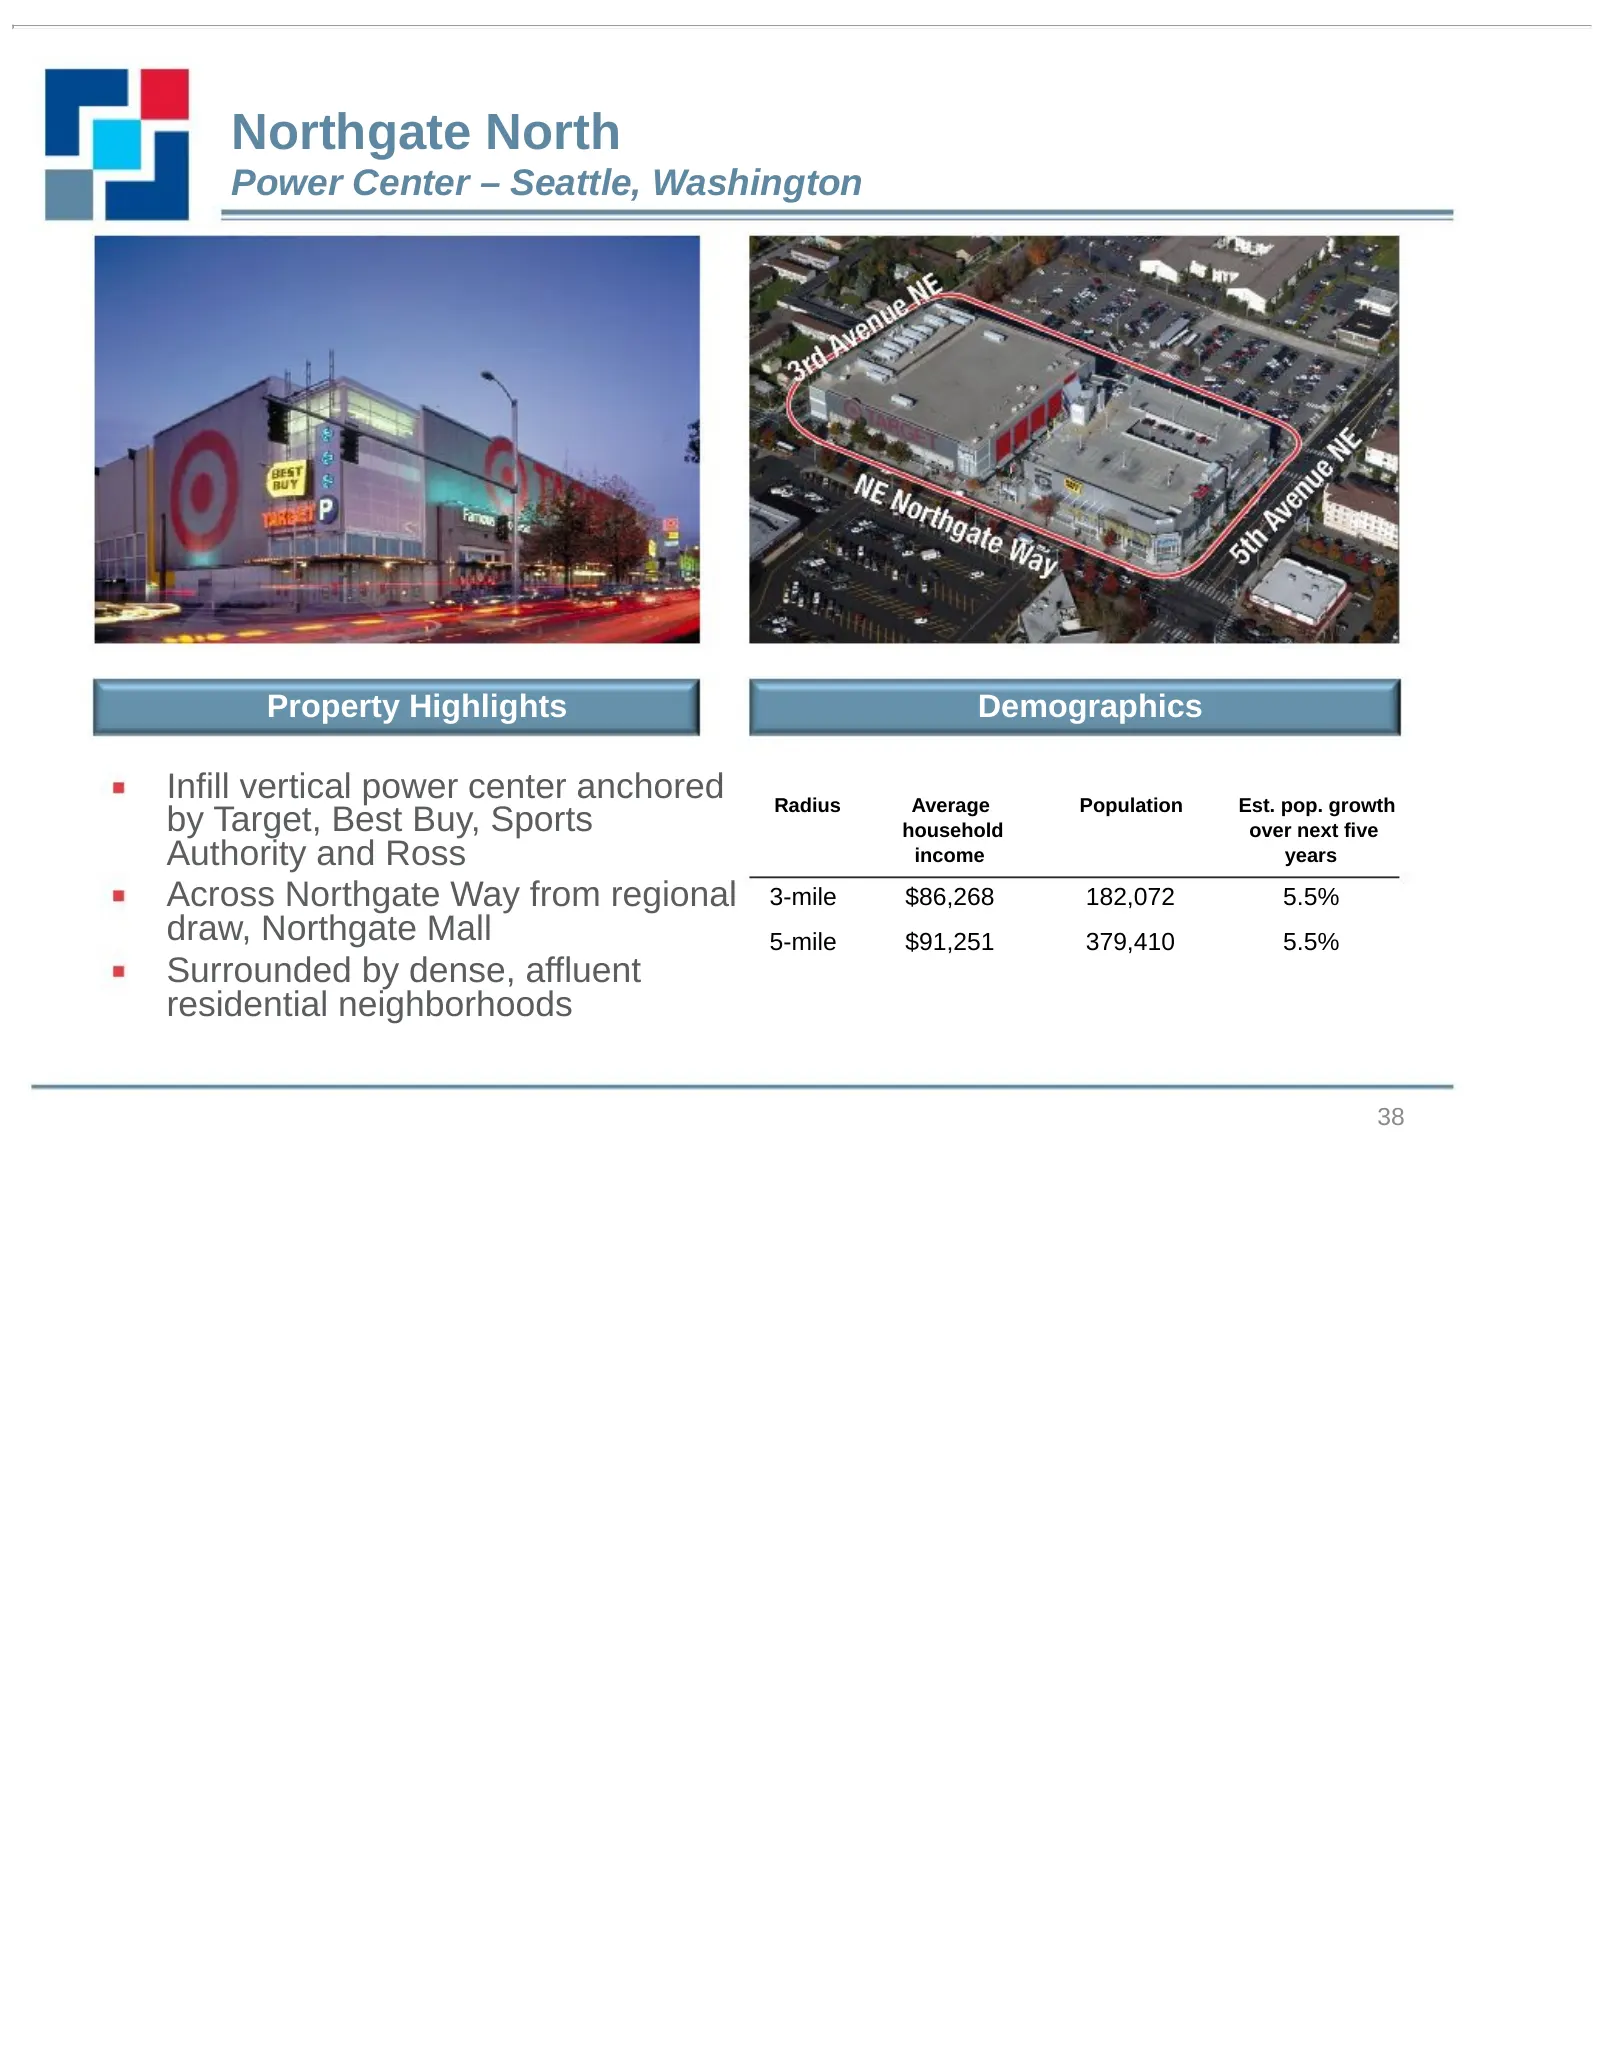
Northgate North Power Center – Seattle, Washington Property Highlights Demographics Infill vertical power center anchored Radius Average Population Est. pop. growth by Target, Best Buy, Sports household over next five Authority and Ross income years Across Northgate Way from regional 3-mile $86,268
Slide 39: Northgate North Site Plan
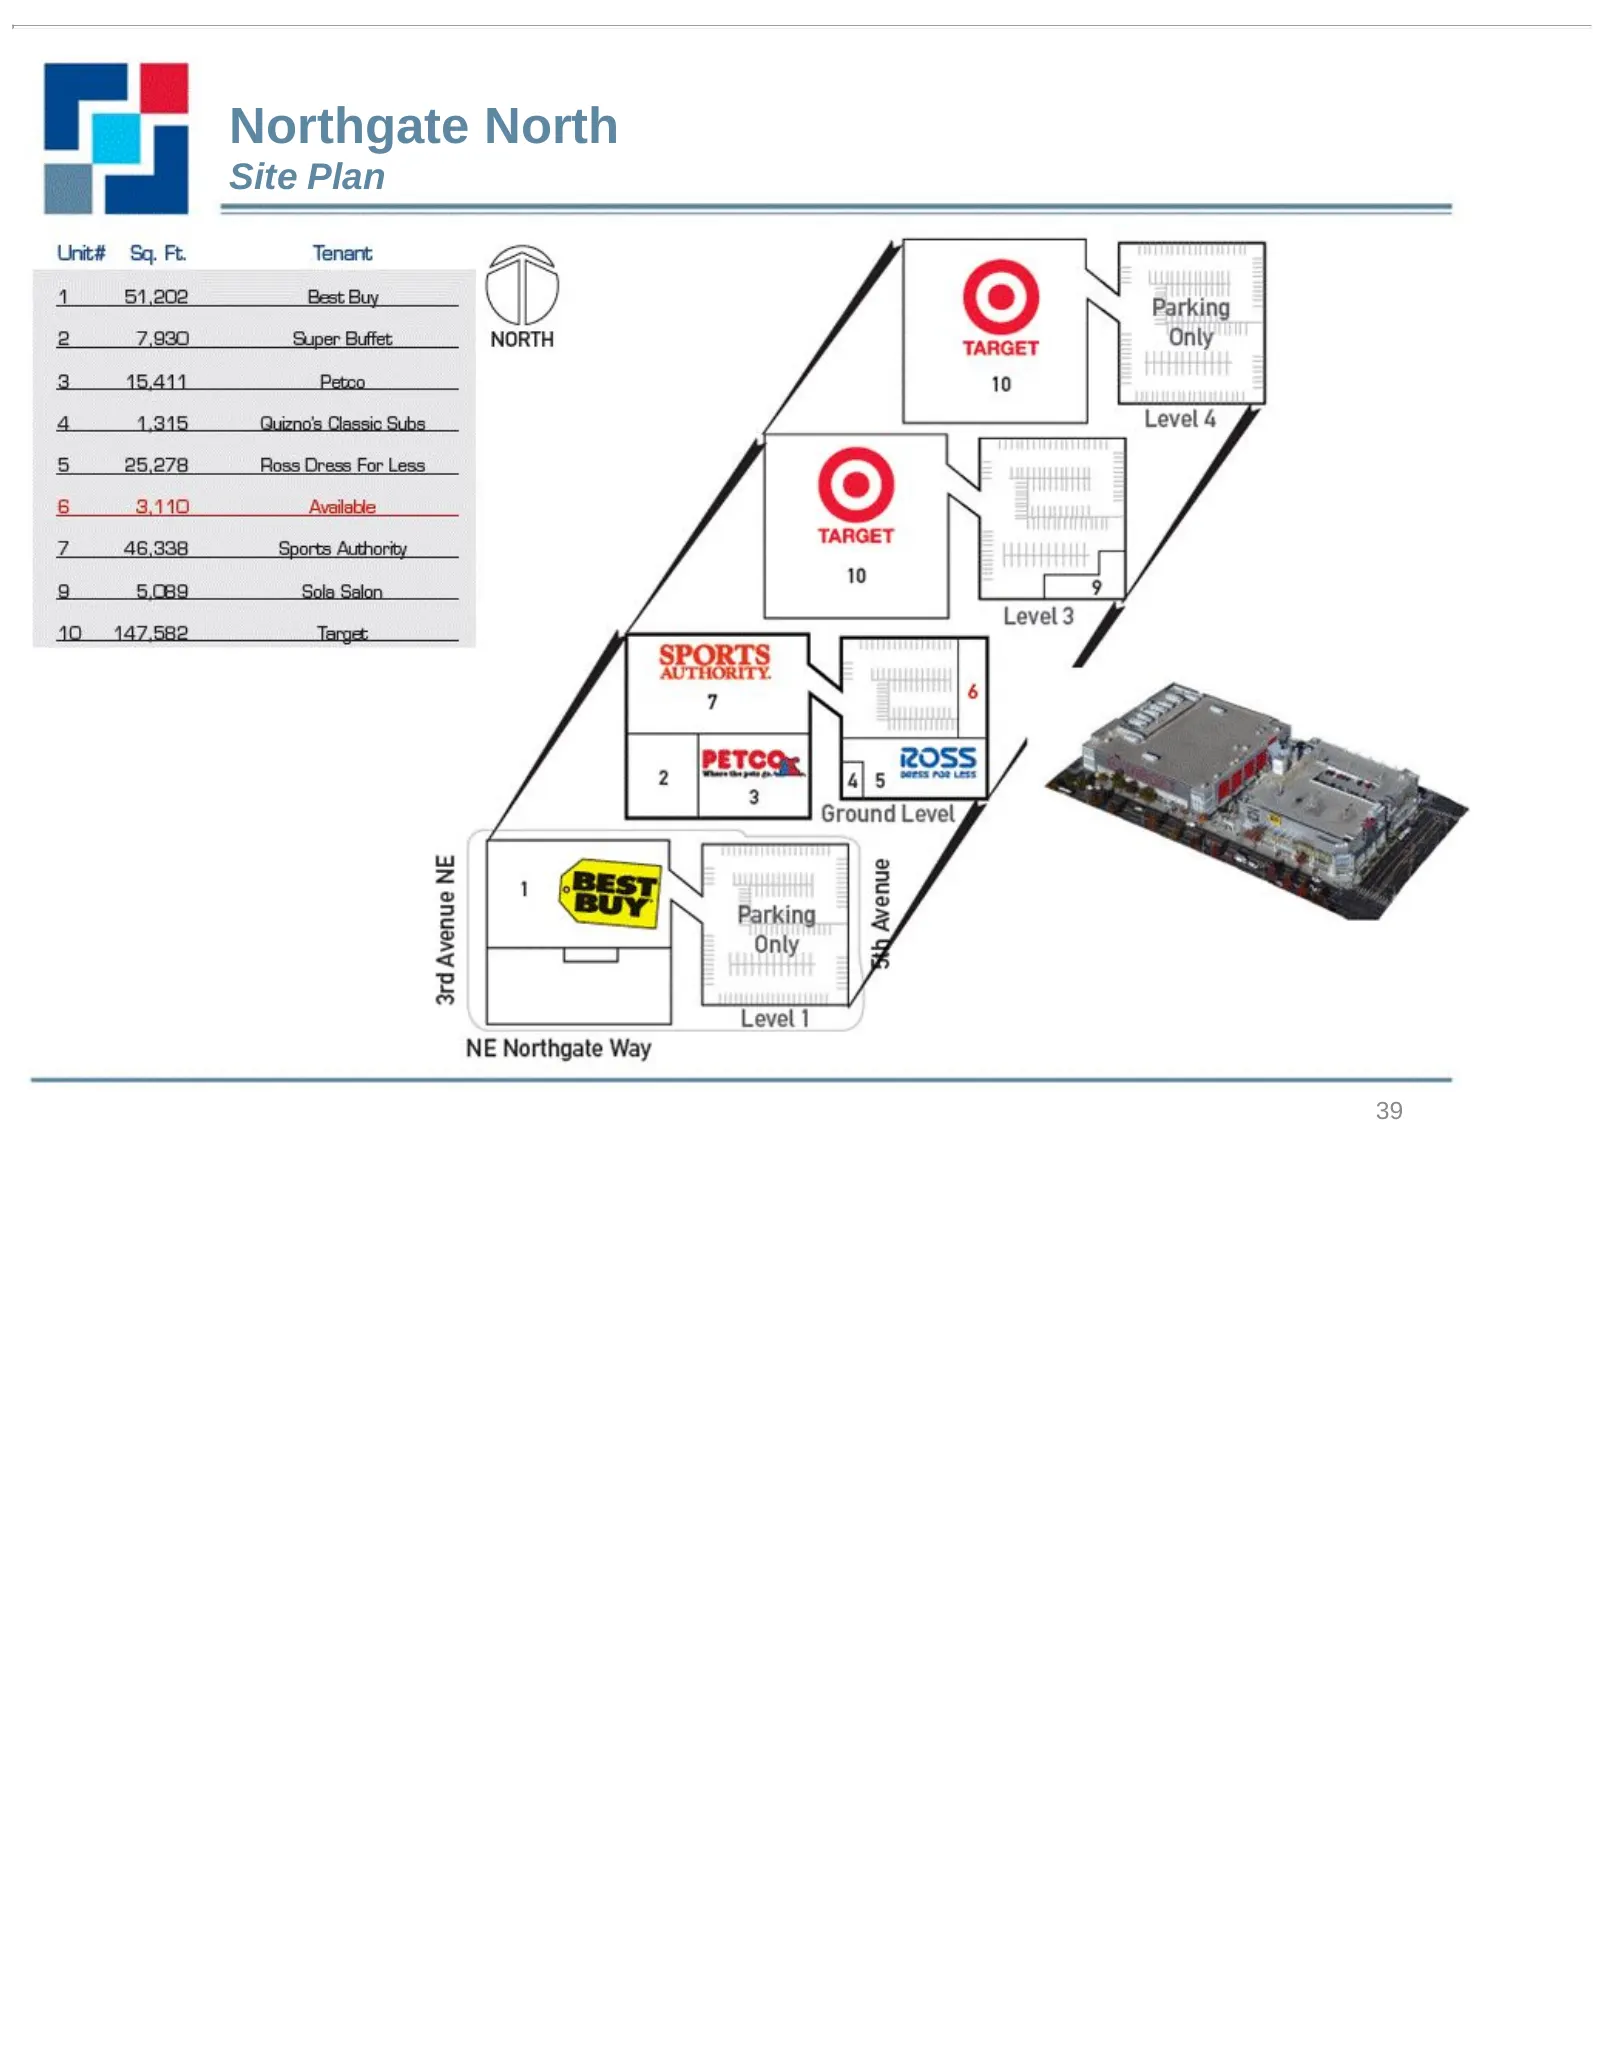
Ler Northgate North Site Plan Unit# Sq. Ft. Tenant LY \ 4 51,202 Best Buy q D) © Parking NORTH TARGET Only 2 15.411 Petno 10 Level 4 5 25,278 Ross Dress For Less 8 3.110 Available © Z 46,338 Sports Authority i 10 Bo ag So Salon 40 _147,582 Target. \ é N 2OSS /4] 5 senronis Ground Level Ww 2 e\| 3 iH
Slide 40: Phoenix Portfolio
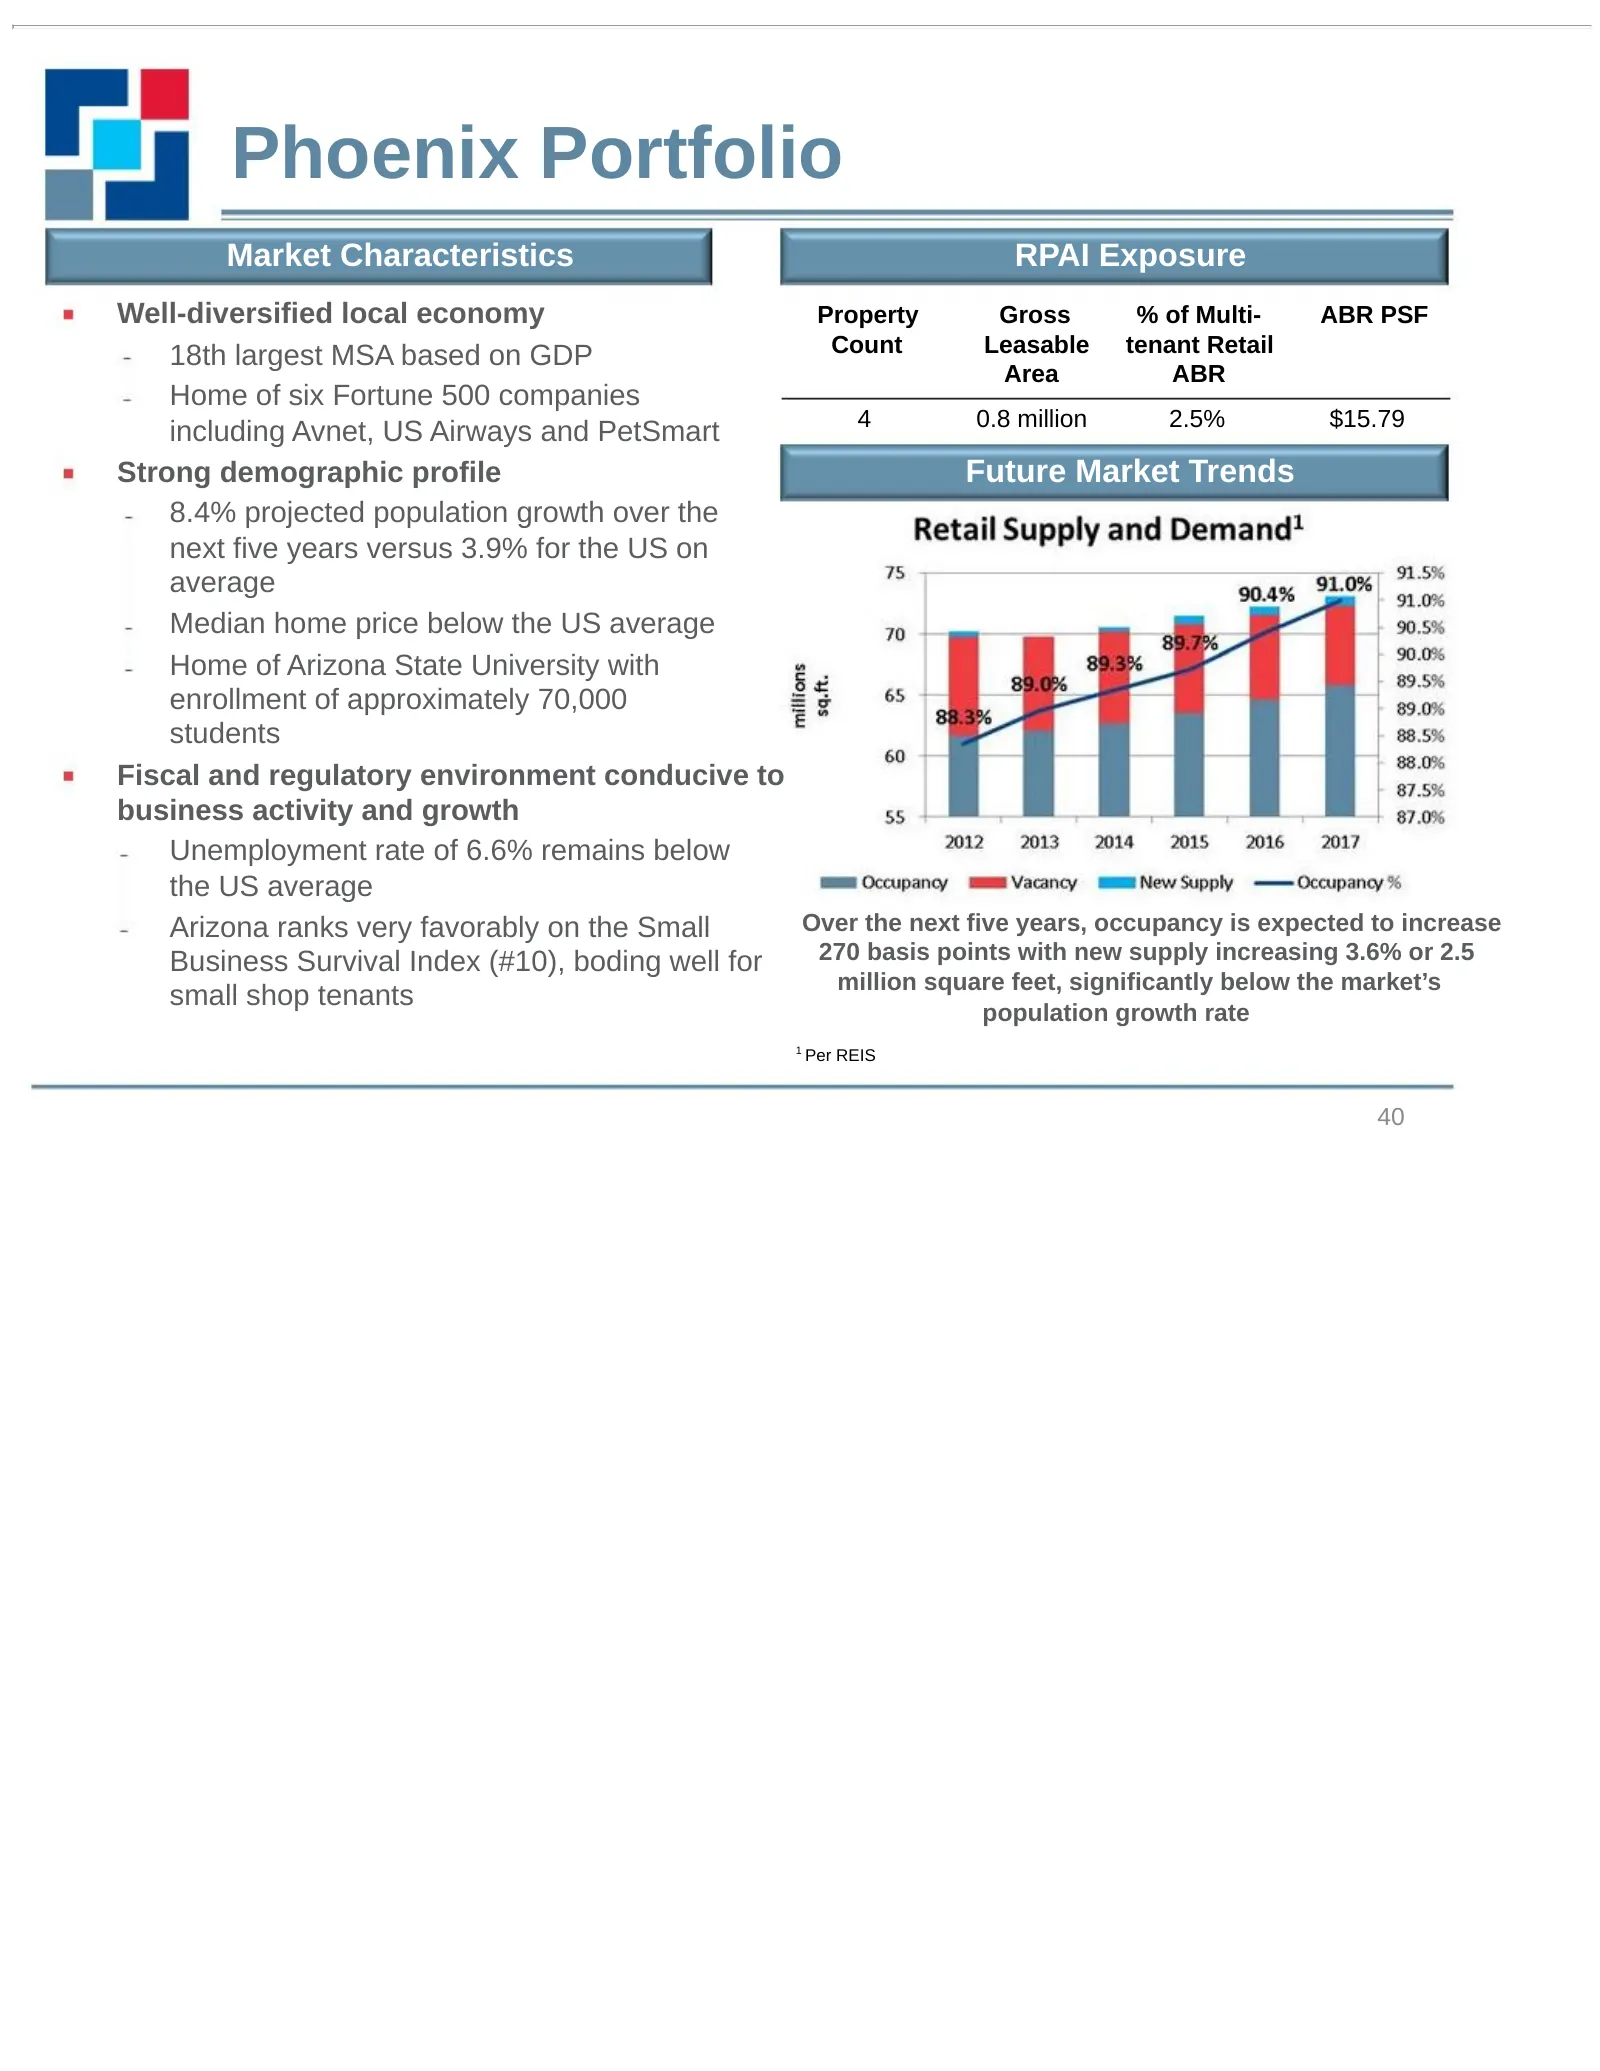
Phoenix Portfolio Market Characteristics RPAI Exposure Well-diversified local economy Property Gross % of Multi- ABR PSF 18th largest MSA based on GDP Count Leasable tenant Retail Area ABR Home of six Fortune 500 companies 4 0.8 million 2.5% $15.79 including Avnet, US Airways and PetSmart Strong dem
Slide 41: Paradise Valley Marketplace
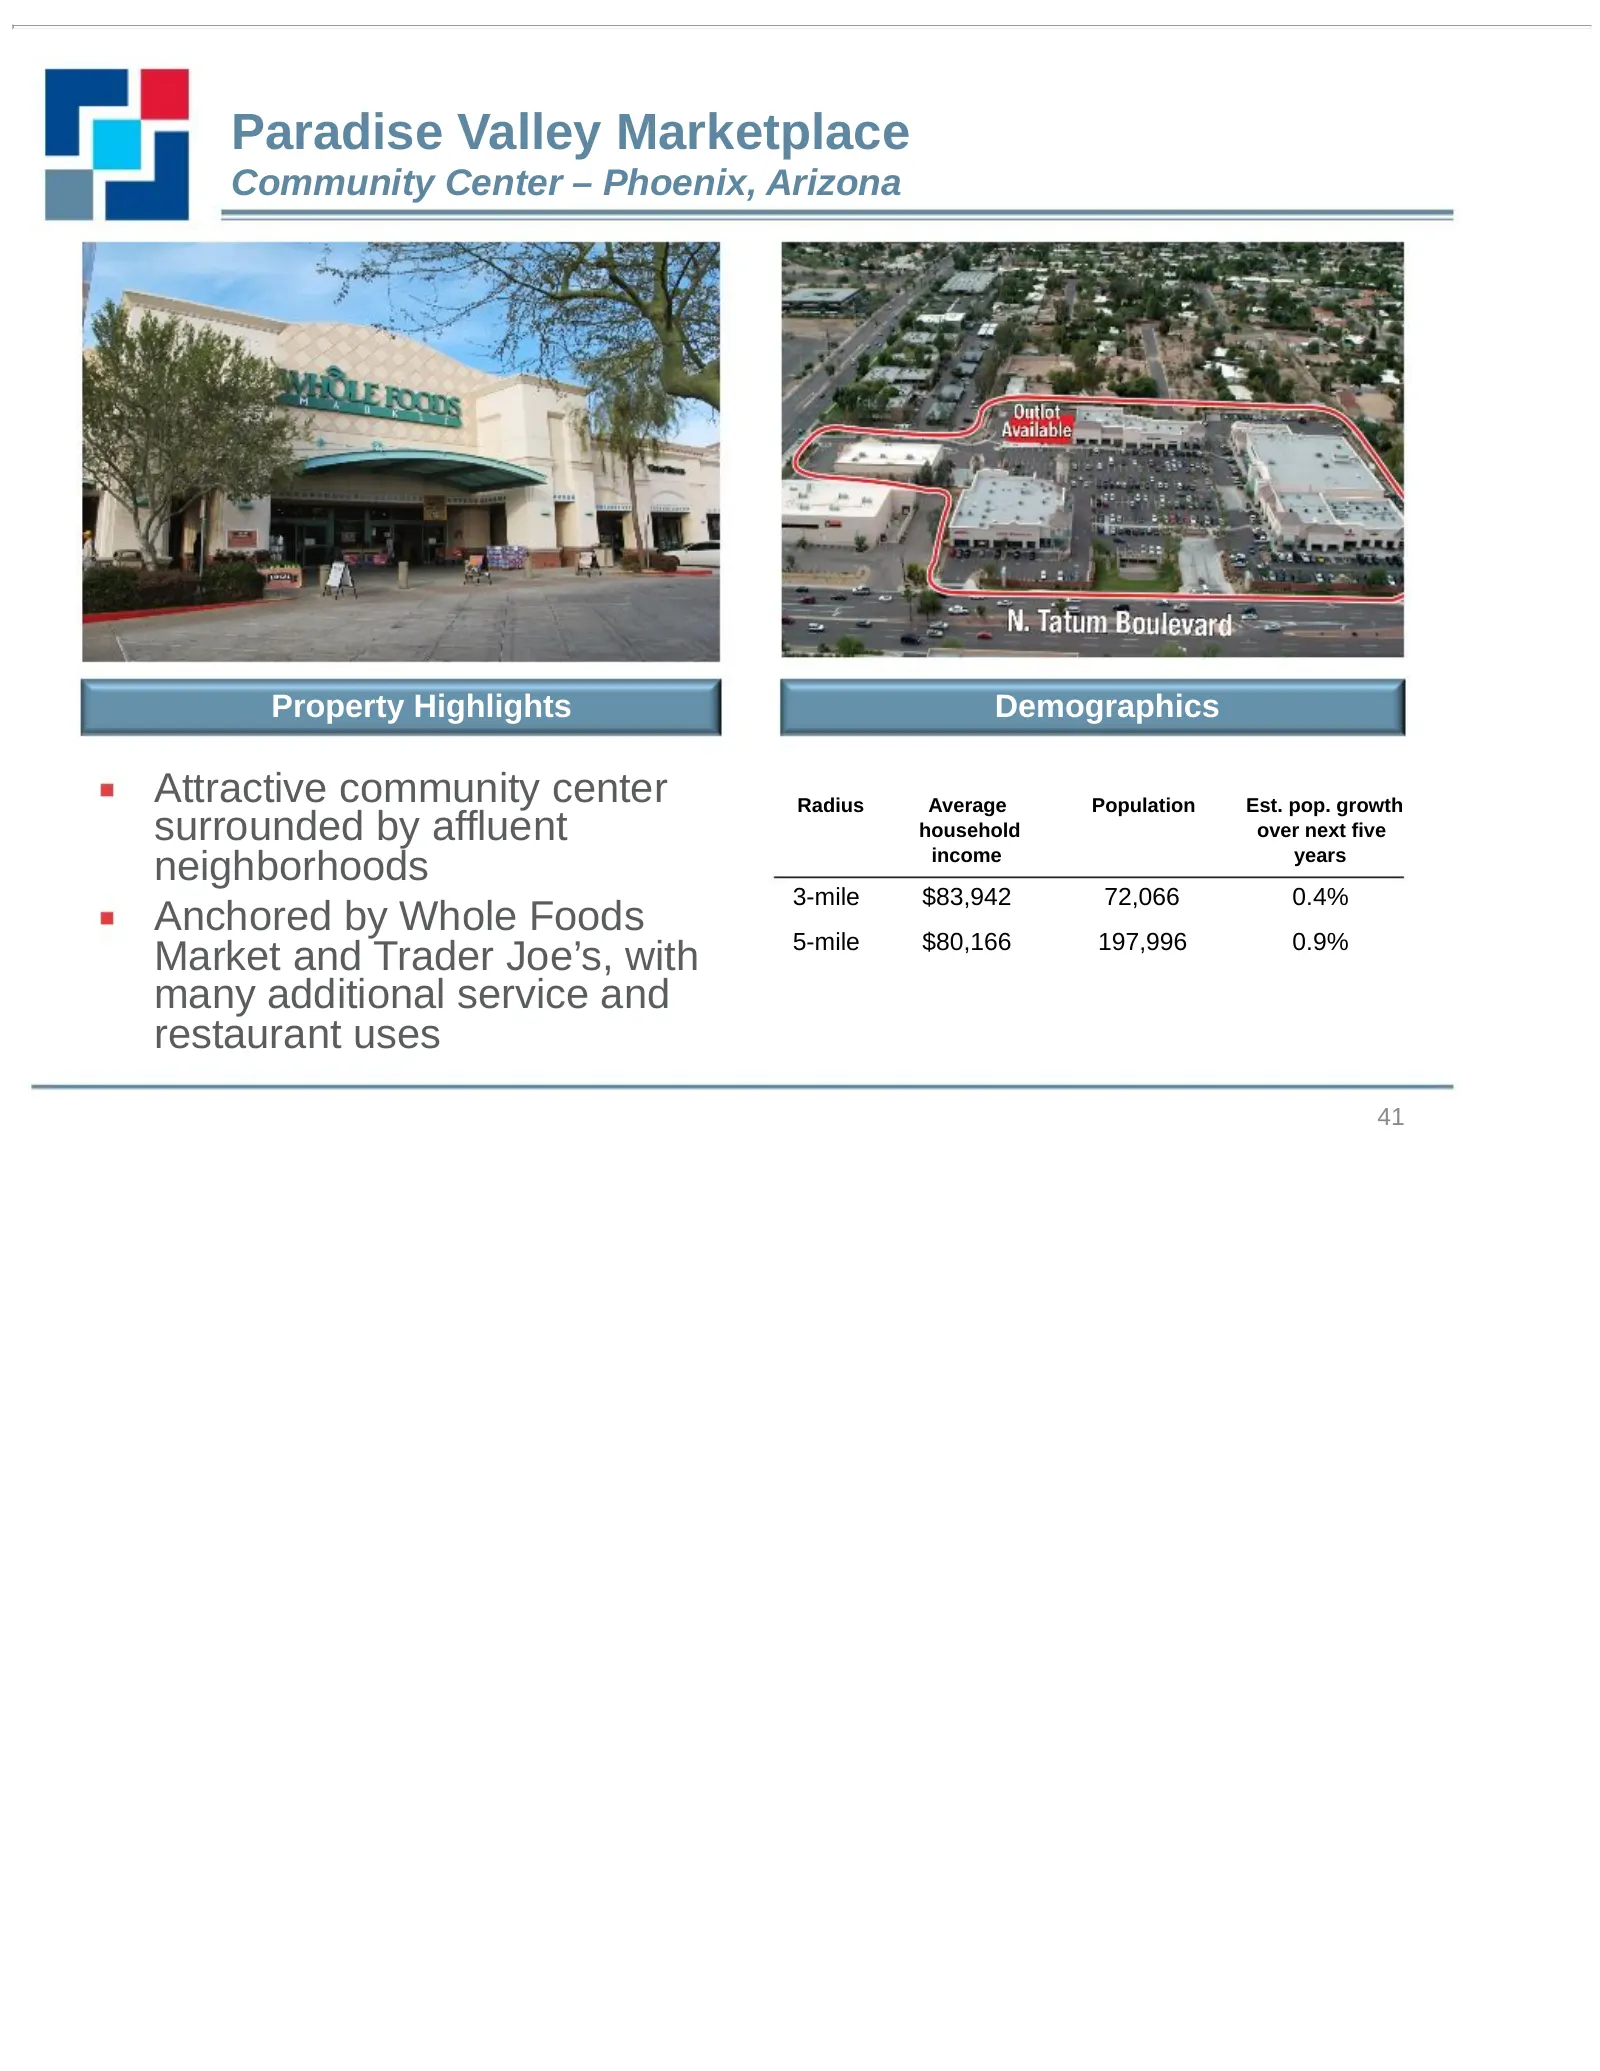
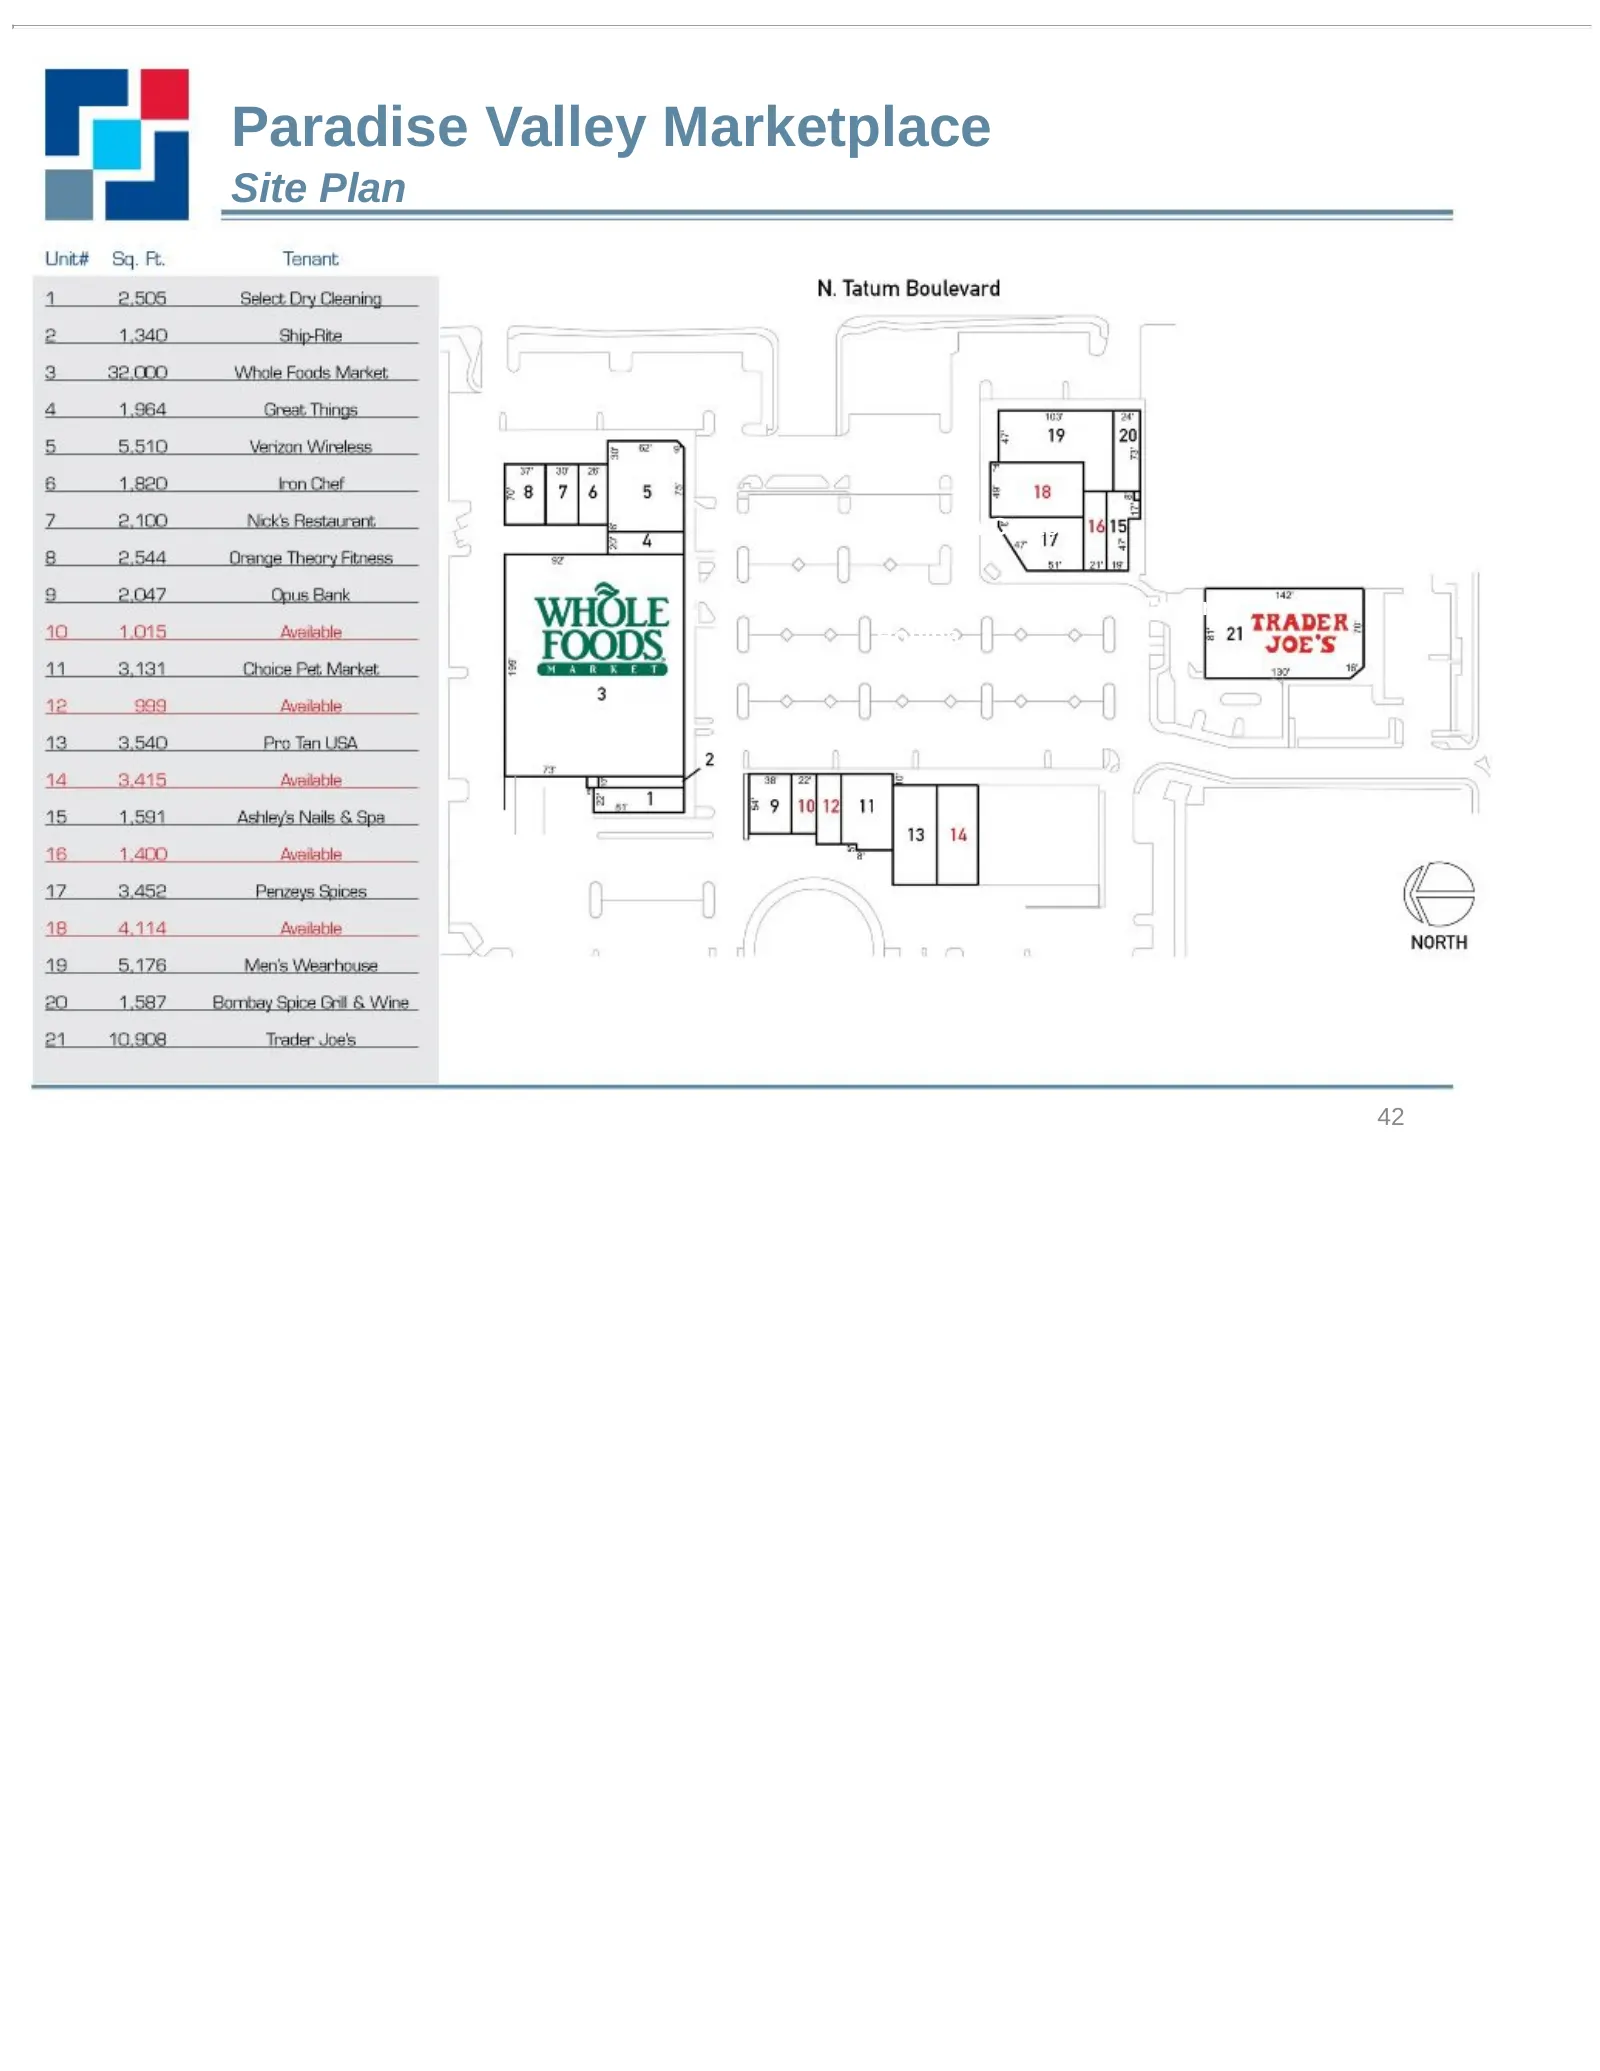
Paradise Valley Marketplace Community Center – Phoenix, Arizona Property Highlights Demographics Attractive community center Radius Average Population Est. pop. growth surrounded by affluent household over next five neighborhoods income years 3-mile $83,942 72,066 0.4% Anchored by Whole Foods 5-mile
Slide 42: Paradise Valley Marketplace Site Plan
Paradise Valley Marketplace Site Plan Southlake Town Center Paradise Shoppes of Warner Robins 42
Slide 43: Atlanta Portfolio
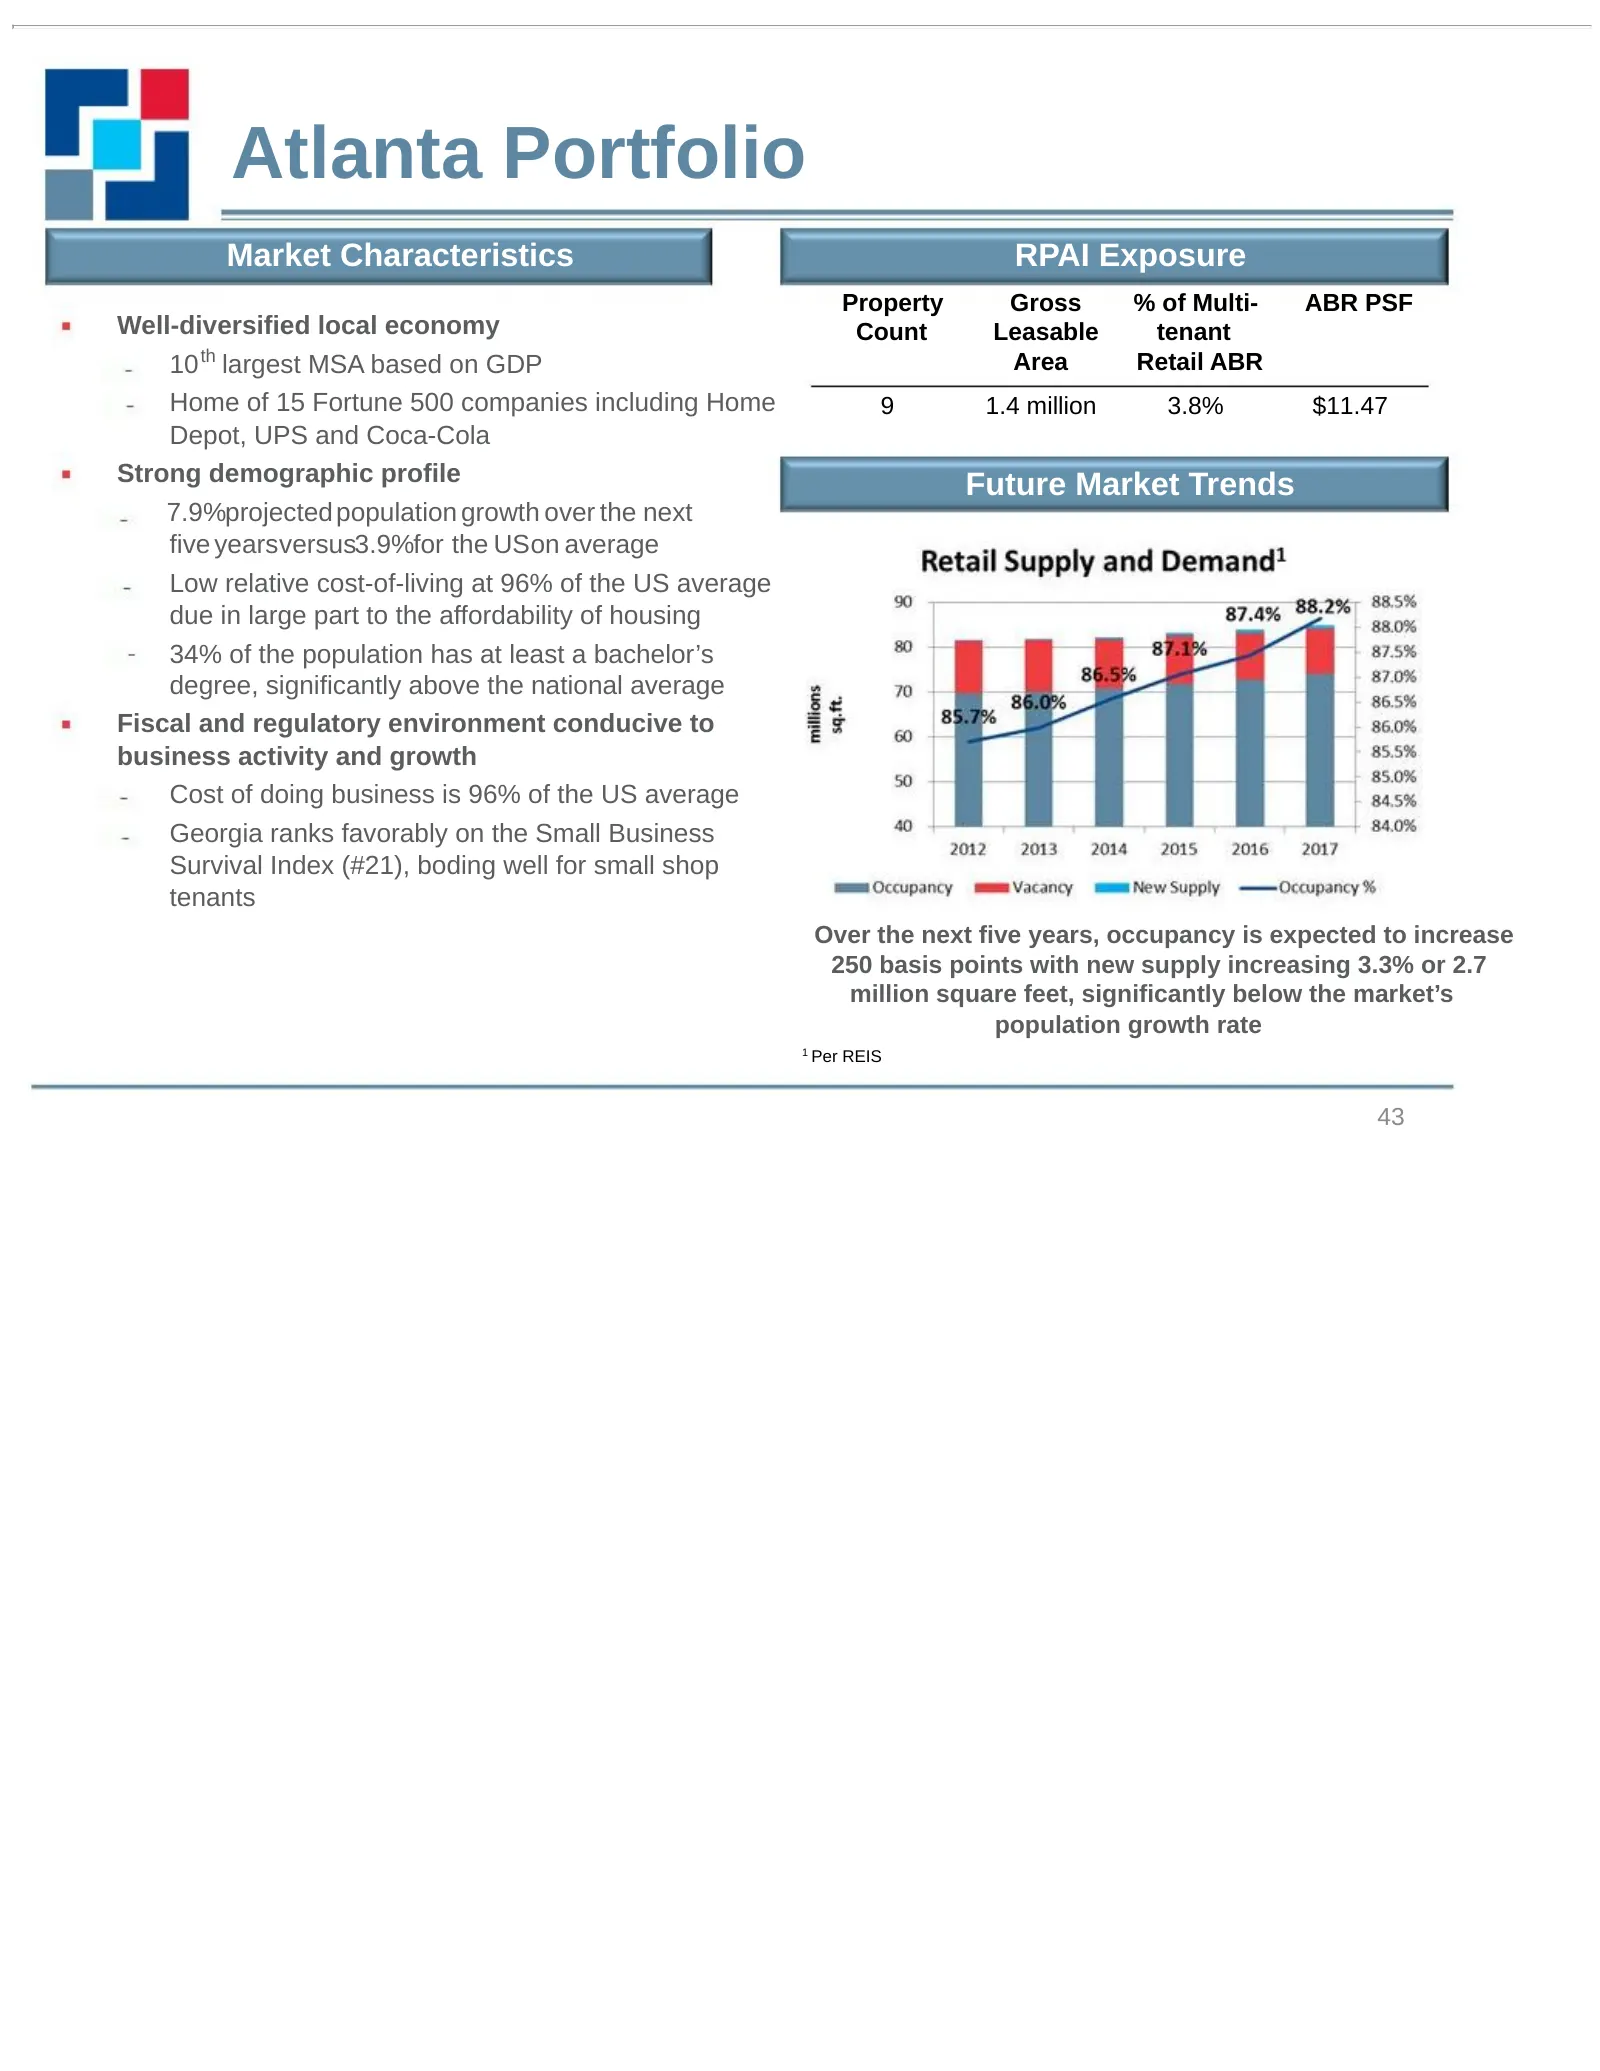
Atlanta Portfolio Market Characteristics RPAI Exposure Property Gross % of Multi- ABR PSF Well-diversified local economy Count Leasable tenant 10 th largest MSA based on GDP Area Retail ABR Home of 15 Fortune 500 companies including Home 9 1.4 million 3.8% $11.47 Depot, UPS and Coca-Cola Strong demo
Slide 44: Henry Town Center
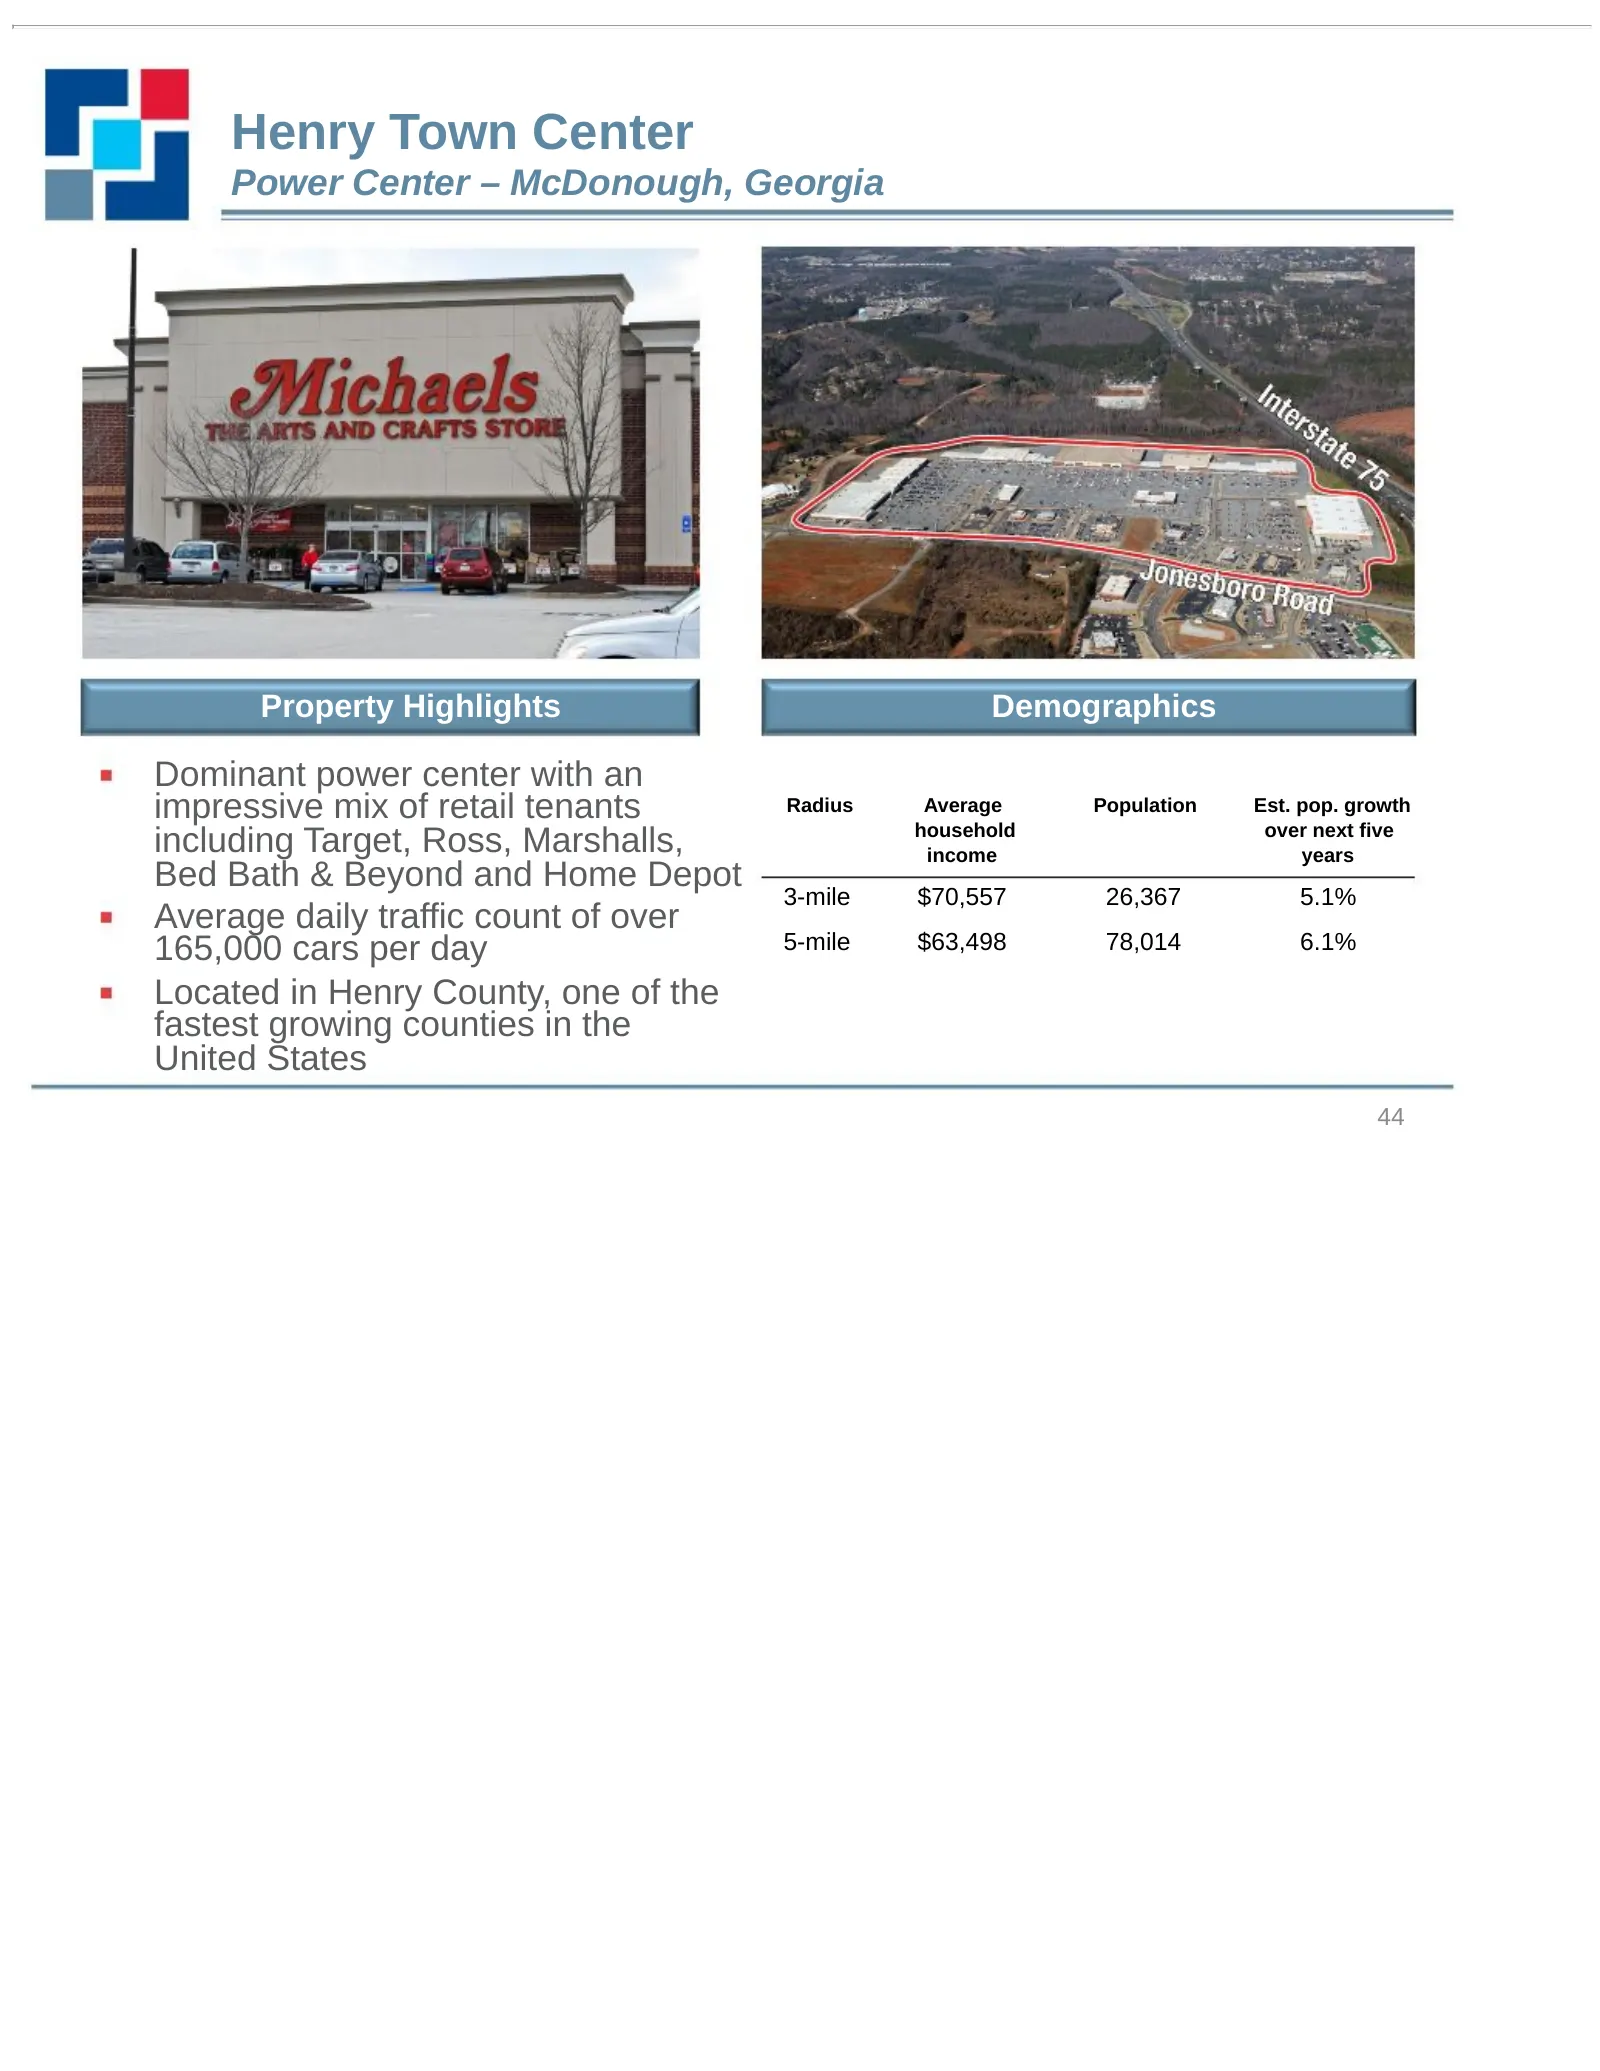
Henry Town Center Power Center – McDonough, Georgia Property Highlights Demographics Dominant power center with an impressive mix of retail tenants Radius Average Population Est. pop. growth household over next five including Target, Ross, Marshalls, income years Bed Bath & Beyond and Home Depot 3-m
Slide 45: Henry Town Center Site Plan
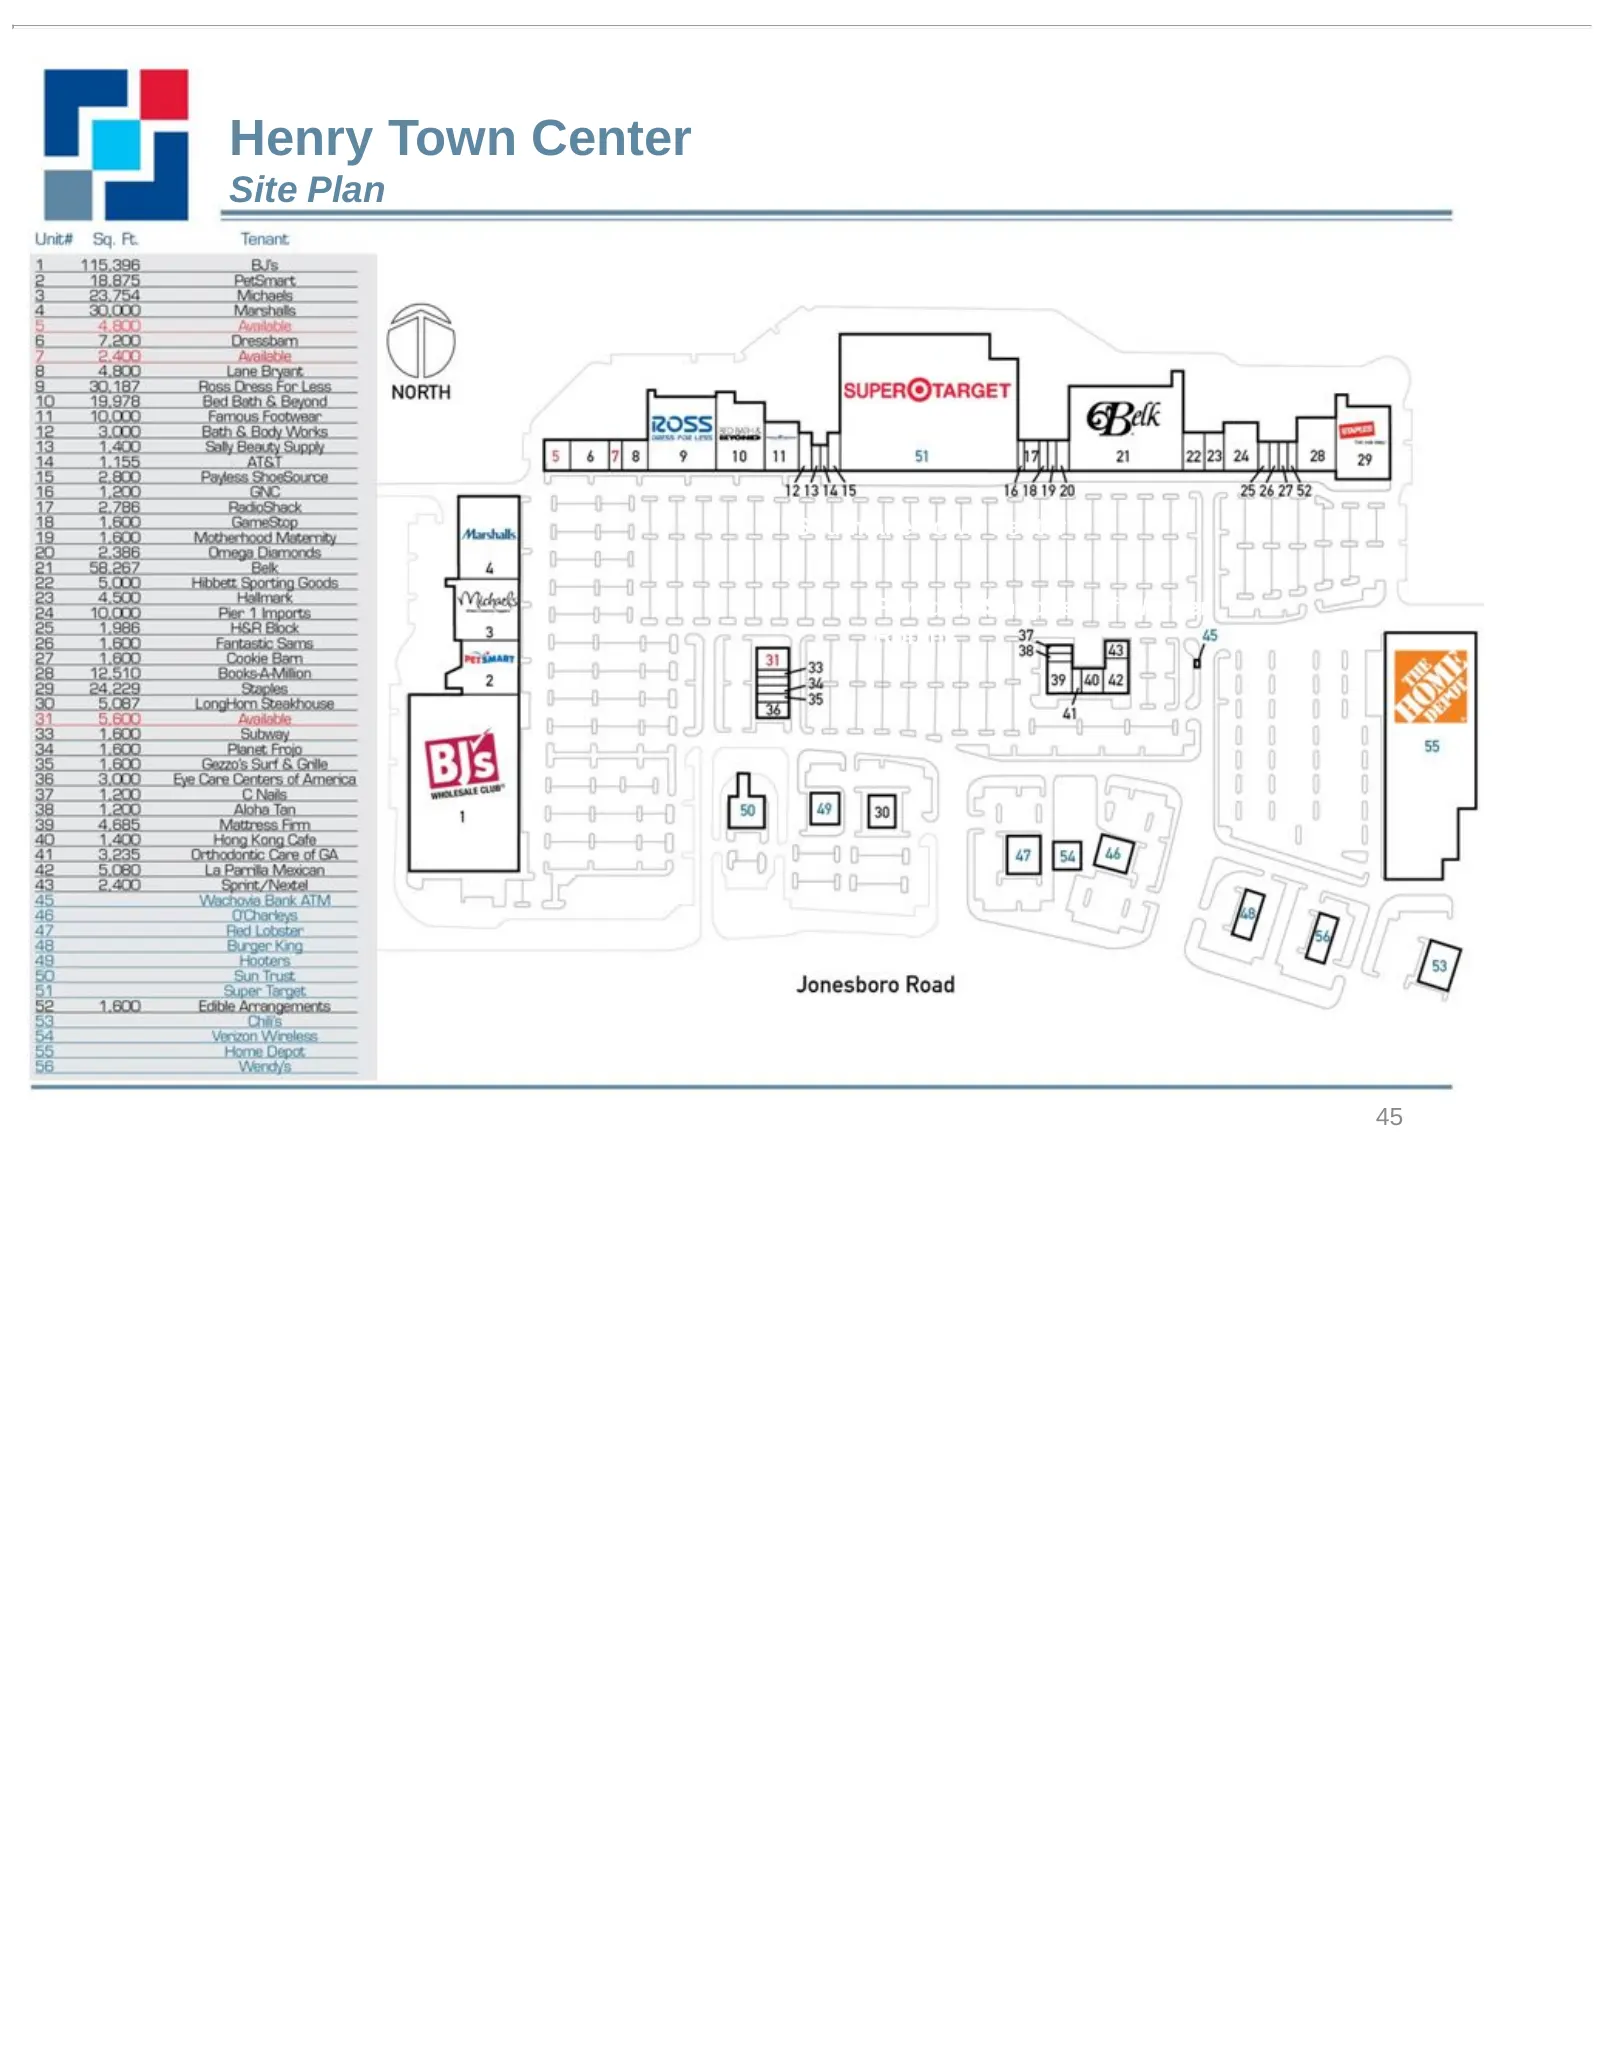
Henry Town Center Site Plan Southlake Town Center Paradise Shoppes of Warner Robins 45
Slide 46: Baltimore/Washington D.C. Portfolio
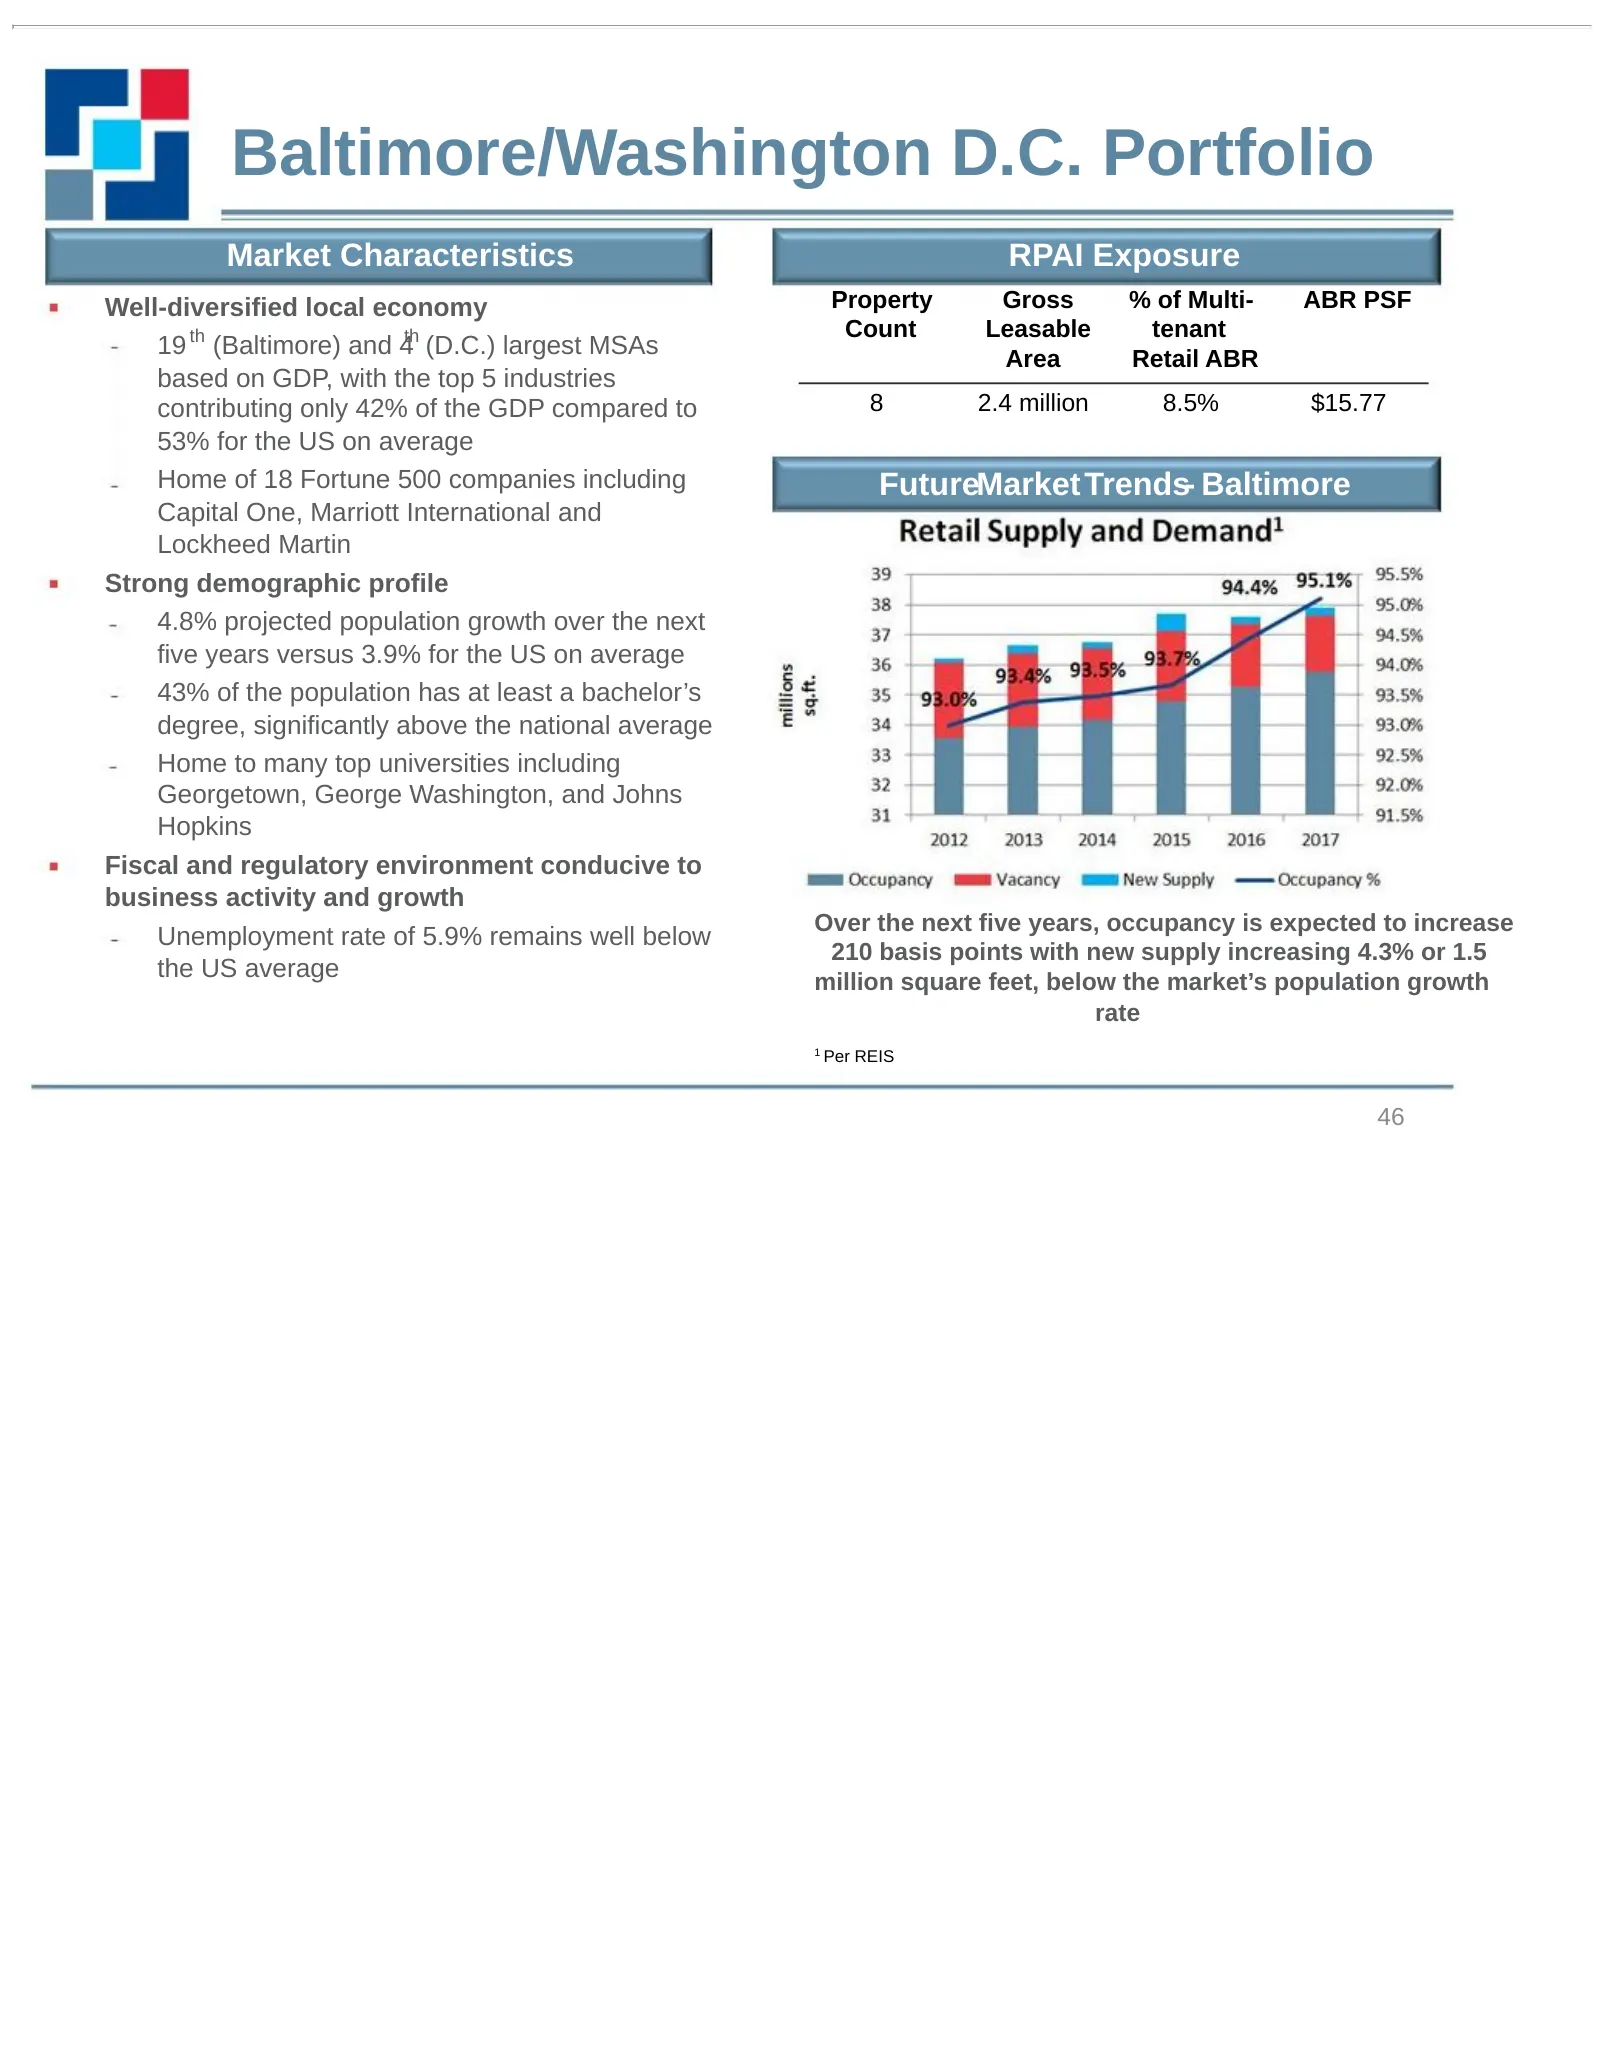
Baltimore/Washington D.C. Portfolio Market Characteristics RPAI Exposure Well-diversified local economy Property Gross % of Multi- ABR PSF Count Leasable tenant 19 th (Baltimore) and 4th (D.C.) largest MSAs Area Retail ABR based on GDP, with the top 5 industries contributing only 42% of the GDP comp
Slide 47: Gateway Village
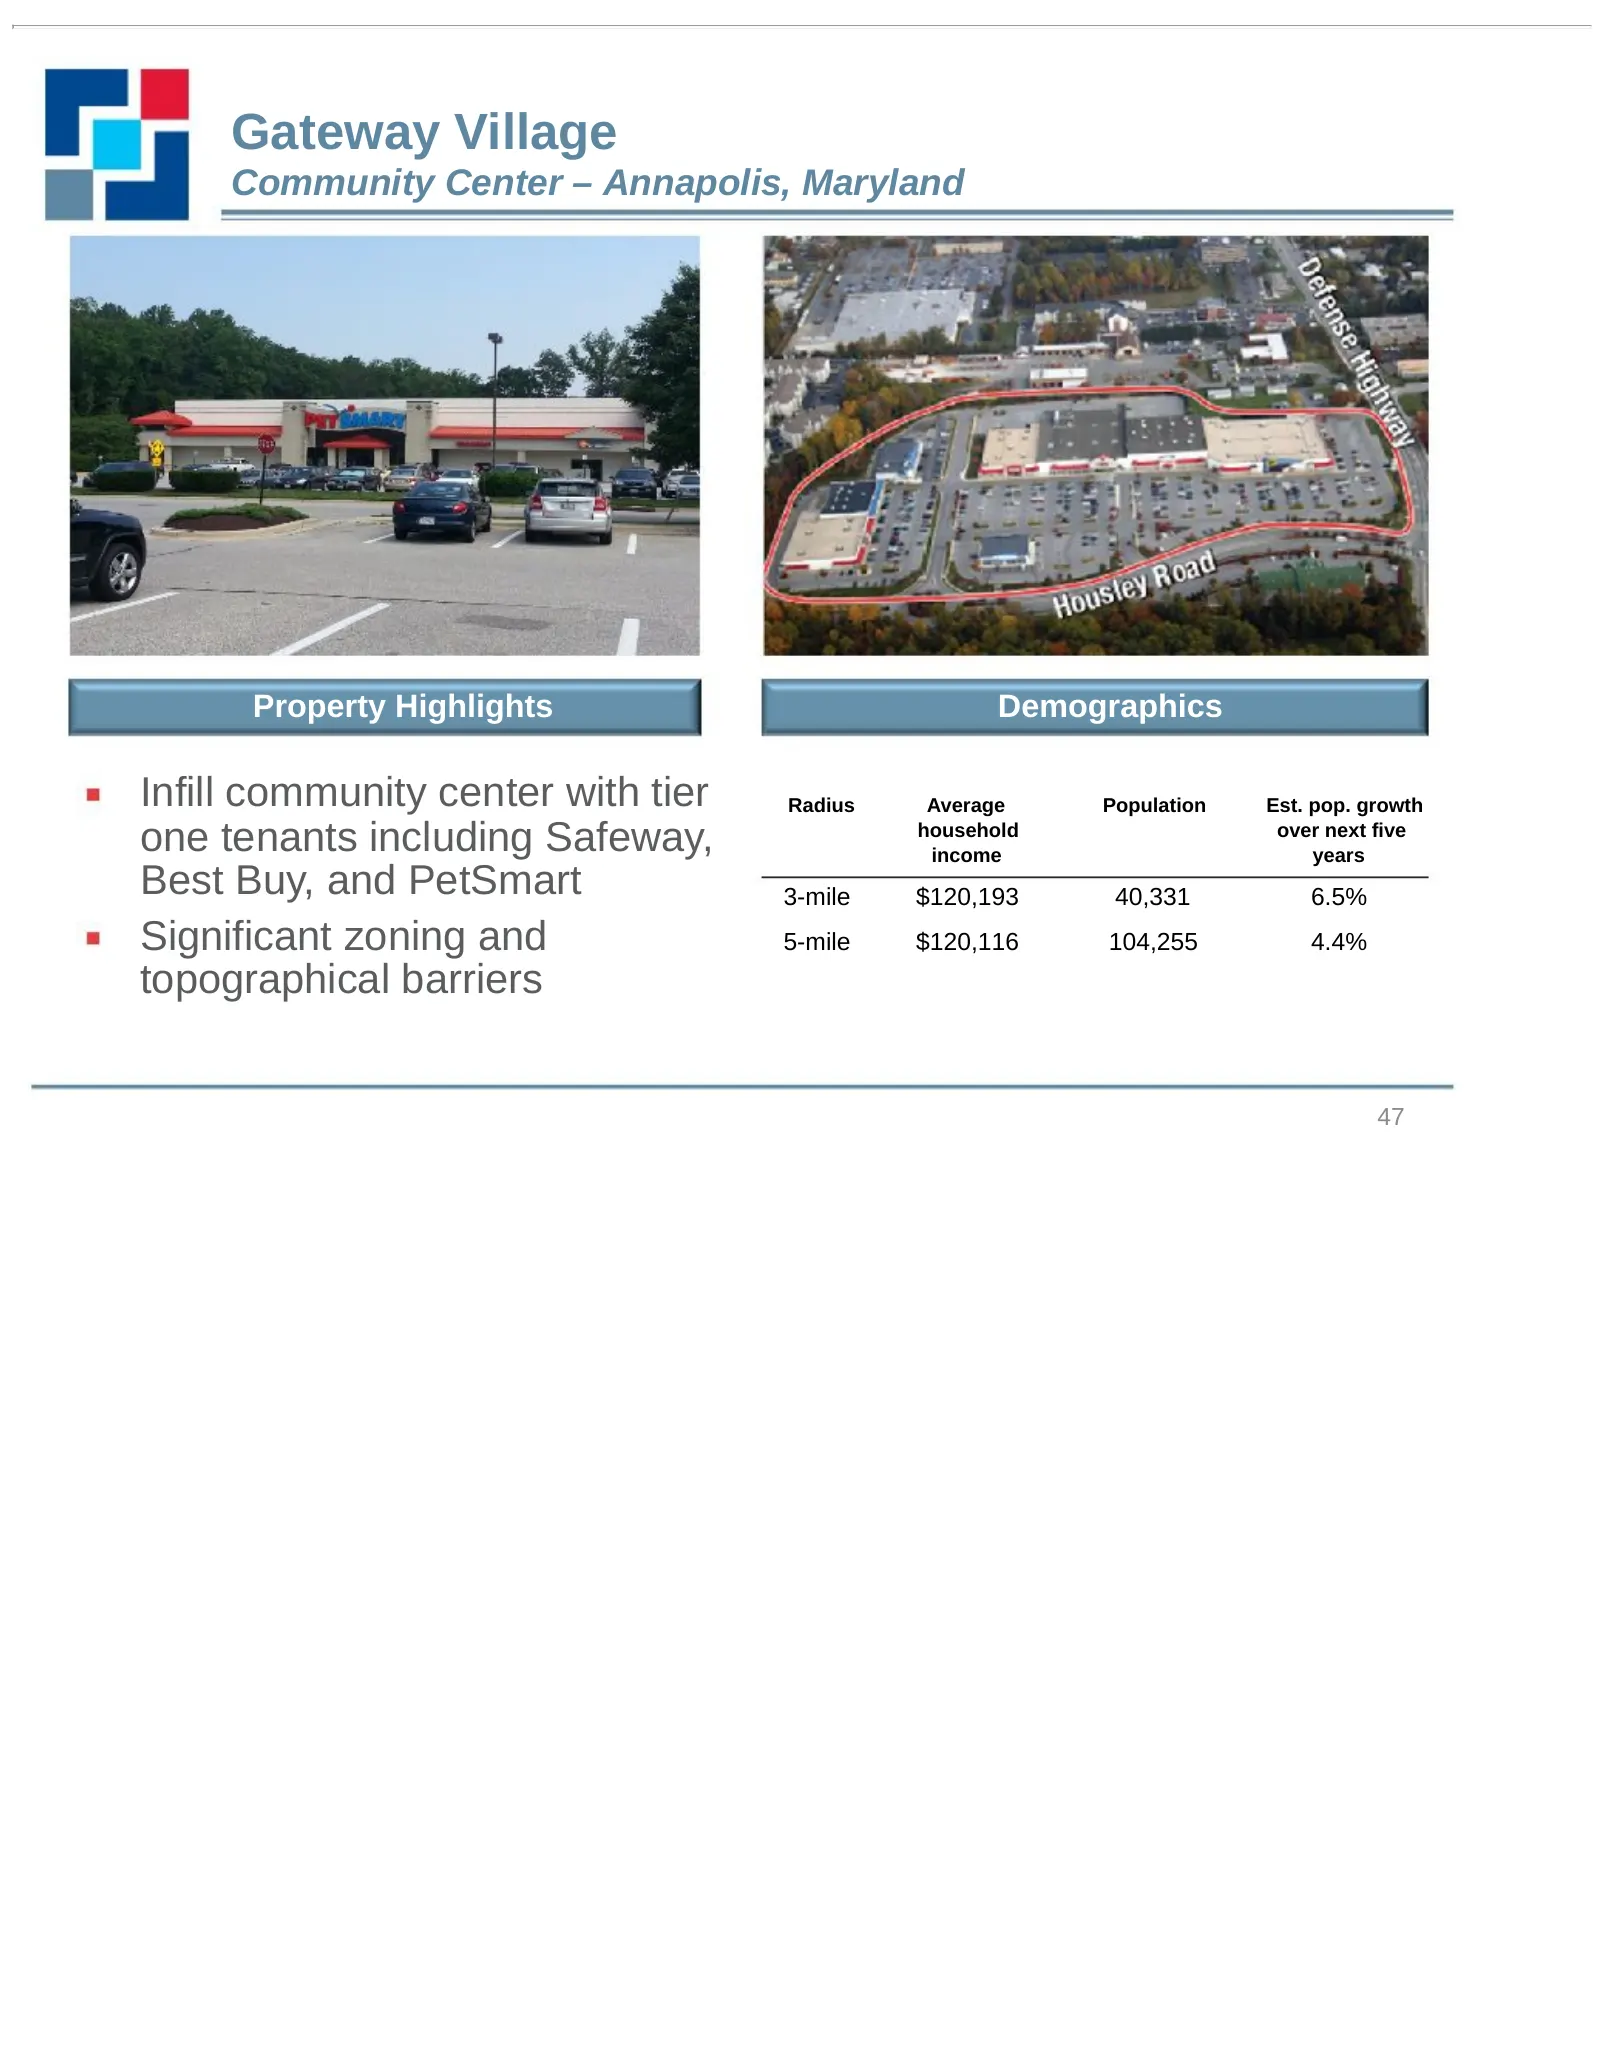
Gateway Village Community Center – Annapolis, Maryland Property Highlights Demographics Infill community center with tier Radius Average Population Est. pop. growth one tenants including Safeway, household income over next five years Best Buy, and PetSmart 3-mile $120,193 40,331 6.5% Significant zon
Slide 48: Gateway Village Site Plan
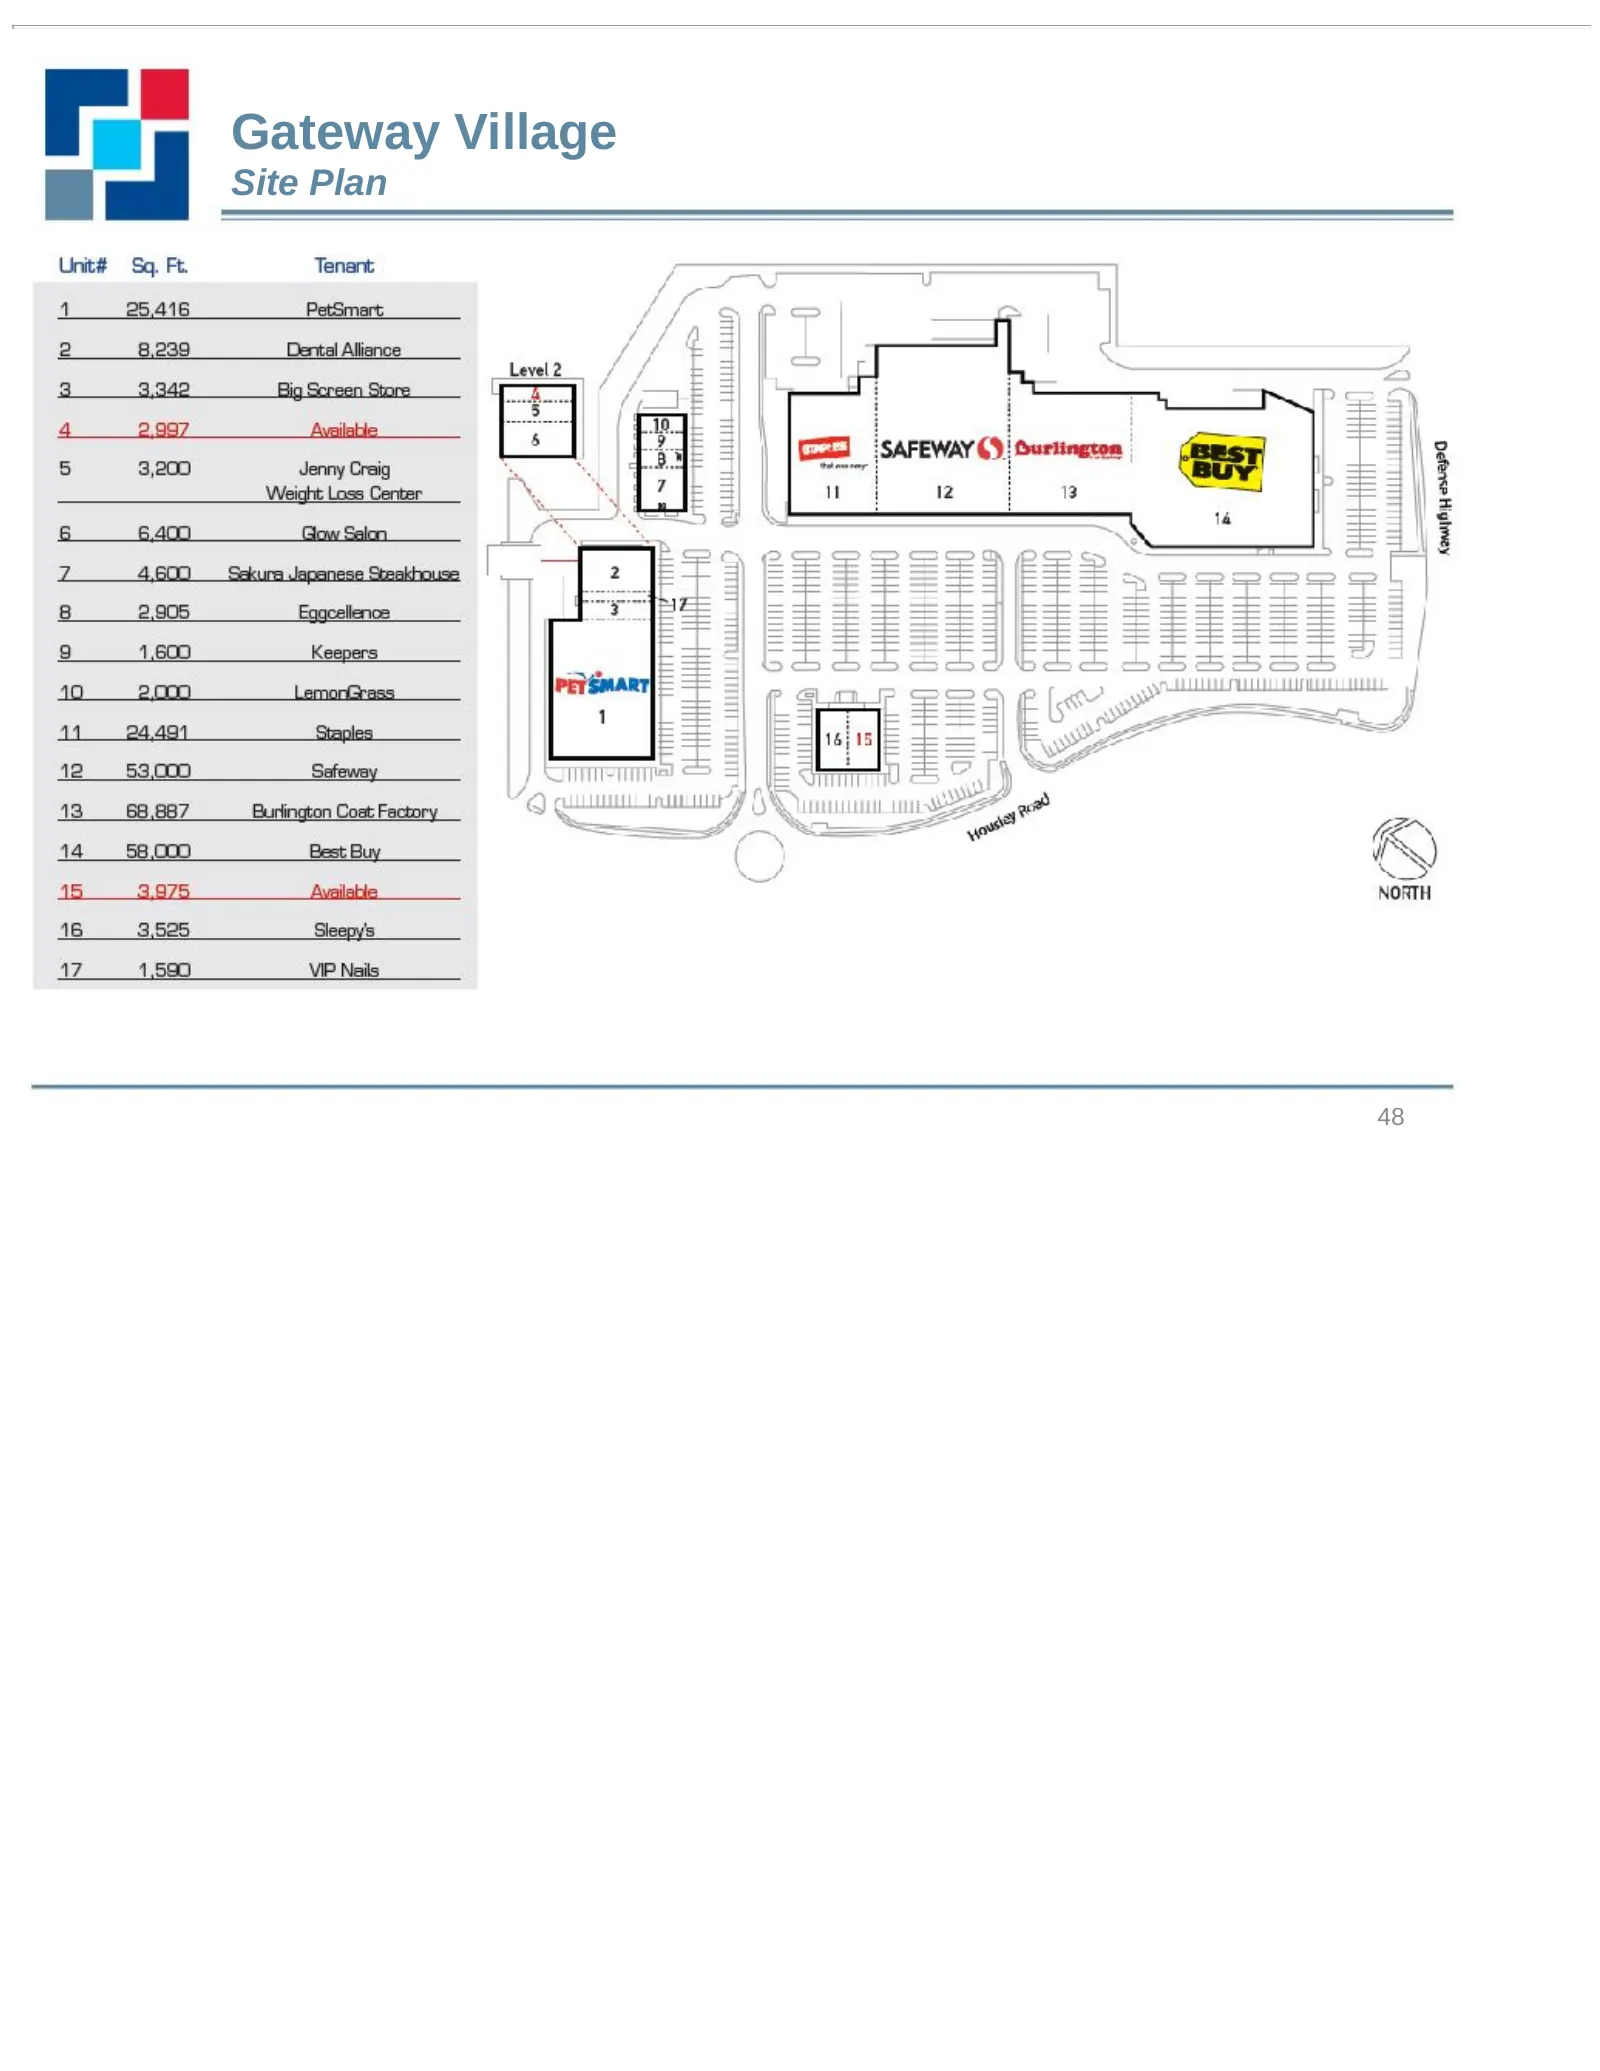
Site Plan Ler Gateway Village } NOMS 48
Slide 49: Chicago Portfolio
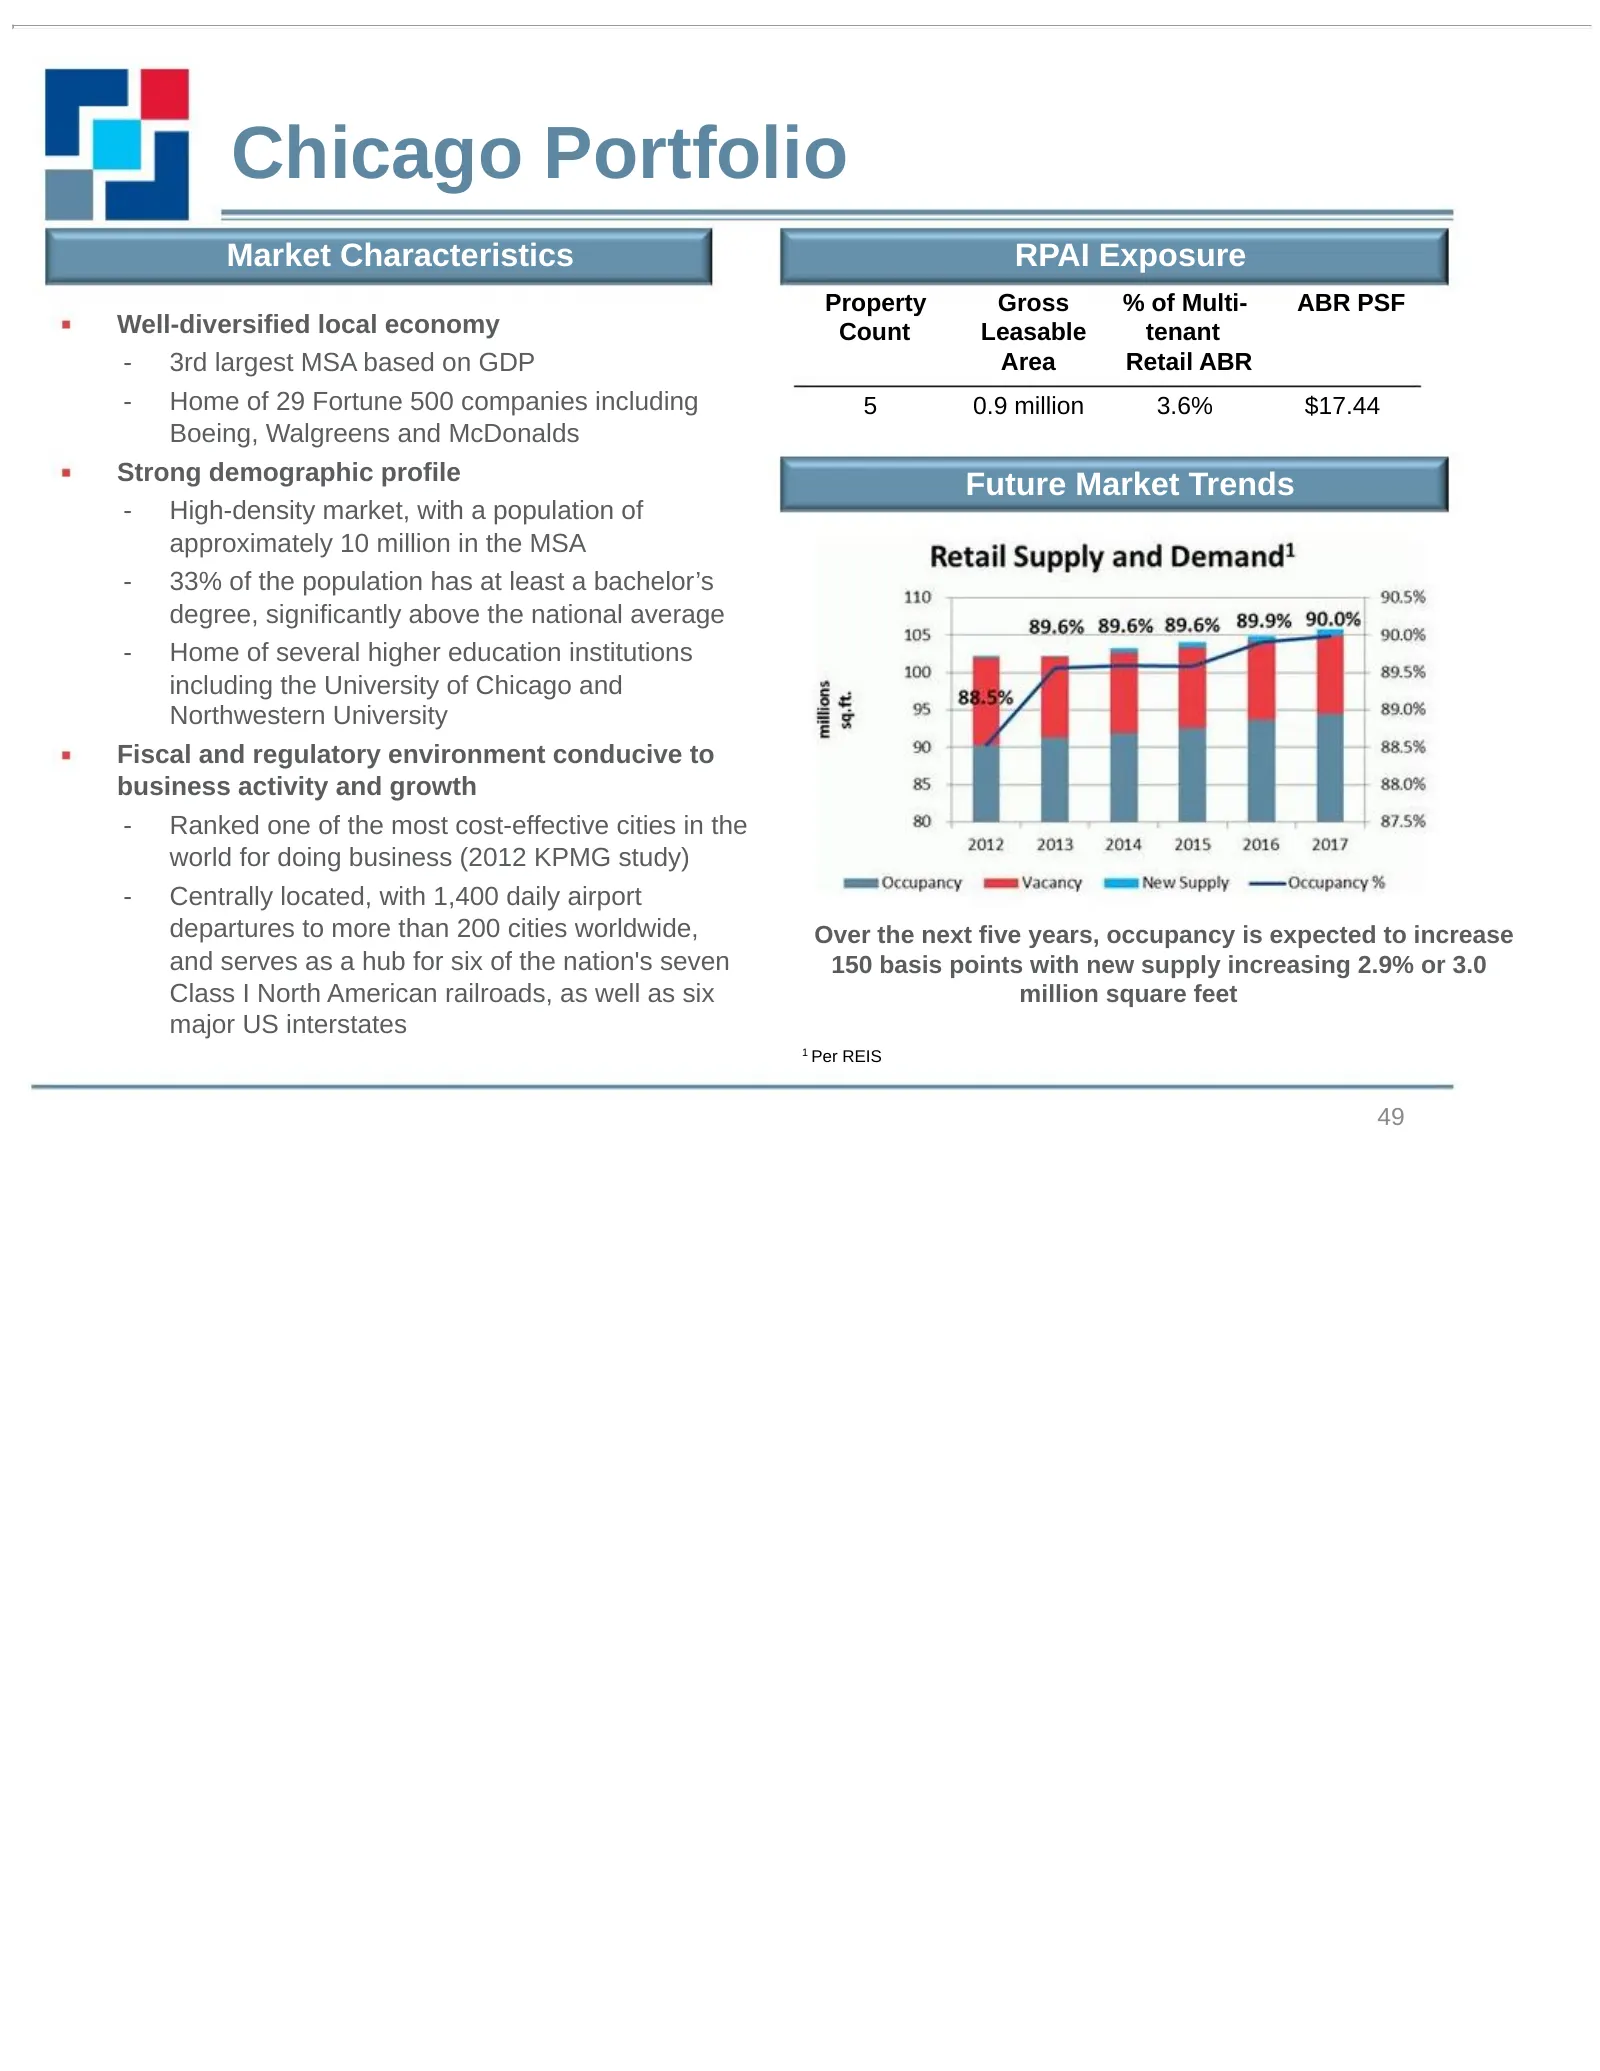
Chicago Portfolio Market Characteristics RPAI Exposure Property Gross % of Multi- ABR PSF Well-diversified local economy Count Leasable tenant - 3rd largest MSA based on GDP Area Retail ABR - Home of 29 Fortune 500 companies including 5 0.9 million 3.6% $17.44 Boeing, Walgreens and McDonalds Strong
Slide 50: The Brickyard
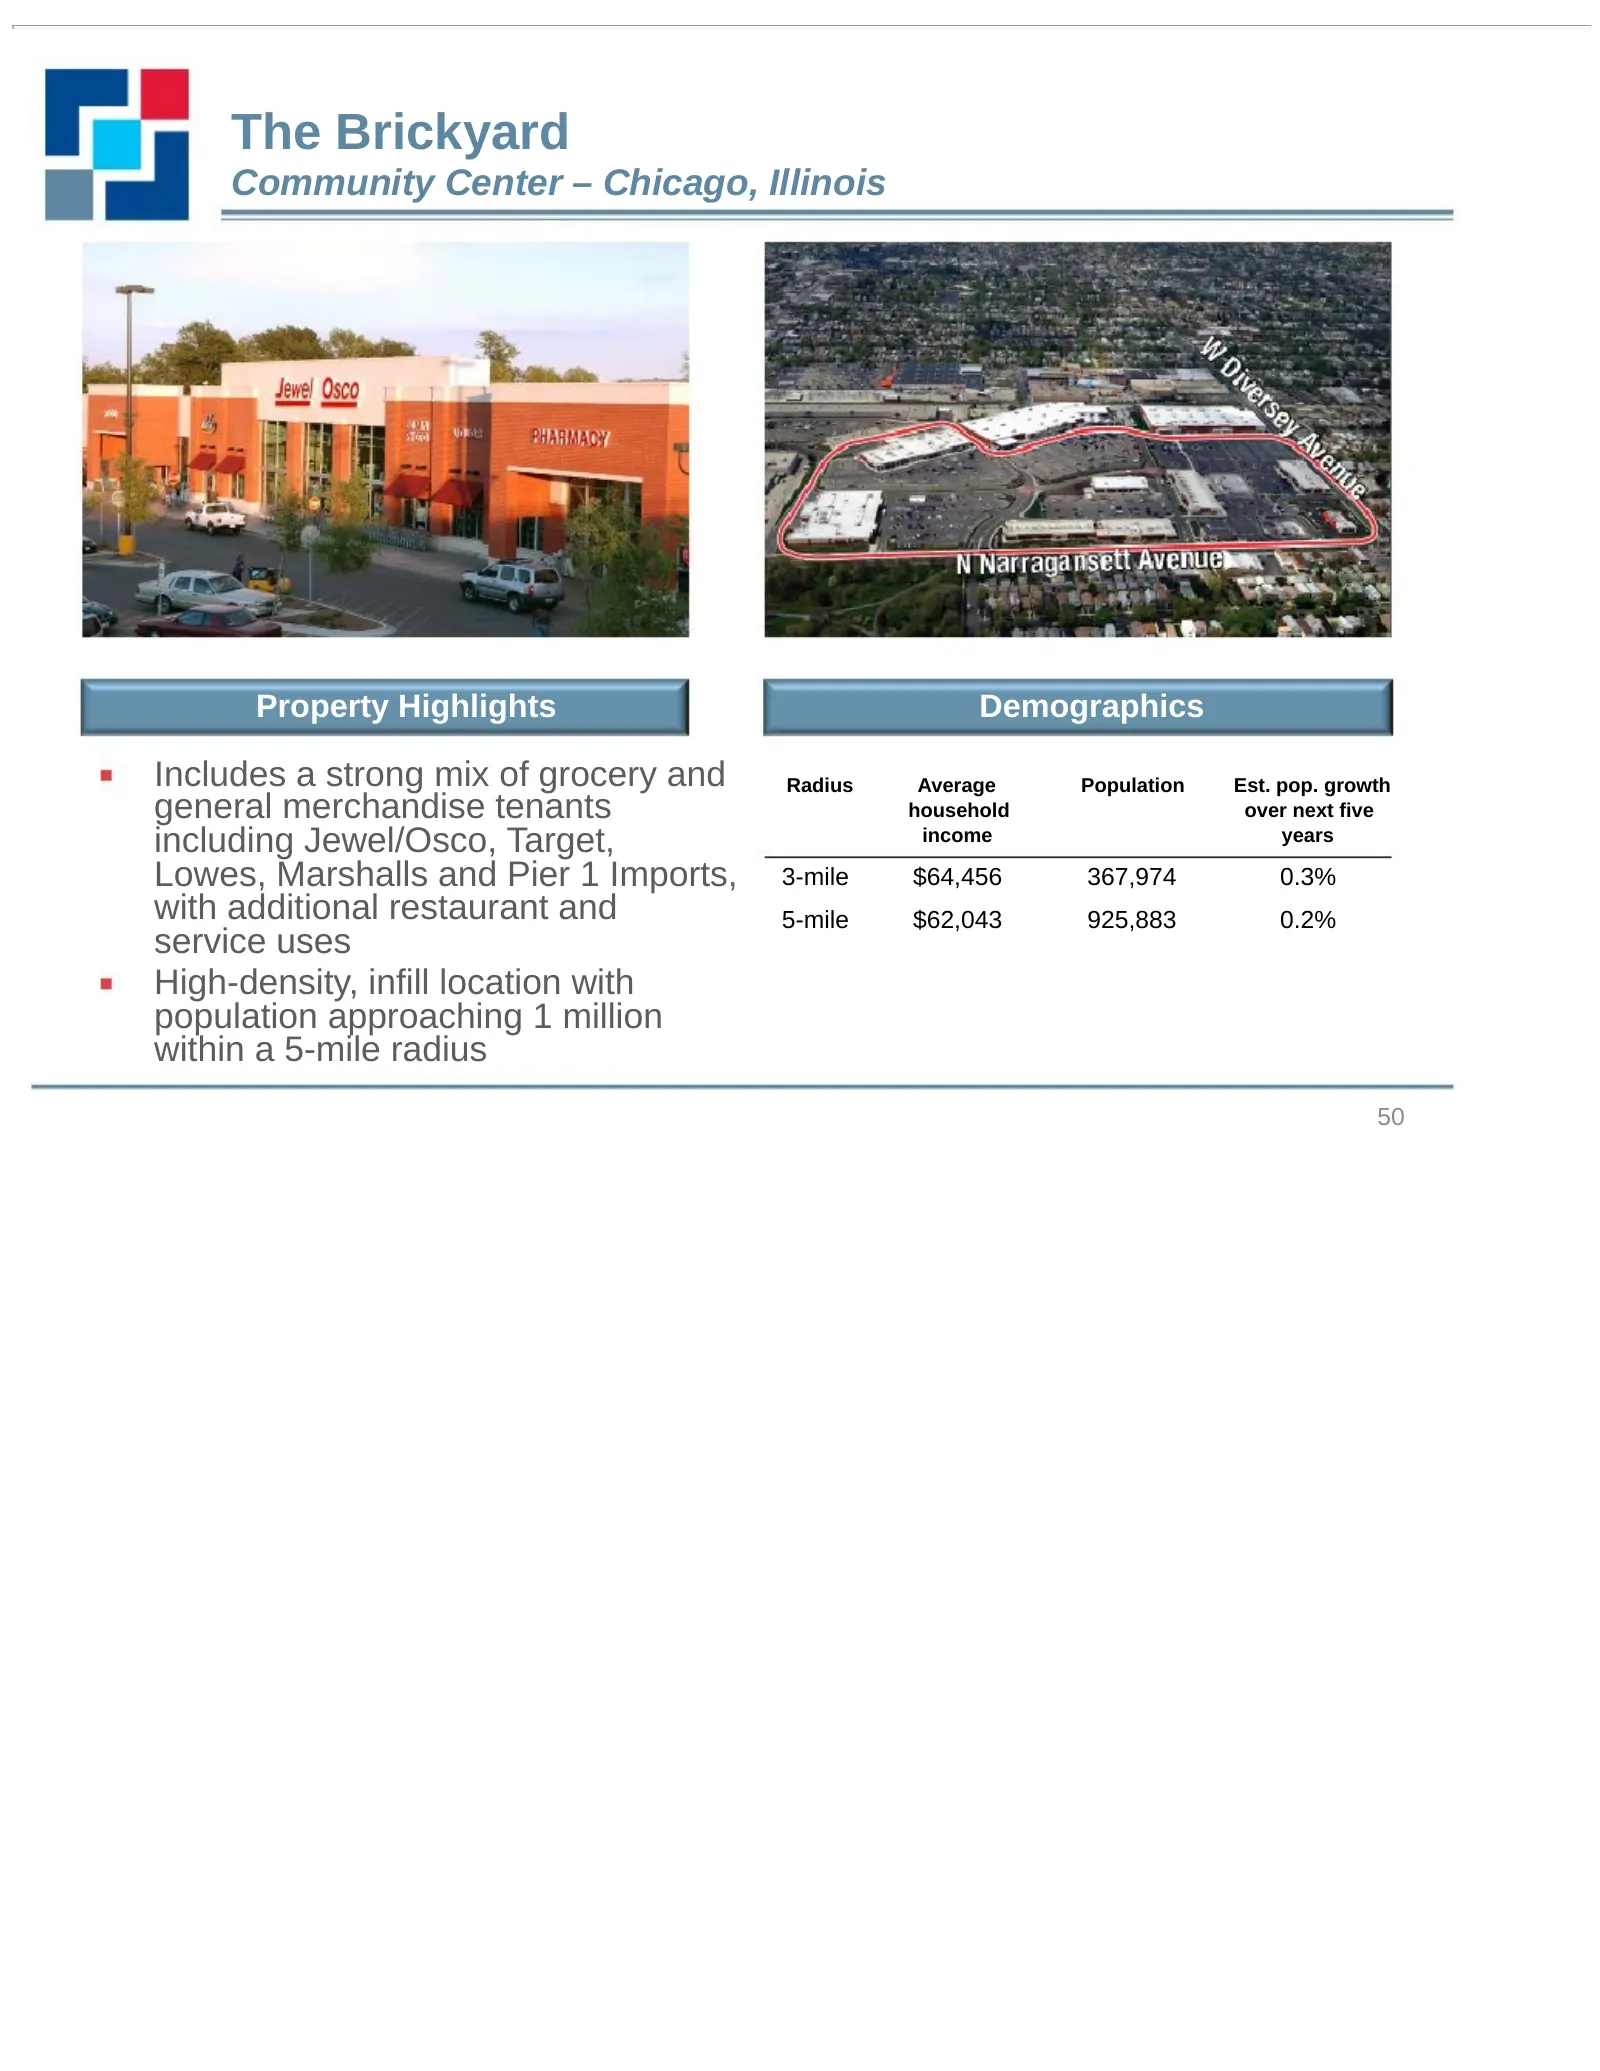
The Brickyard Community Center – Chicago, Illinois Property Highlights Demographics Includes a strong mix of grocery and Radius Average Population Est. pop. growth general merchandise tenants household over next five including Jewel/Osco, Target, income years Lowes, Marshalls and Pier 1 Imports, 3-m
Slide 51: The Brickyard Site Plan
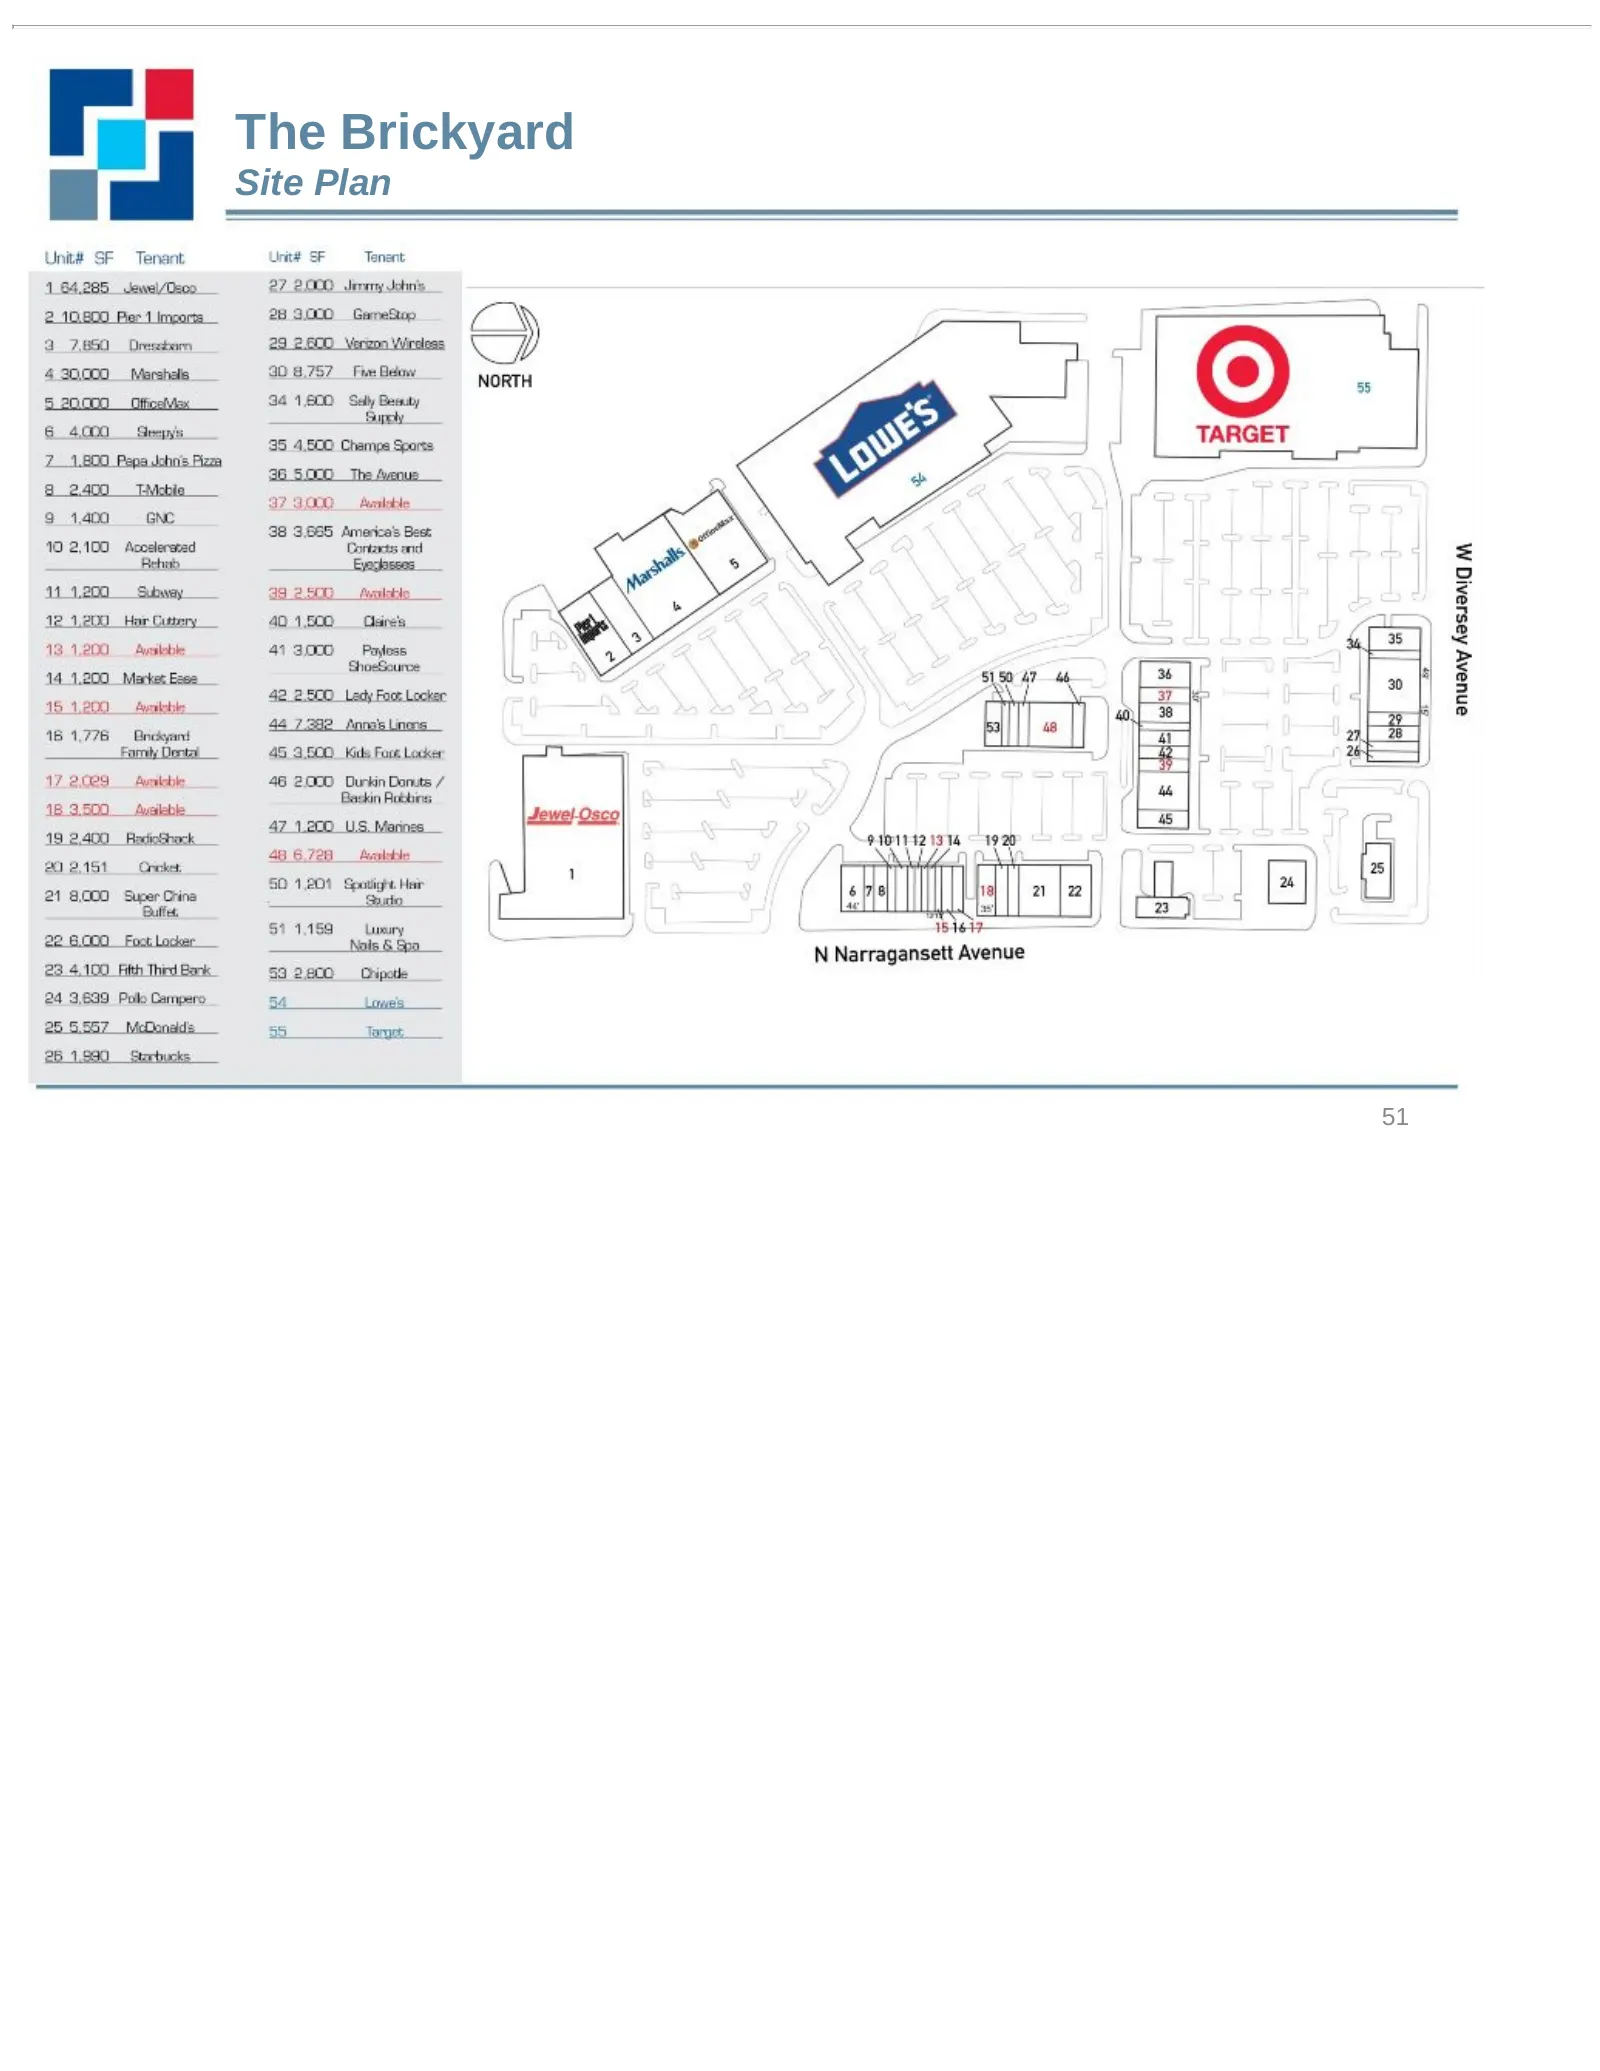
Site Plan F The Brickyard wl] 210.800 Pier 1 Imeorss — 28 9.000 GaneStop GC) 97,850 Dresebeinn 29. 2.000 Verznn Wireless 90 8,757 Fim Below 430,000 _ Marshals __ fi NORTH SL20000 Offcetvis 41.80 Selly Grnty 64.000 Sees 35. 4.500 Champs Sports 21.800 Papa John’s Pizza 26 5.000 The Menus 8 2.400 T-Mpb
Slide 52: New York/Long Island Portfolio
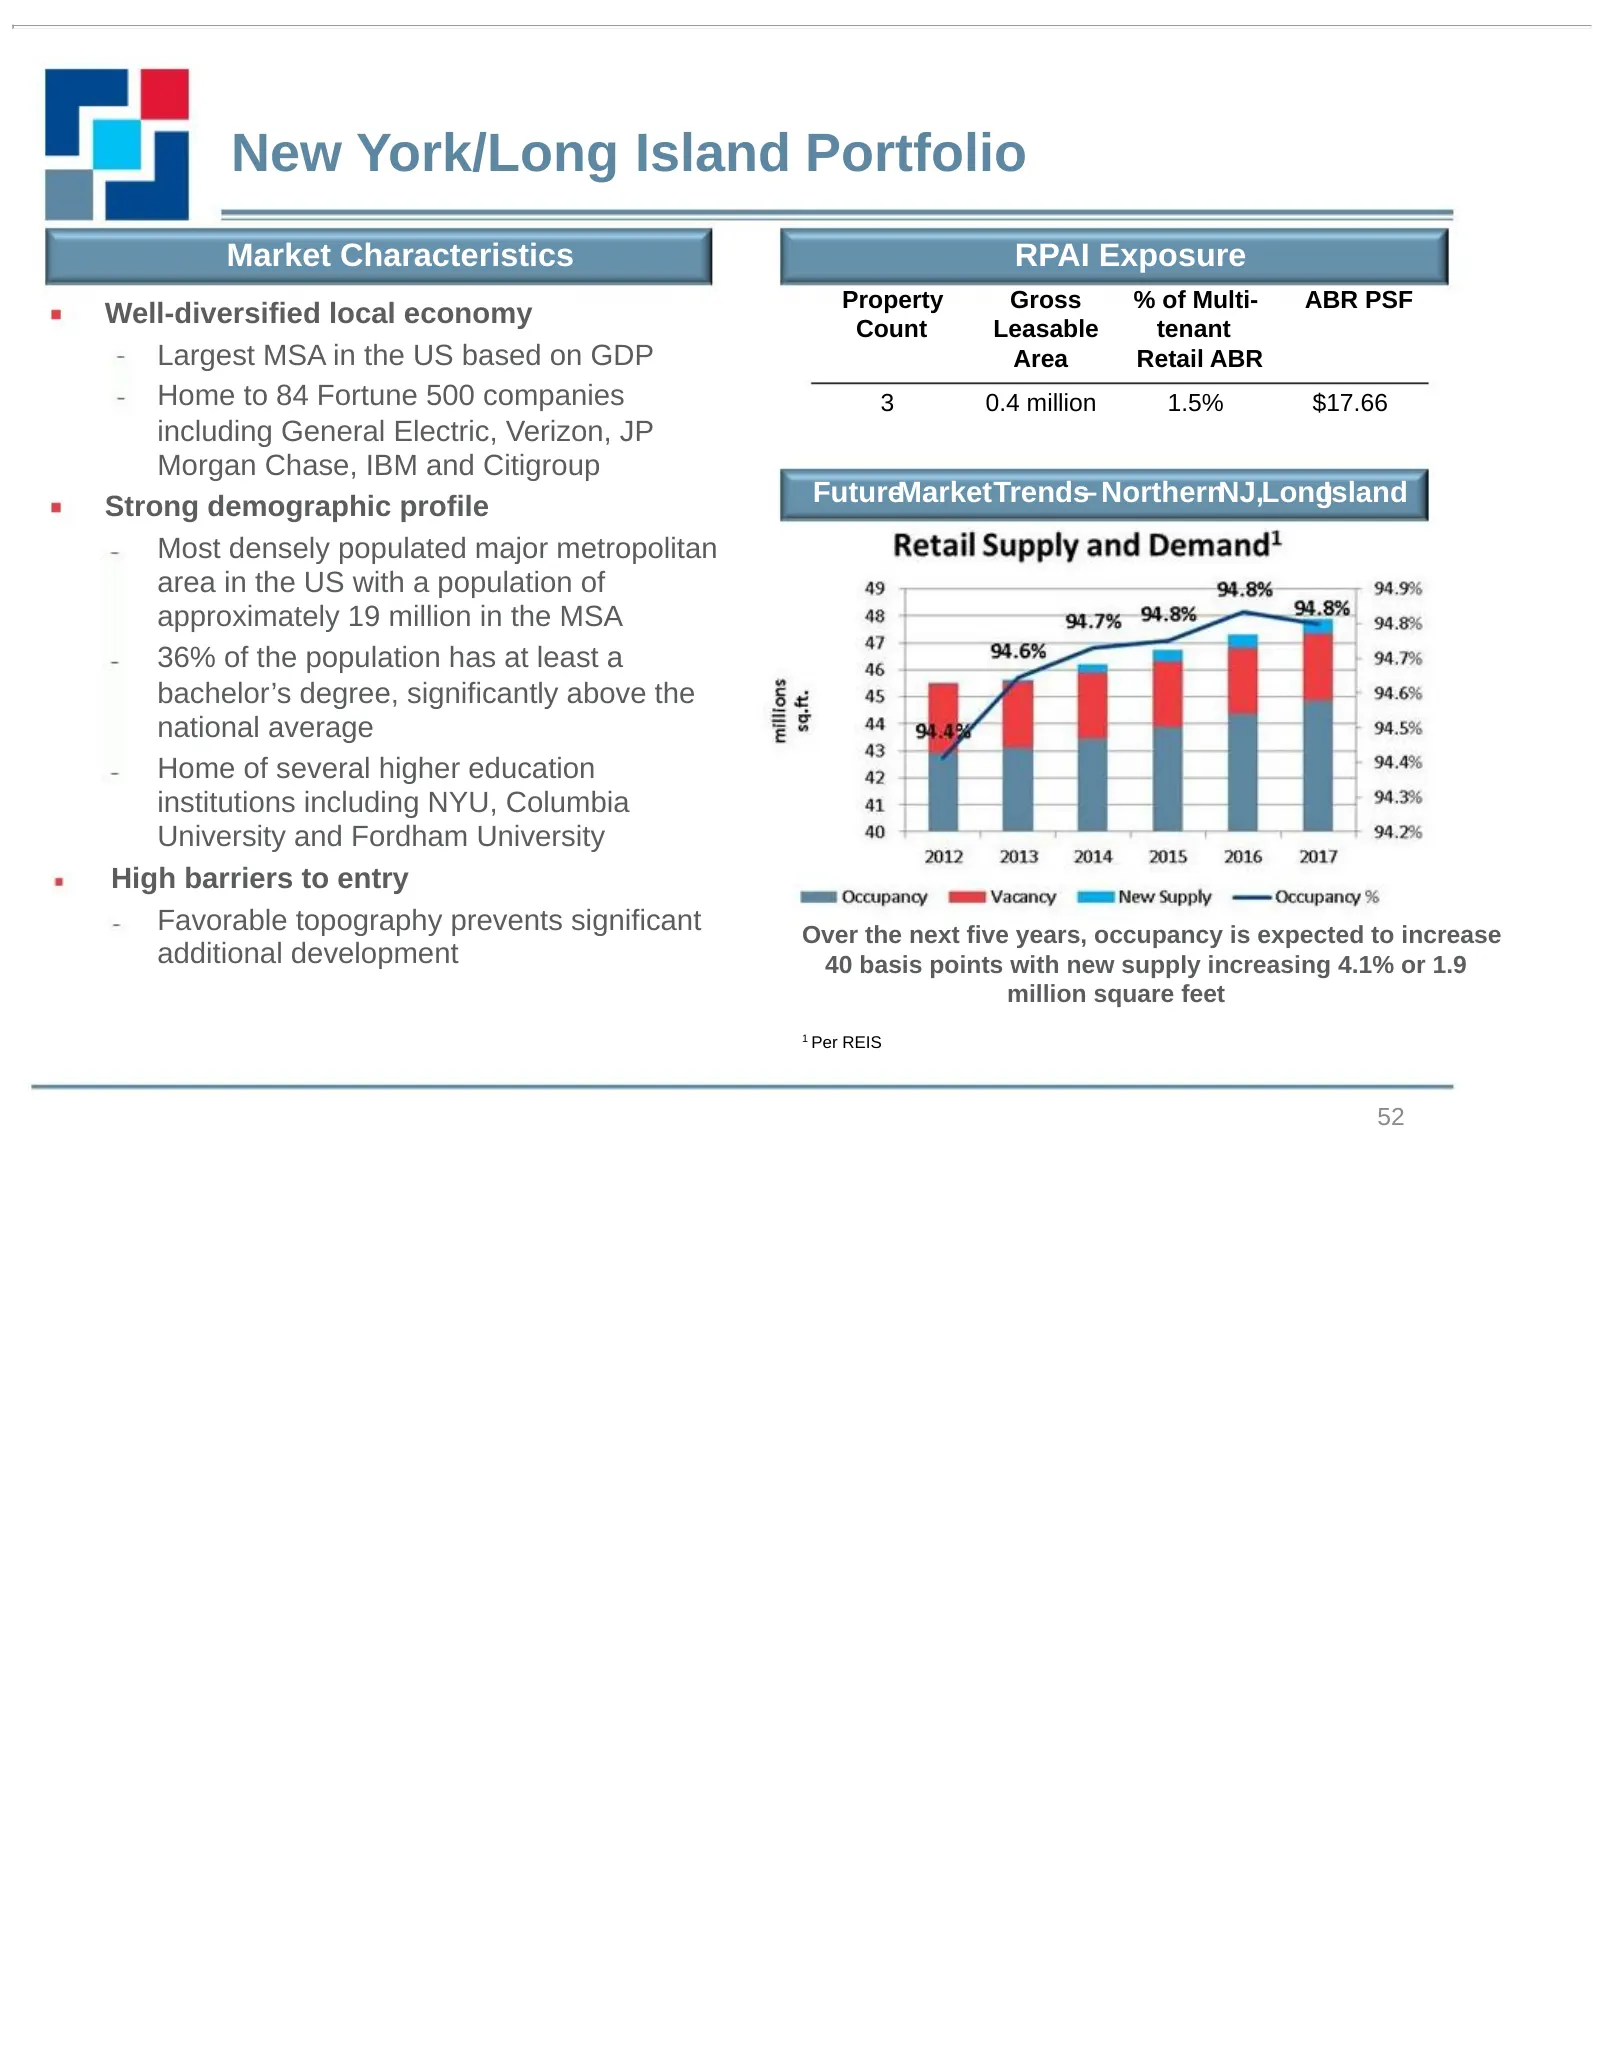
New York/Long Island Portfolio Market Characteristics RPAI Exposure Property Gross % of Multi- ABR PSF Well-diversified local economy Count Leasable tenant Largest MSA in the US based on GDP Area Retail ABR Home to 84 Fortune 500 companies 3 0.4 million 1.5% $17.66 including General Electric, Verizo
Slide 53: Gardiner Manor Mall
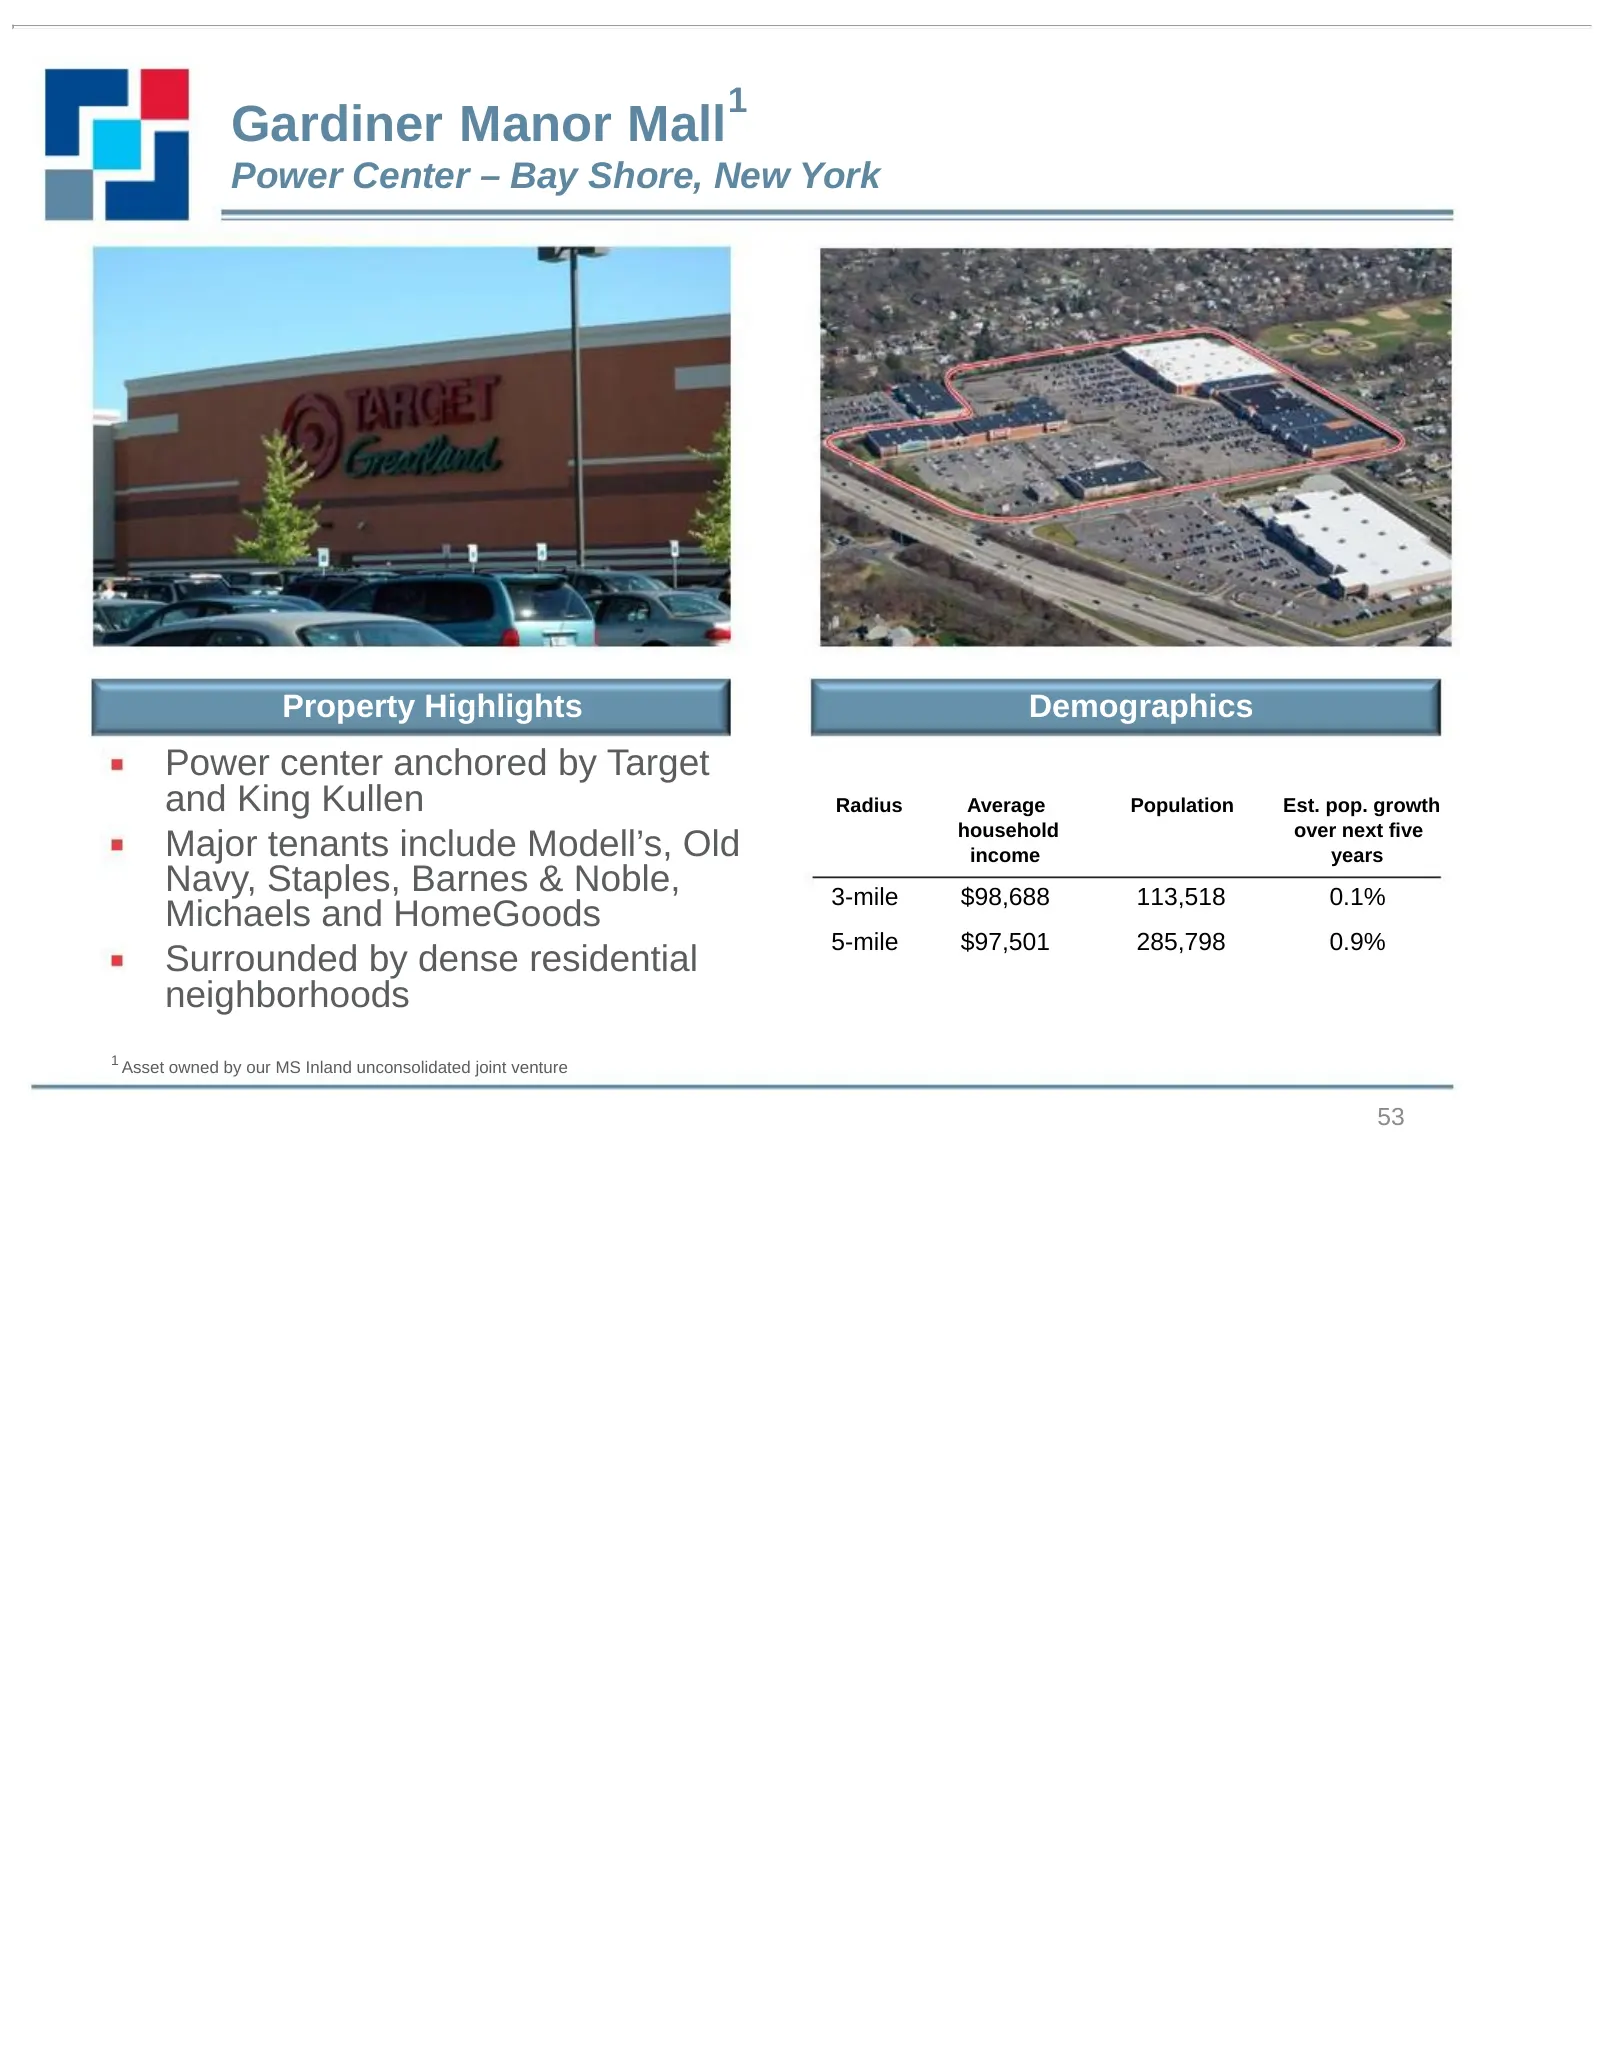
1 Gardiner Manor Mall Power Center – Bay Shore, New York Property Highlights Demographics Power center anchored by Target and King Kullen Radius Average Population Est. pop. growth household over next five Major tenants include Modell’s, Old income years Navy, Staples, Barnes & Noble, 3-mile $98,688
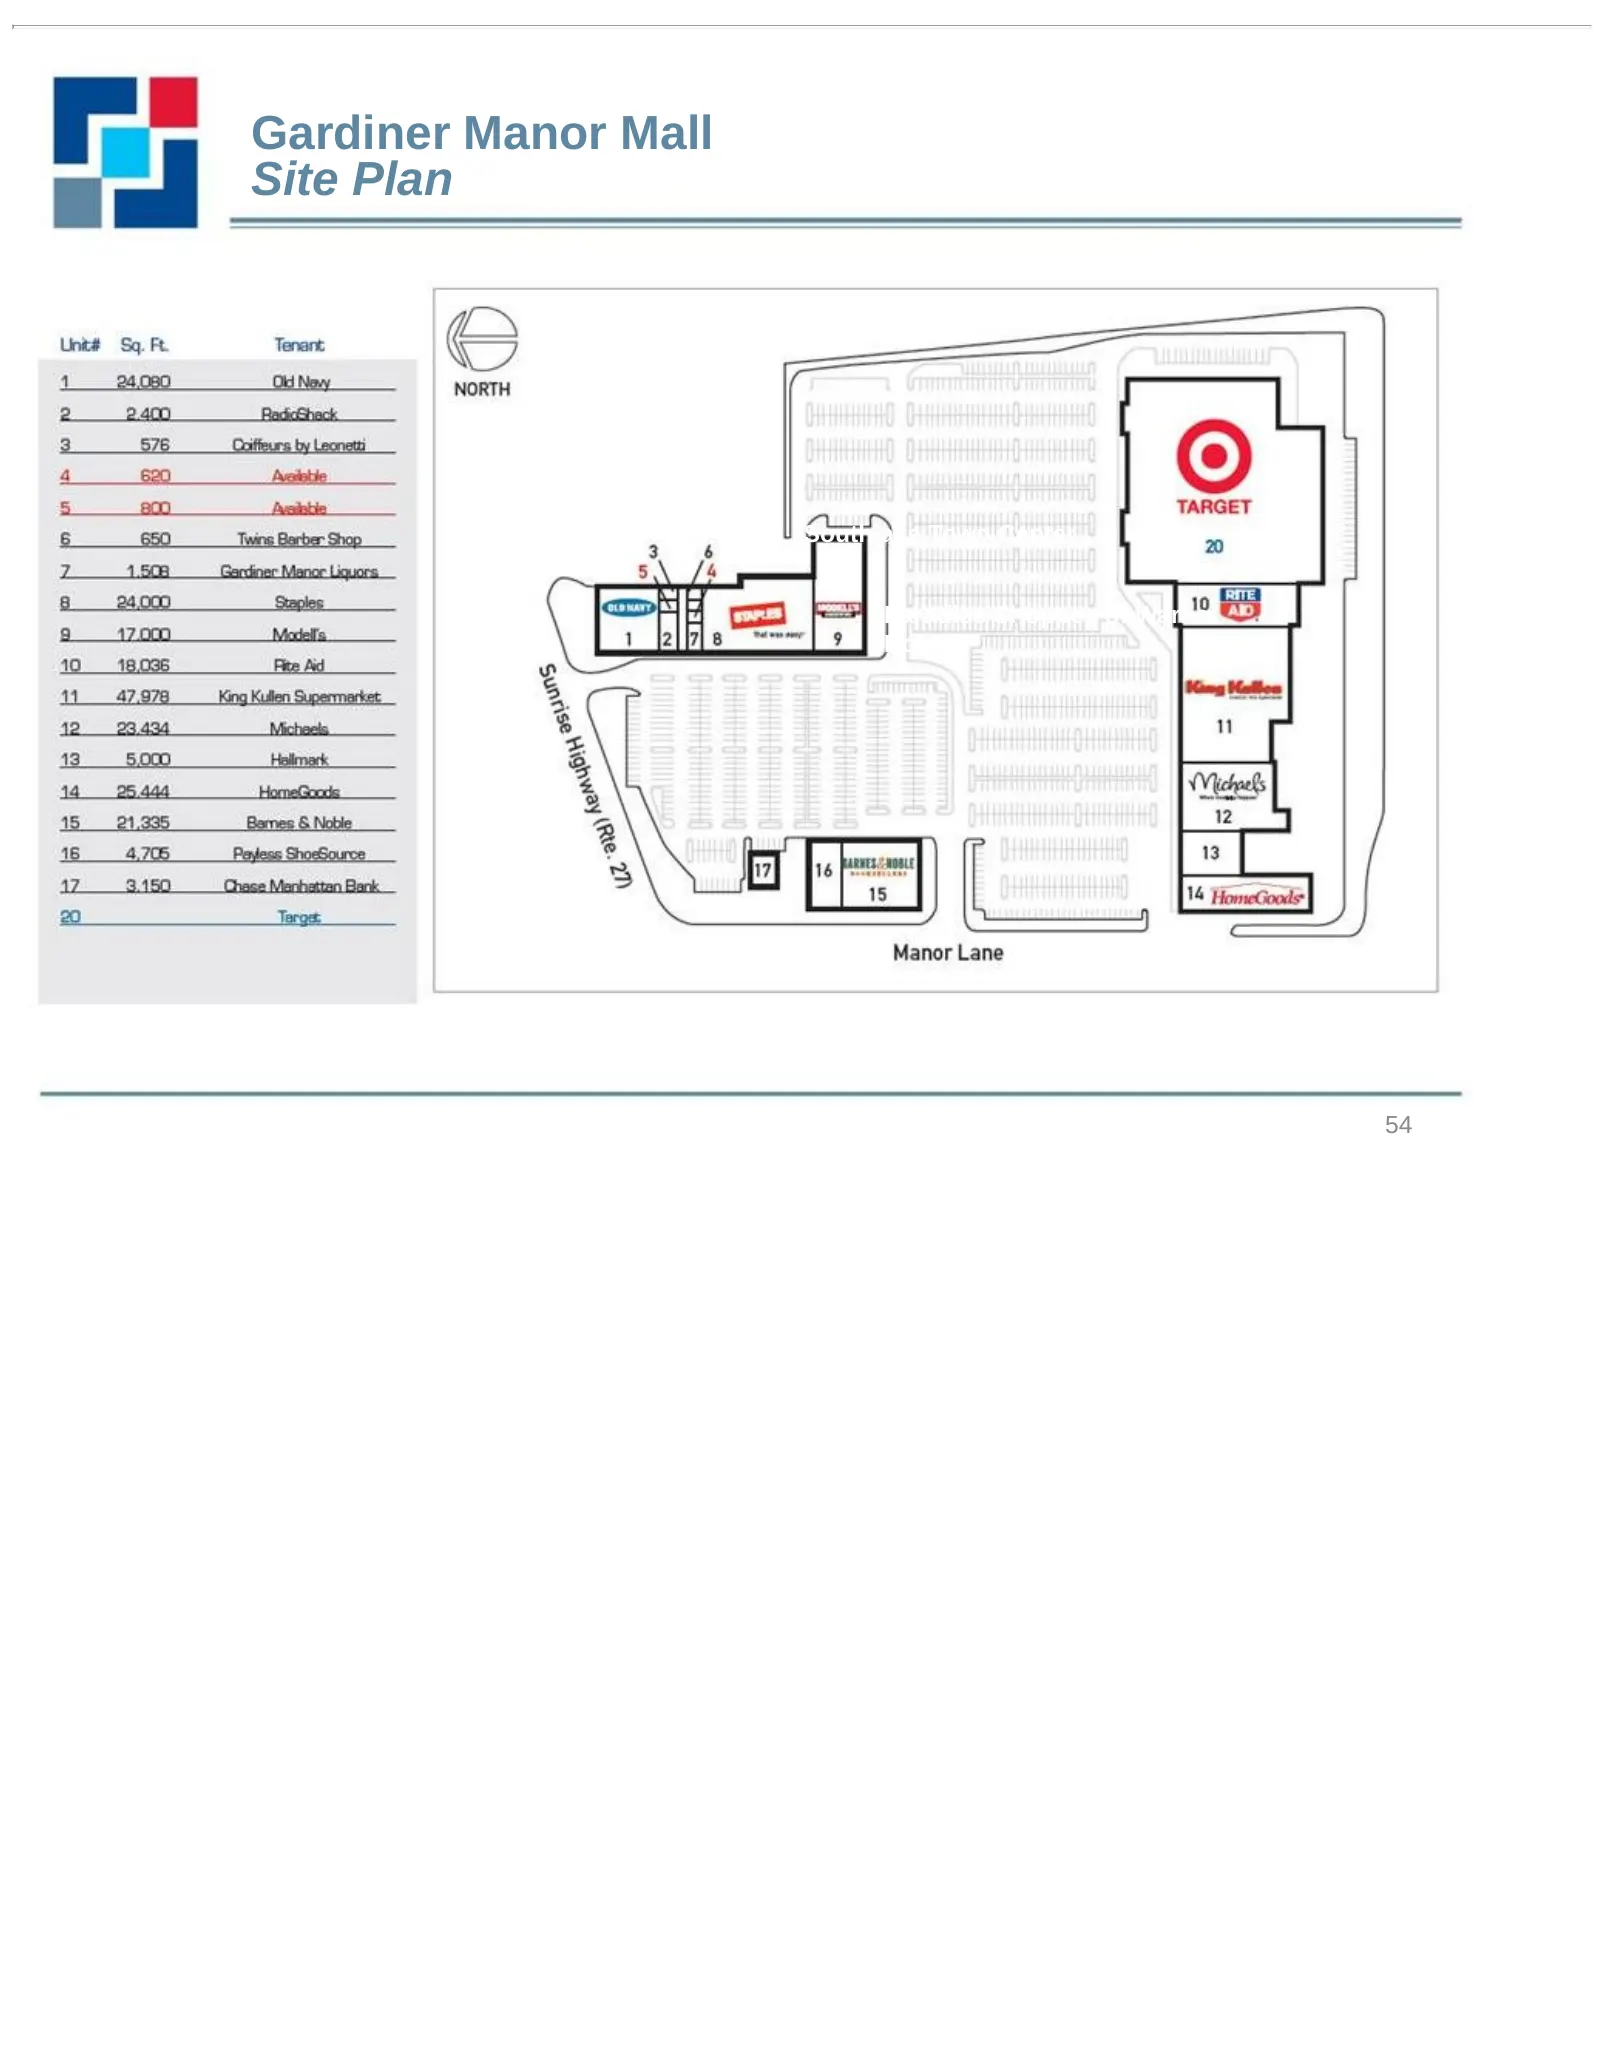
Slide 54: Gardiner Manor Mall Site Plan
Gardiner Manor Mall Site Plan Southlake Town Center Paradise Shoppes of Warner Robins 54
Slide 55: Acquisition Criteria
Acquisition Criteria We are focused on unlevered risk-adjusted returns Opportunities will be evaluated within the context of our strategic plan – Unique adjacencies to existing assets and overall enhancement to our operating platform will be key considerations – We will remain agnostic to multi-tena

Slide 56: Balance Sheet Strategy
Balance Sheet Strategy Angela Aman
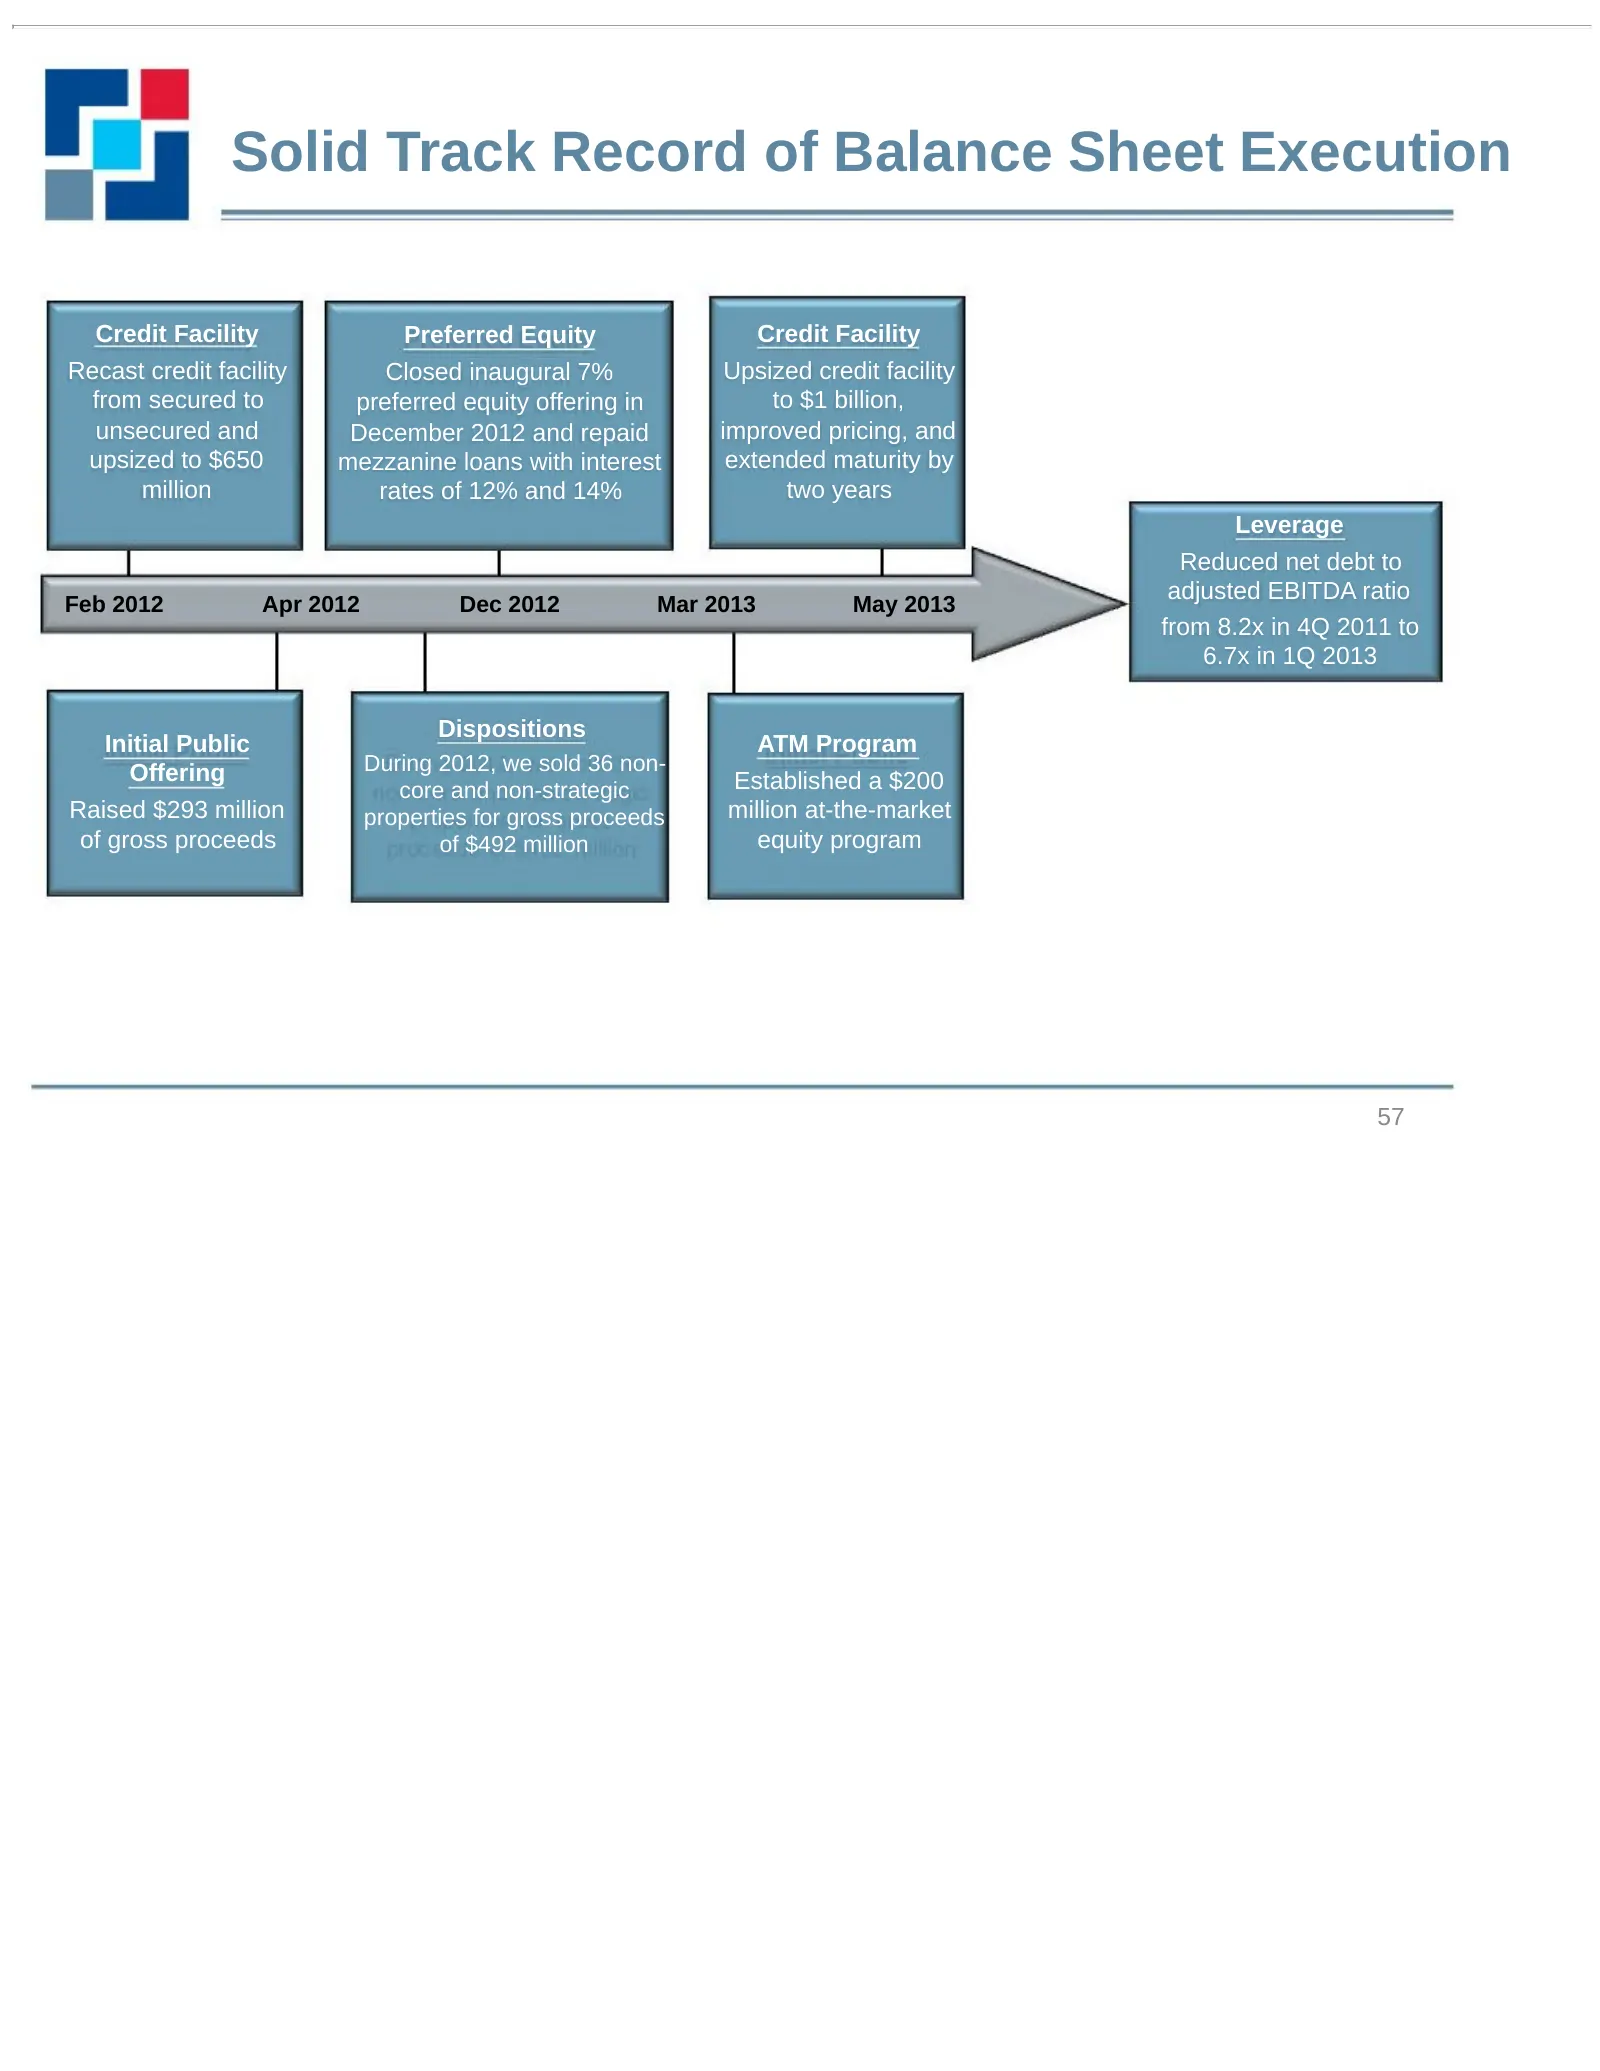
Slide 57: Solid Track Record of Balance Sheet Execution
Solid Track Record of Balance Sheet Execution Credit Facility Preferred Equity Credit Facility Recast credit facility Closed inaugural 7% Upsized credit facility from secured to preferred equity offering in to $1 billion, unsecured and December 2012 and repaid improved pricing, and upsized to $650 m
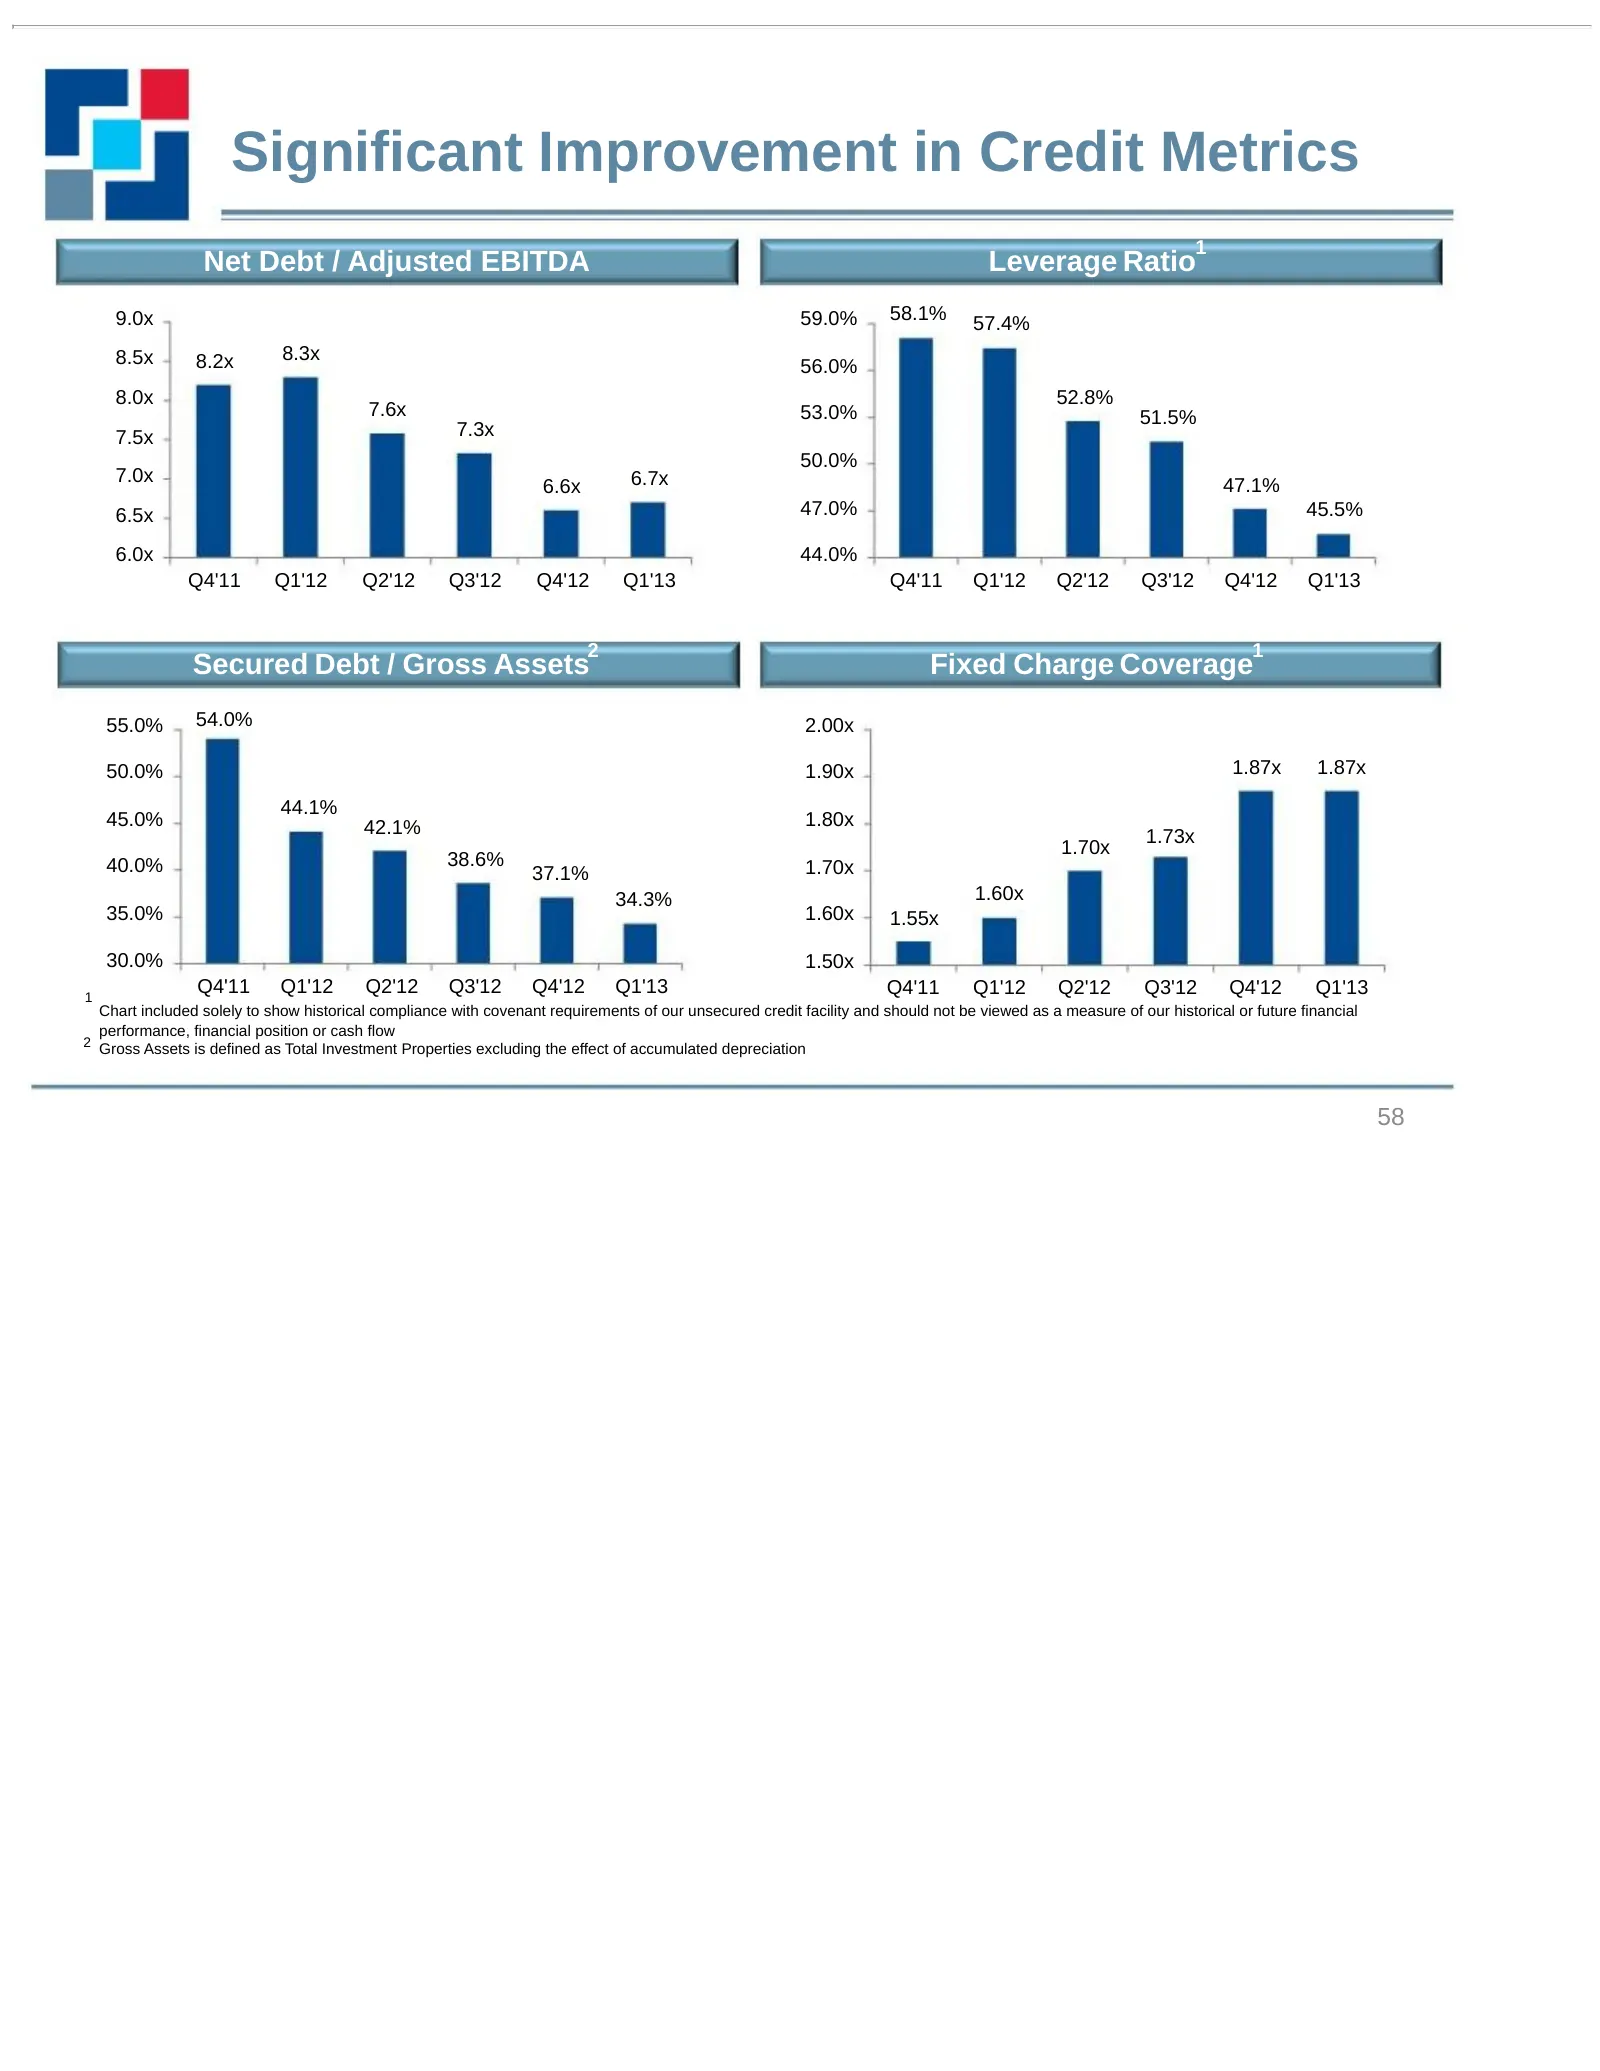
Slide 58: Significant Improvement in Credit Metrics
Significant Improvement in Credit Metrics 1 Net Debt / Adjusted EBITDA Leverage Ratio 9.0x 59.0% 58.1% 57.4% 8.5x 8.2x 8.3x 56.0% 8.0x 52.8% 7.6x 53.0% 51.5% 7.5x 7.3x 50.0% 7.0x 6.7x 47.1% 6.6x 6.5x 47.0% 45.5% 6.0x 44.0% Q4'11 Q1'12 Q2'12 Q3'12 Q4'12 Q1'13 Q4'11 Q1'12 Q2'12 Q3'12 Q4'12 Q1'13 2 1 S
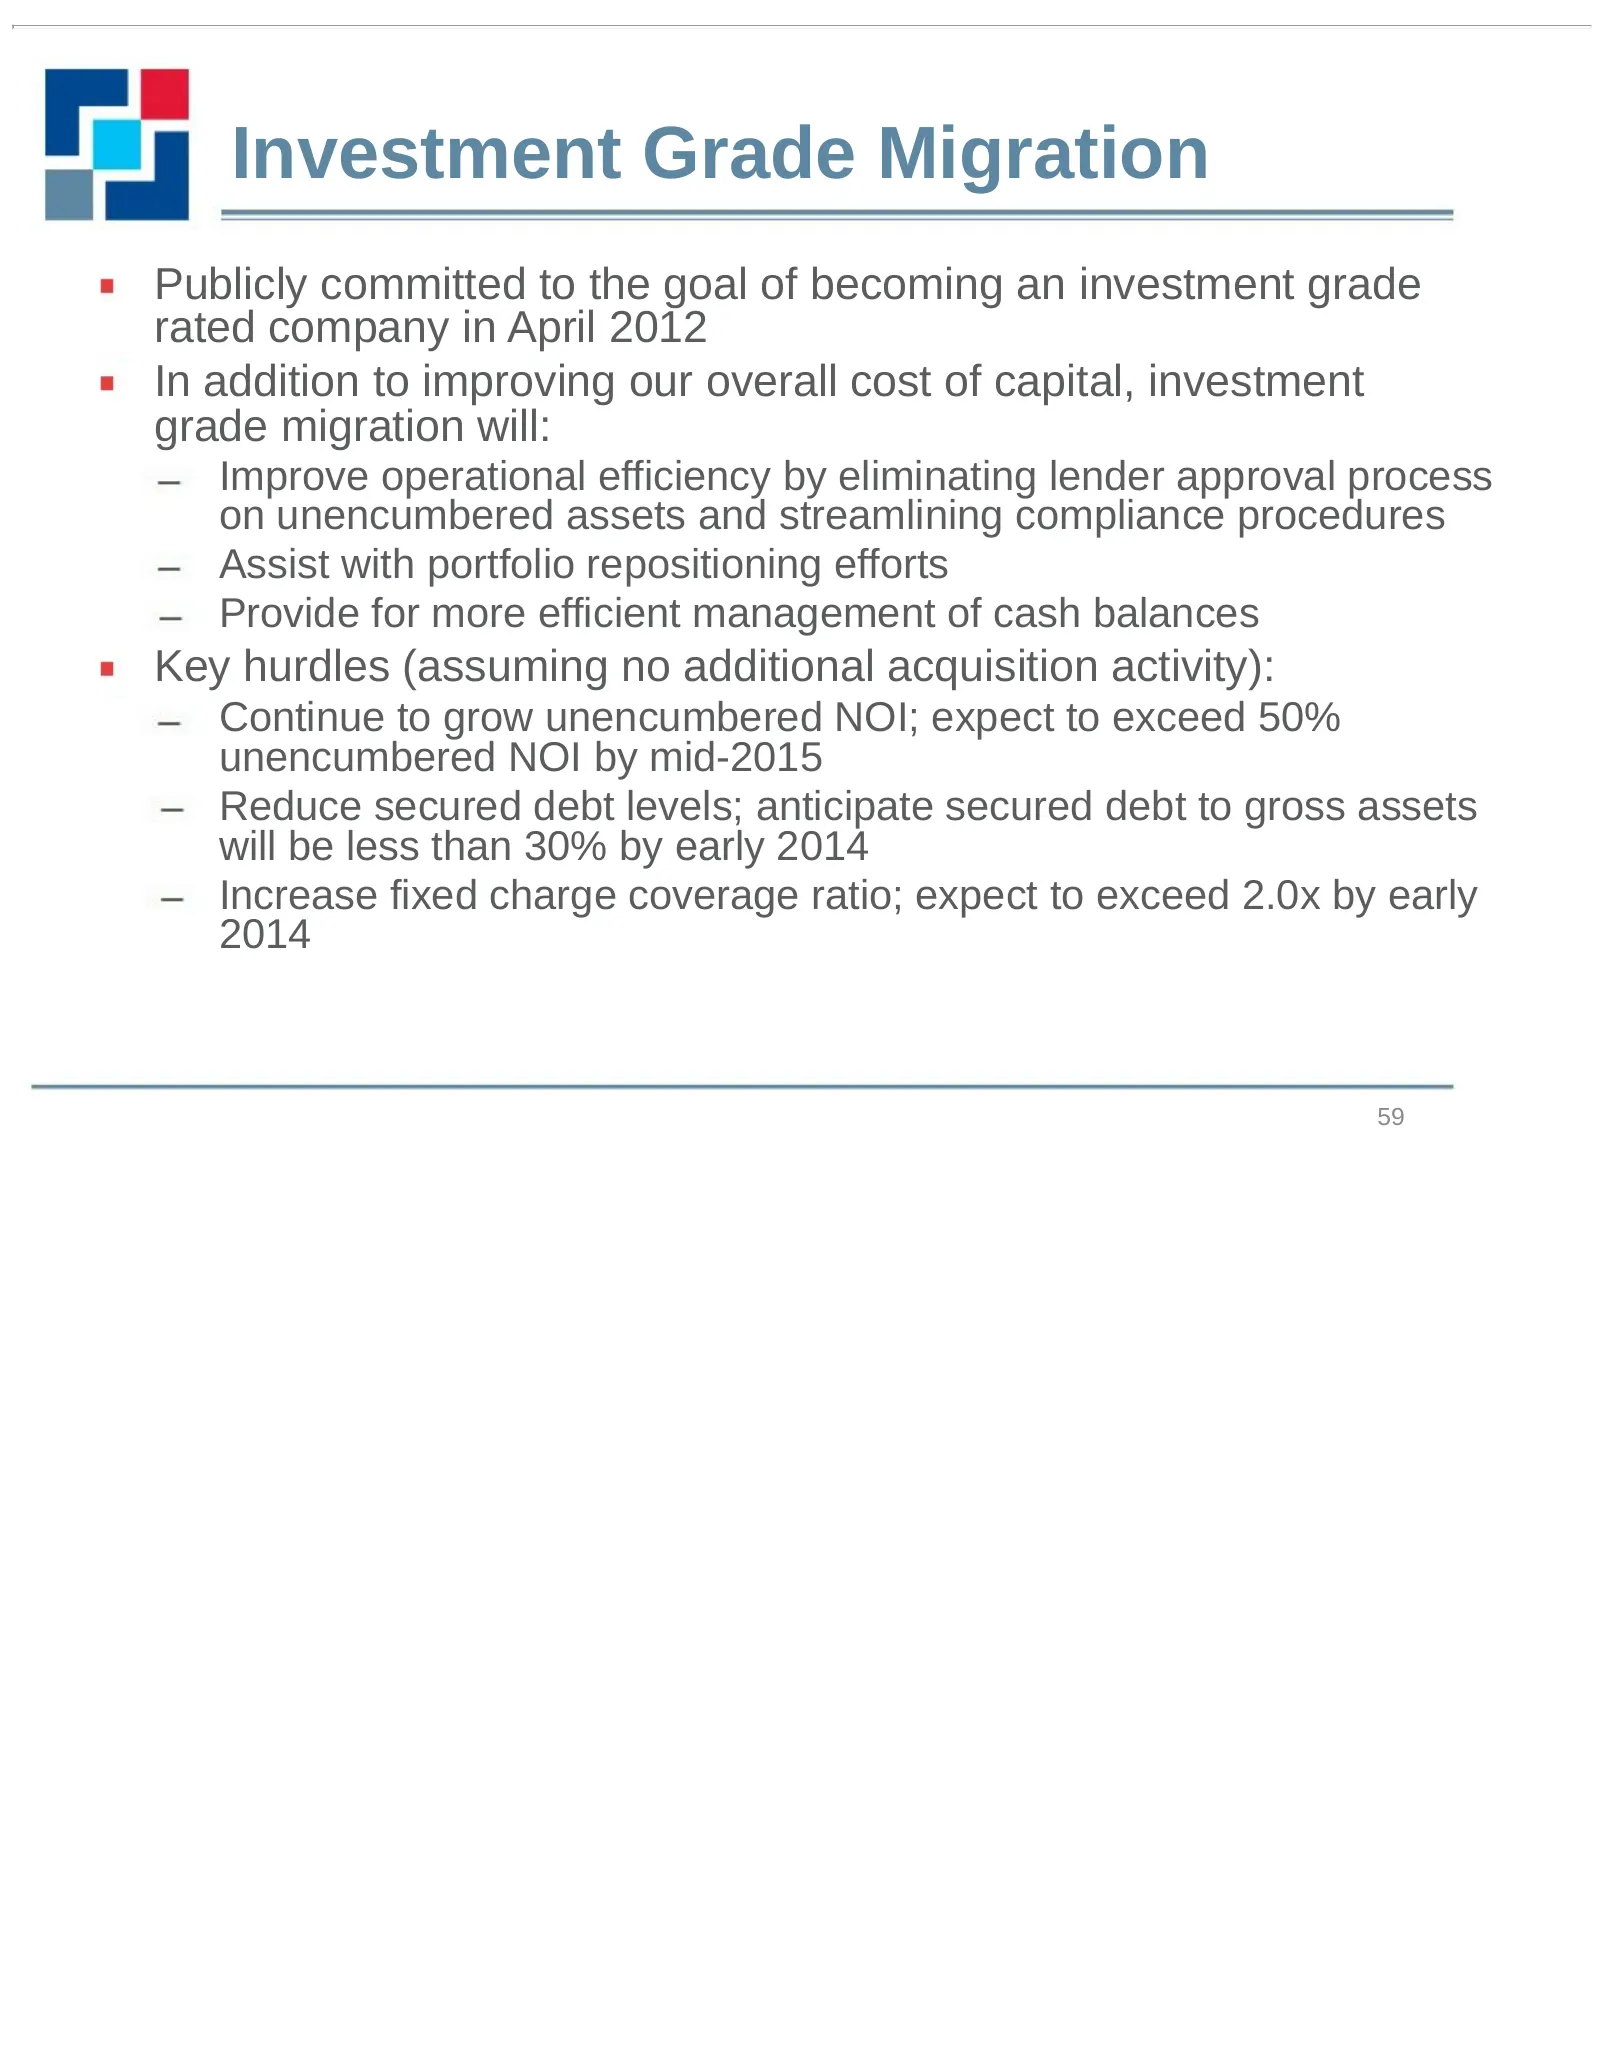
Slide 59: Investment Grade Migration
Investment Grade Migration Publicly committed to the goal of becoming an investment grade rated company in April 2012 In addition to improving our overall cost of capital, investment grade migration will: Improve operational efficiency by eliminating lender approval process on unencumbered assets an
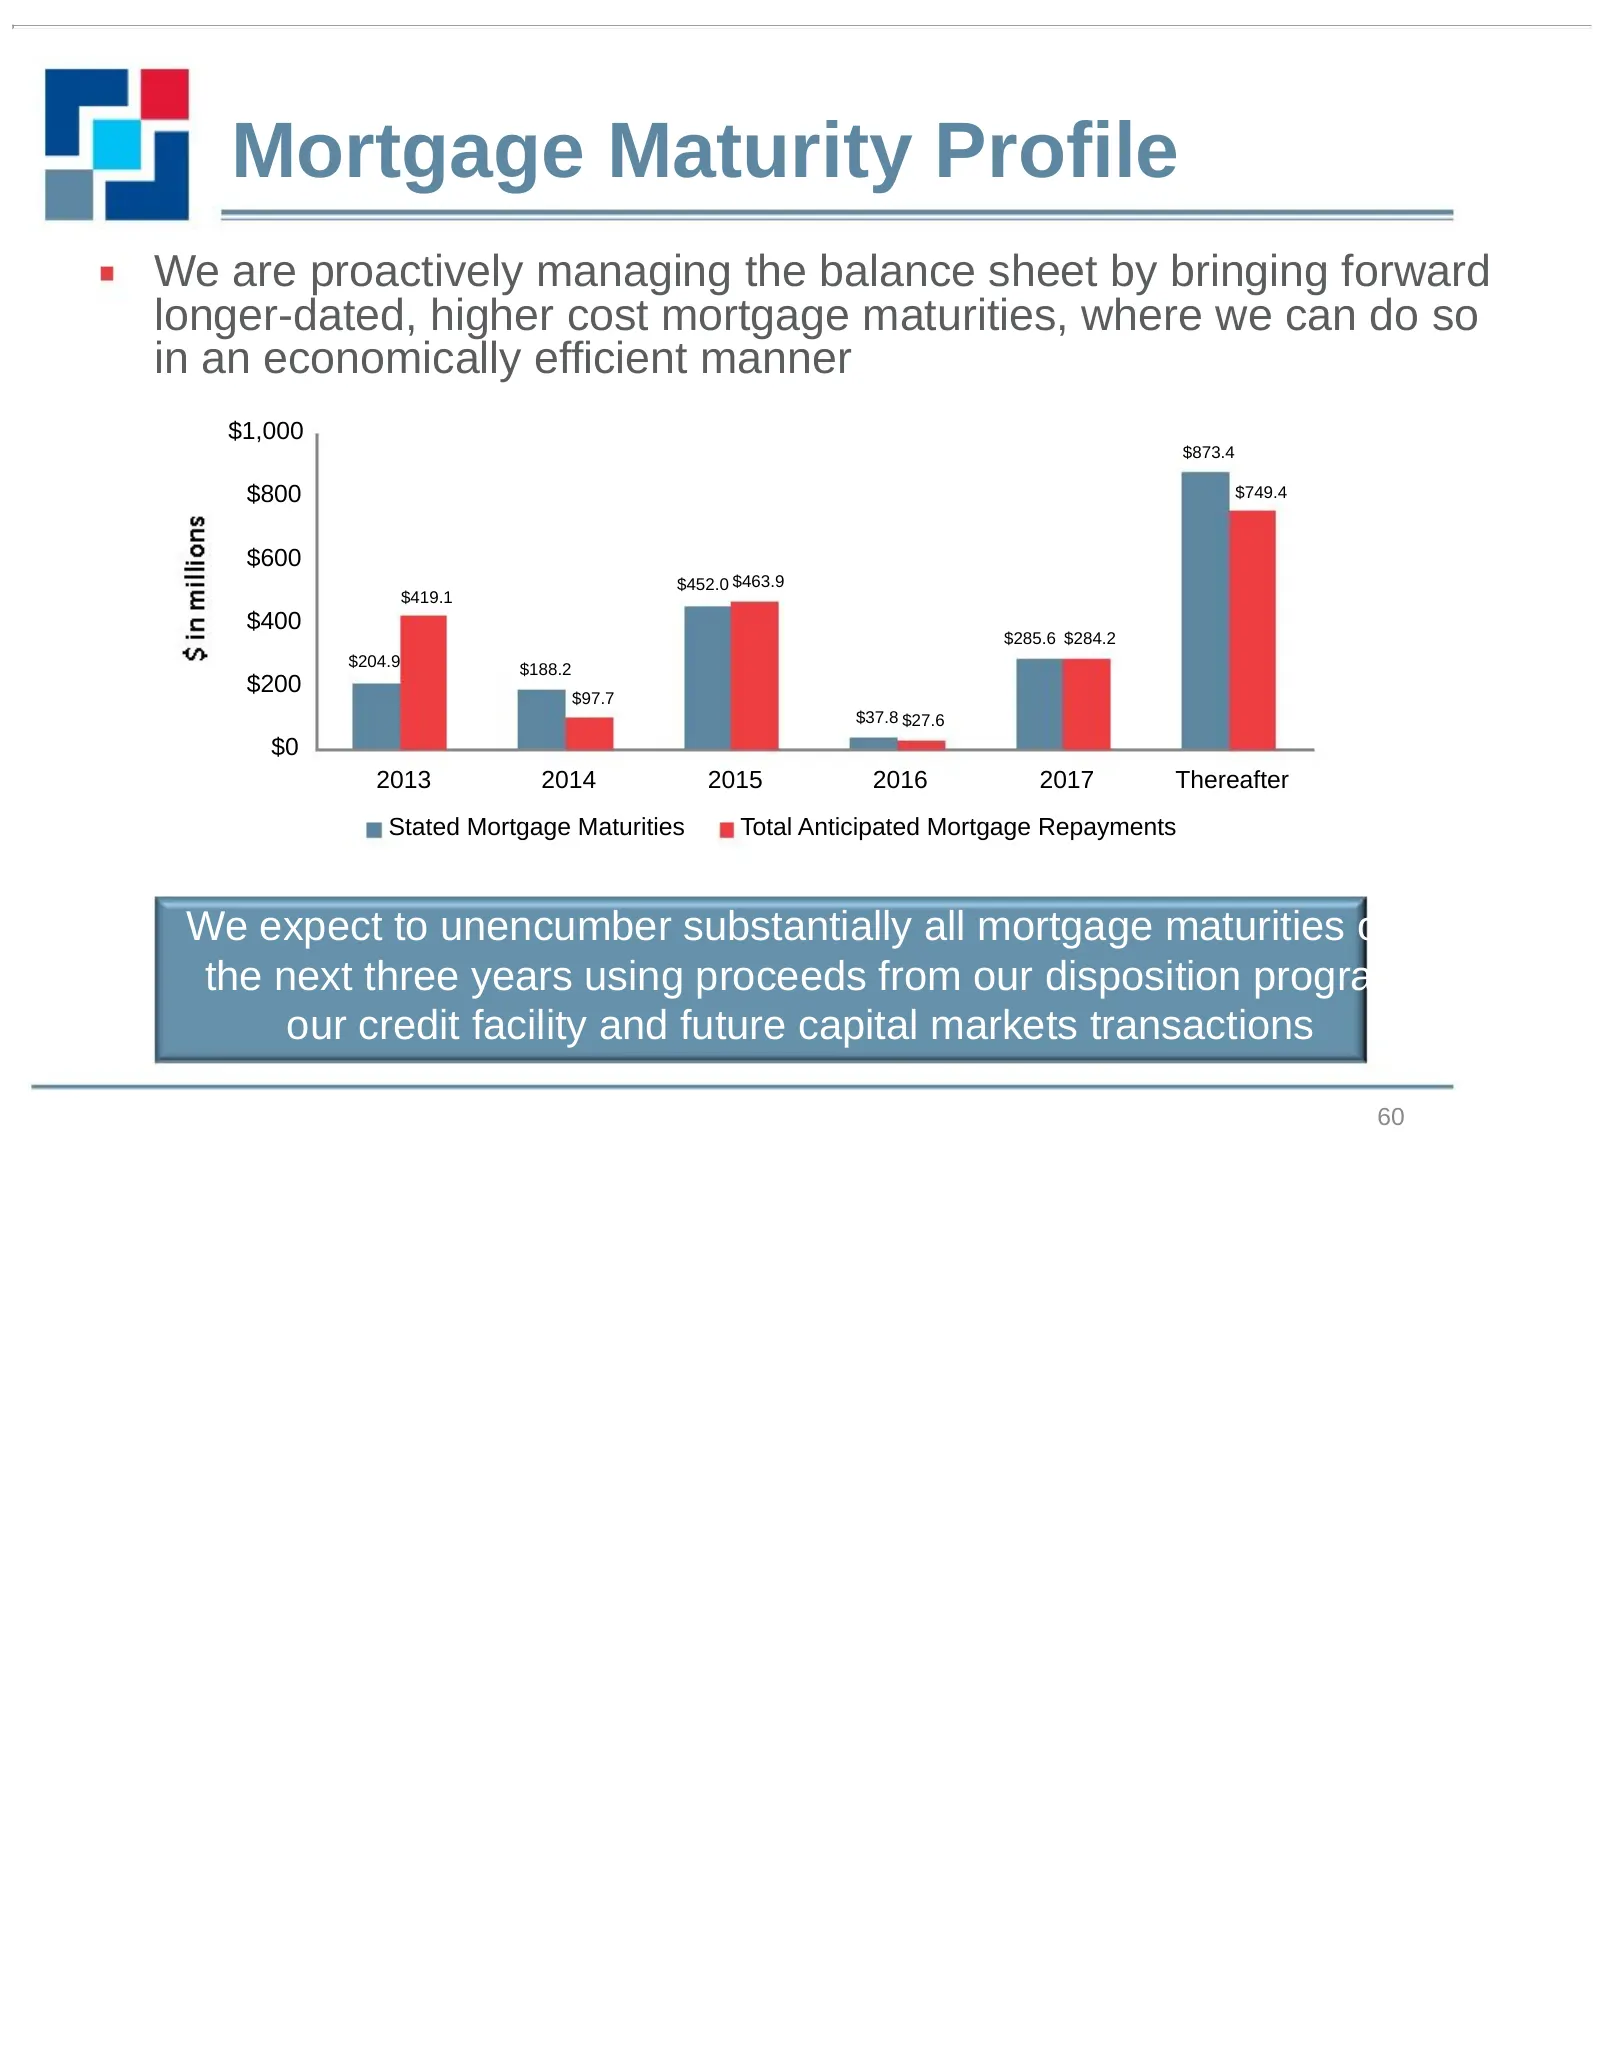
Slide 60: Mortgage Maturity Profile
Mortgage Maturity Profile We are proactively managing the balance sheet by bringing forward longer-dated, higher cost mortgage maturities, where we can do so in an economically efficient manner $1,000 $873.4 $800 $749.4 $600 $452.0 $463.9 $419.1 $400 $285.6 $284.2 $204.9 $188.2 $200 $97.7 $37.8 $27.
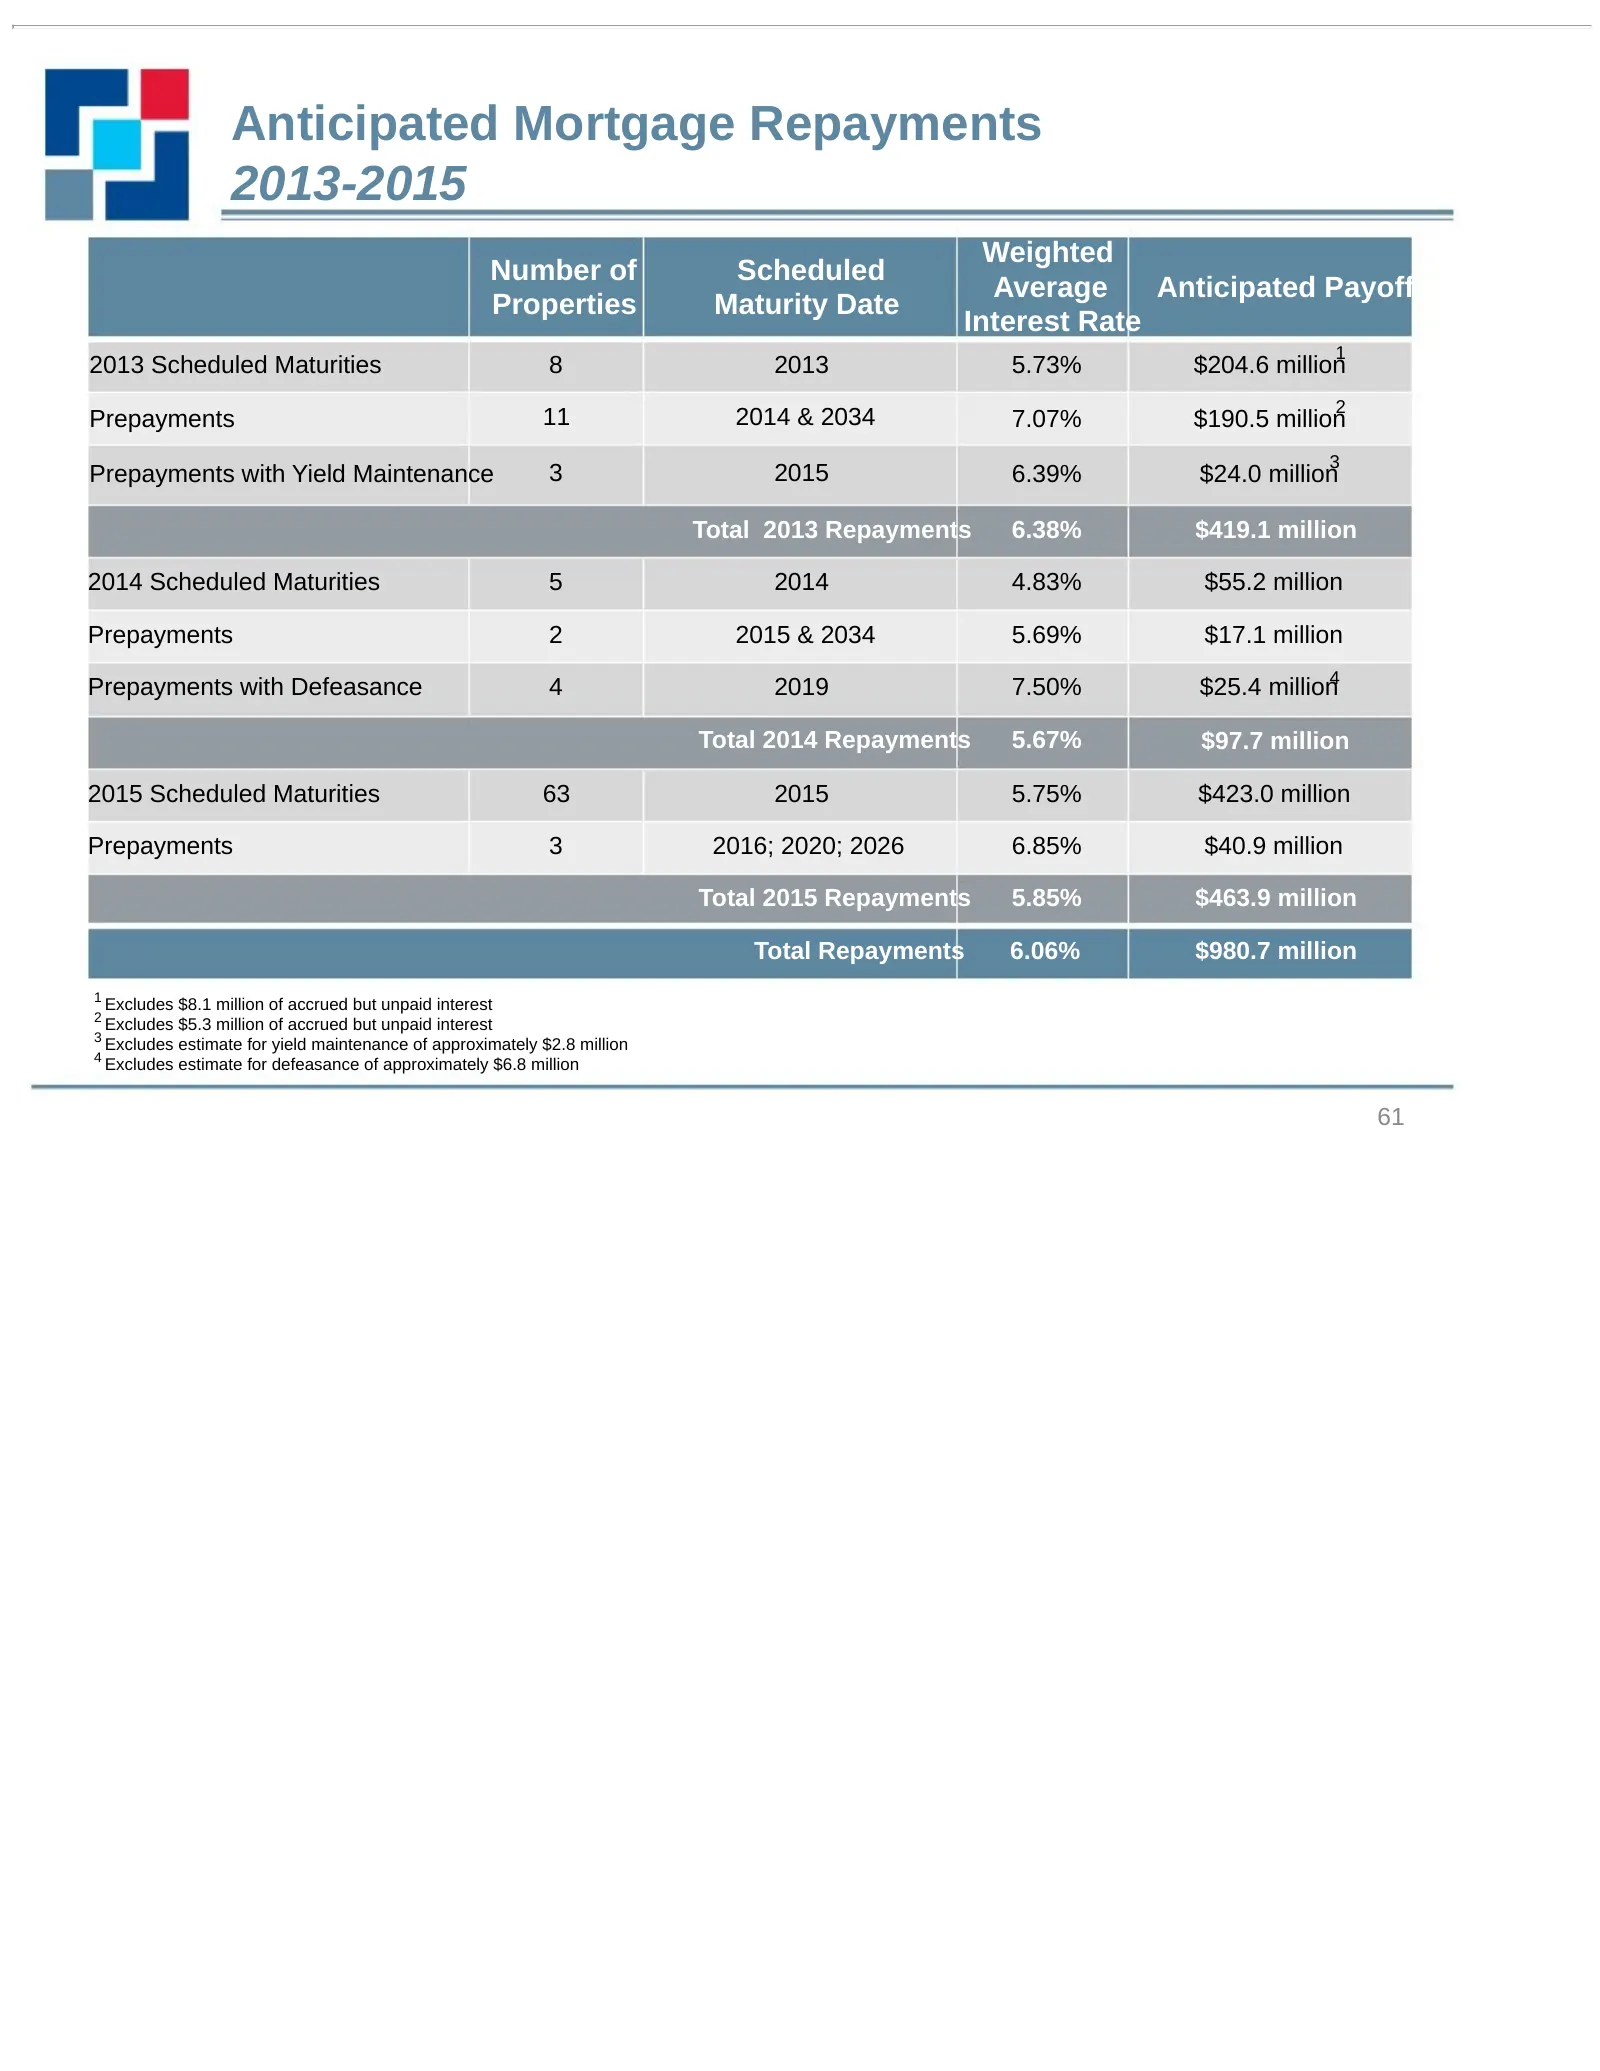
Slide 61: Anticipated Mortgage Repayments
Anticipated Mortgage Repayments 2013-2015 Weighted Number of Scheduled Average Anticipated Payoff Properties Maturity Date Interest Rate 1 2013 Scheduled Maturities 8 2013 5.73% $204.6 million 2 Prepayments 11 2014 & 2034 7.07% $190.5 million 3 Prepayments with Yield Maintenance 3 2015 6.39% $24.0 m
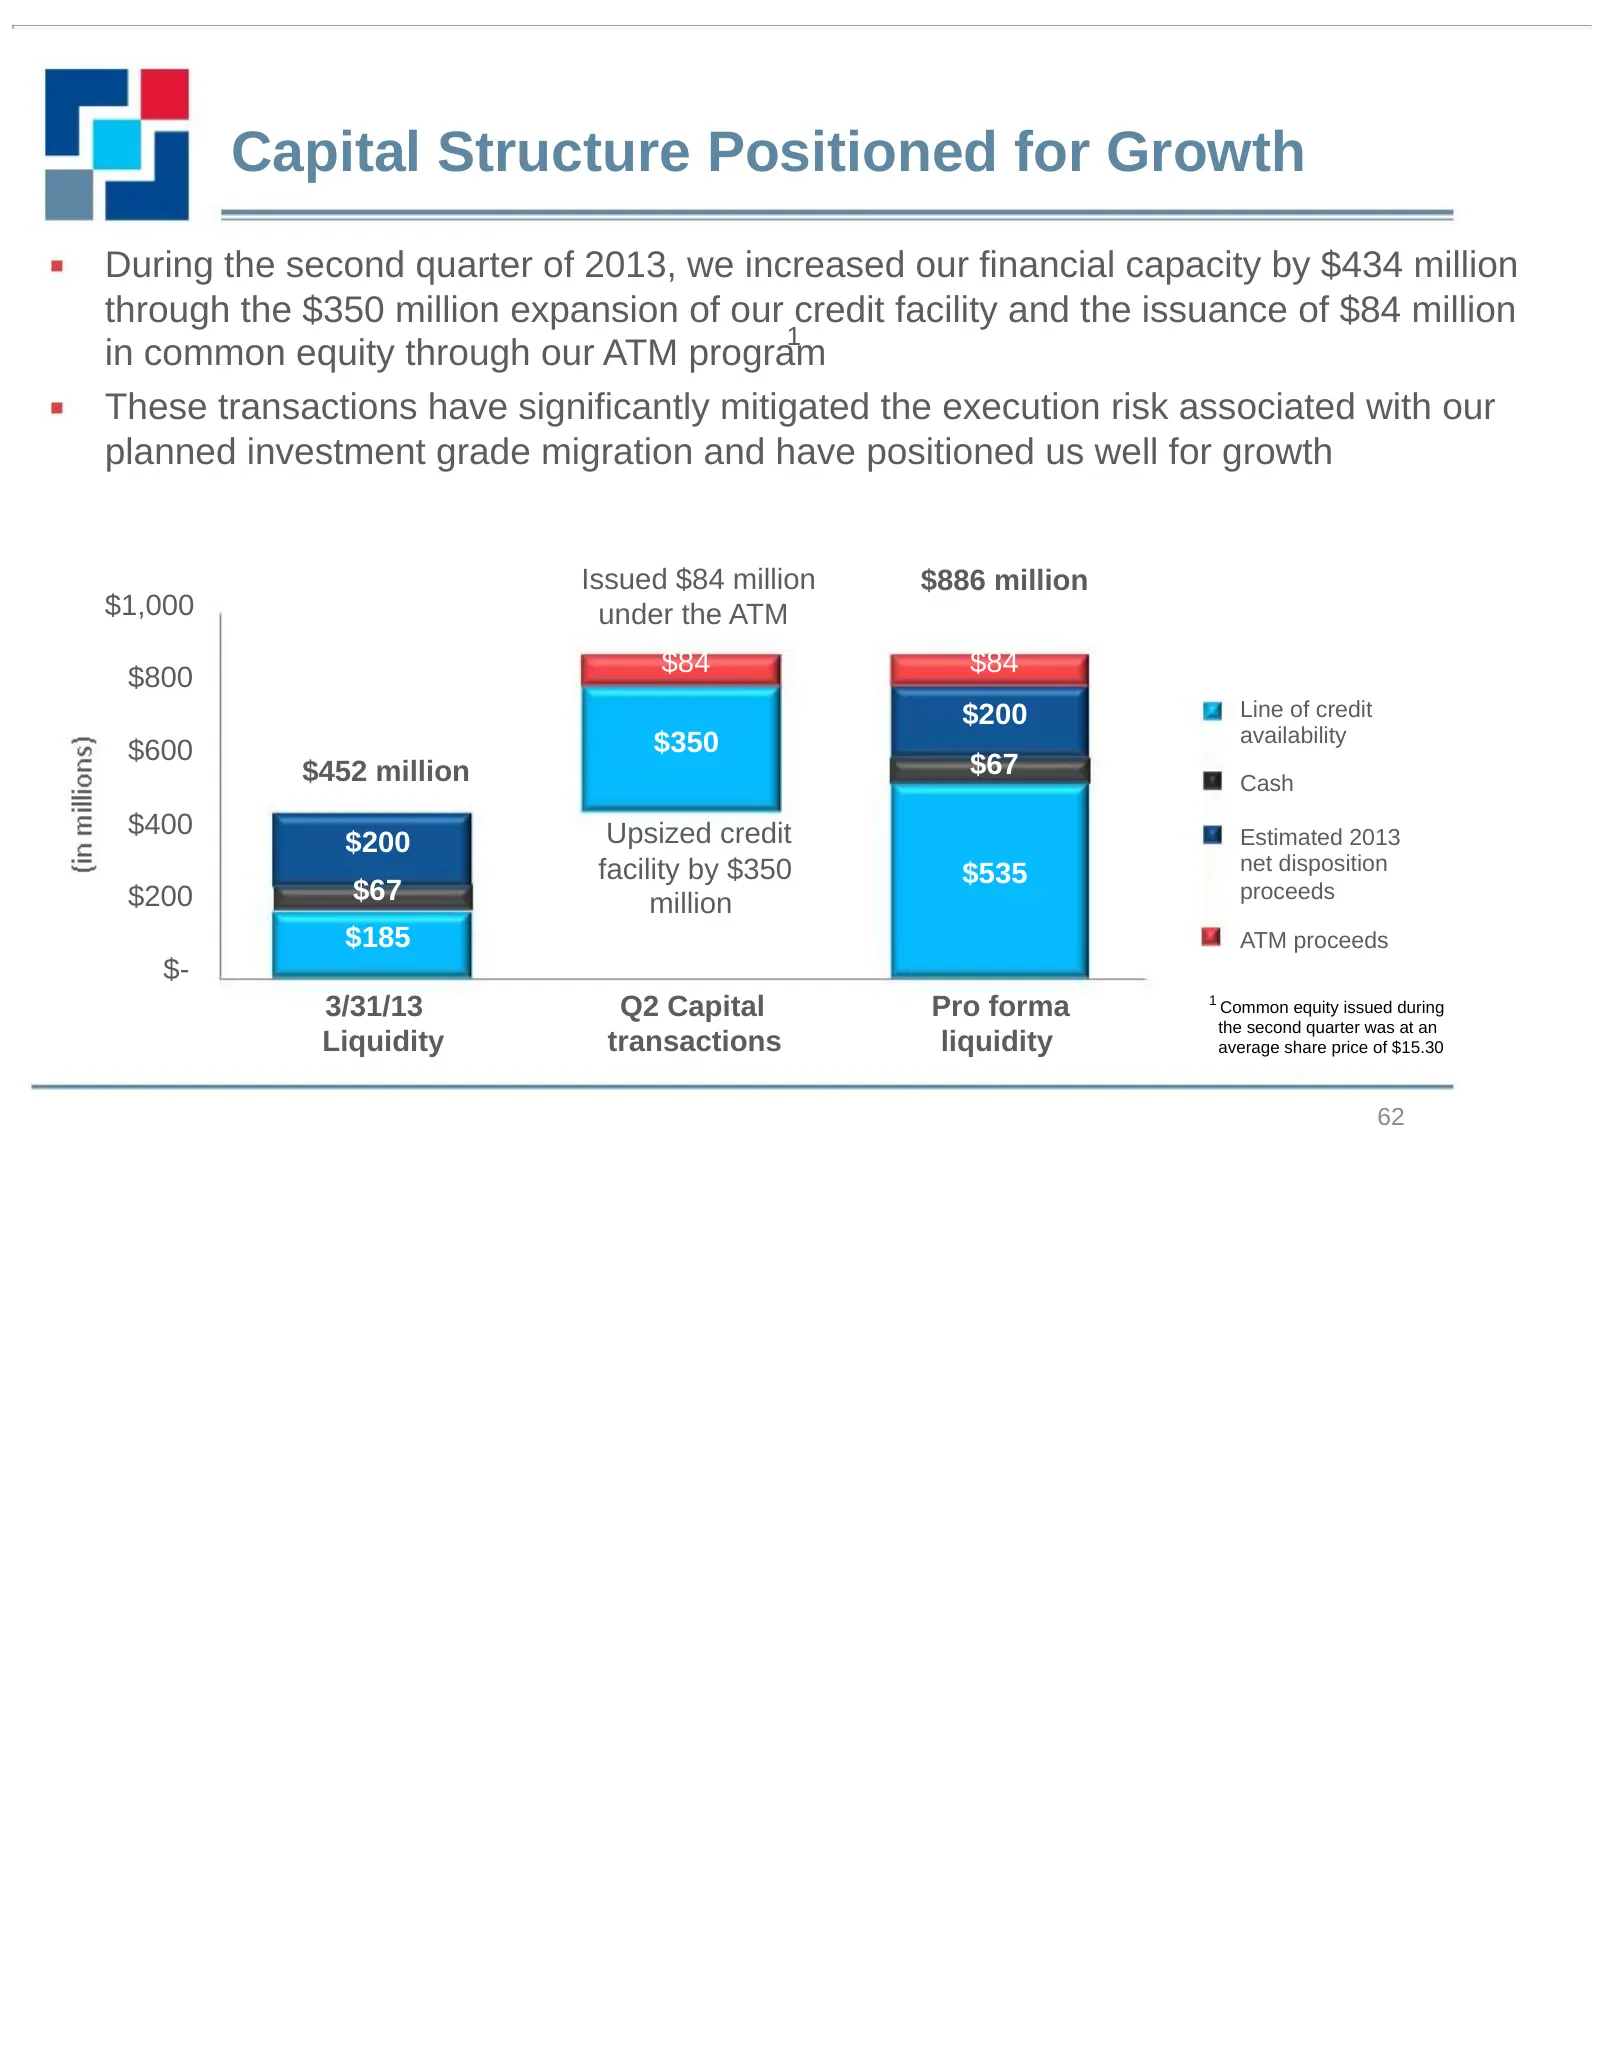
Slide 62: Capital Structure Positioned for Growth
Capital Structure Positioned for Growth During the second quarter of 2013, we increased our financial capacity by $434 million through the $350 million expansion of our credit facility and the issuance of $84 million 1 in common equity through our ATM program These transactions have significantly mi
Slide 63: Non-GAAP Reconciliations
Appendix Non-GAAP Reconciliations 63
Slide 64: Non-GAAP Financial Measures and Other Definitions
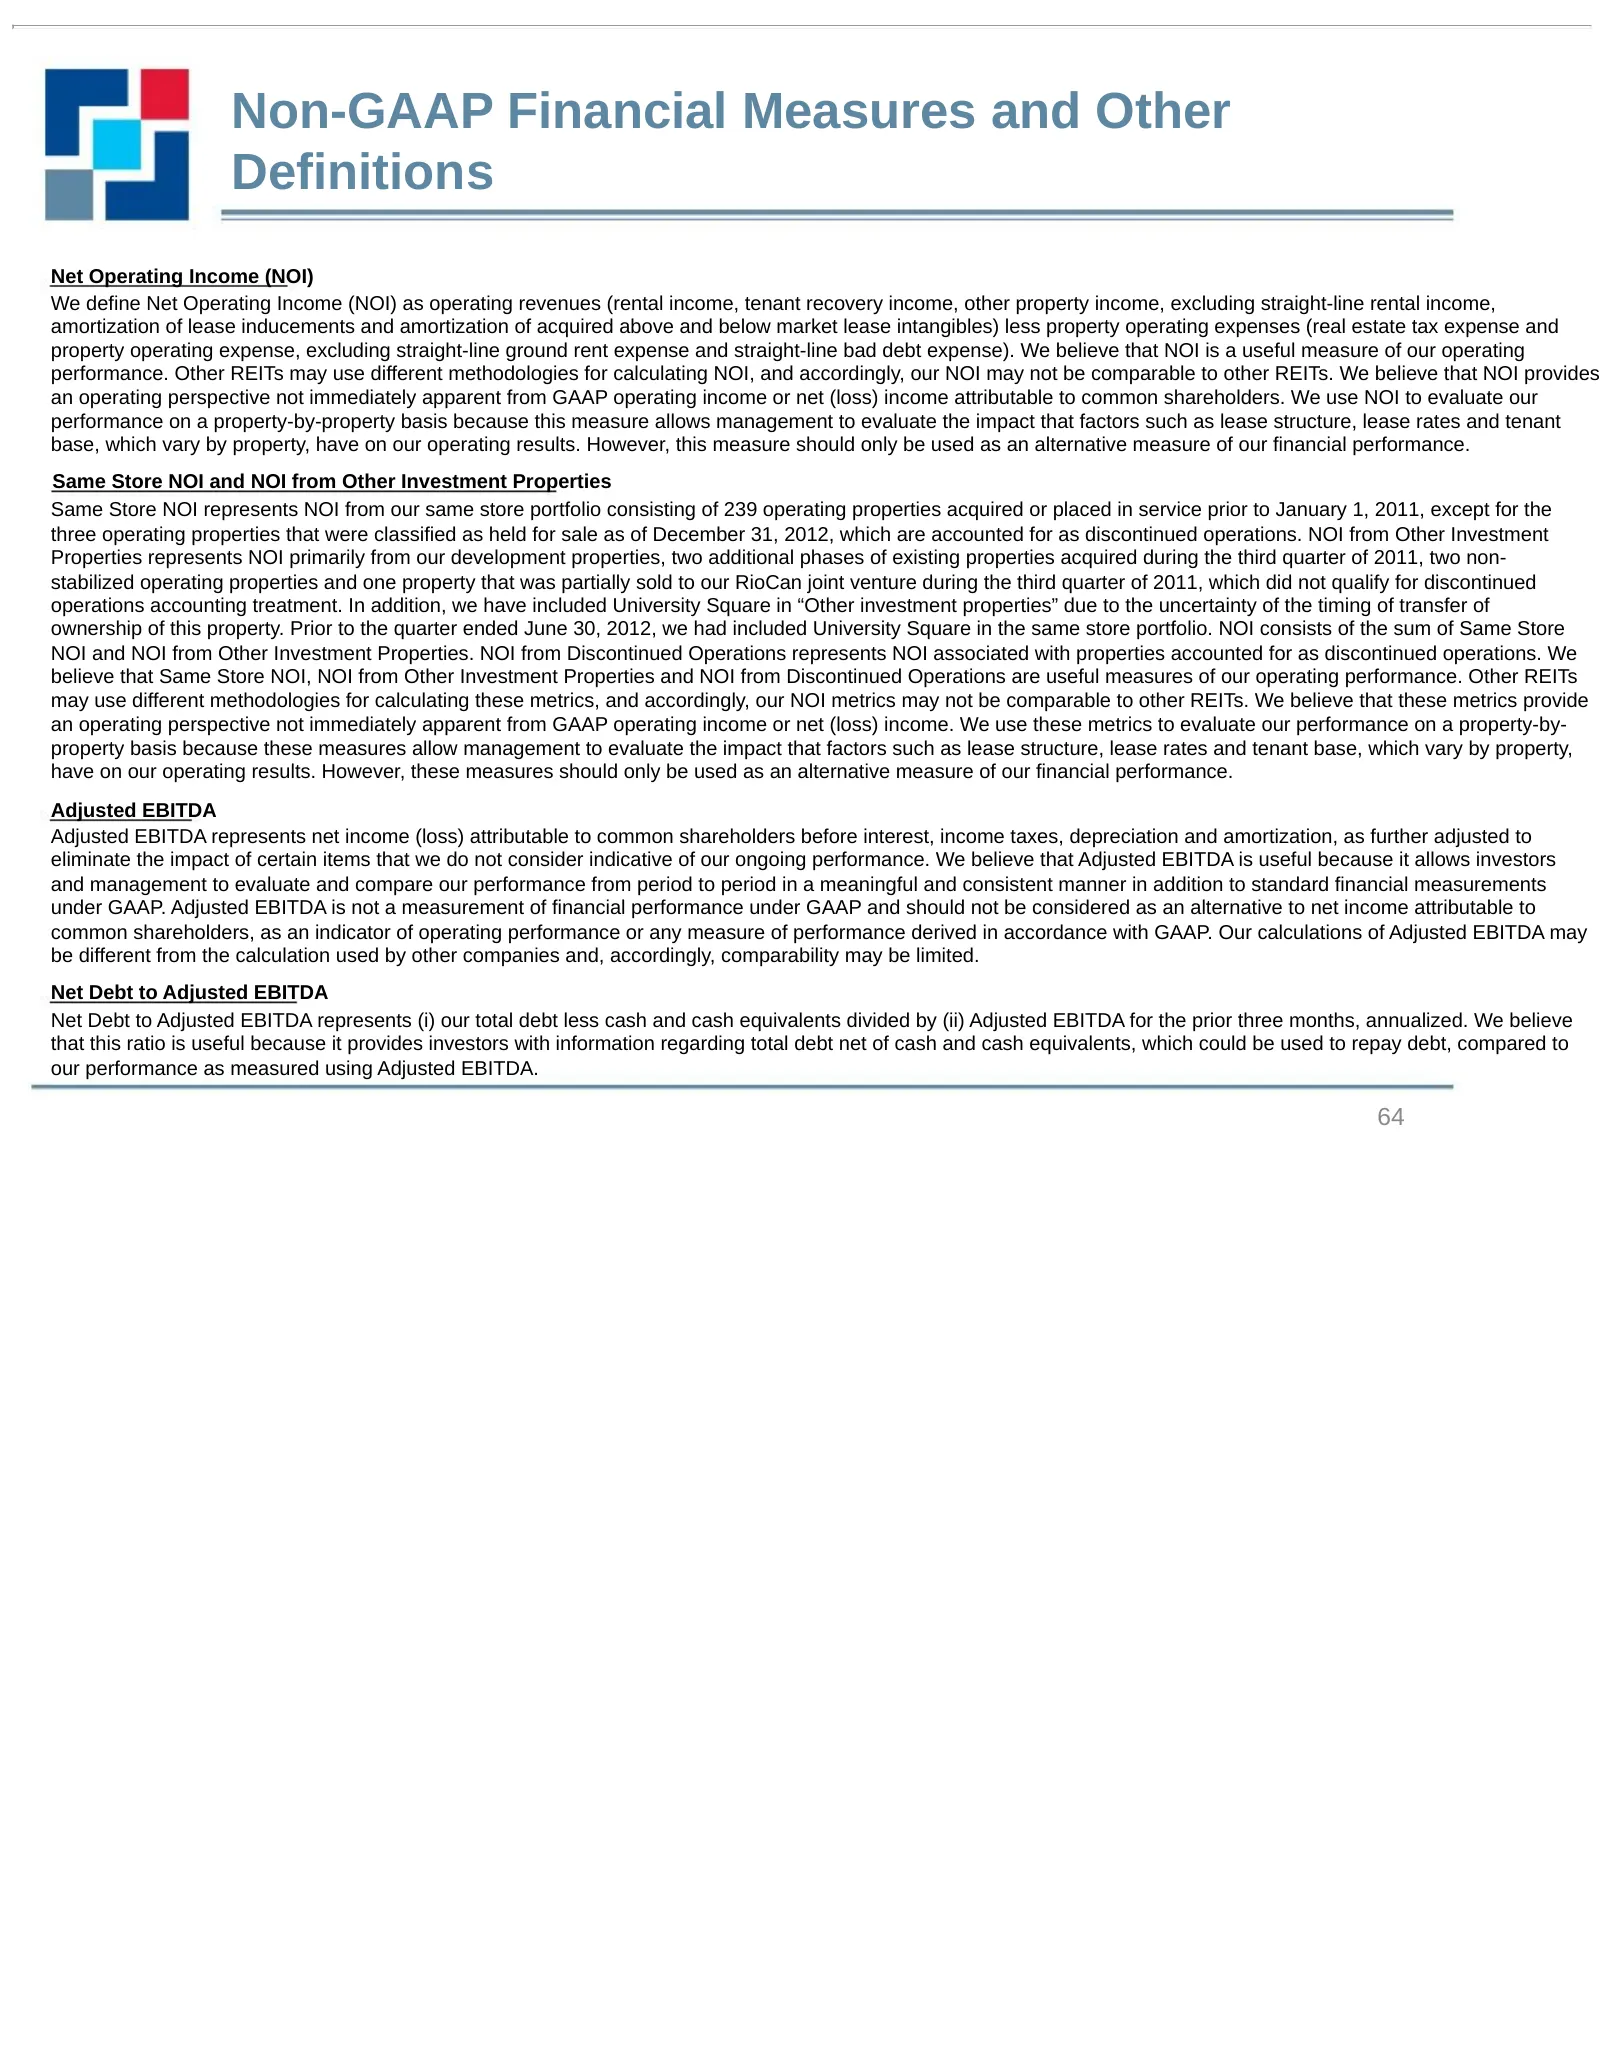
Non-GAAP Financial Measures and Other Definitions Net Operating Income (NOI) We define Net Operating Income (NOI) as operating revenues (rental income, tenant recovery income, other property income, excluding straight-line rental income, amortization of lease inducements and amortization of acquired
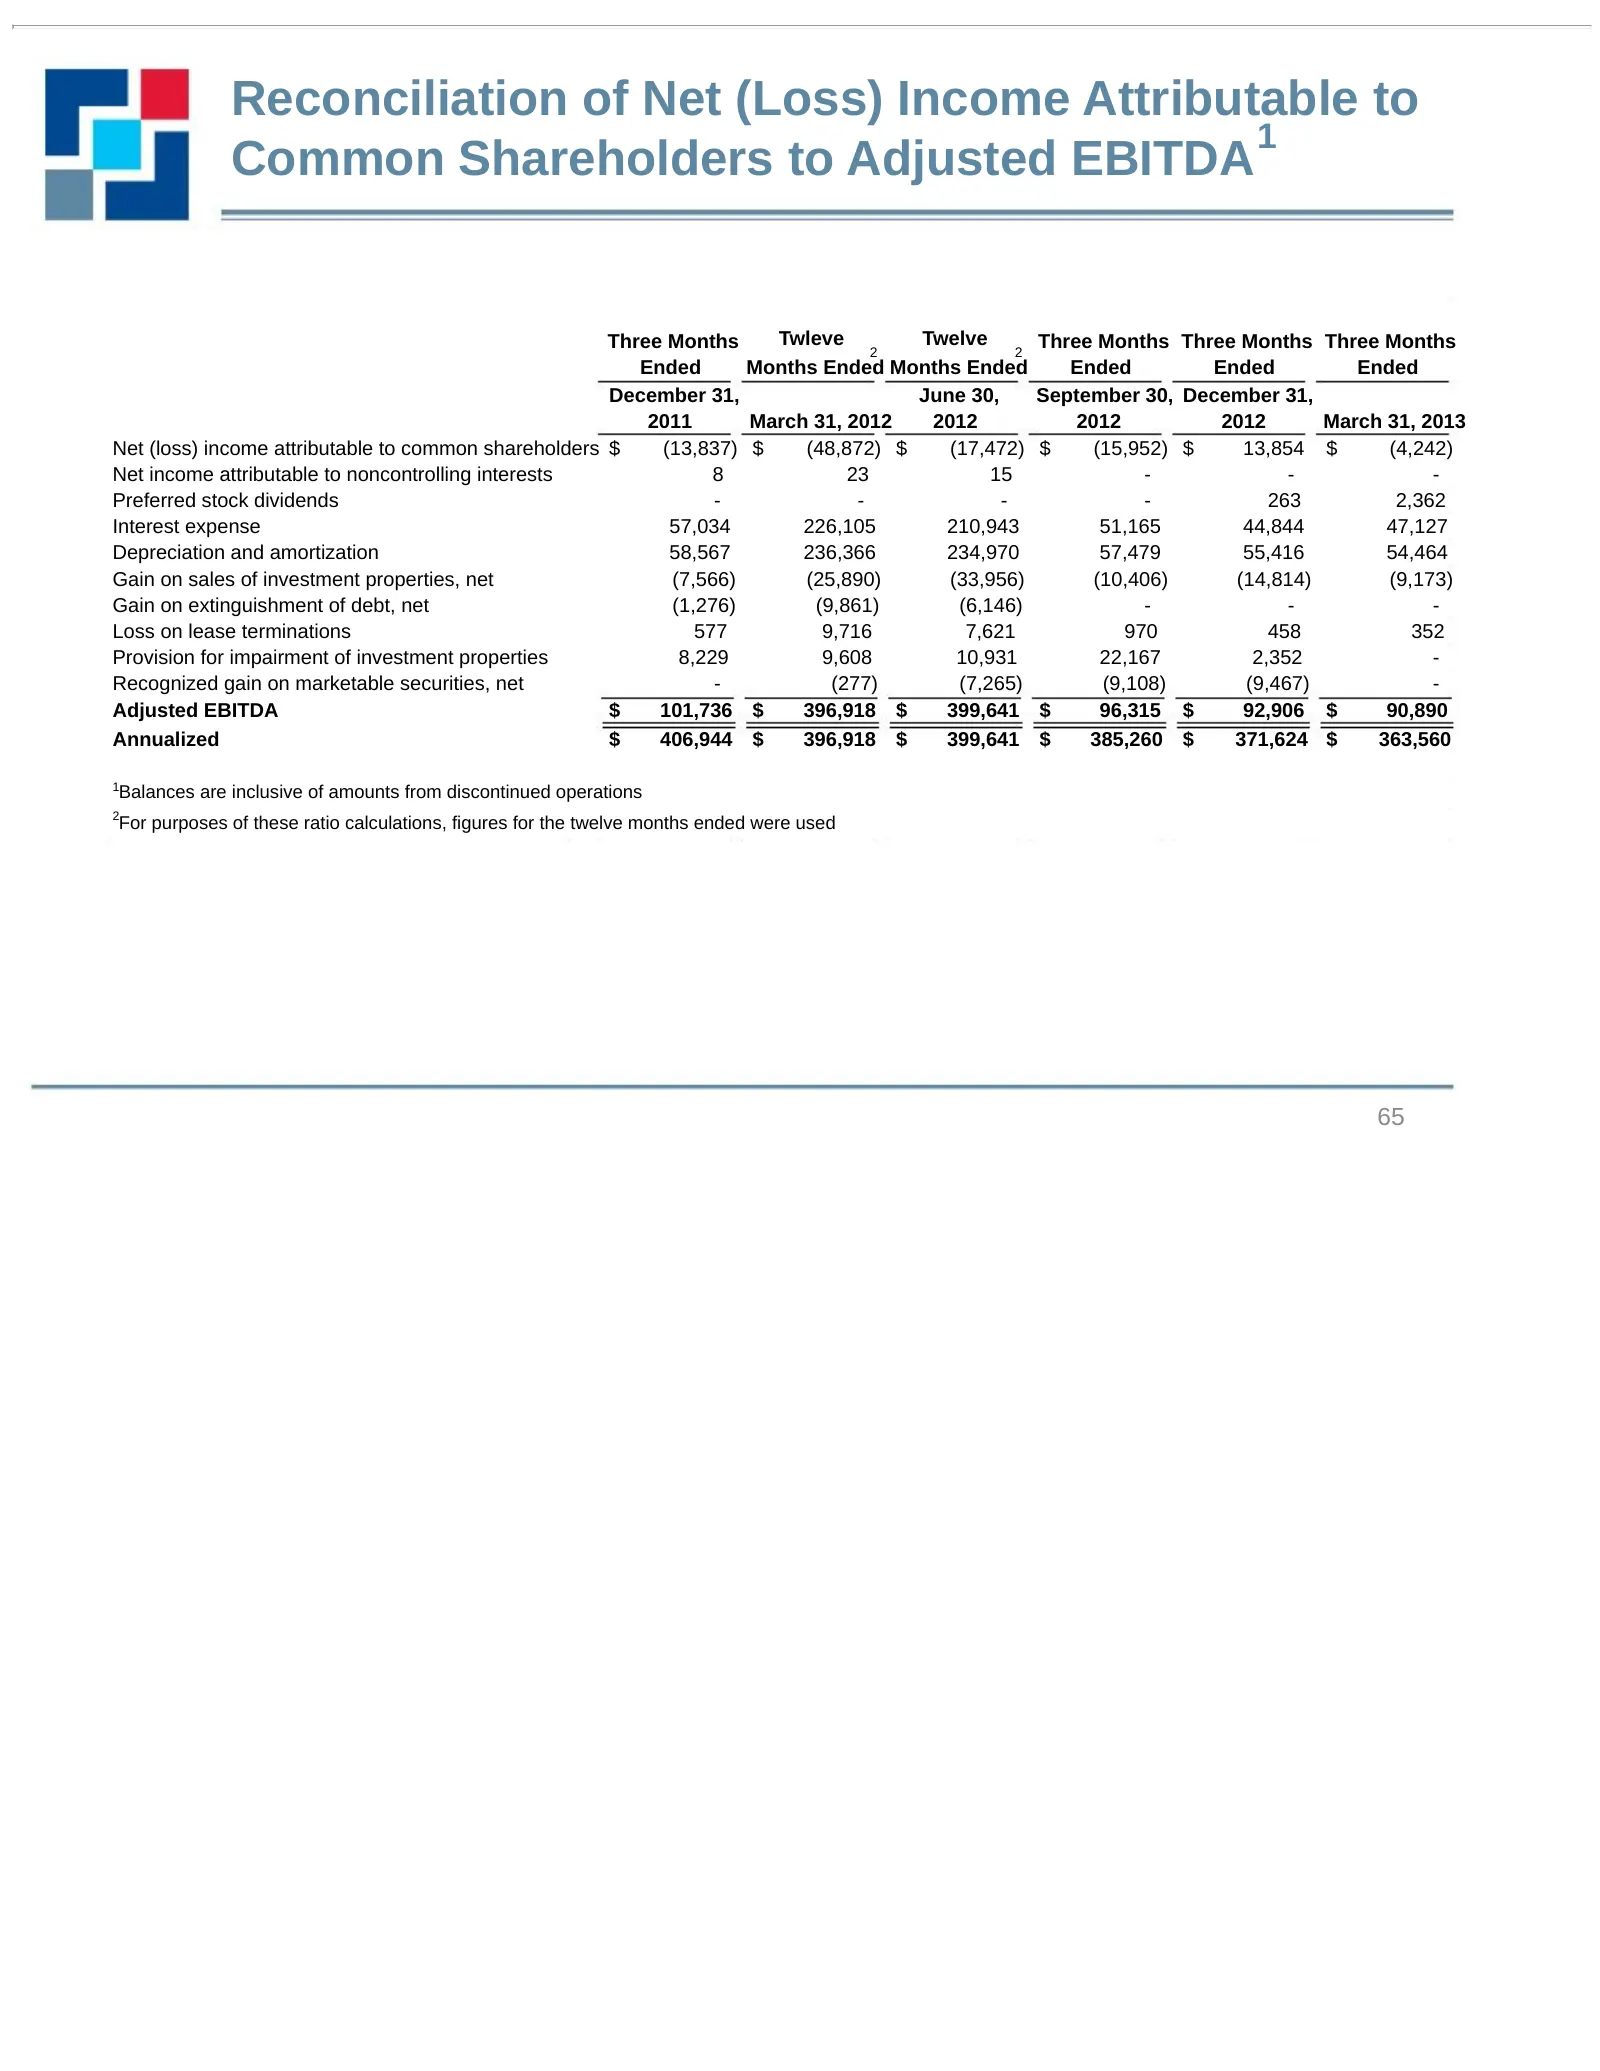
Slide 65: Reconciliation of Net (Loss) Income to Adjusted EBITDA
Reconciliation of Net (Loss) Income Attributable to 1 Common Shareholders to Adjusted EBITDA Three Months Twleve Twelve Three Months Three Months Three Months 2 2 Ended Months Ended Months Ended Ended Ended Ended December 31, June 30, September 30, December 31, 2011 March 31, 2012 2012 2012 2012 Mar
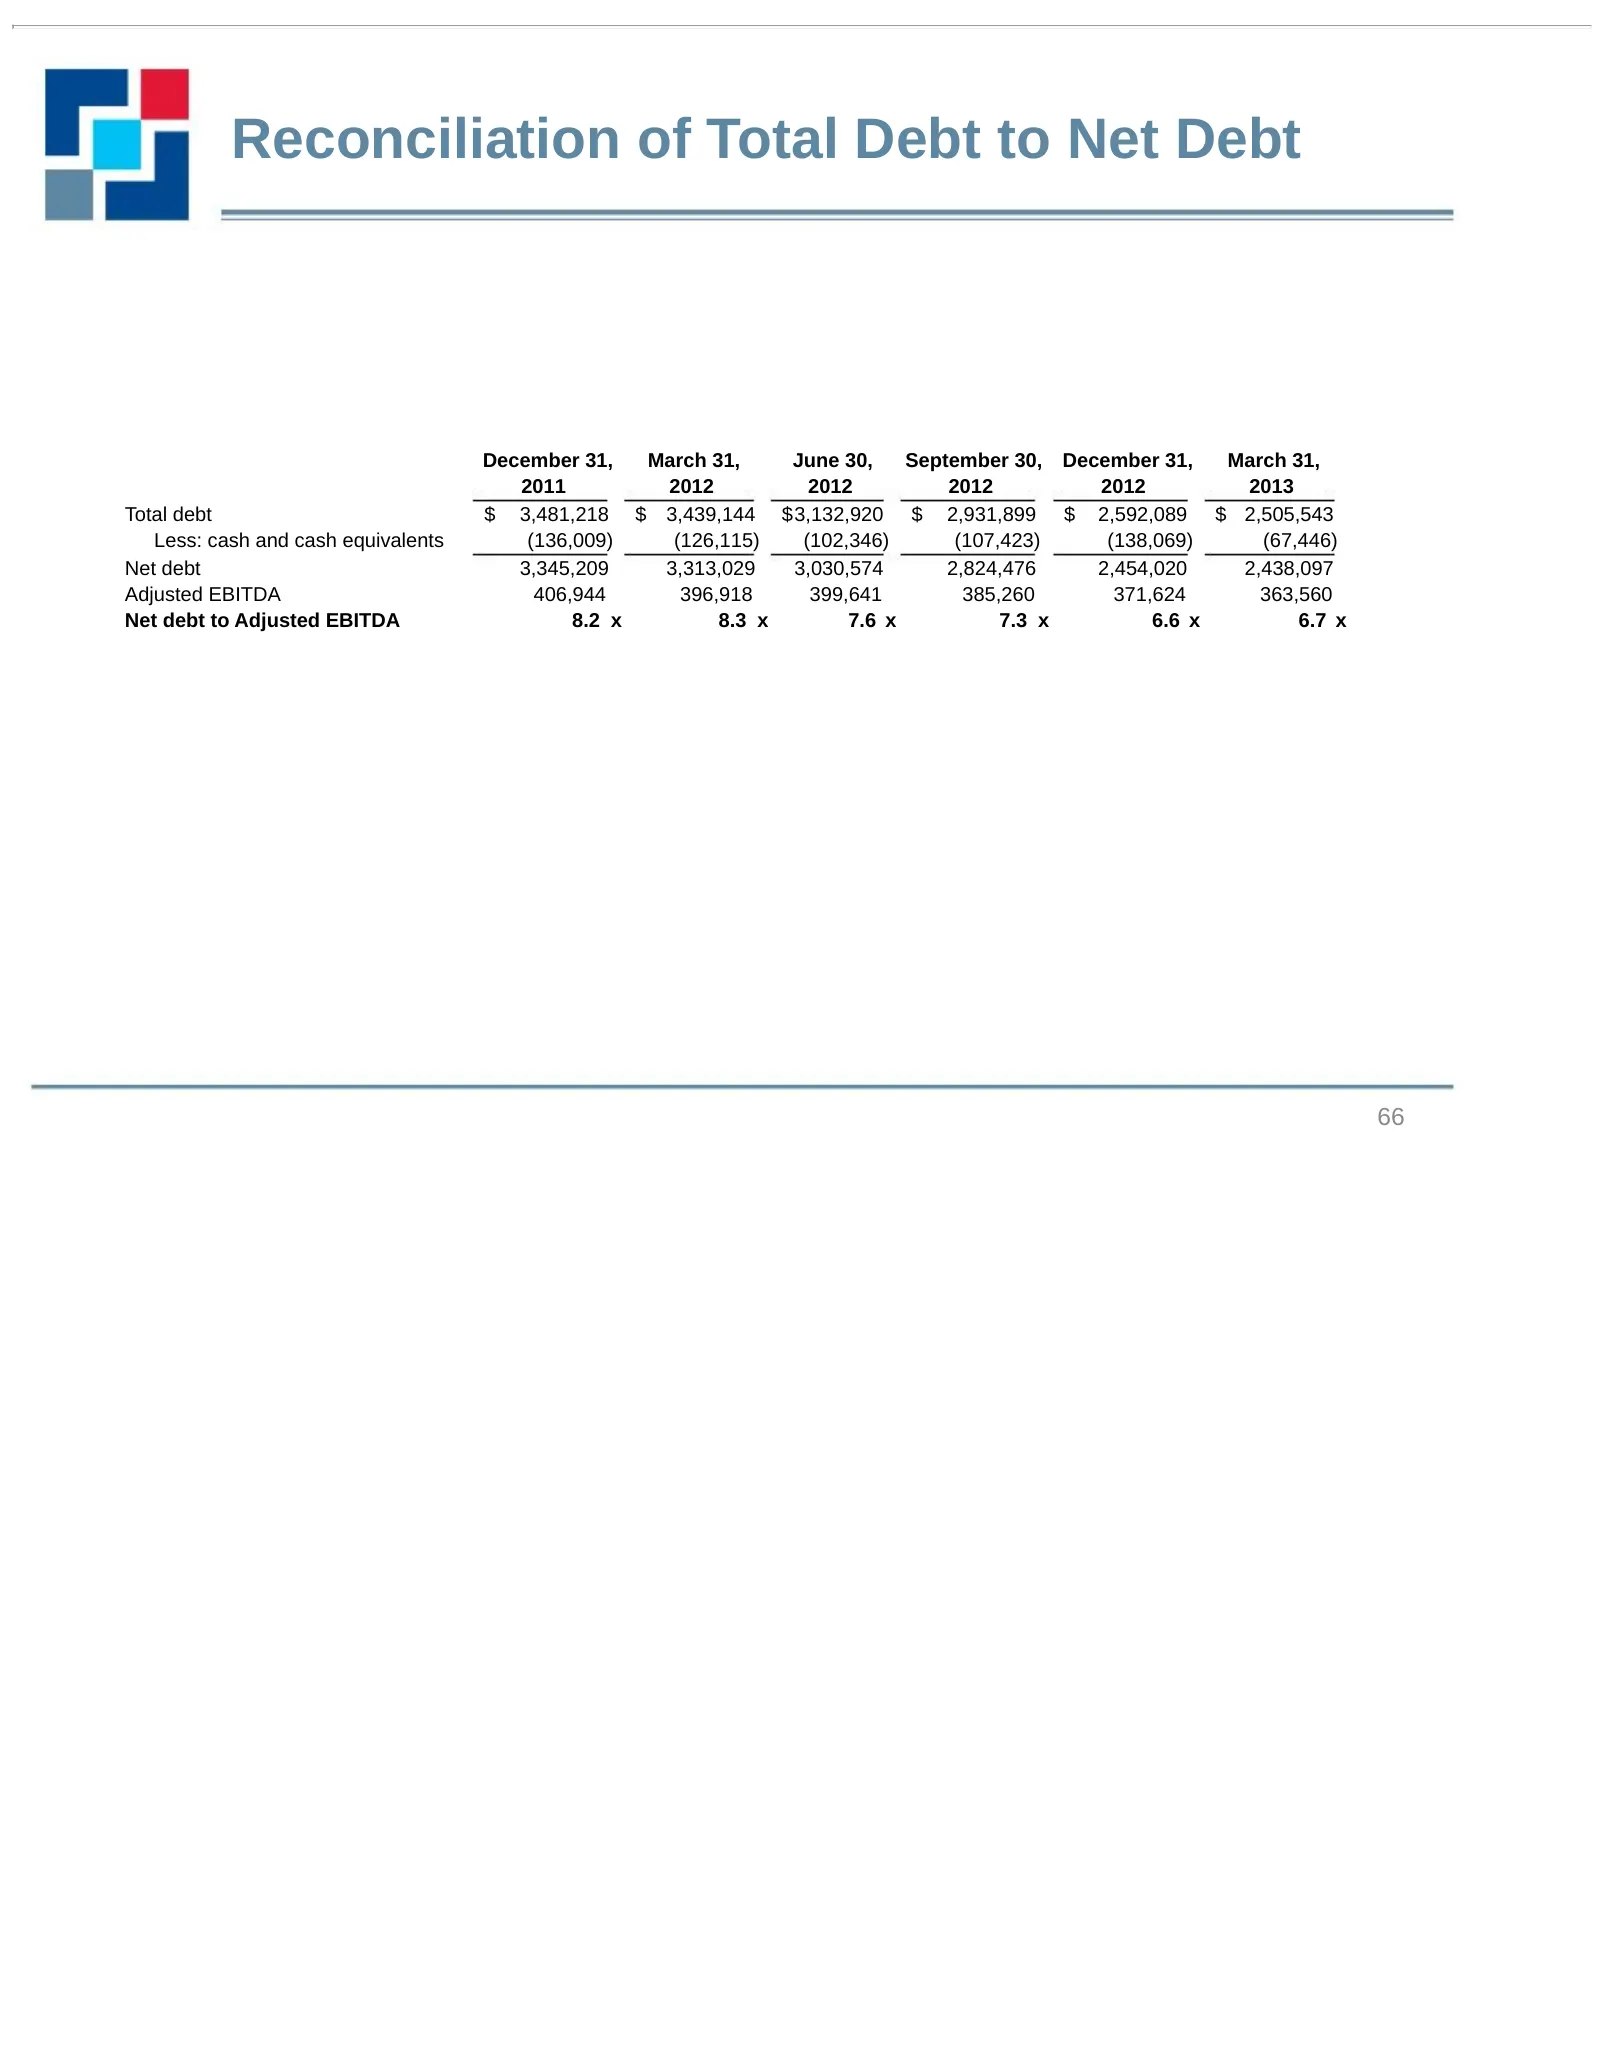
Slide 66: Reconciliation of Total Debt to Net Debt
Reconciliation of Total Debt to Net Debt December 31, March 31, June 30, September 30, December 31, March 31, 2011 2012 2012 2012 2012 2013 Total debt $ 3,481,218 $ 3,439,144 $ 3,132,920 $ 2,931,899 $ 2,592,089 $ 2,505,543 Less: cash and cash equivalents (136,009) (126,115) (102,346) (107,423) (138,
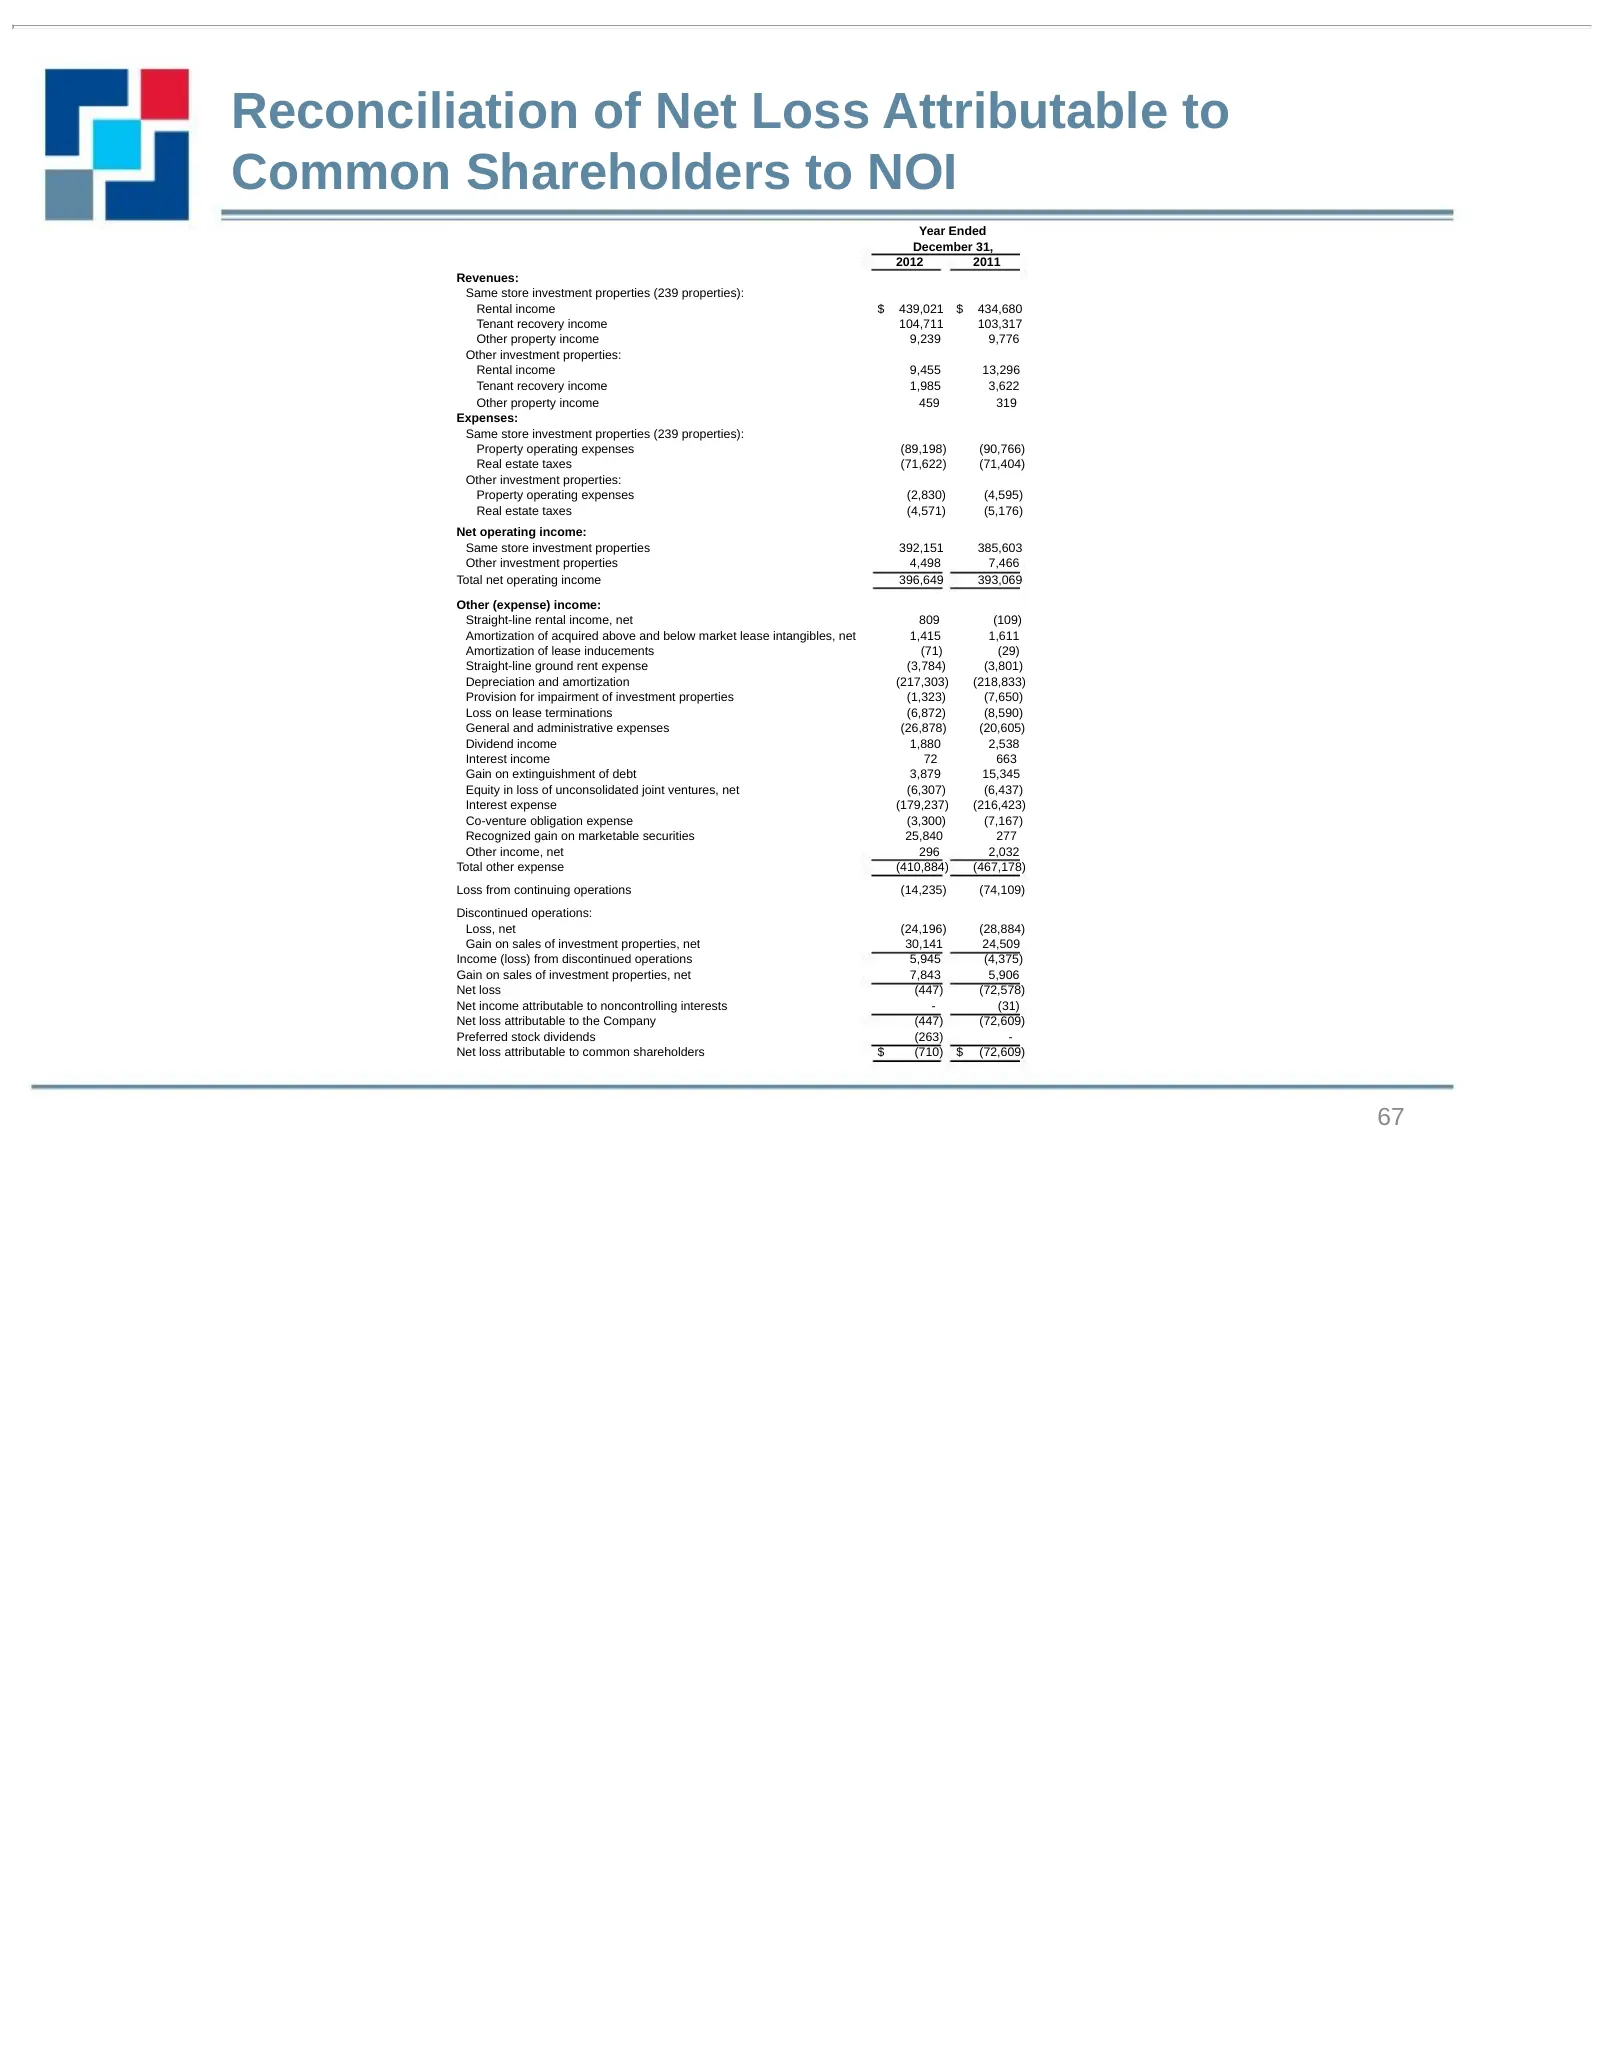
Slide 67: Reconciliation of Net Loss Attributable to Common Shareholders to NOI
Reconciliation of Net Loss Attributable to Common Shareholders to NOI Year Ended December 31, 2012 2011 Revenues: Same store investment properties (239 properties): Rental income $ 439,021 $ 434,680 Tenant recovery income 104,711 103,317 Other property income 9,239 9,776 Other investment properties:
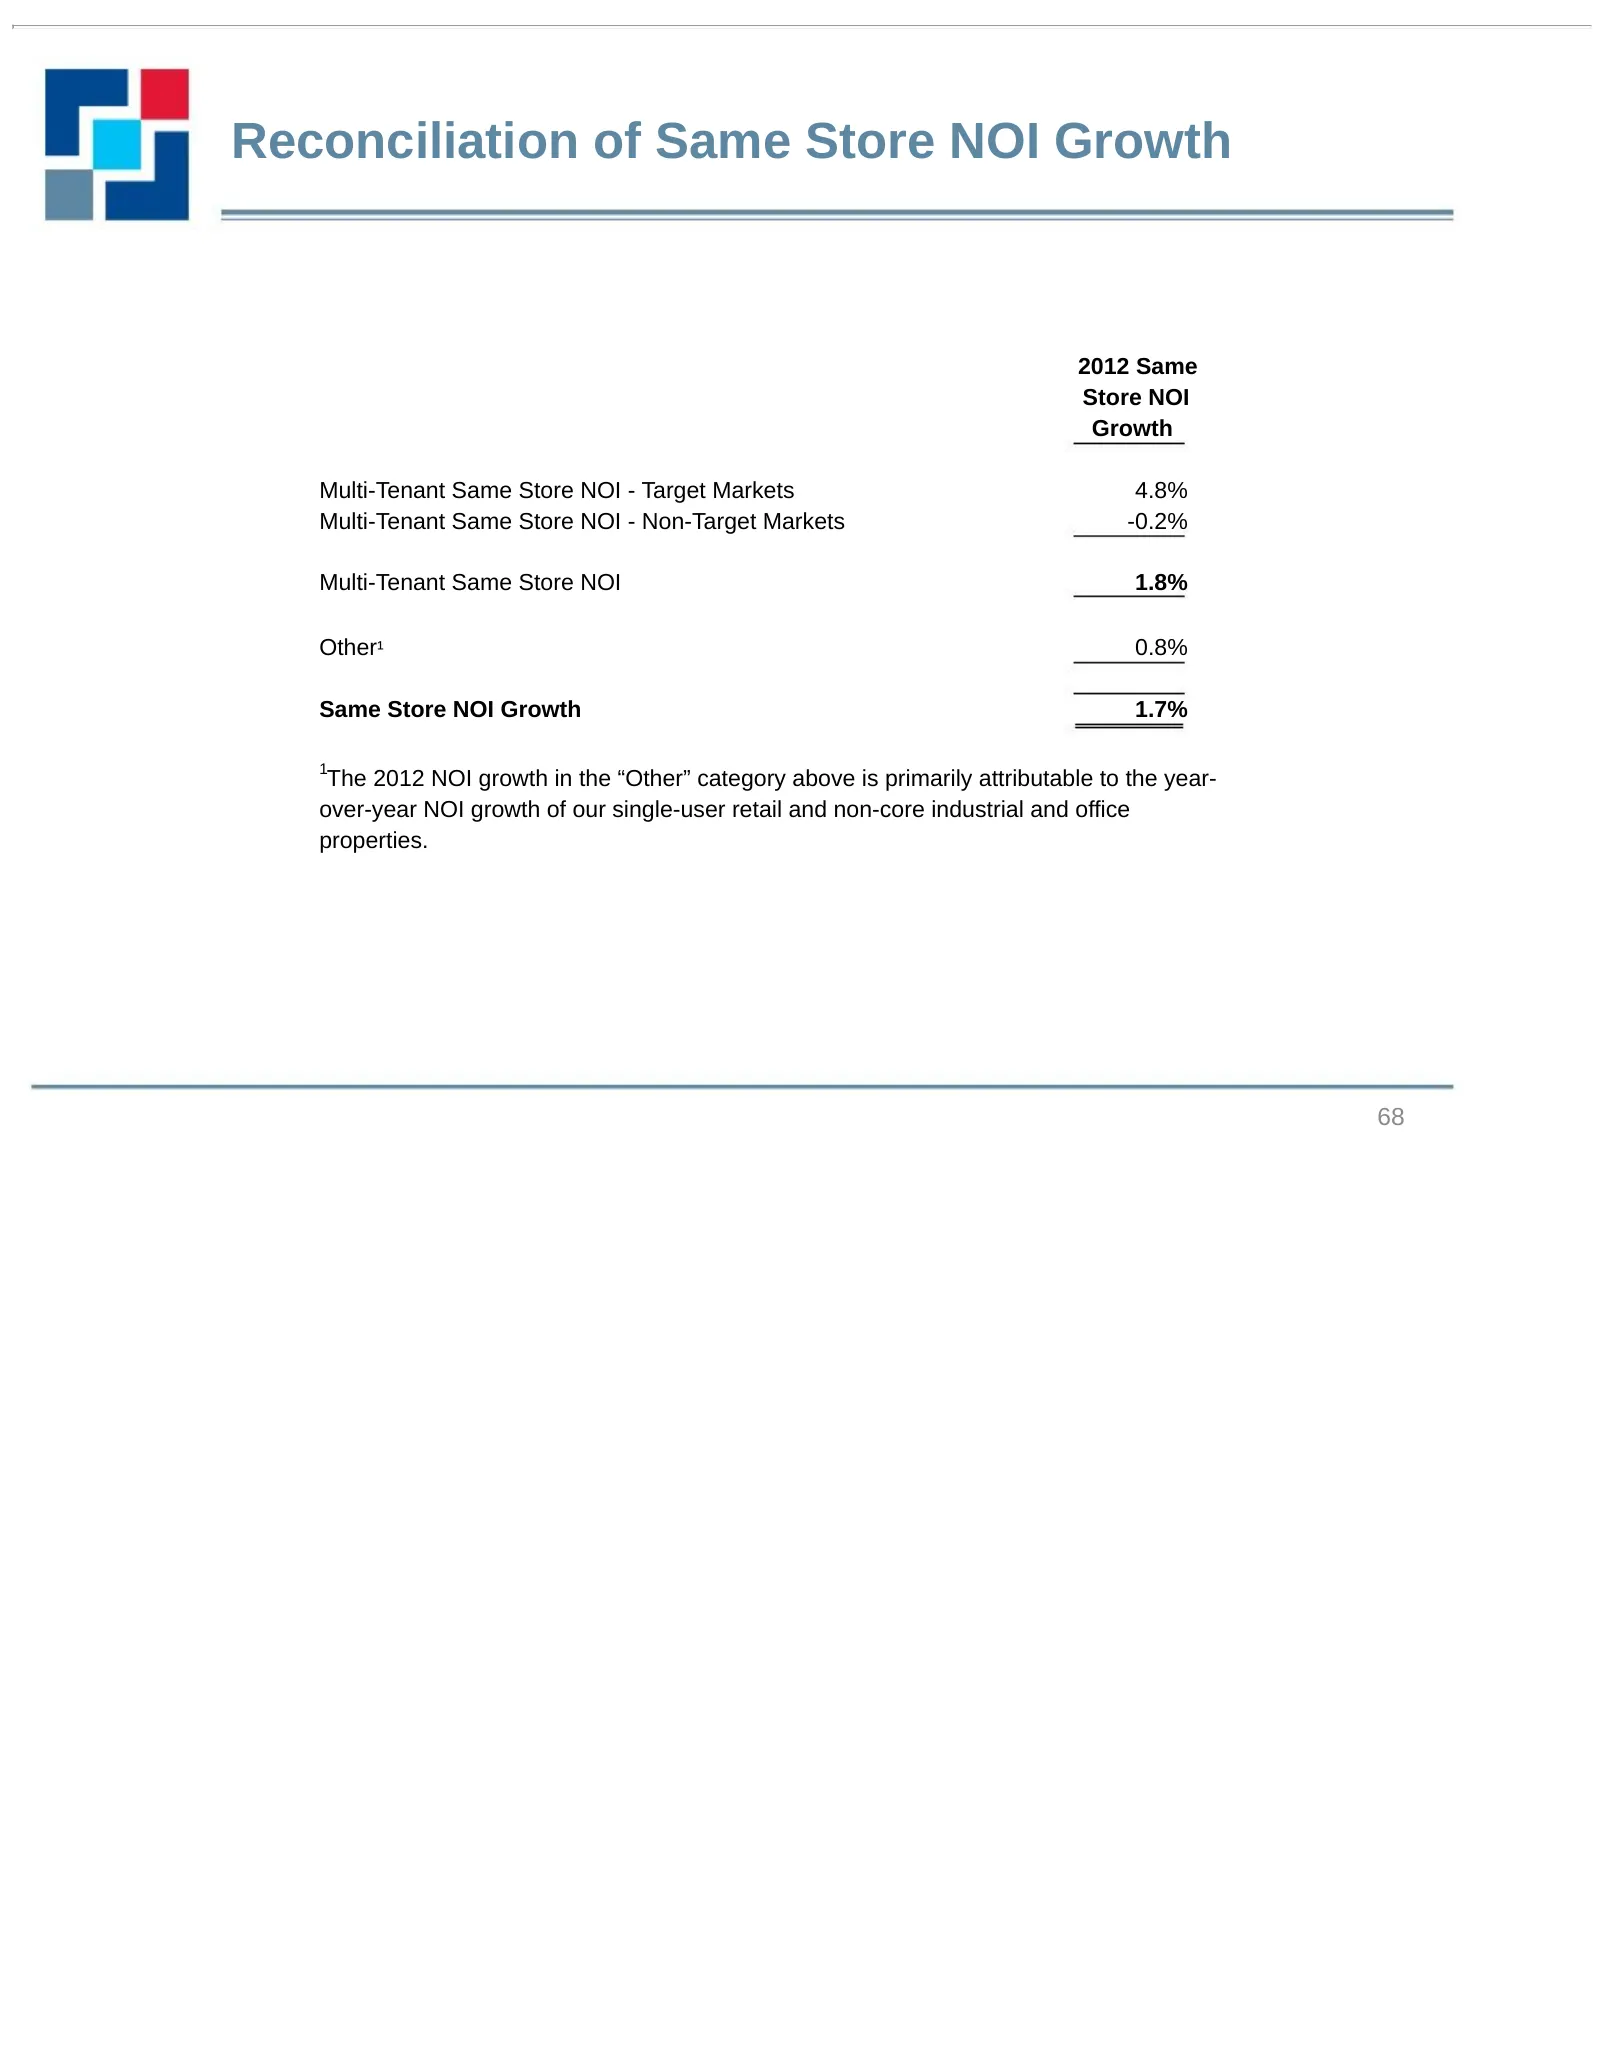
Slide 68: Reconciliation of Same Store NOI Growth
Reconciliation of Same Store NOI Growth 2012 Same Store NOI Growth Multi-Tenant Same Store NOI - Target Markets 4.8% Multi-Tenant Same Store NOI - Non-Target Markets -0.2% Multi-Tenant Same Store NOI 1.8% Other¹ 0.8% Same Store NOI Growth 1.7% 1 The 2012 NOI growth in the “Other” category above is p
Source: SEC EDGAR · 8-K filed Jun 27, 2013
More decks from Retail Properties of America Inc
 Merger or Acquisition (July 2021)17 slides · Jul 19, 2021
 Investor Presentation (July 2020)23 slides · Jul 17, 2020
 Q2 2019 Earnings Presentation5 slides · Jul 30, 2019
 Investor Day (September 2016)100 slides · Sep 21, 2016
 Q4 2012 Earnings Presentation21 slides · Feb 26, 2013
 Investor Presentation (November 2012)26 slides · Nov 13, 2012