Retail Properties of America Inc
Retail Properties of America — Investor Presentation (November 2012)
26 slides from Retail Properties of America's investor presentation, Nov 13, 2012

Slide 1: Investor Presentation November 2012
Exhibit 99.1 Investor Presentation November 2012
Slide 2: Forward-looking statements
‘This presentation contains “Torward-looking statements” within the meaning of the safe harbor fcom ehl ability provided for such statements by the Private Securities Ltgation Reform Act of 1995 (set forth in Section 27A of the Securities Act of 1933, as amended, or the Securities Act, and Section 2

Slide 3: Investment Highlights
Investment Highlights Large, diversified, high quality retail portfolio Significant ability to enhance value through additional occupancy growth Diversified base of value-oriented retail tenants Opportunity to enhance portfolio and balance sheet through dispositions of non-core and non-strategic ass

Slide 4: Strong 3Q12 Financial & Operational Performance
Strong 3Q12 Financial & Operational Performance Reported 3Q12 Operating FFO of $0.21 per share Reported YTD same store NOI growth of +2.3% year-over-year Increased retail portfolio percent leased 250 bps year-over-year to 91.1% and increased retail portfolio occupancy 220 bps year-over-year to 88.4%
Slide 5: RPAI at a Glance
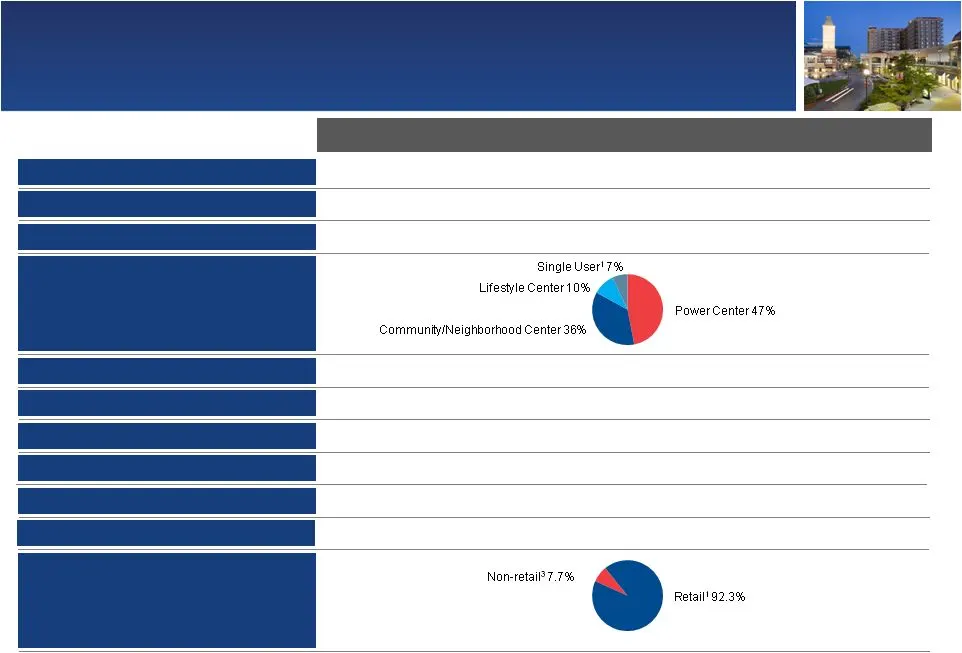
Number of properties Consolidated retail operating property summary Gross leasable area (GLA) Location Average portfolio age Occupancy / percent leased Annualized base rent (ABR) ABR per square foot Breakdown based on GLA Number of tenants Largest tenant Non-retail portfolio based on ABR RPAI at a G
Slide 6: Large Diversified Retail Portfolio
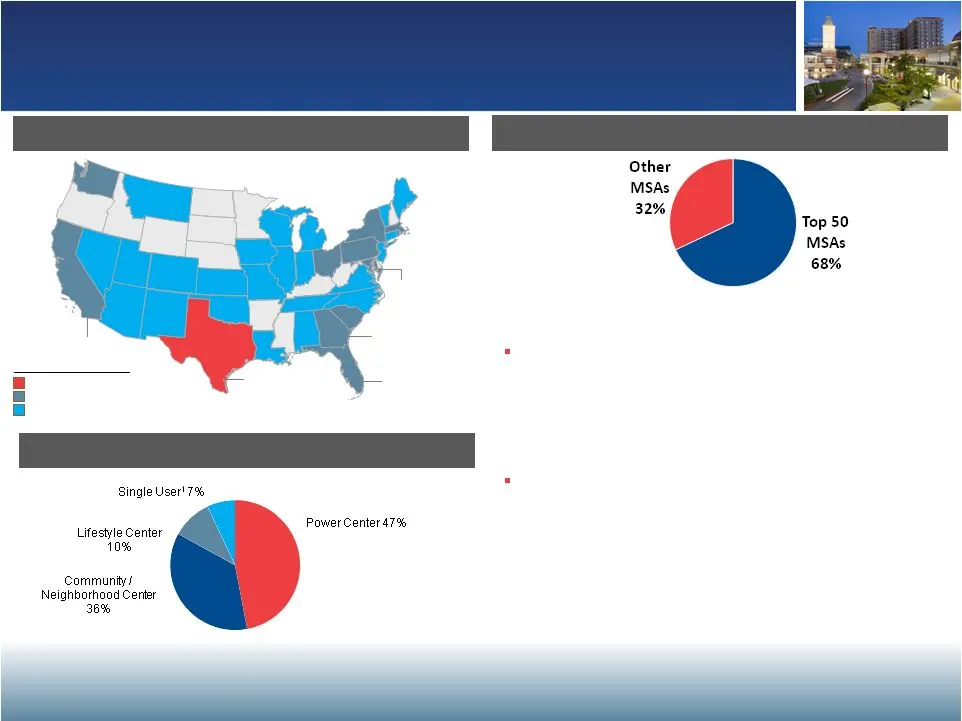
High geographic diversity Significant presence in top MSAs Breakdown based on GLA Large Diversified Retail Portfolio Strong multi-tenant 3-mile demographics in top 50 MSAs 68% of multi-tenant ABR located in top 50 Metropolitan Statistical Areas (MSAs) Gross Leasable Area (GLA) More than 5 M sq.ft. 1
Slide 7: Representative Properties
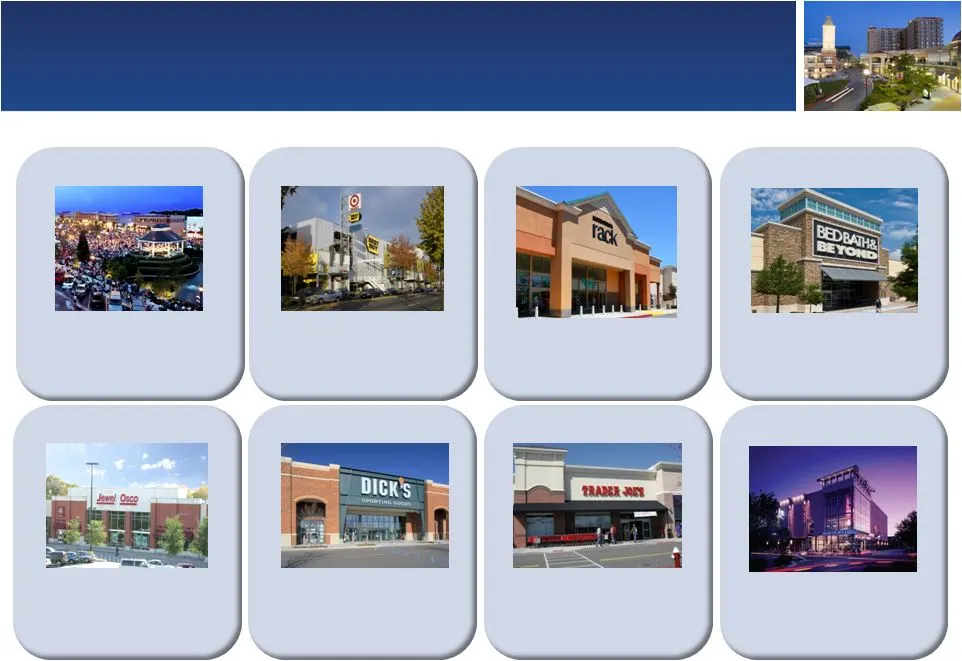
Representative Properties Power center – Summerville, SC GLA: 272,000 sq.ft. Leased : 99.2% ABR per leased sq.ft.: $13.47 Community center – Newport News, VA GLA: 306,000 sq.ft. Leased : 97.1% ABR per leased sq.ft.: $17.12 Community center – Denton, TX GLA: 339,000 sq.ft. Leased : 98.2% ABR per leas
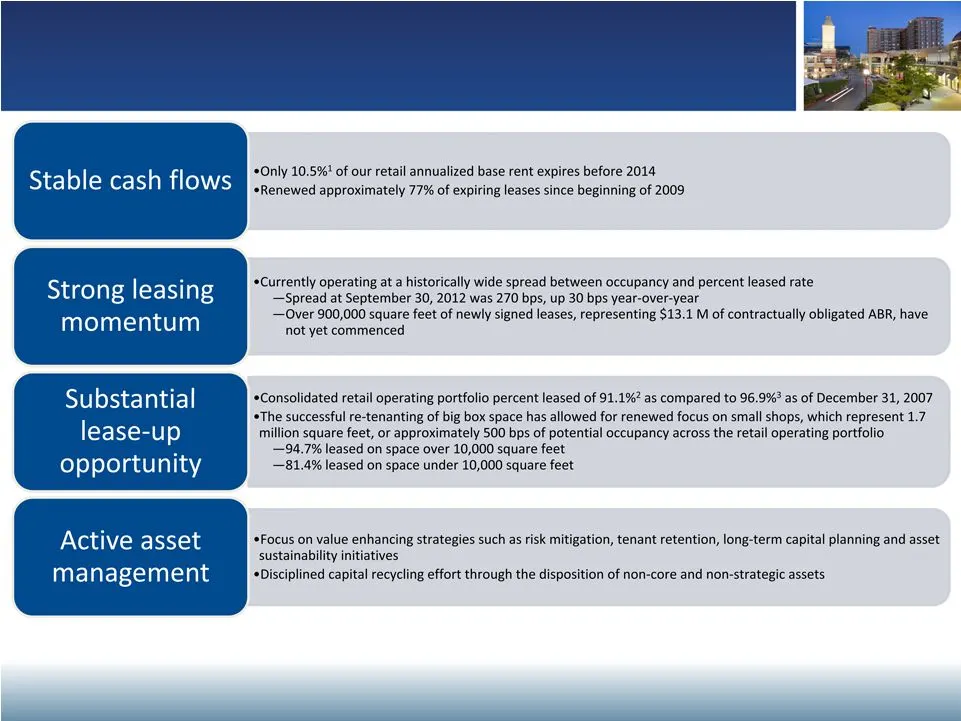
Slide 8: Maximizing NOI Through Internal Growth Enhancing Portfolio Value
Maximizing NOI Through Internal Growth Enhancing Portfolio Value Includes our pro rata share of unconsolidated joint ventures Includes leases signed but not commenced Includes only leases commenced Positioning RPAI for long-term value creation Positioning RPAI for long-term value creation
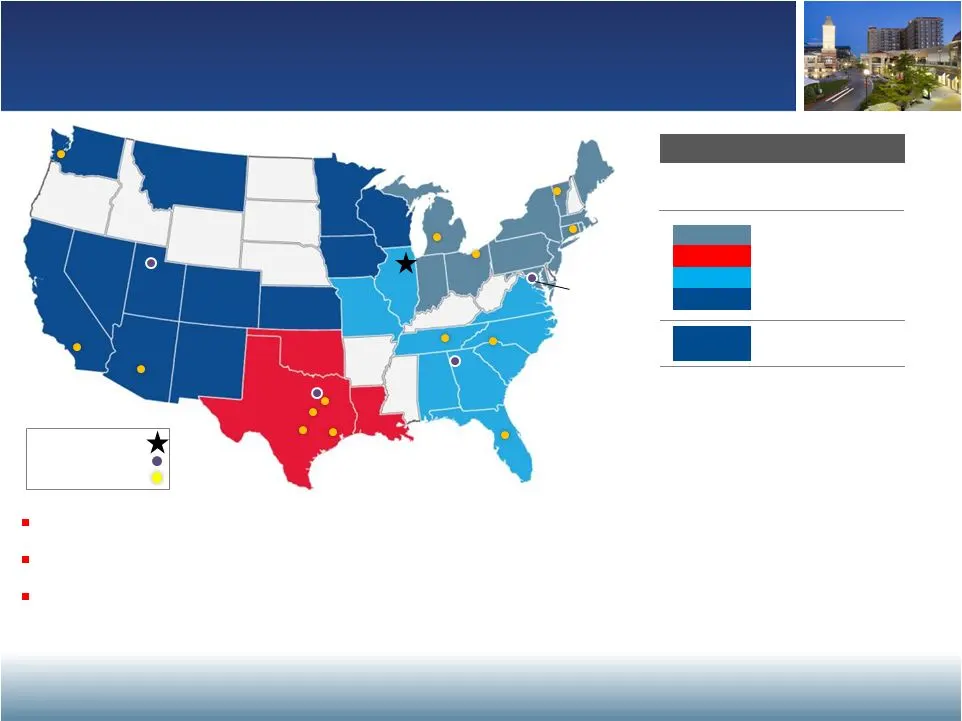
Slide 9: National Platform with Local Focus
Regional breakdown Total West East South North National Platform with Local Focus Salt Lake City Plano Oak Brook Client-focused organization with significant local and regional on-the-ground presence 19 strategically located property management offices Over 180 employees dedicated to operations, inc

Slide 10: Diversified Base of Value-Oriented Retail Tenants
Diversified Base of Value-Oriented Retail Tenants Total 428 13,449 $ 166,288 37.9% Top 20 retail tenants represent 37.9% of retail ABR ¹ Approximately 1,500 tenants with approximately 3,200 leases 29 tenants each lease space at more than 15 of our locations, representing 8.8 M square feet Over 90% o
Slide 11: Dominant Grocery Anchors Drive Traffic
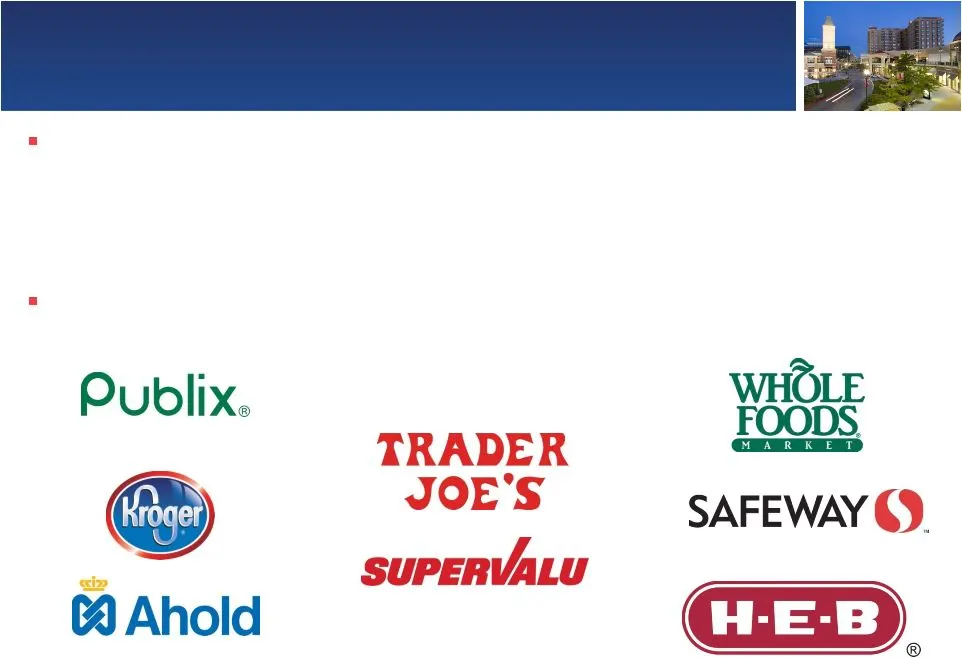
Dominant Grocery Anchors Drive Traffic Portfolio has strong line-up of grocery anchors — 74 of our 193 multi-tenant retail properties are anchored or shadow-anchored by a grocery store, and an additional 50 properties have a non-traditional grocery component Annual grocer sales average $25.2 M or $5
Slide 12: Non-Core and Non-Strategic Disposition Program Strengthening Balance Sheet
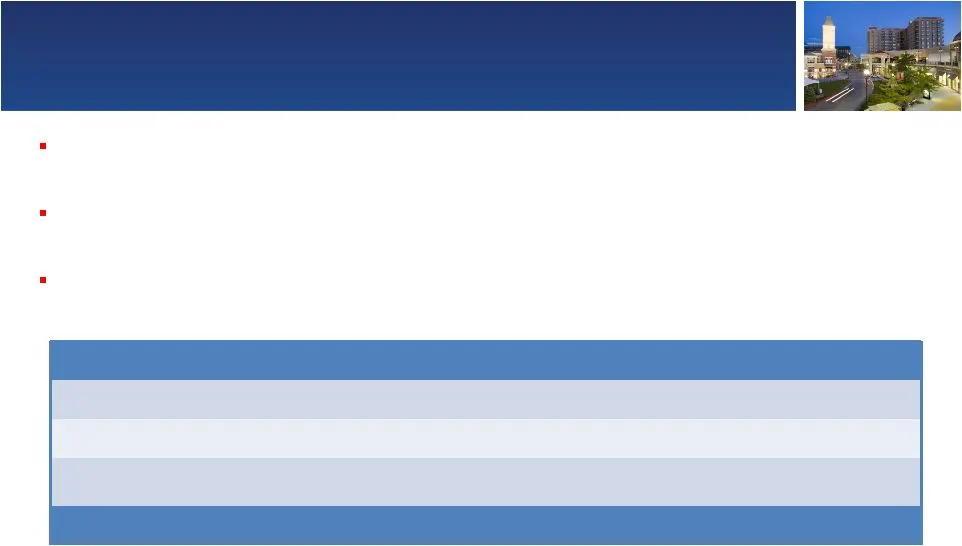
Non-Core and Non-Strategic Disposition Program Strengthening Balance Sheet Asset Type Estimated Closing Estimated Sale Proceeds Total $450 M - $550 M Year-to-date Various Closed $262 M Aon Office Building Non-core office Q4 $145 M - $160 M Other (including remaining Mervyns) Various Q4 $43 M - $128

Slide 13: Capital Markets & Financial Update
Capital Markets & Financial Update
Slide 14: Drive occupancy
Drive occupancy Grow same store NOI Reduce leverage Create staggered debt maturity profile Reduce share of non- core assets (ABR%)
Slide 15: Historical Leverage Profile
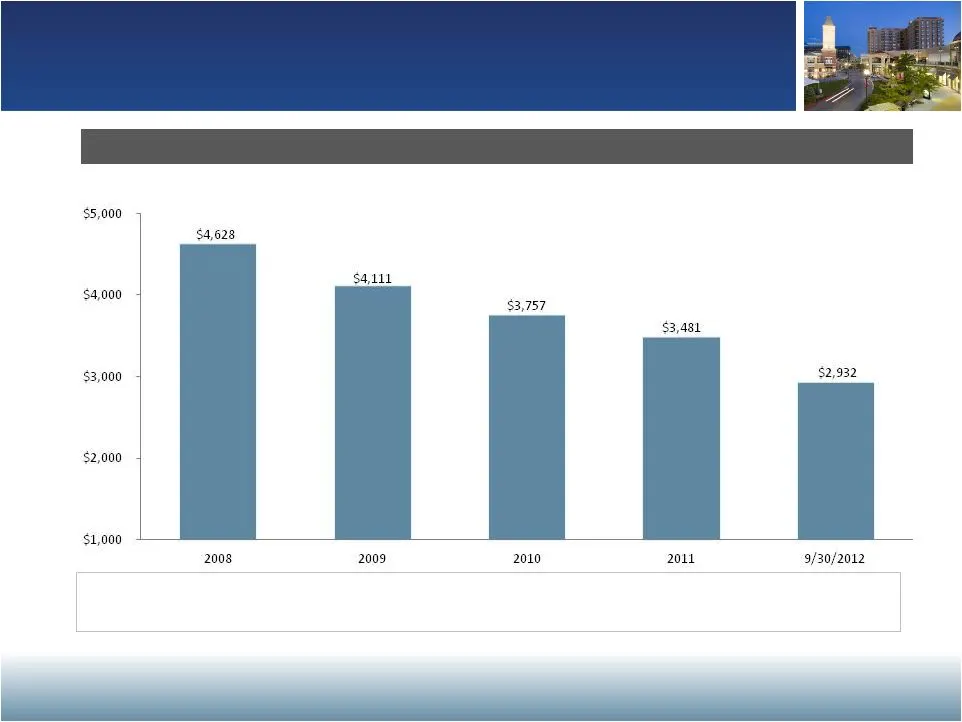
Historical Leverage Profile Total Consolidated Debt ($M) Combined Net Debt / Combined Adjusted EBITDA 9.9x 8.3x 7.3x 8.2x Improving our risk profile by reducing leverage Improving our risk profile by reducing leverage is a top priority is a top priority

Slide 16: Over $1.2 B of Capital Raised in 2012 Strengthening Balance Sheet
Over $1.2 B of Capital Raised in 2012 Strengthening Balance Sheet Raised $293 M of common equity and began trading on the NYSE in early April Closed a new $650 M unsecured credit facility in February, comprised of a $350 M revolver and a $300 M term loan — Available borrowings can increase to $850 M
Slide 17: Capital Structure Positioned for Growth
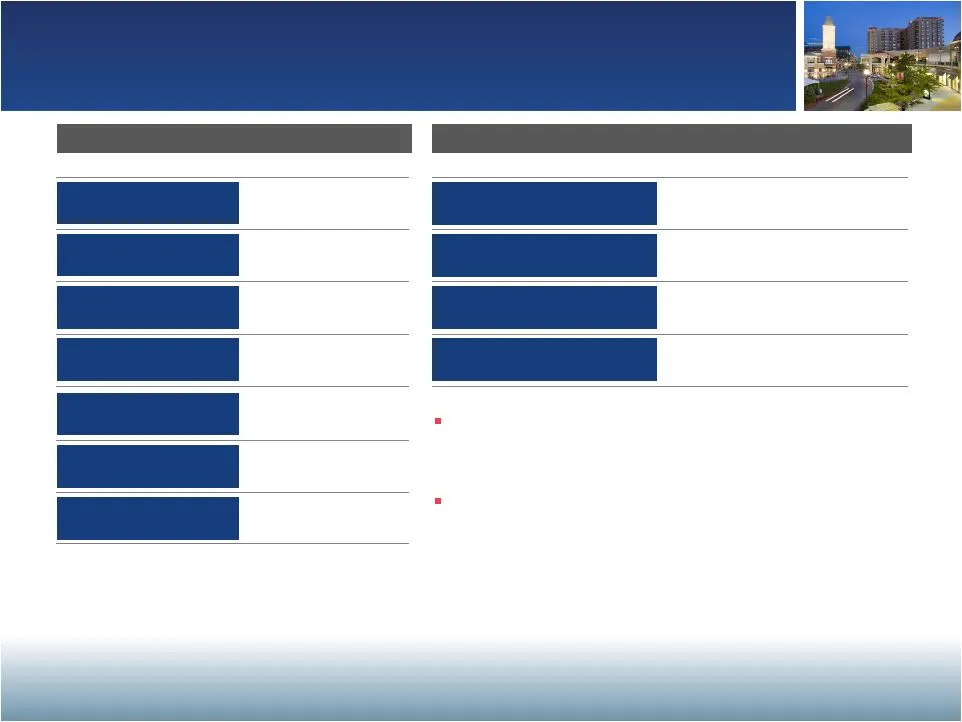
Capital Structure Positioned for Growth Capitalization ($M) Credit statistics Unsecured Revolving Line of Credit Unsecured Term Loan 1 Mortgage Debt Mezzanine Debt 1 Total Debt Less Cash Net Debt Combined Net Debt to Combined Adjusted EBITDA Fixed Rate Debt Weighted Average Maturity Weighted Average
Slide 18: Manageable Near-Term Debt Maturities
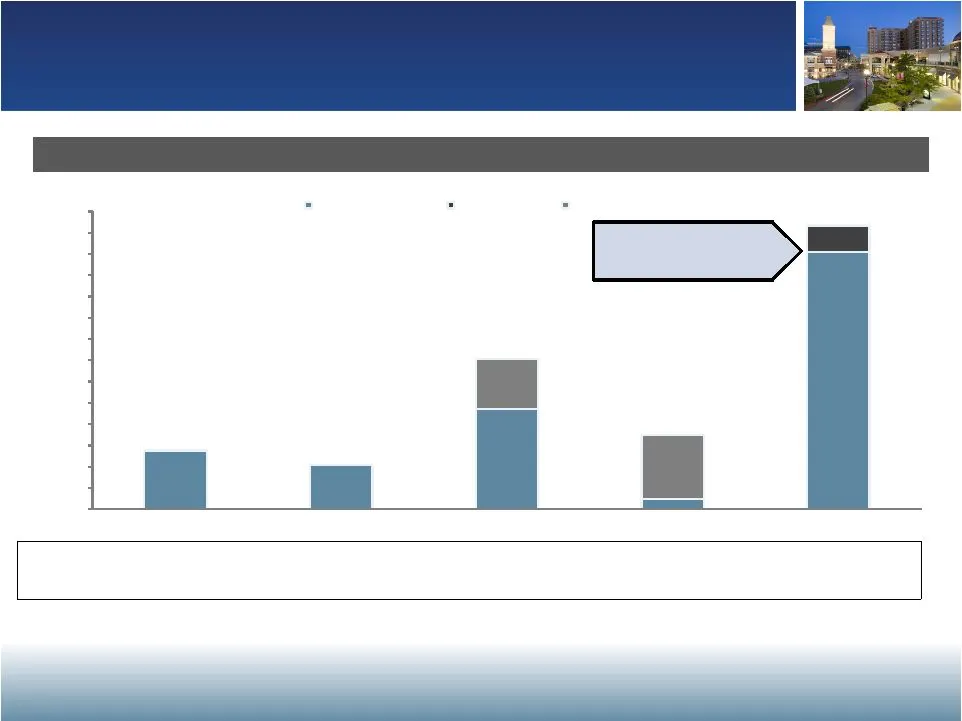
Manageable Near-Term Debt Maturities Debt Maturity Profile ($M) Weighted average interest rate 5.21% 6.84% 4.68% 3.23% 6.87% $0 $100 $200 $300 $400 $500 $600 $700 $800 $900 $1,000 $1,100 $1,200 $1,300 $1,400 Thereafter Mortgages payable Notes payable Credit facility $276 9.4% $207 7.0% $706 24.1% $3
Slide 19: Experienced Management Team
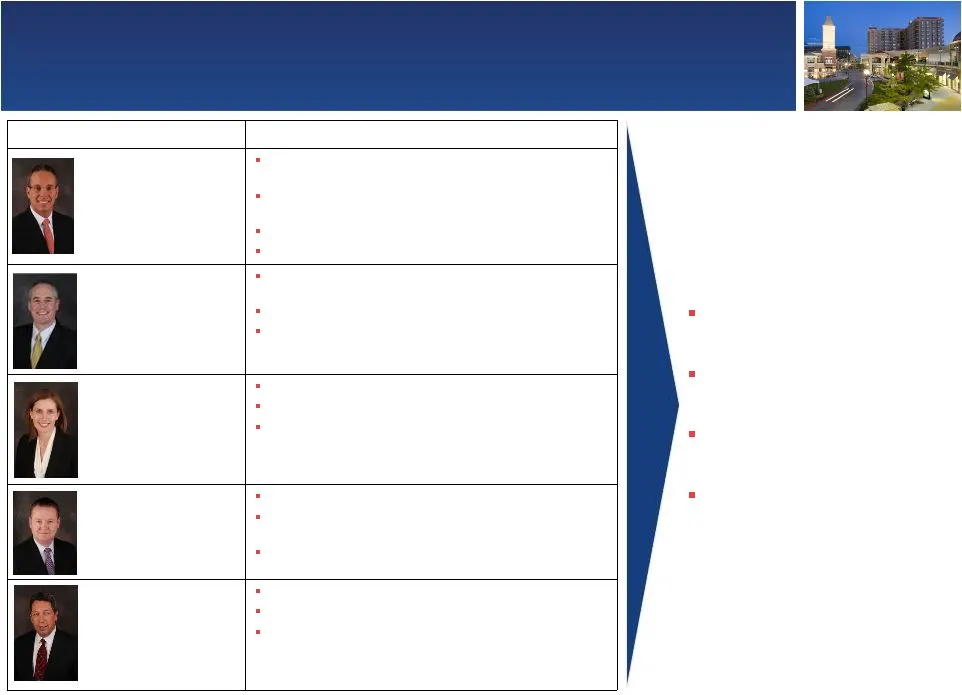
Experienced Management Team Executive Experience Steven P. Grimes President & Chief Executive Officer Former experience as Chief Operating Officer & Chief Financial Officer Director with the mortgage brokerage firm of Cohen Financial Senior Manager with Deloitte & Touche Named to the Board in March

Slide 20: Appendix: Non-GAAP Reconciliations
APPENDIX NON-GAAP RECONCILIATIONS
Slide 21: Non-GAAP Financial Measures
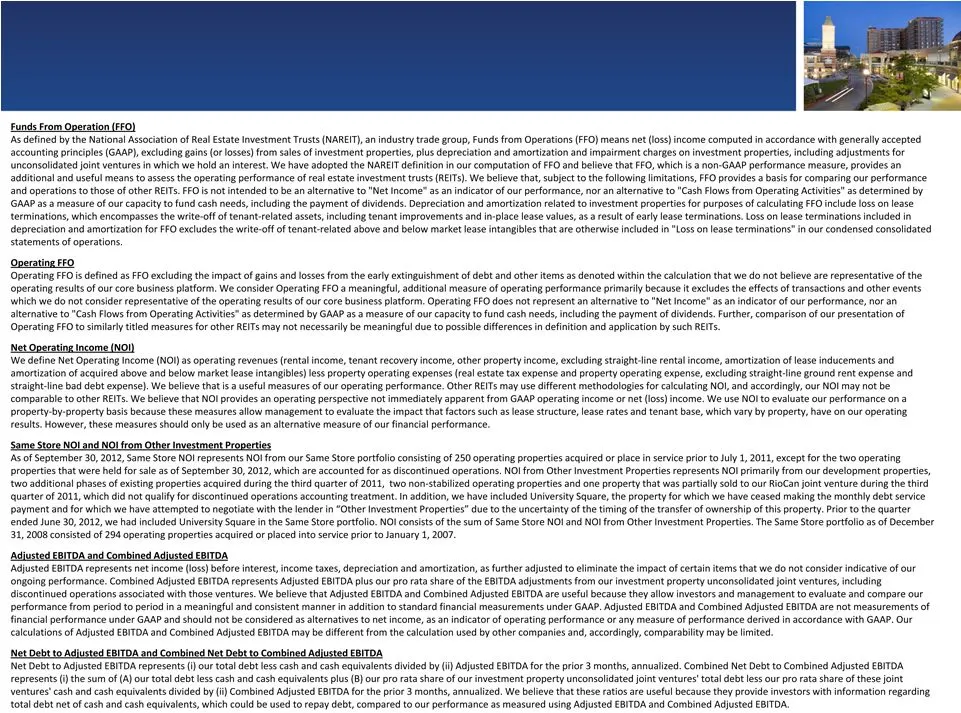
Non-GAAP Financial Measures A-1
Slide 22: Reconciliation of NOI to Net Income
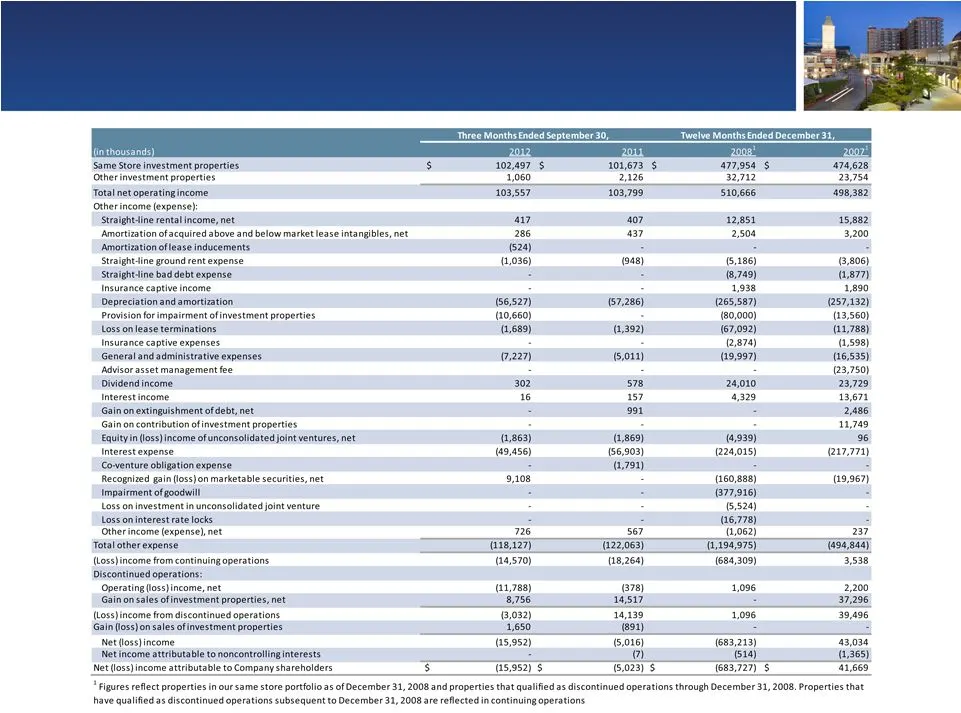
Reconciliation of NOI to Net Income A-2
Slide 23: Reconciliation of Operating FFO
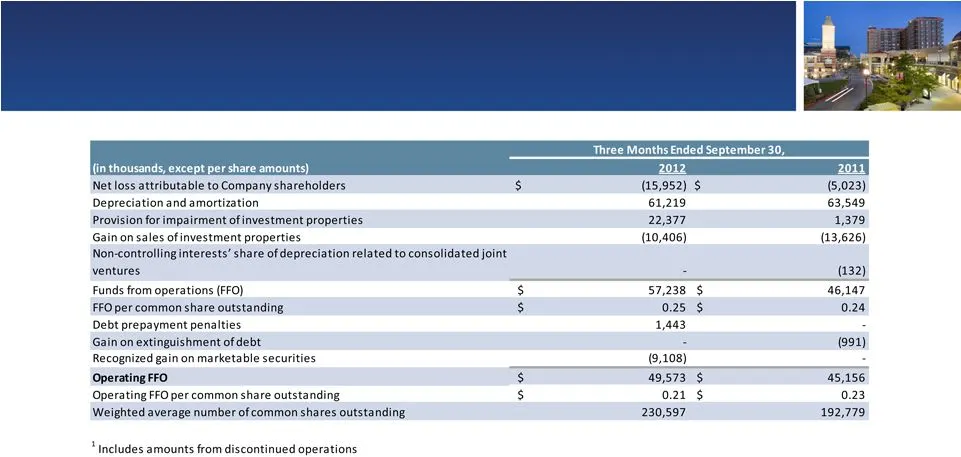
Reconciliation of Operating FFO ¹ A-3
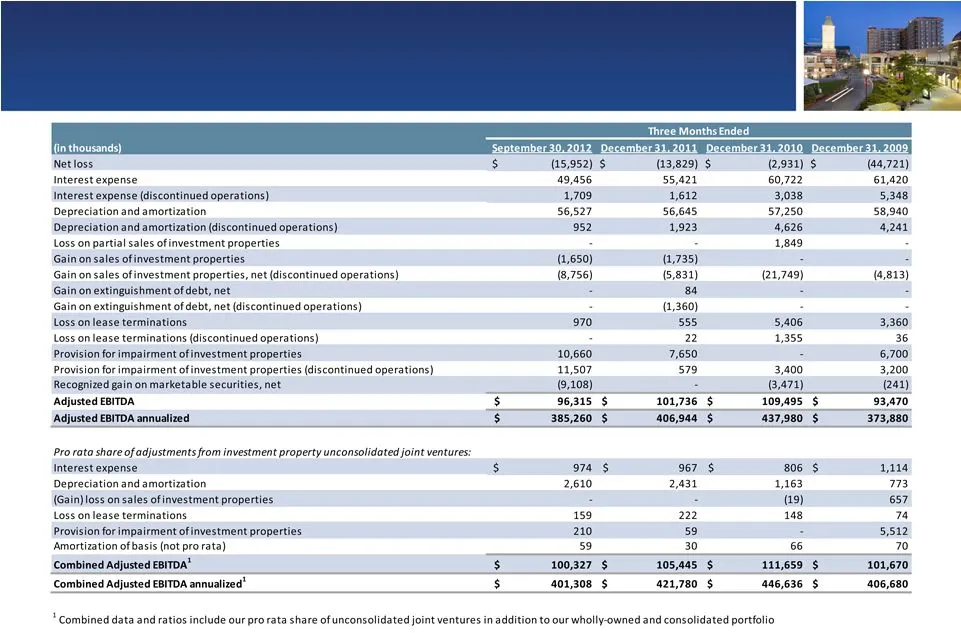
Slide 24: Reconciliation of Combined Adjusted EBITDA
Reconciliation of Combined Adjusted EBITDA A-4
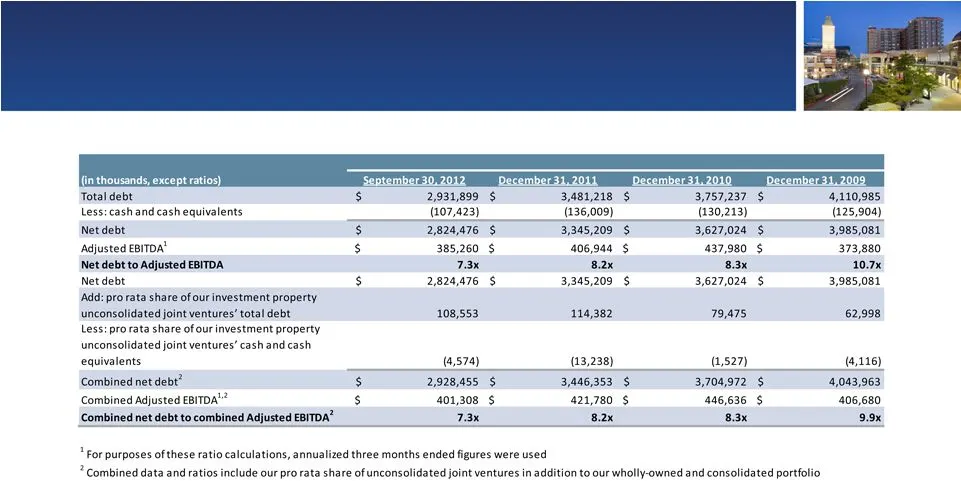
Slide 25: Reconciliation of Combined Net Debt to Combined Adjusted EBITDA
Reconciliation of Combined Net Debt to Combined Adjusted EBITDA A-5
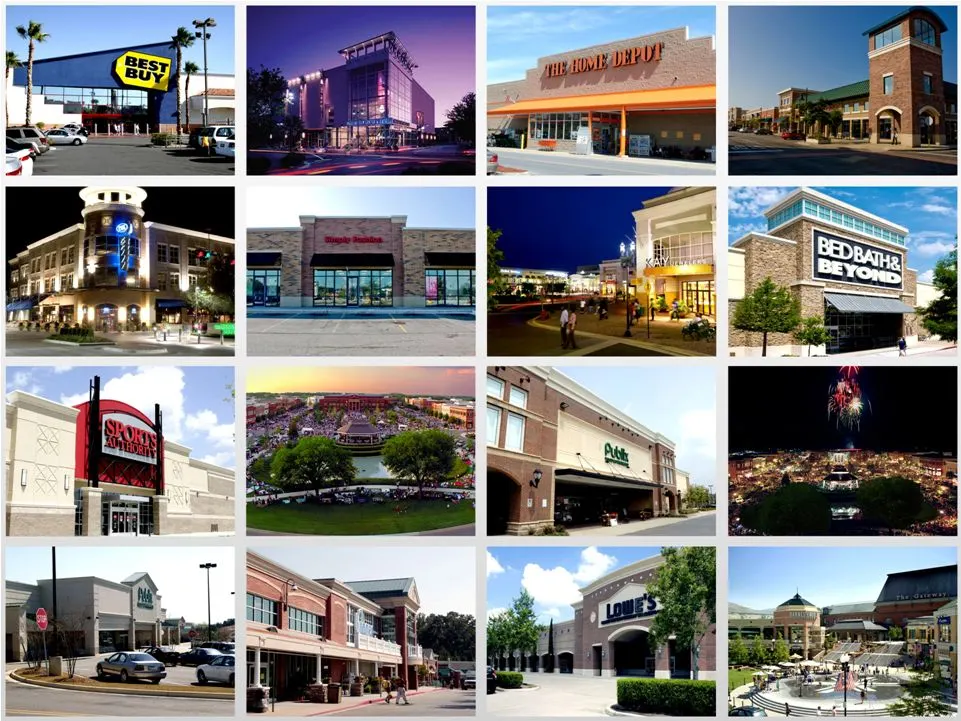
Slide 26
Source: SEC EDGAR · 8-K filed Nov 13, 2012
More decks from Retail Properties of America Inc
 Merger or Acquisition (July 2021)17 slides · Jul 19, 2021
 Investor Presentation (July 2020)23 slides · Jul 17, 2020
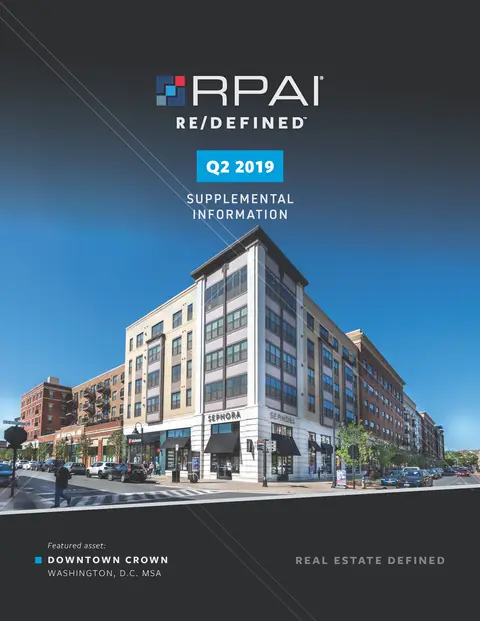 Q2 2019 Earnings Presentation5 slides · Jul 30, 2019
 Investor Day (September 2016)100 slides · Sep 21, 2016
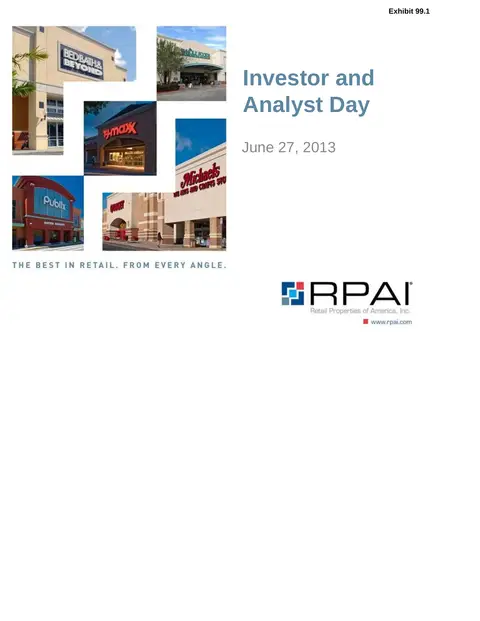 Investor Day (June 2013)68 slides · Jun 27, 2013
 Q4 2012 Earnings Presentation21 slides · Feb 26, 2013