Retail Properties of America Inc
Retail Properties of America — Q4 2012 Earnings Presentation
21 slides from Retail Properties of America's earnings presentation, Feb 26, 2013

Slide 1: Fourth Quarter 2012 Update Investor Presentation
Fourth Quarter 2012 Update Presentation Investor
Slide 2: Disclaimer
Thisinformation Disclaimer forth Securities portfolio and Forward-looking happen described "should," forma," words strategies, adverse general defaults bankruptcy increased declining availability, decreased difficulties risks estimates impact future environmental lack availability ret
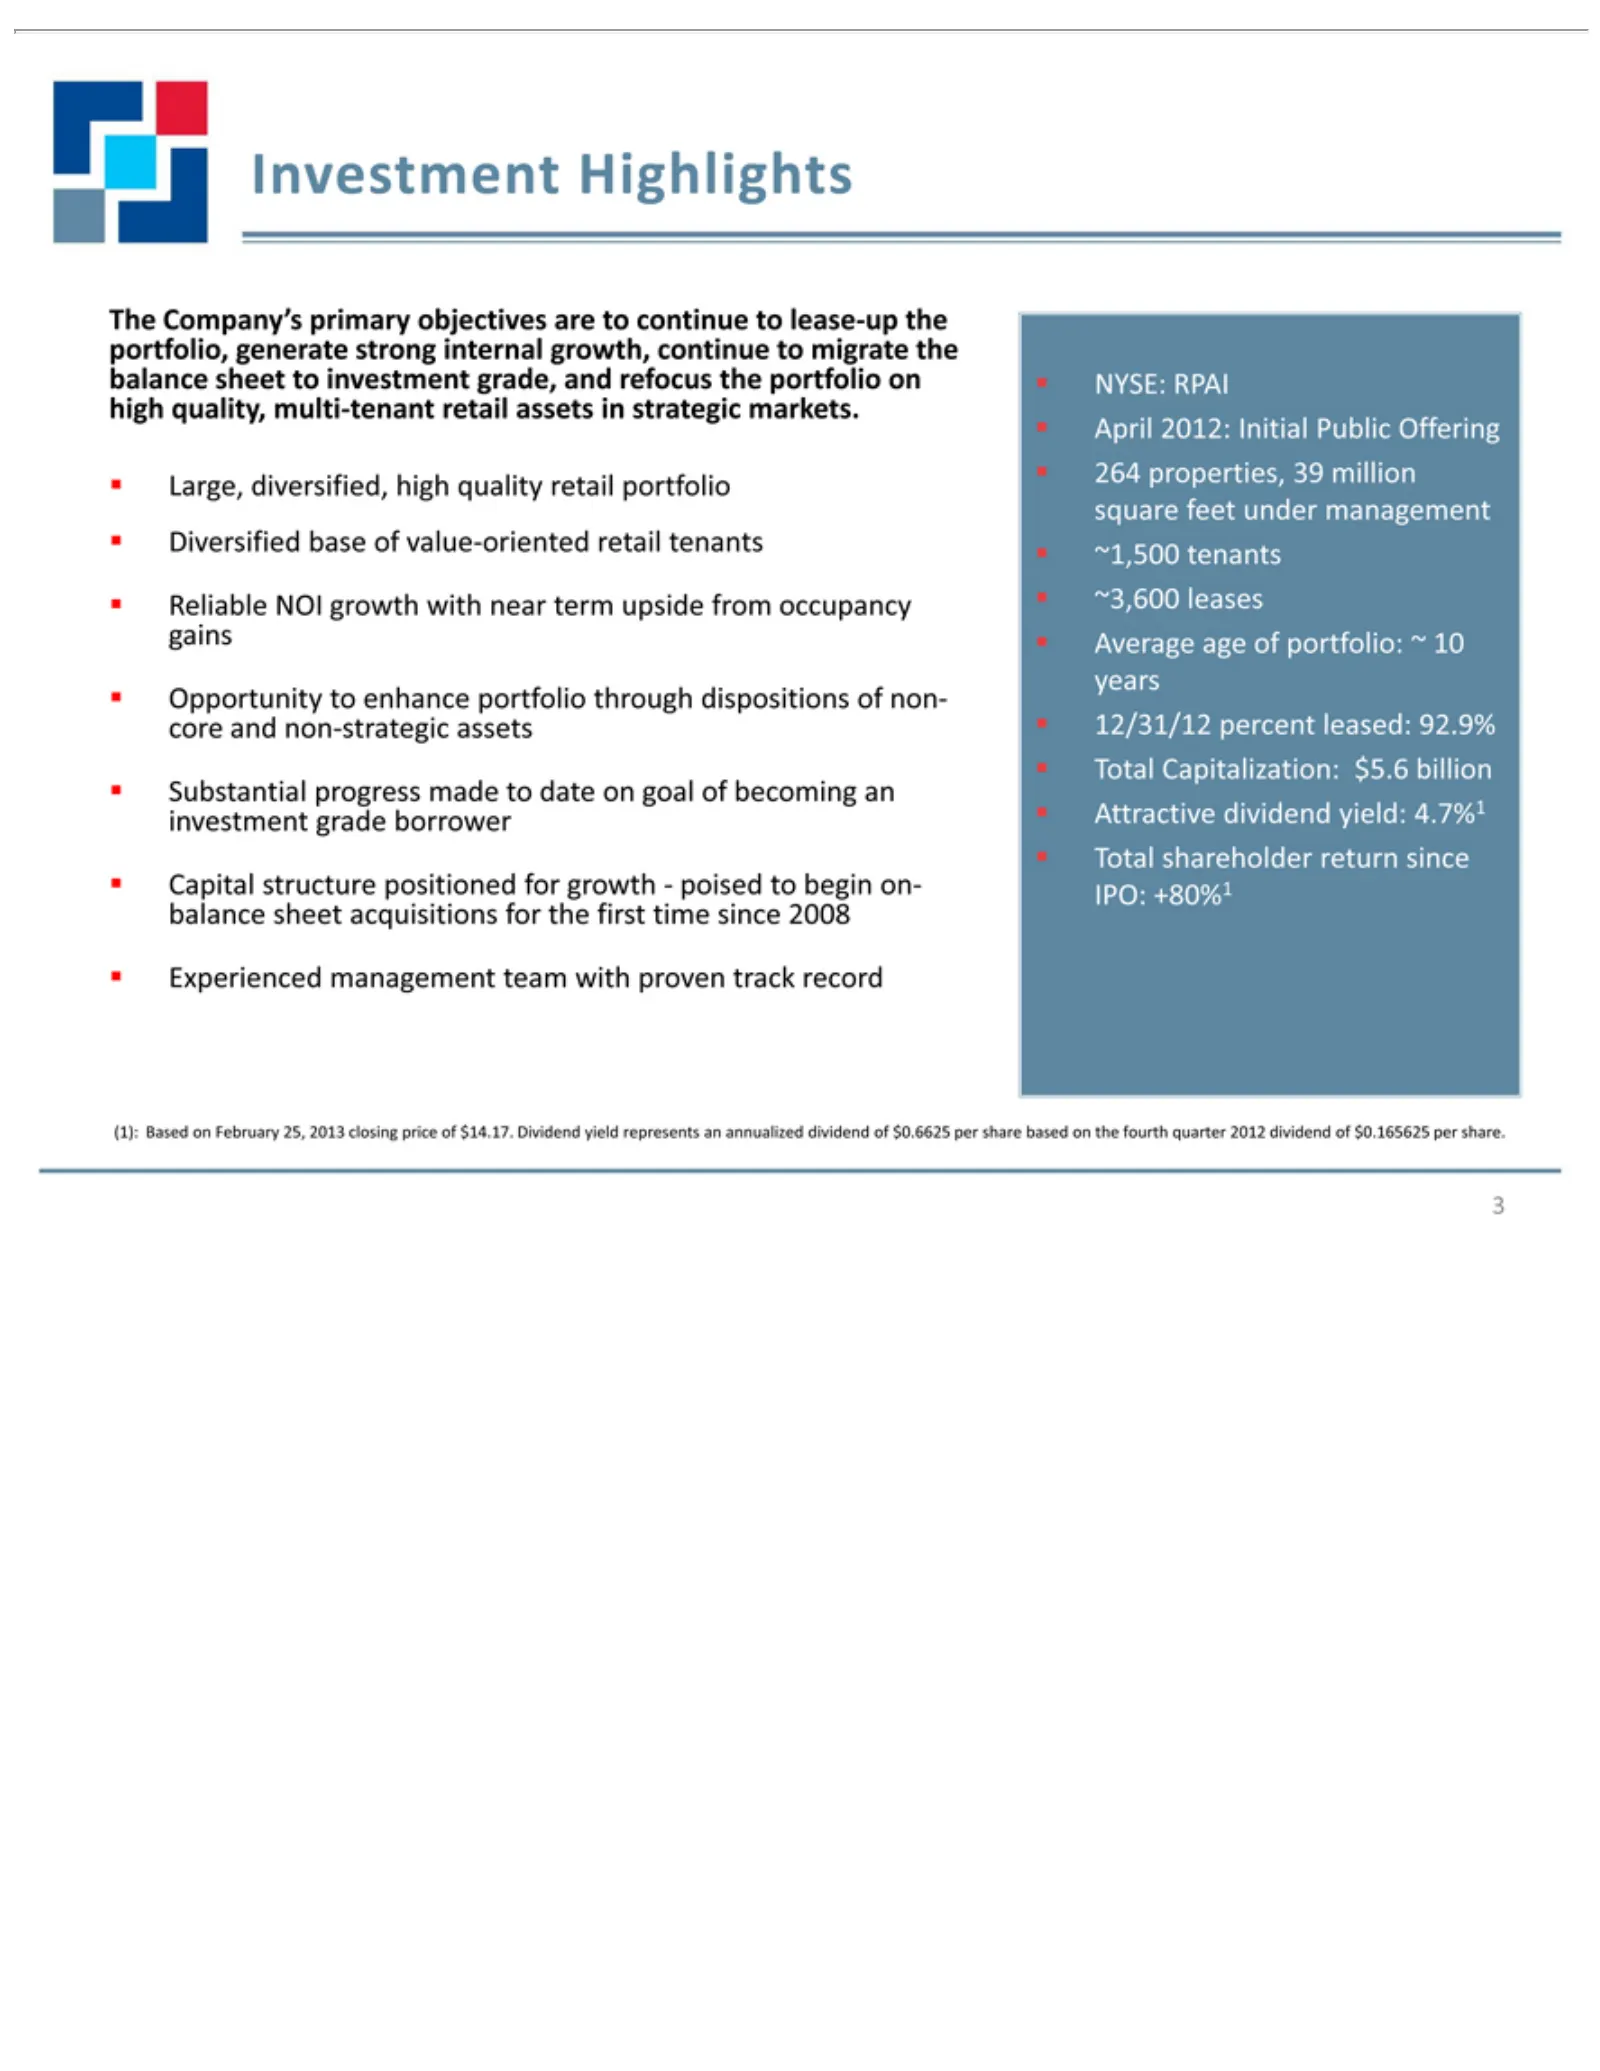
Slide 3: Investment Highlights
Investment The portfolio, high Large, Diversified Reliable Opportunity gains core Substantial investment Capital balance Experienced 3N April 264 square ~1,500 ~3,600 Average 12/31/12 years Attractive Total IPO: (1): YSE: Based properties, Company’s and quality, +80%1 Capitalization: shareholder 201
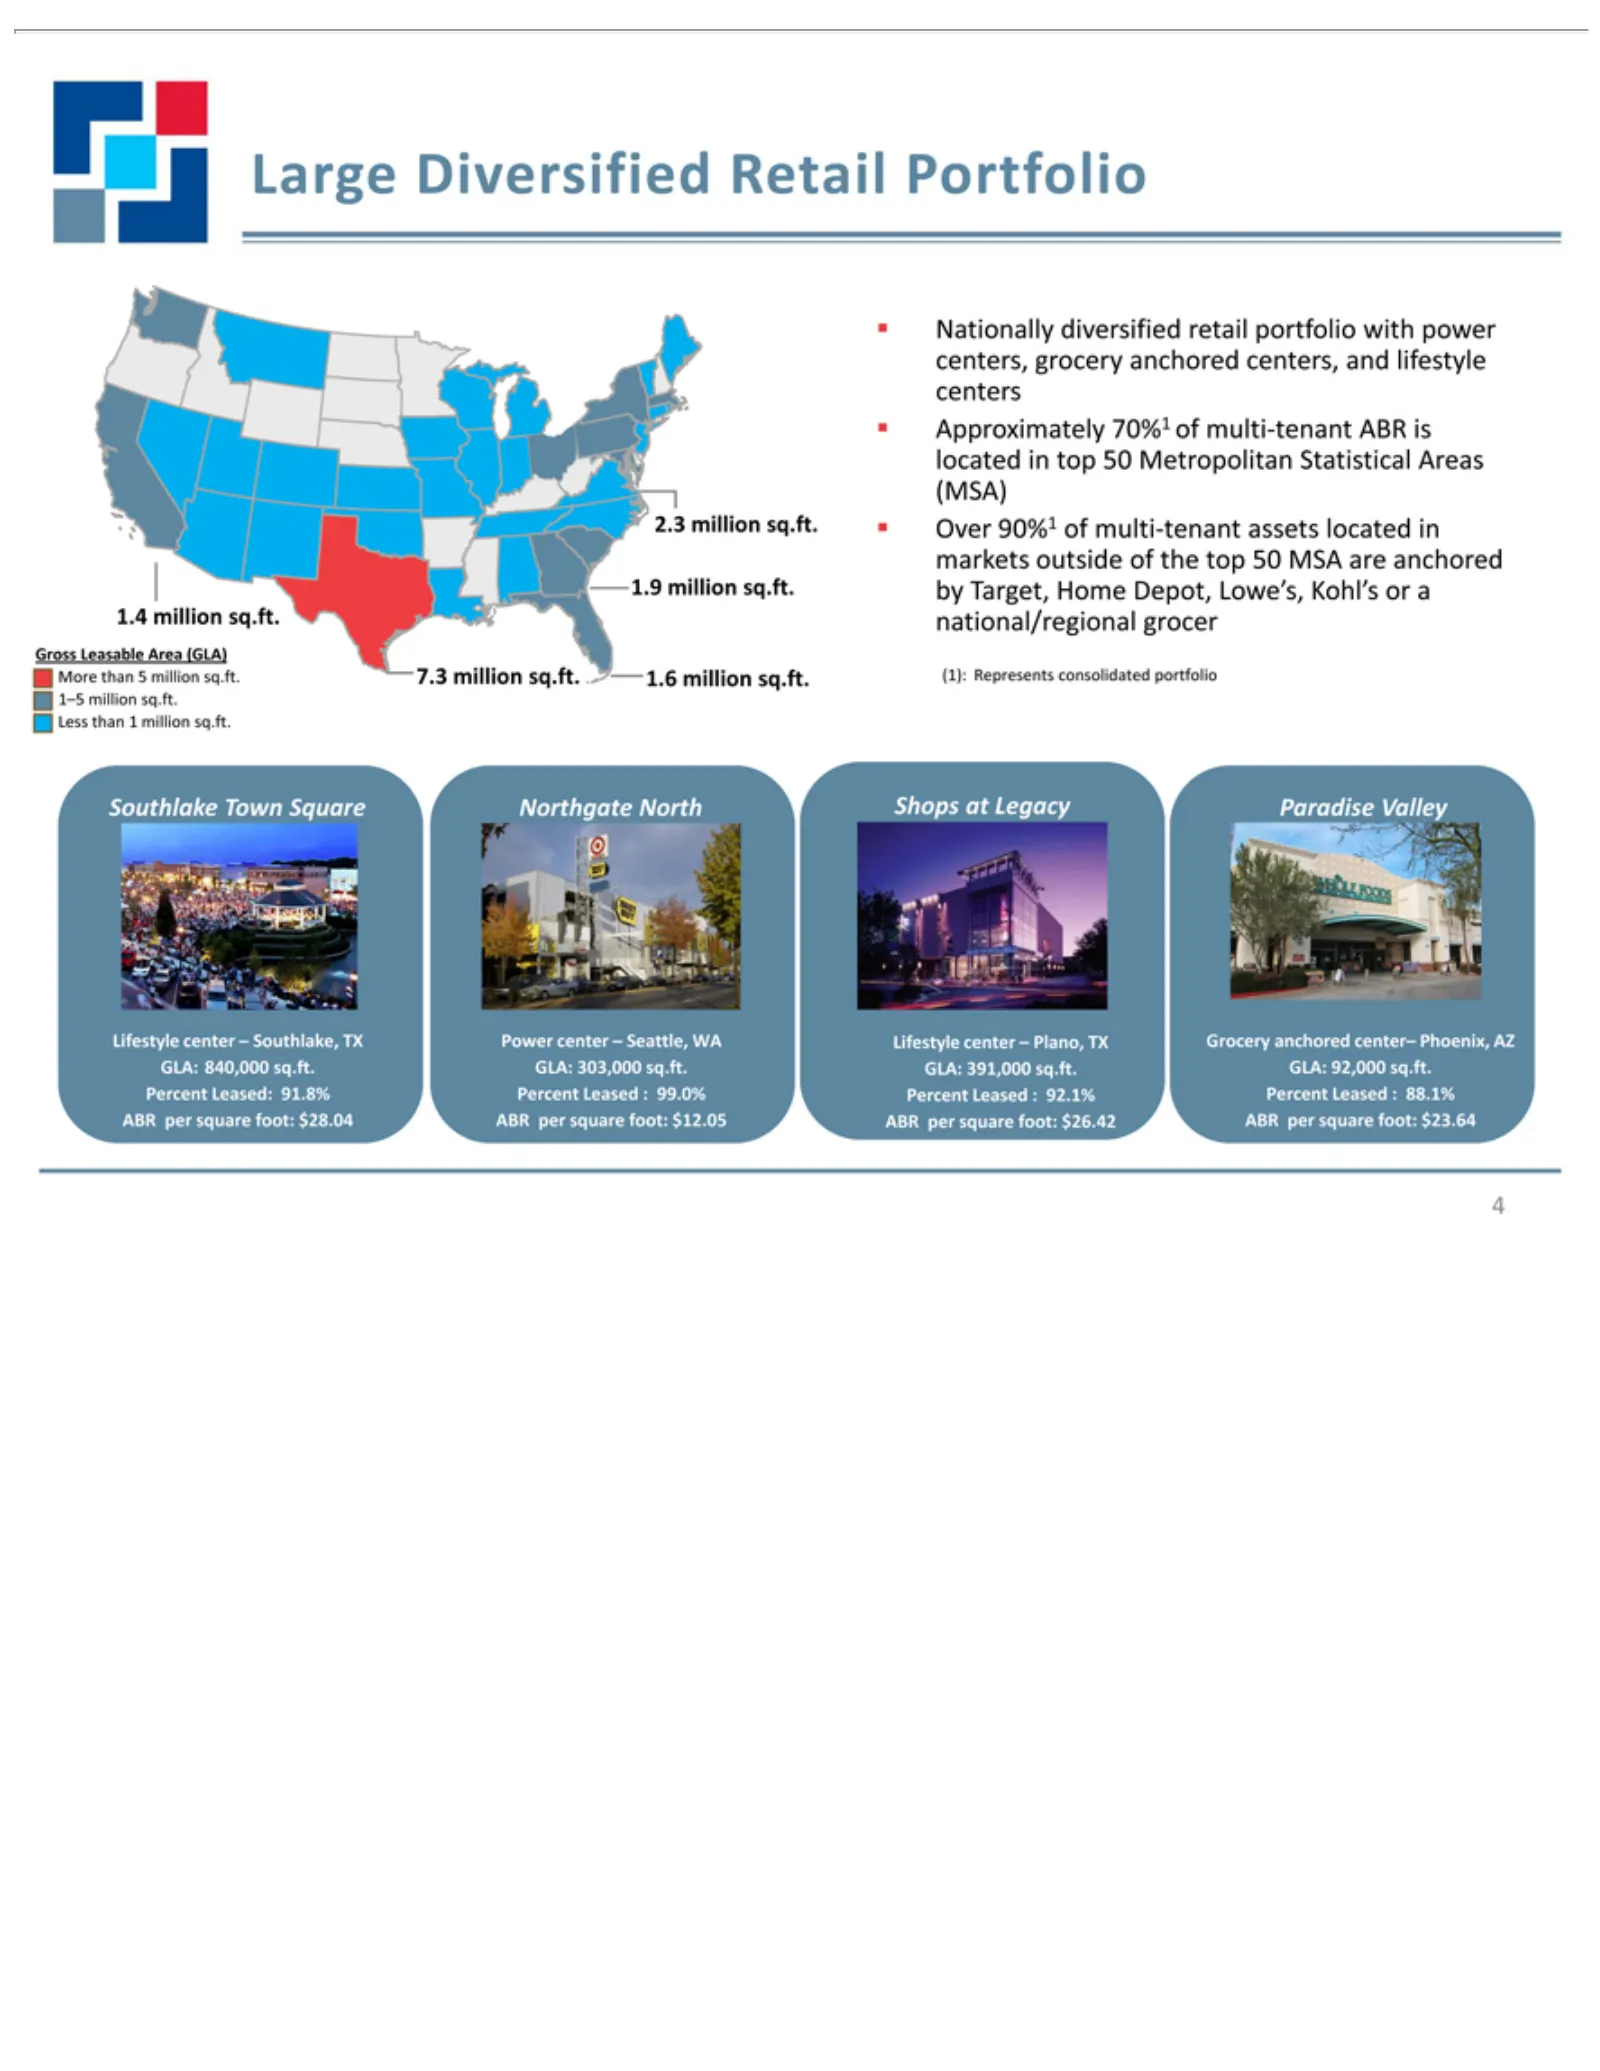
Slide 4: Large, Diversified Retail Portfolio
4Large anchored Gross More 1–5 Less 1.4 7.3 1.9 1.6 2.3 markets by 44 Diversified Nationally centers, Approximately centers located Over (MSA) national/regional Grocery GLA: Power Lifestyle GLA: Percent ABR Southlake Paradise Northgate Shops (1): <P><B>Searc
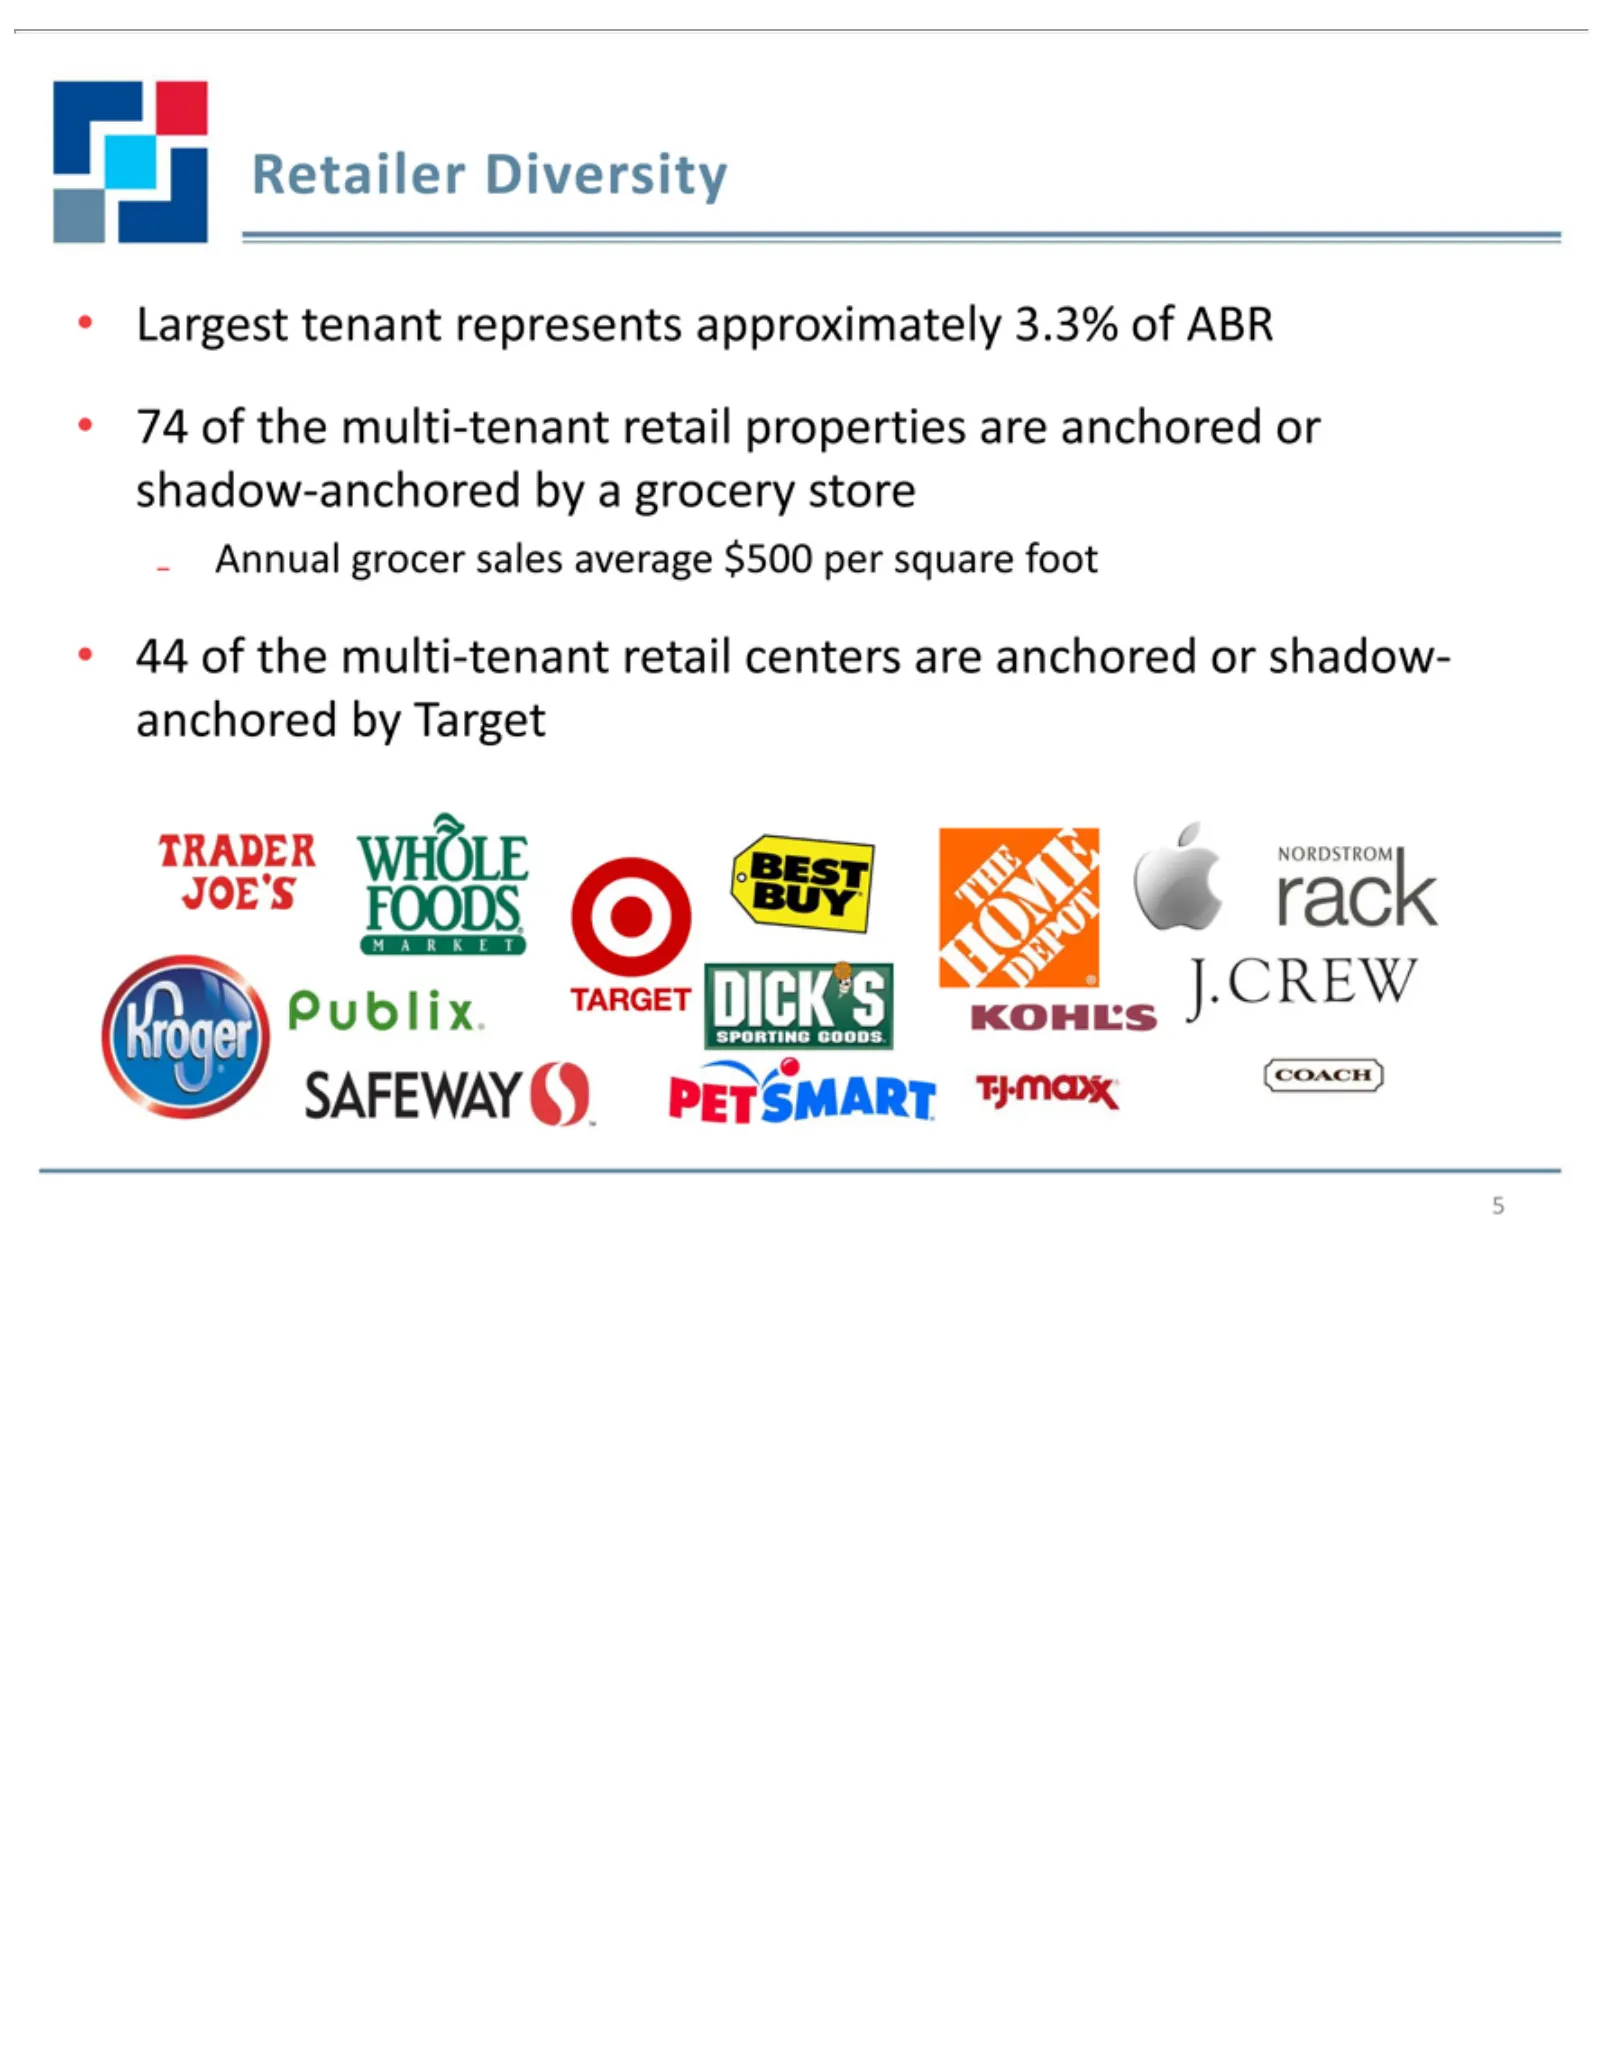
Slide 5: Diversity of Retailers and Largest Tenant
Retailer Largest 74 Annual 544 of thegrocer tenant Diversity multi-tenant represents sales average retail approximately properties centers $500 per aresquare are anchored 3.3% anchored foot of ABR or shadow-anchored or shadow-anchored by by Target a grocery store
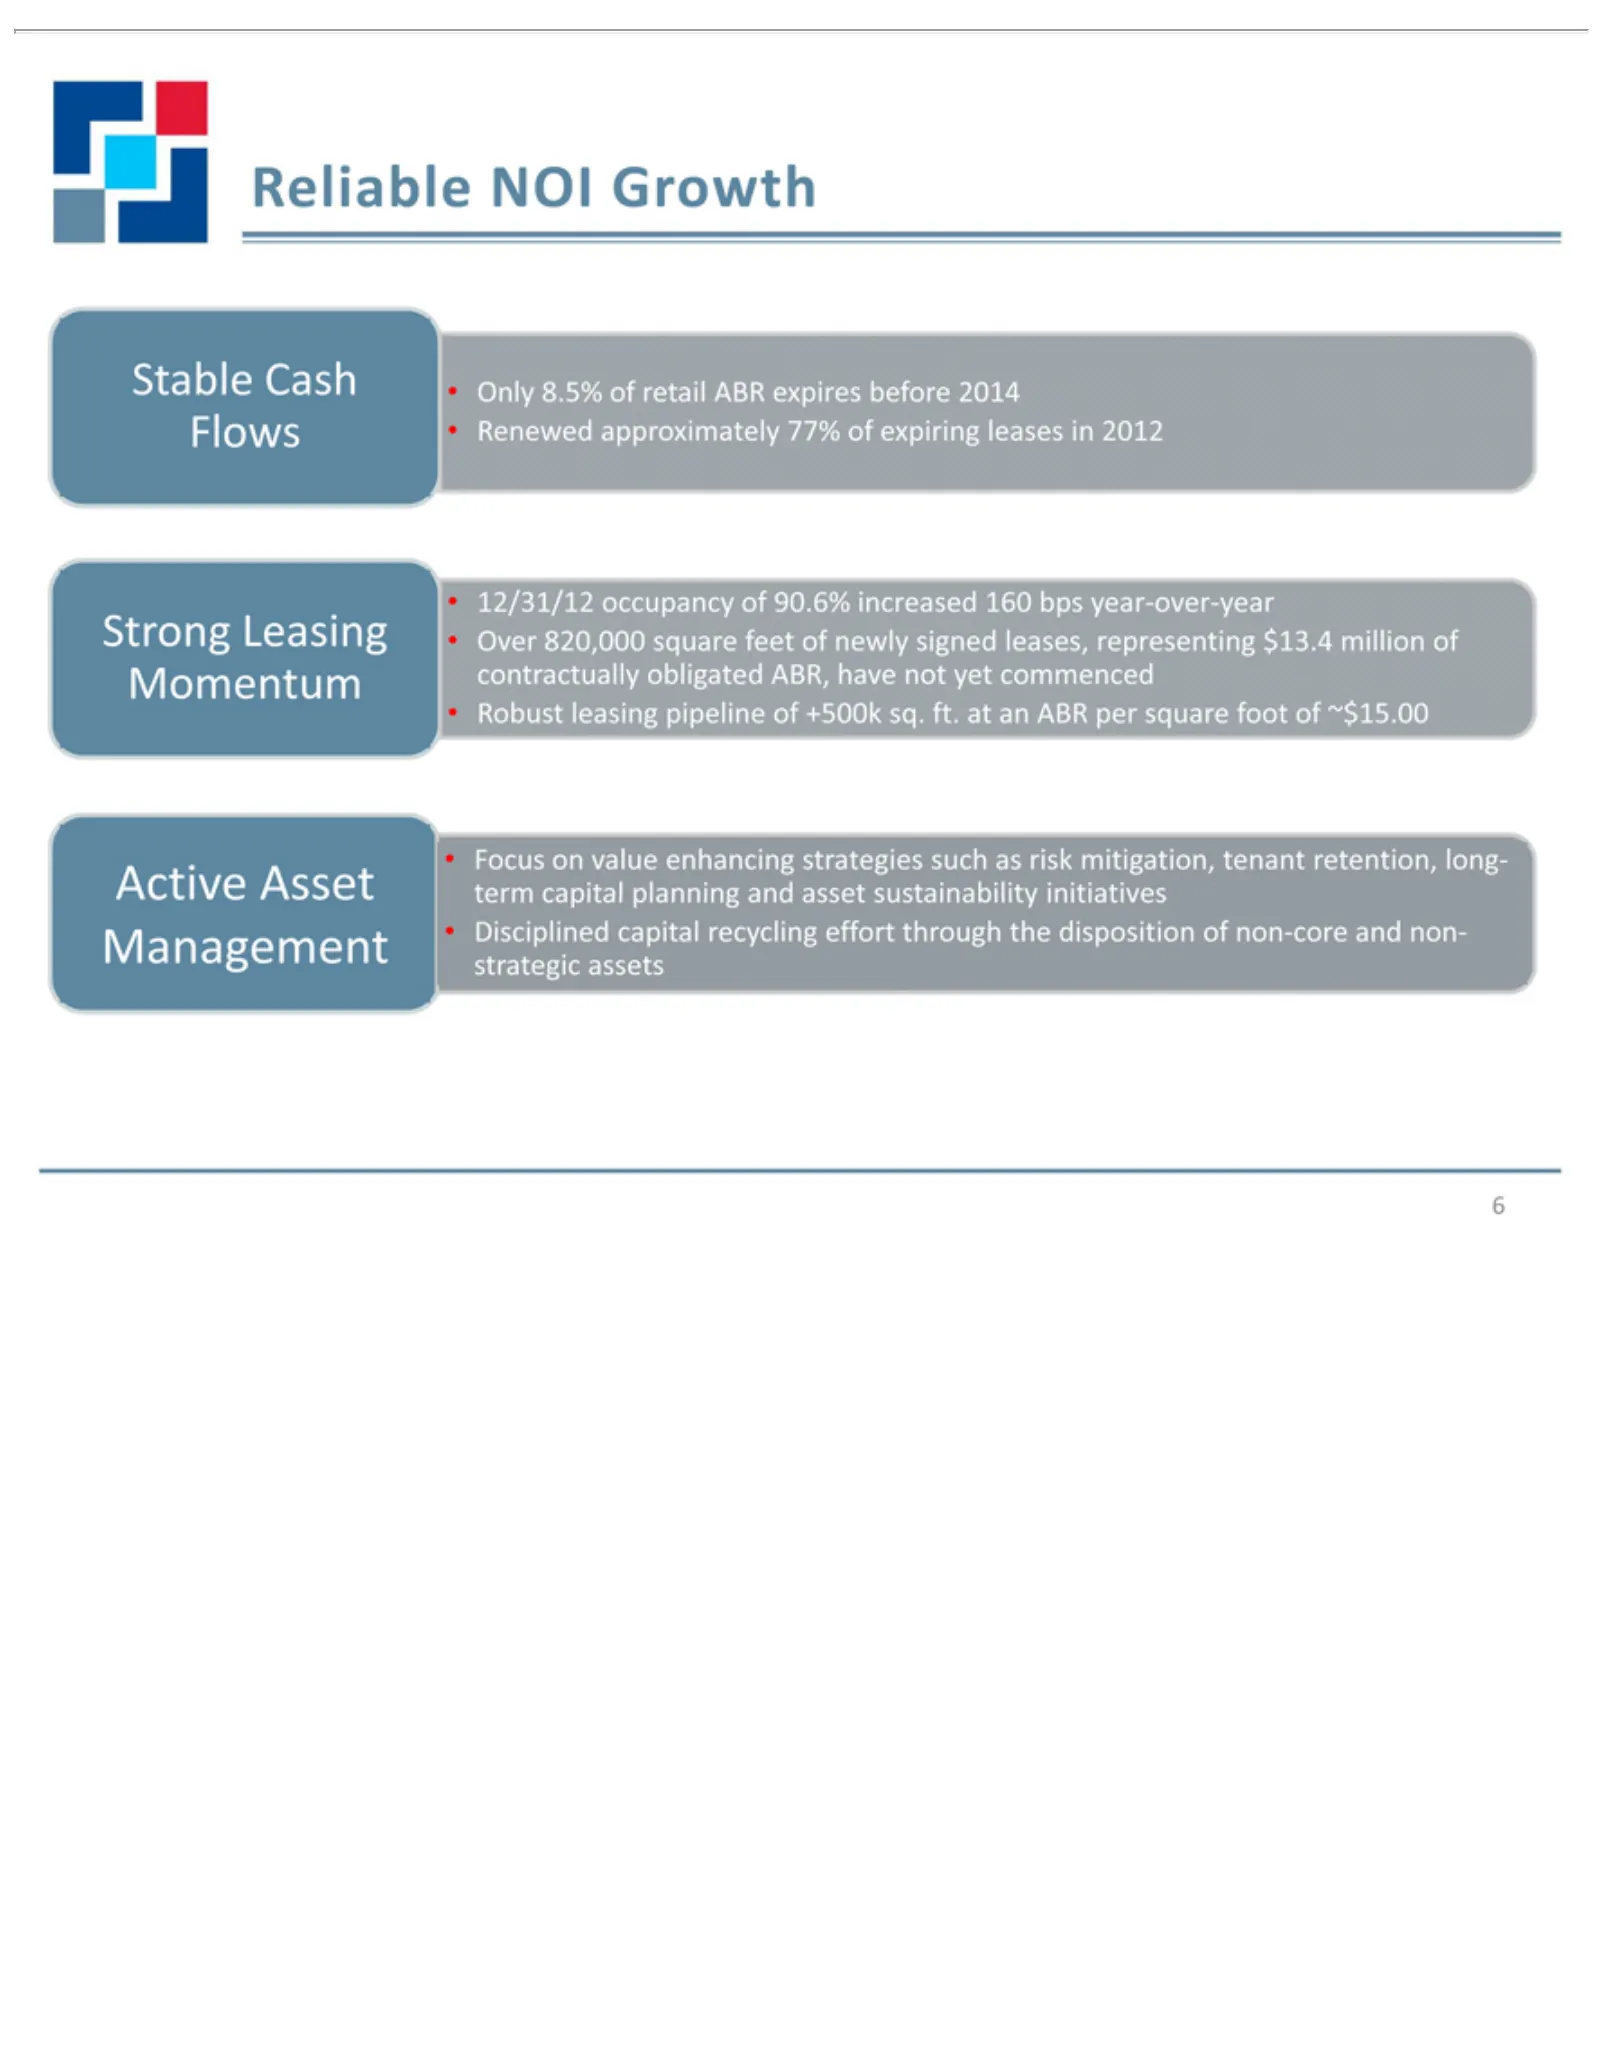
Slide 6: Reliable NOI Growth
6Reliable Strong Stable Momentum Active Flows Only Management Renewed 12/31/12 Over NOI contractually Robust Focus term Disciplined strategic capital 820,000 8.5% on Cash Asset Leasing leasingGrowth assets occupancy value approximately of capital planning obligated retail square pipeline enhancing r
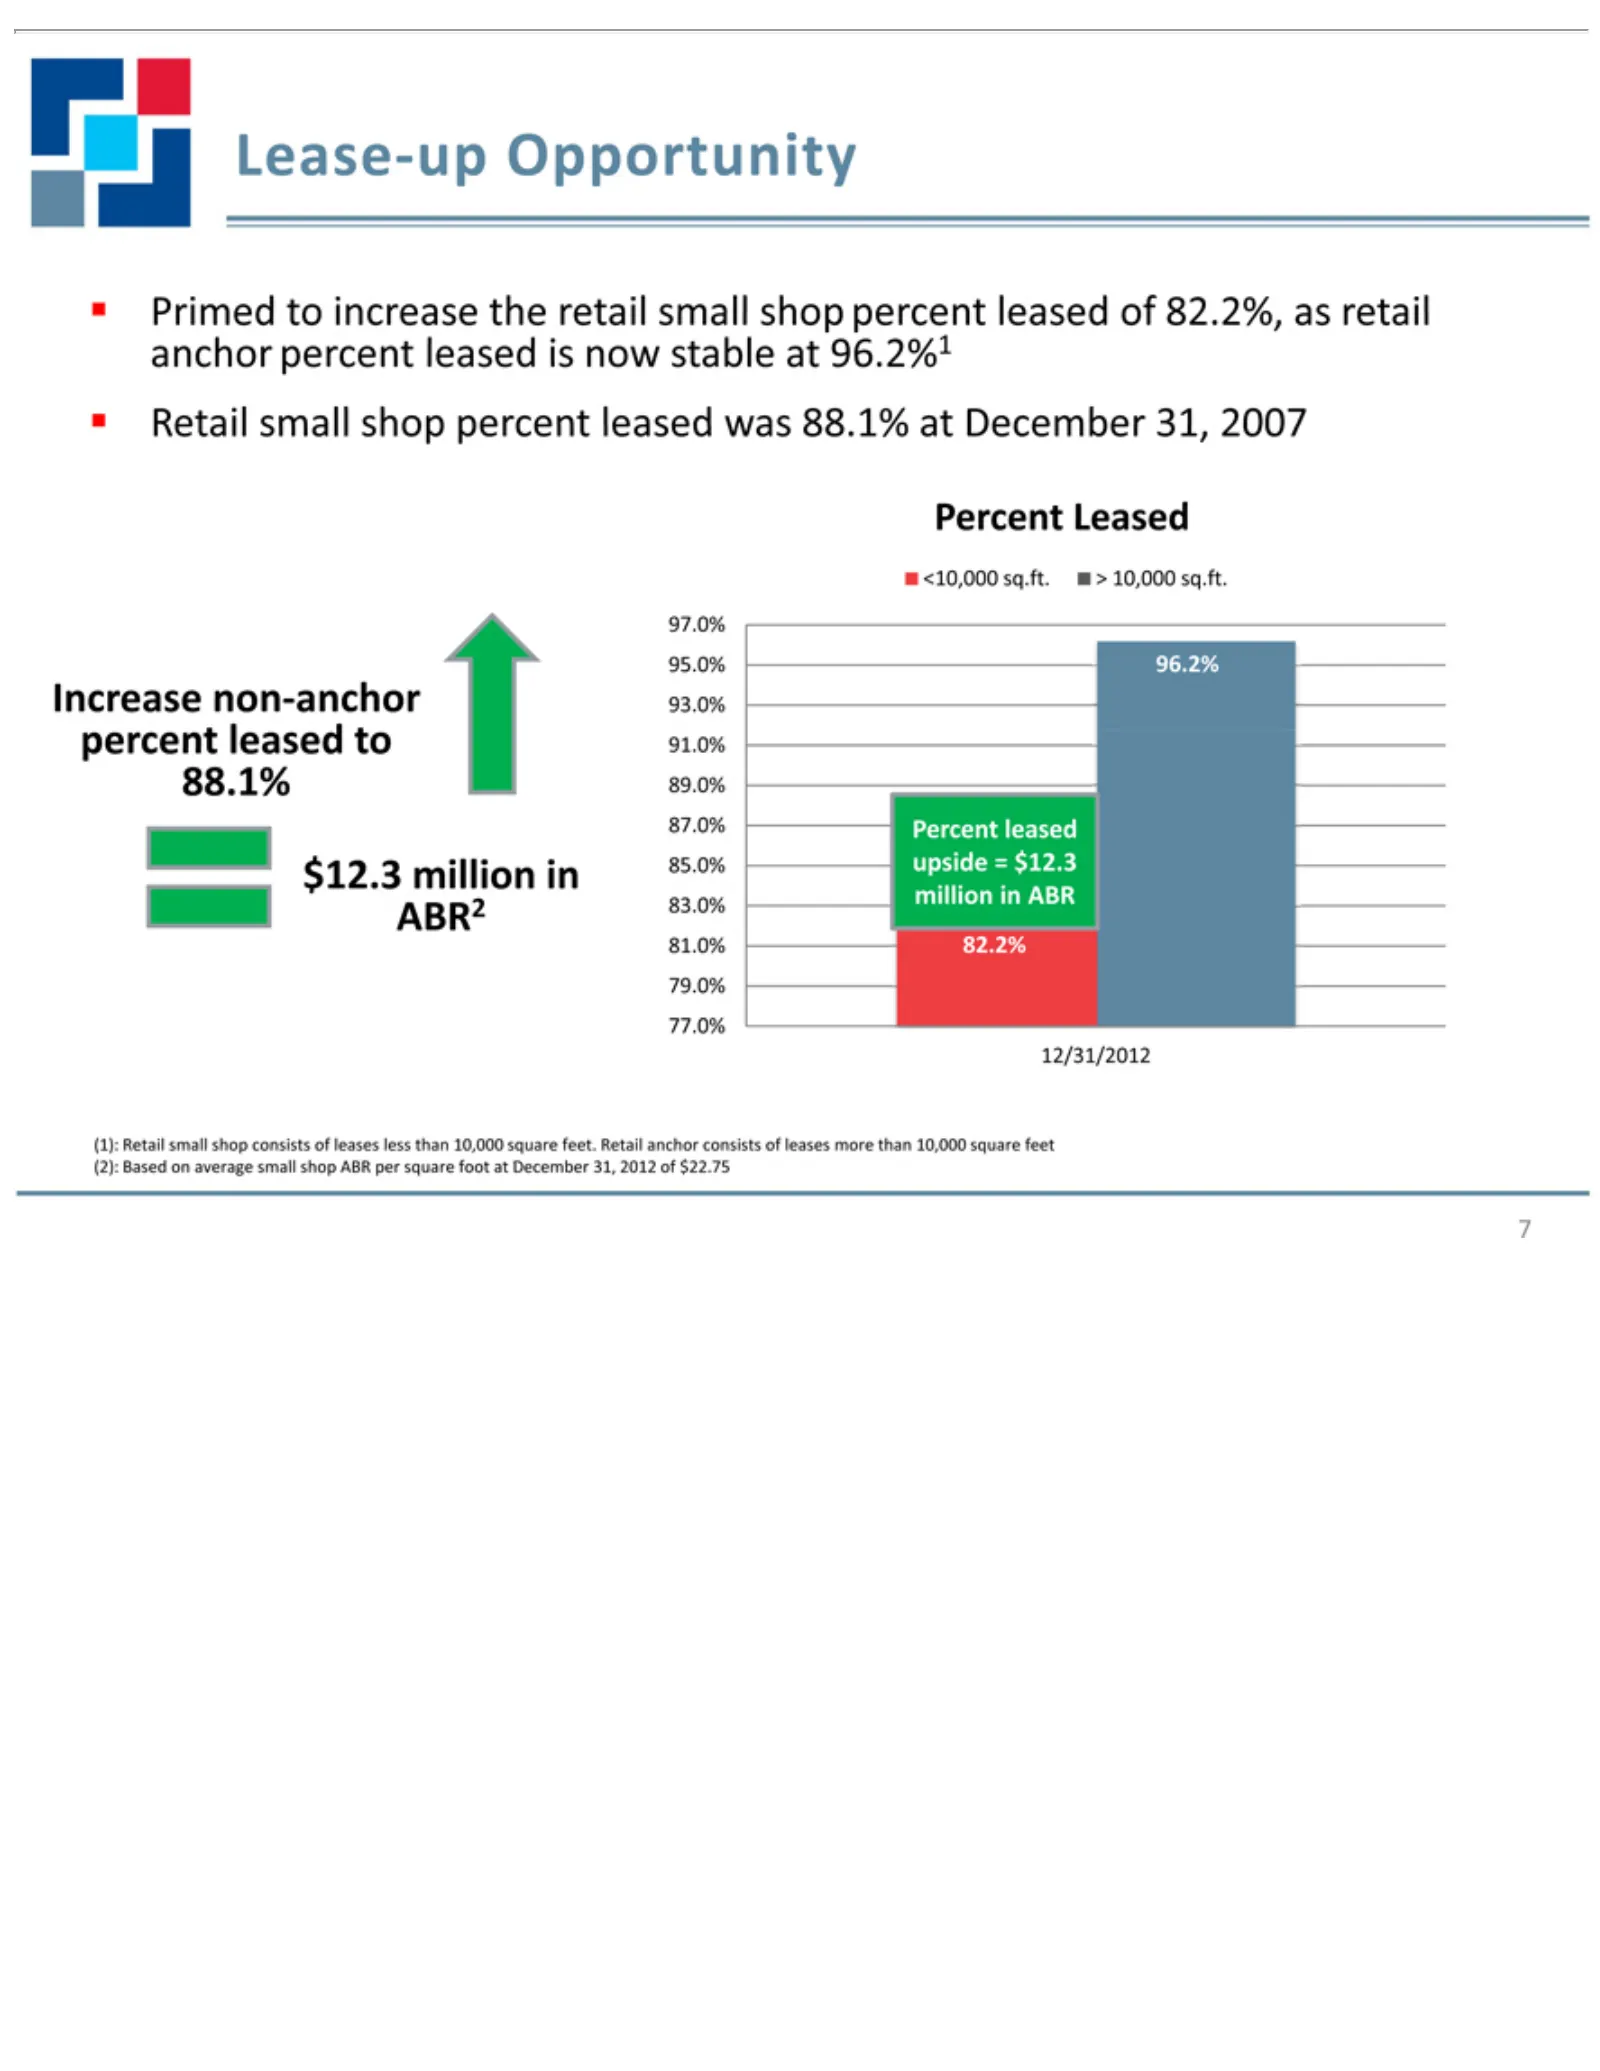
Slide 7: Primed for Increase in Percent Leased
Primed Increase $12 Percent <10,000 95 97.0% 91 93.0% 87 89.0% 85.0% 83 81.0% 79 (1): 12/31/2012 777.0% 0% Retail 3 million 96 Percent upside million 82.2% to Leased sq.ft. non2% increase small anchor in =>in leased $12.3 ABR2 10,000 shop ABR the percent consists retail sq.ft.small leased of leases
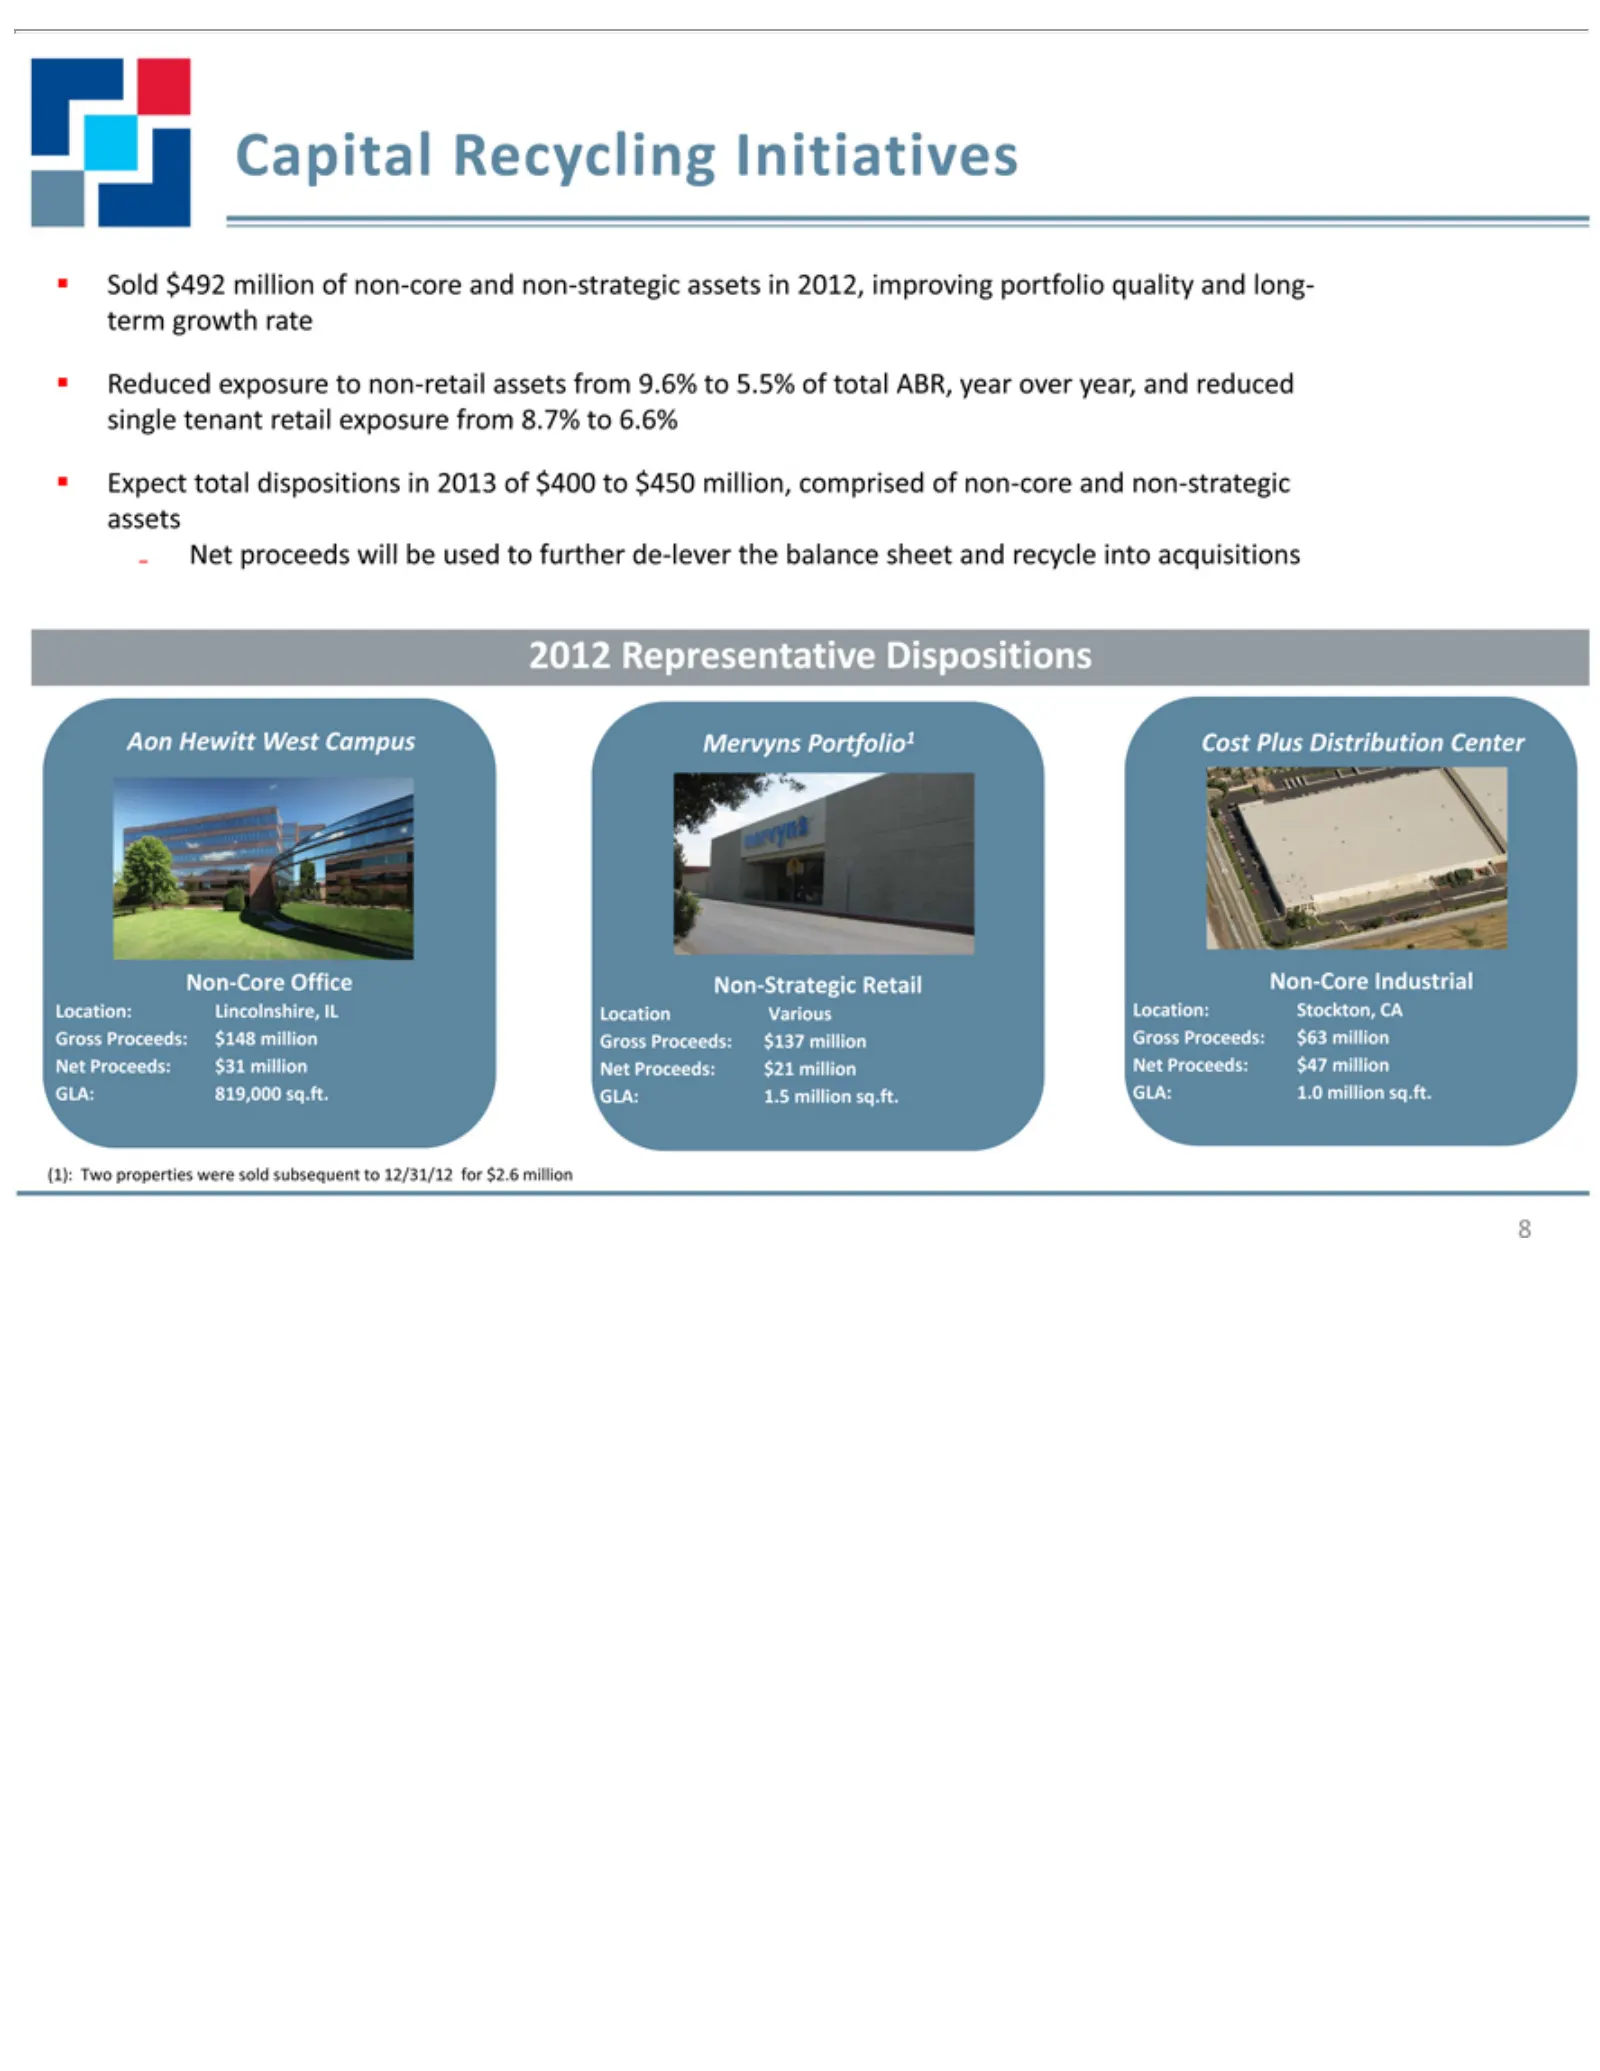
Slide 8: Sold Two Non-Core Properties, Reduced Non-Strategic Exposure
SoldTwo Reduced Expect 2012 Aon Non-Core Various Gross Proceeds: 8(1): Hewitt $492 Representative Proceeds: total GLA: properties exposure foot: Office million West dispositions 391,000 $12 $148 Power Campus of towere 05 Dispositions non-core non-retail million $21 sq.ft. center in sold Northgate mi
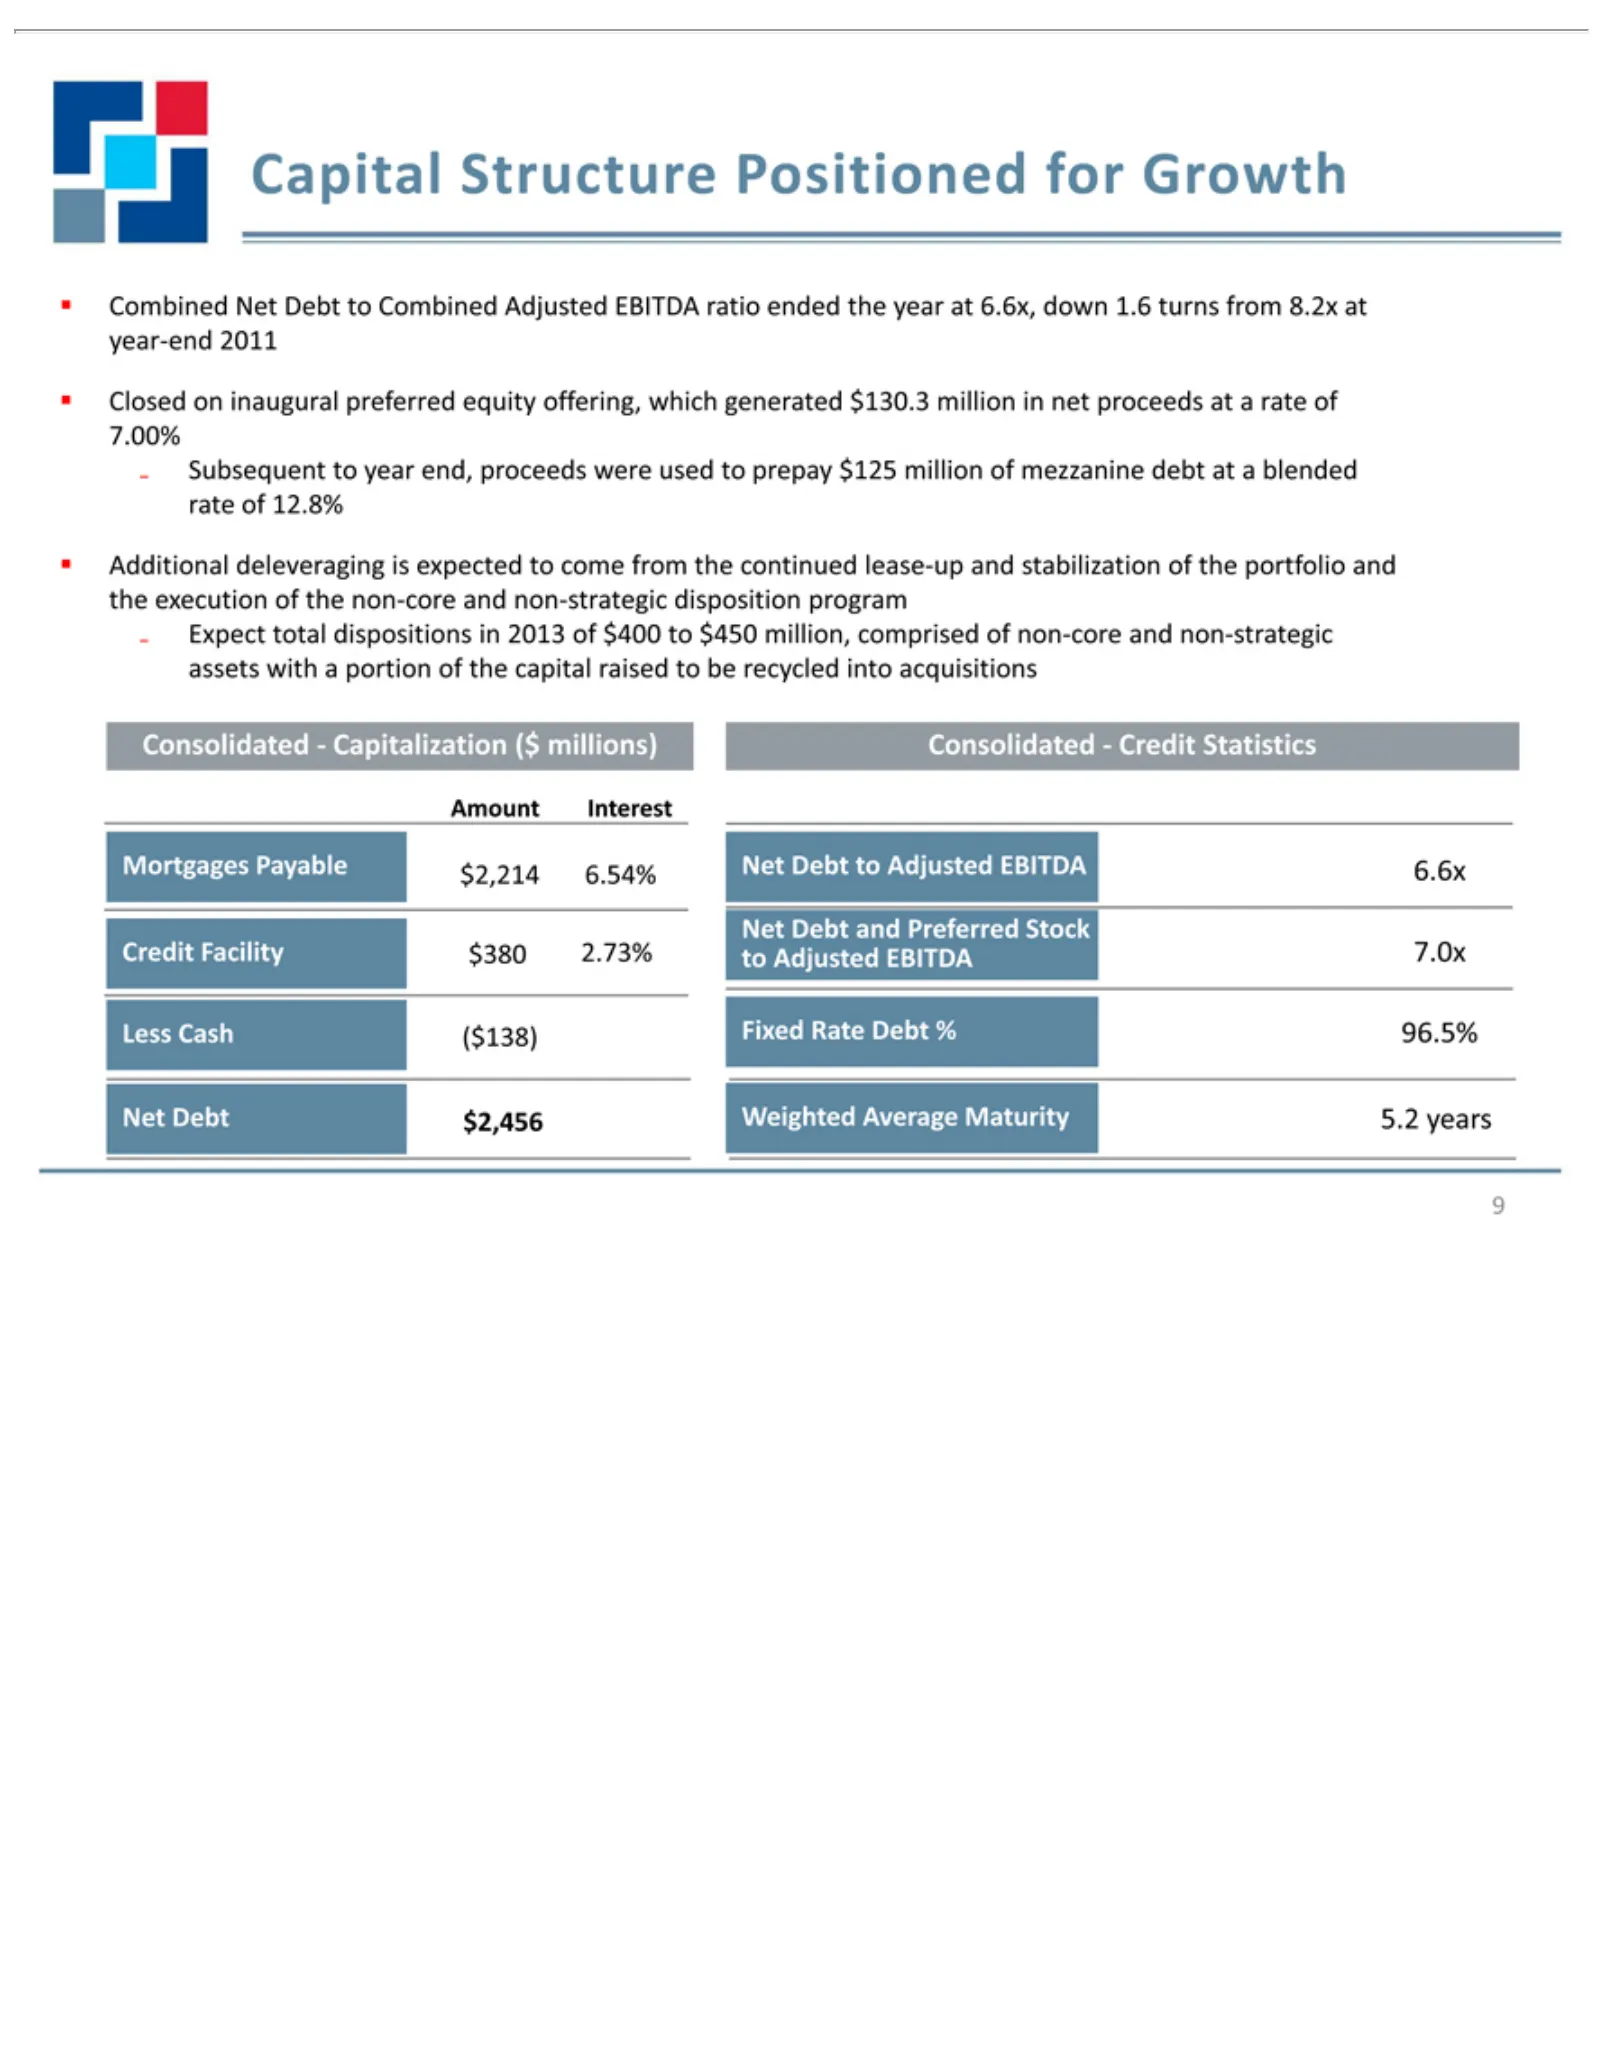
Slide 9: Capital Structure
Capital 9C year-end Closed Subsequent 7.00% rate Additional the Expect assets Consolidated—Capitalization Interest Amount Consolidated—Credit Mortgages Less ($138) $2,456 Fixed 6.6x Weighted 96.5% 5.2 Net 6.54% $2,214 to Credit 7.0x 2.73% $380 ombined Adjusted execution years Debt ofCash Rate with F
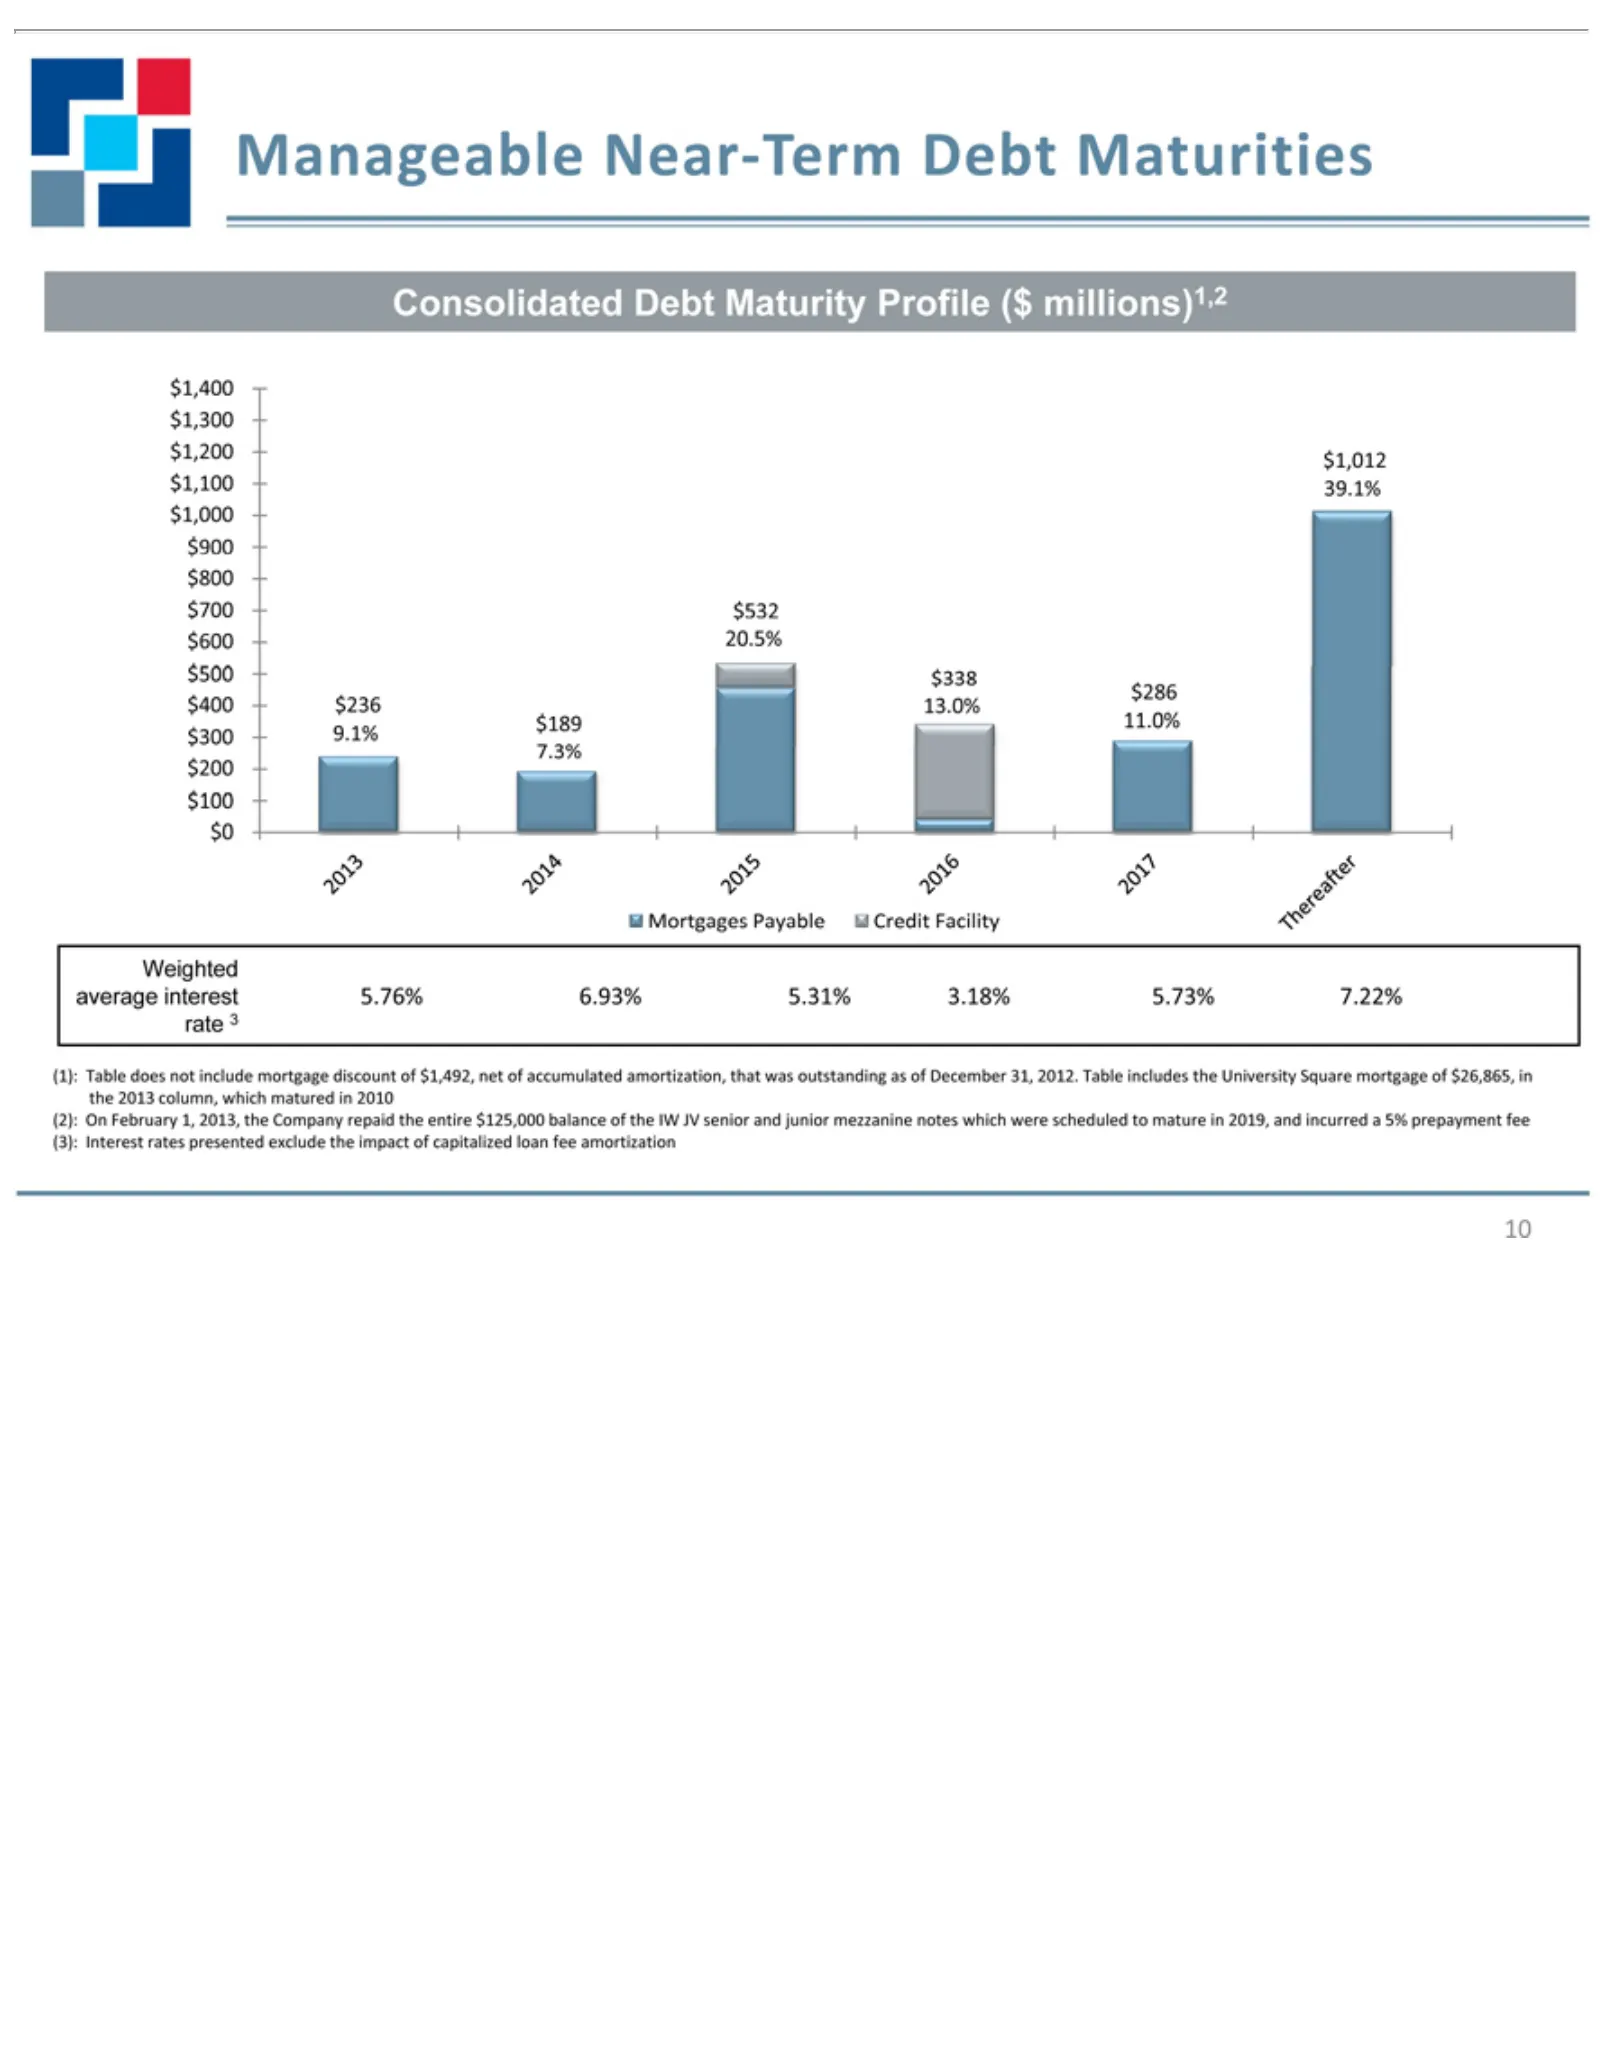
Slide 10: Consolidated Mortgages Debt Maturity Profile
Consolidated $1,400 Mortgages average Weighted rate (1): the (2): (3): 10 2013 Table On Interest 3 $1,300 February interest column does Payable rates Debt $1,200 not 5.76% which 1, presented Maturity include Credit 2013, $1,012 6.93% matured the Facility mortgage exclude Profile Company $1,100 5.31%
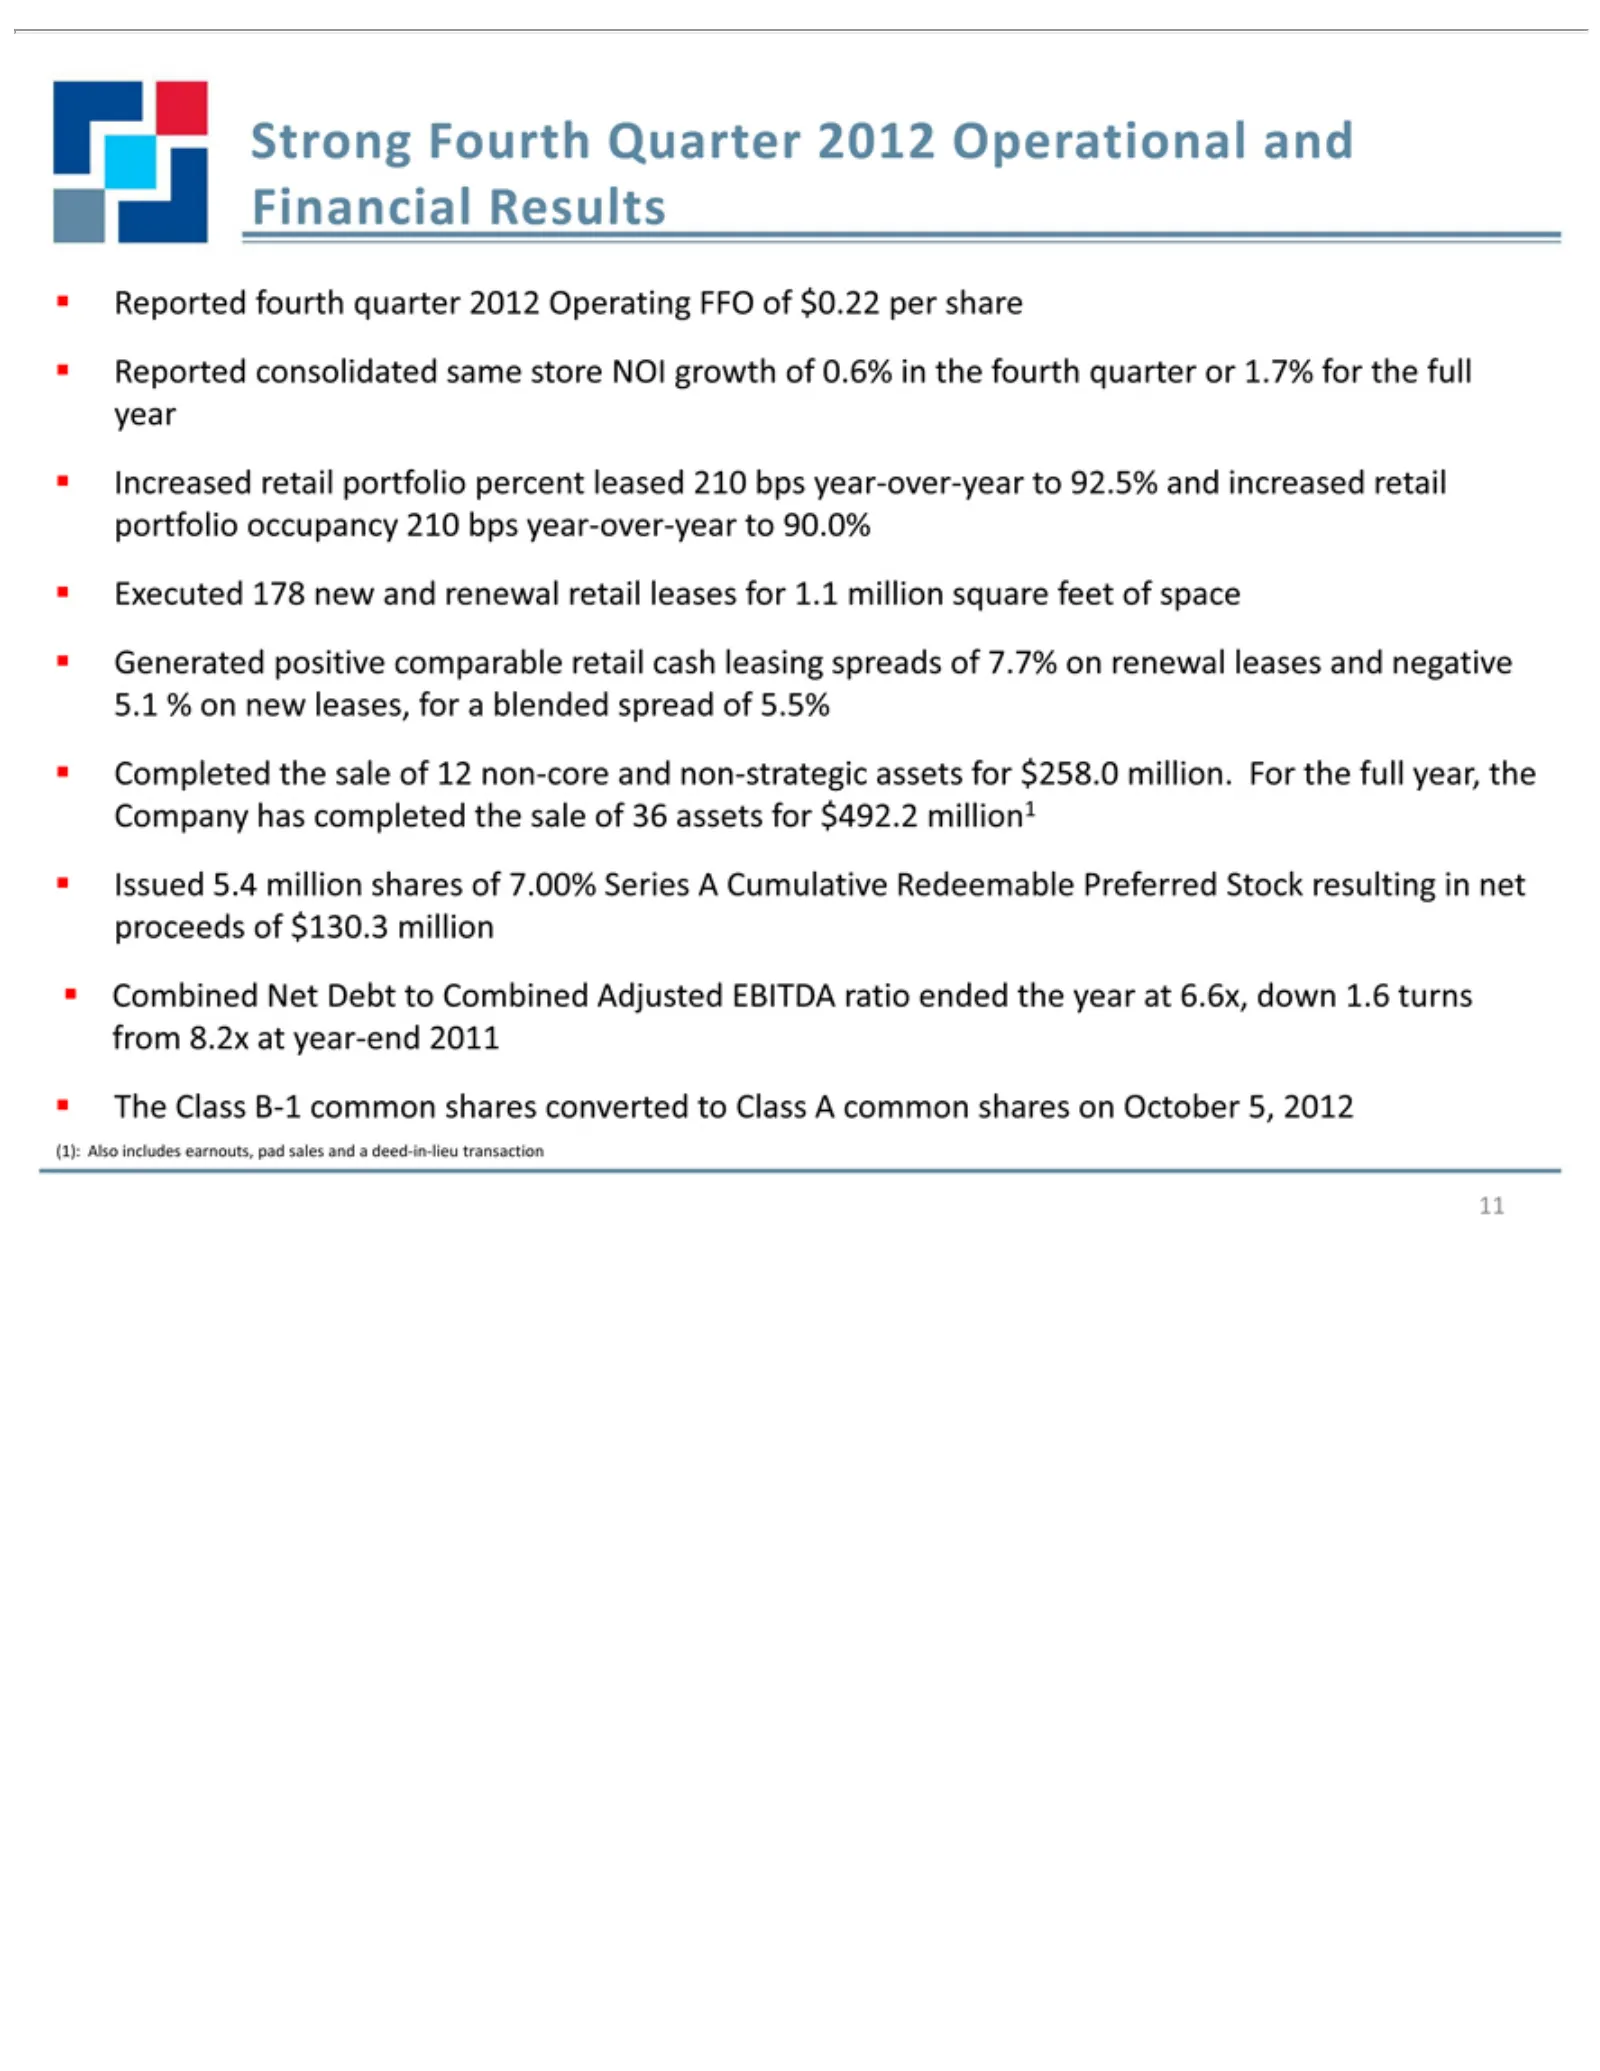
Slide 11: Strong Financial and Operational Results
Strong Financial 11 Reported Increased year portfolio Executed Generated 5.1 Completed Company Issued proceeds Combined from The (1): % Also Class 8.2x on 5.4 Fourth occupancy includes of new fourth consolidated 178 Results retail has at B-1 million positive Net the $130.3 year-end new completed lea
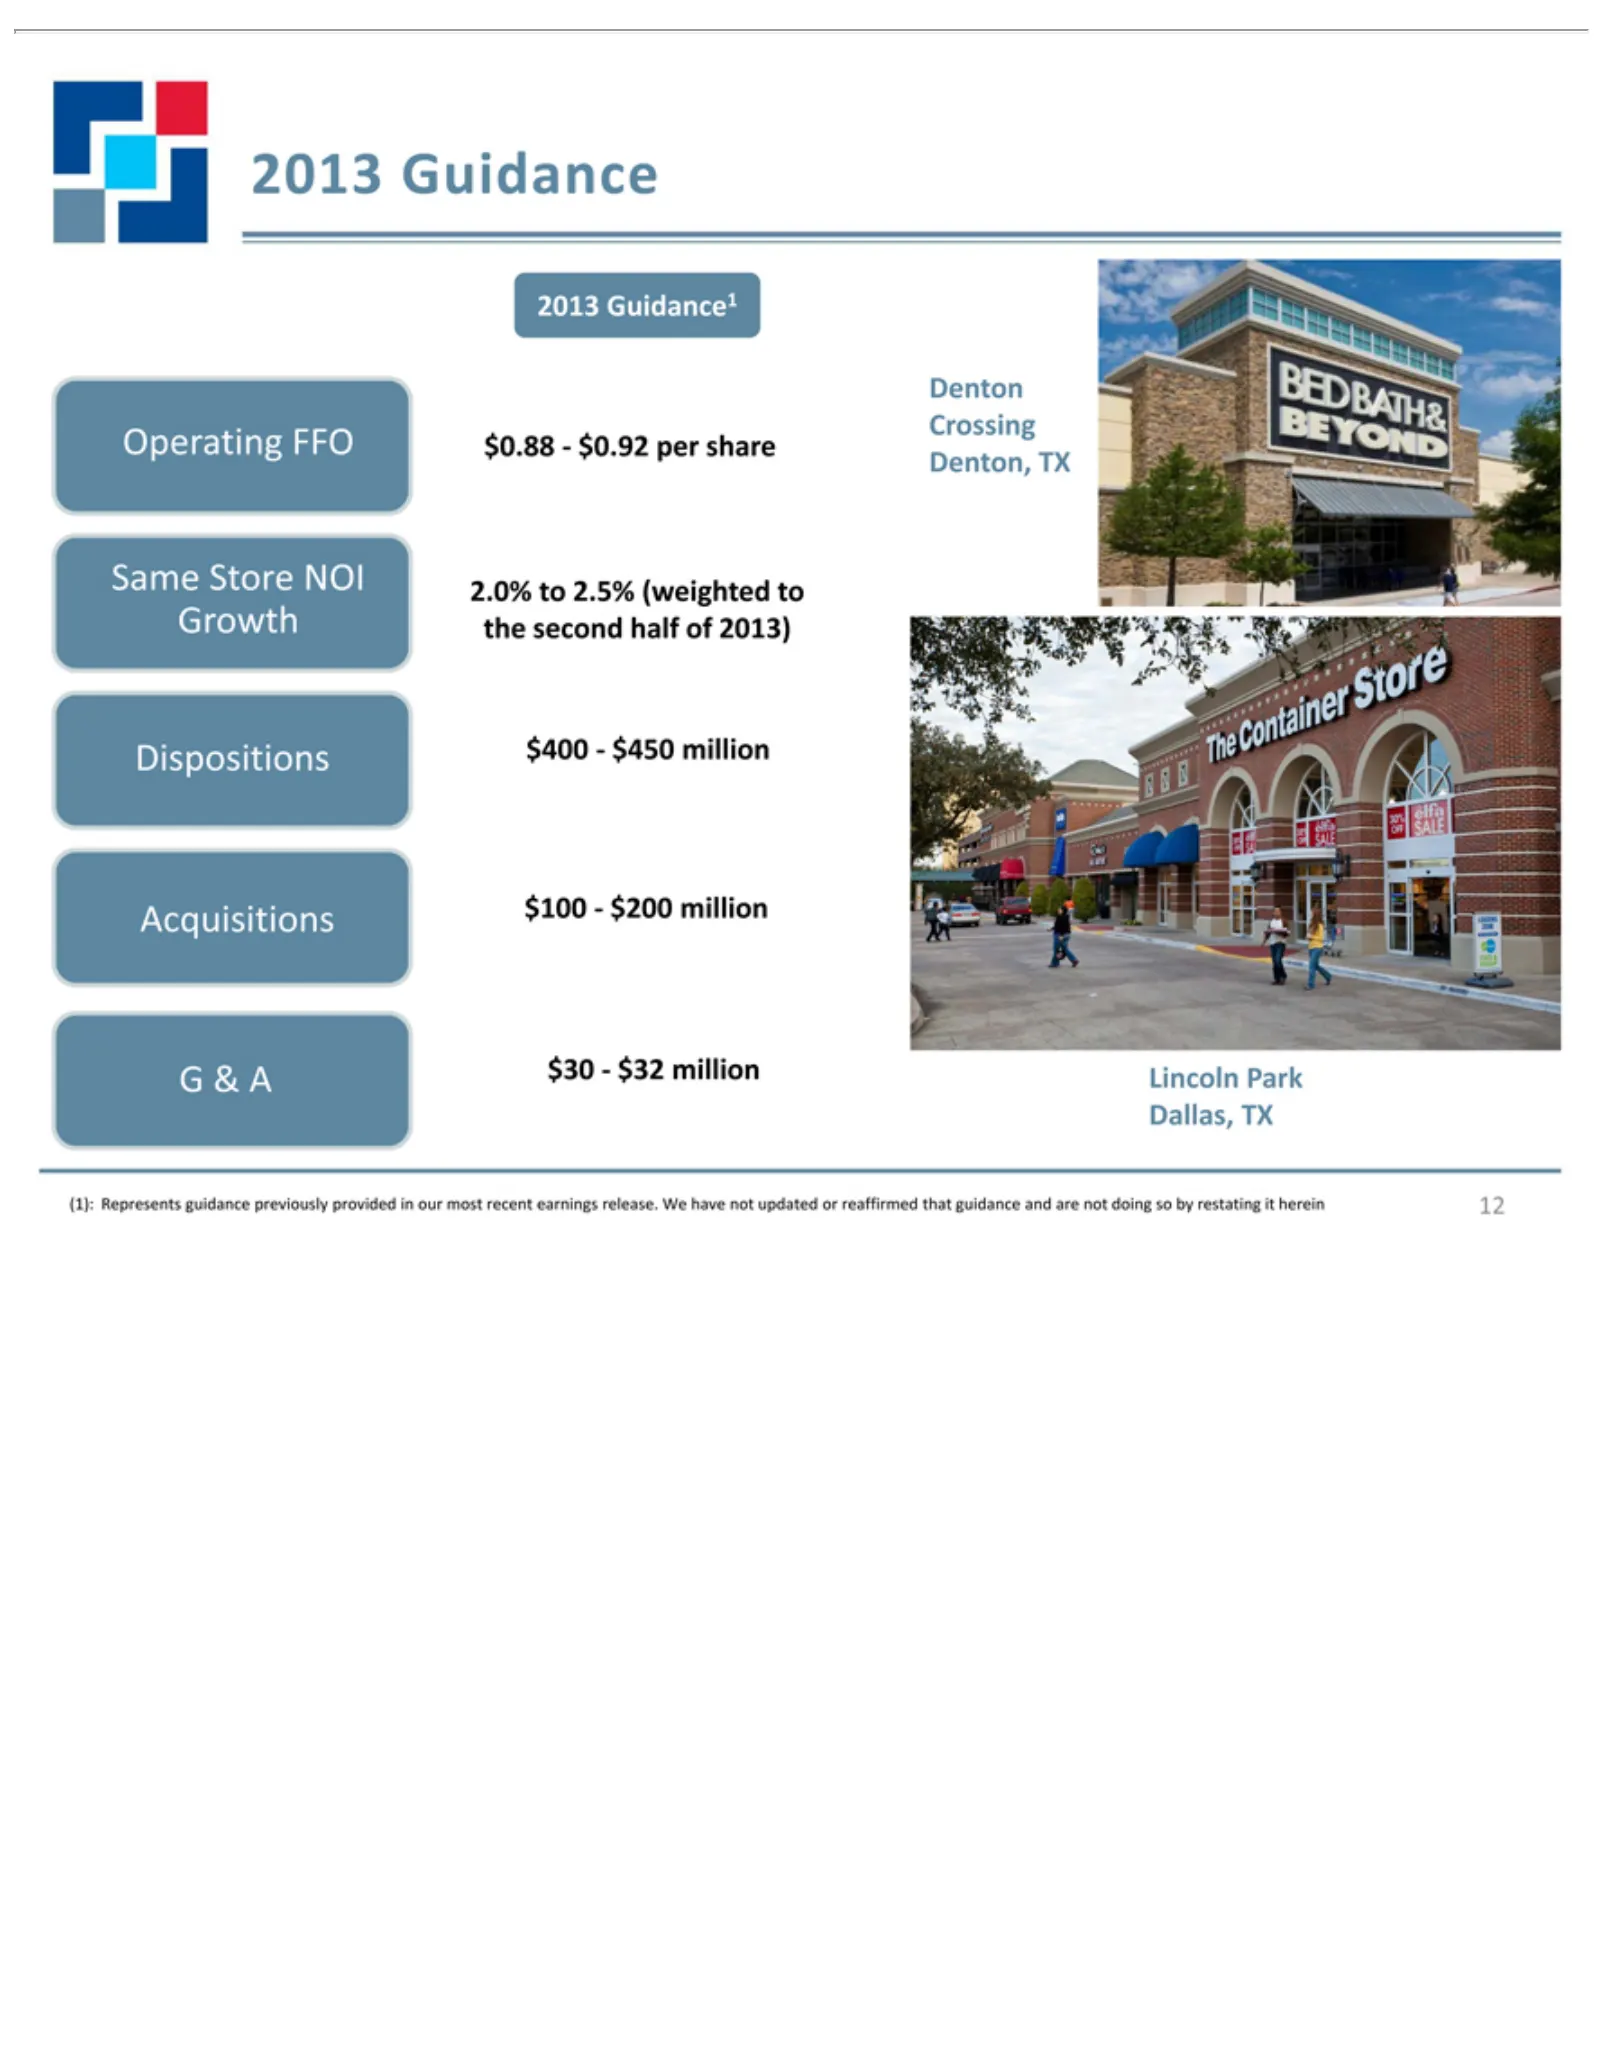
Slide 12: 2013 Guidance
2013 12 $0.88—$0.92 2.0% the $100—$200 Operating Same G Growth $400—$450 Acquisitions Dispositions $30—$32 (1): Denton, Crossing Denton Lincoln Dallas, & second Represents Guidance Guidance1 to Store TX Park 2.5% TXA FFO million half NOI million (weighted per of guidance share 2013) to previous
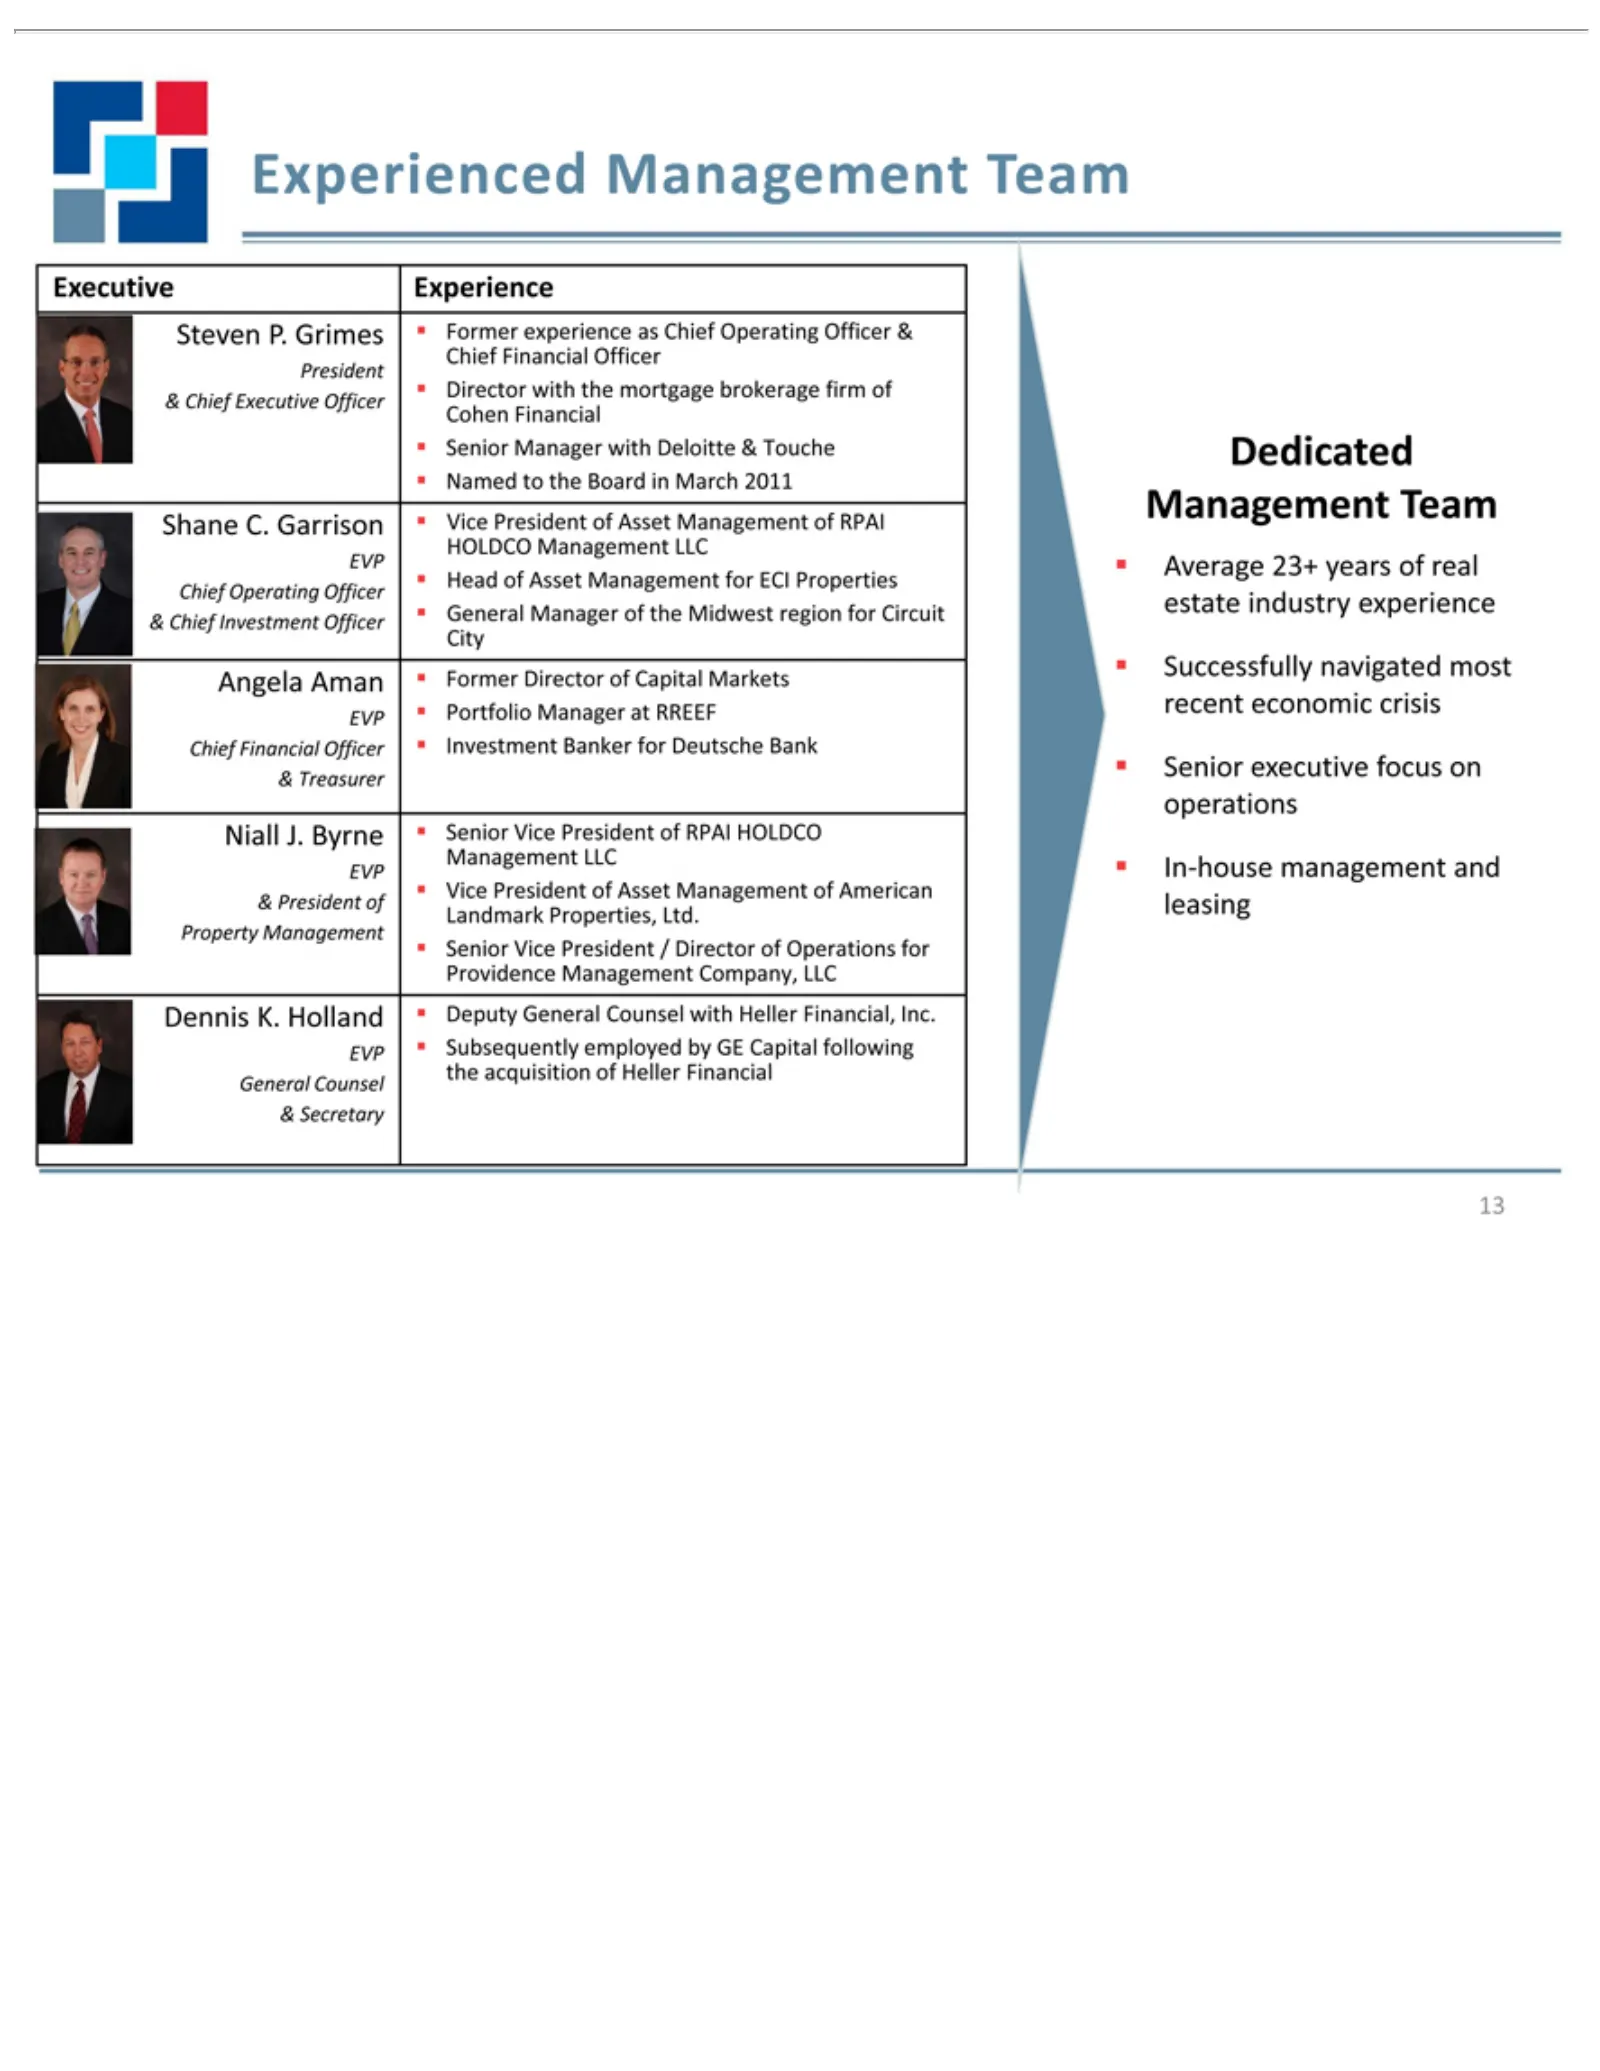
Slide 13: Experienced Executive Management Team
Experienced Executive 13 Steven with Shane Manager Angela Niall President Dennis Average estate Successfully recent Senior In-house operations Management Dedicated leasing <P><B>Searchable About Retail development 2012 owned, centers, Our demographics. marketing, motivated very experienced best Delo
Slide 14: About Retail Properties of America
Retail 14 properties Our demographics. results. Aboutexperienced Properties RPAI When nationally, people team of America, look both offers for wholly aInc. the fresh very is andvision a self-managed partially best to in leasing, retail, owned, REIT they innovative totaling come focused to 36and RPAI
Slide 15: Non-GAAP Reconciliations Appendix
Non-GAAP Reconciliations Appendix 15
Slide 16: Non-GAAP Financial Measures Definitions
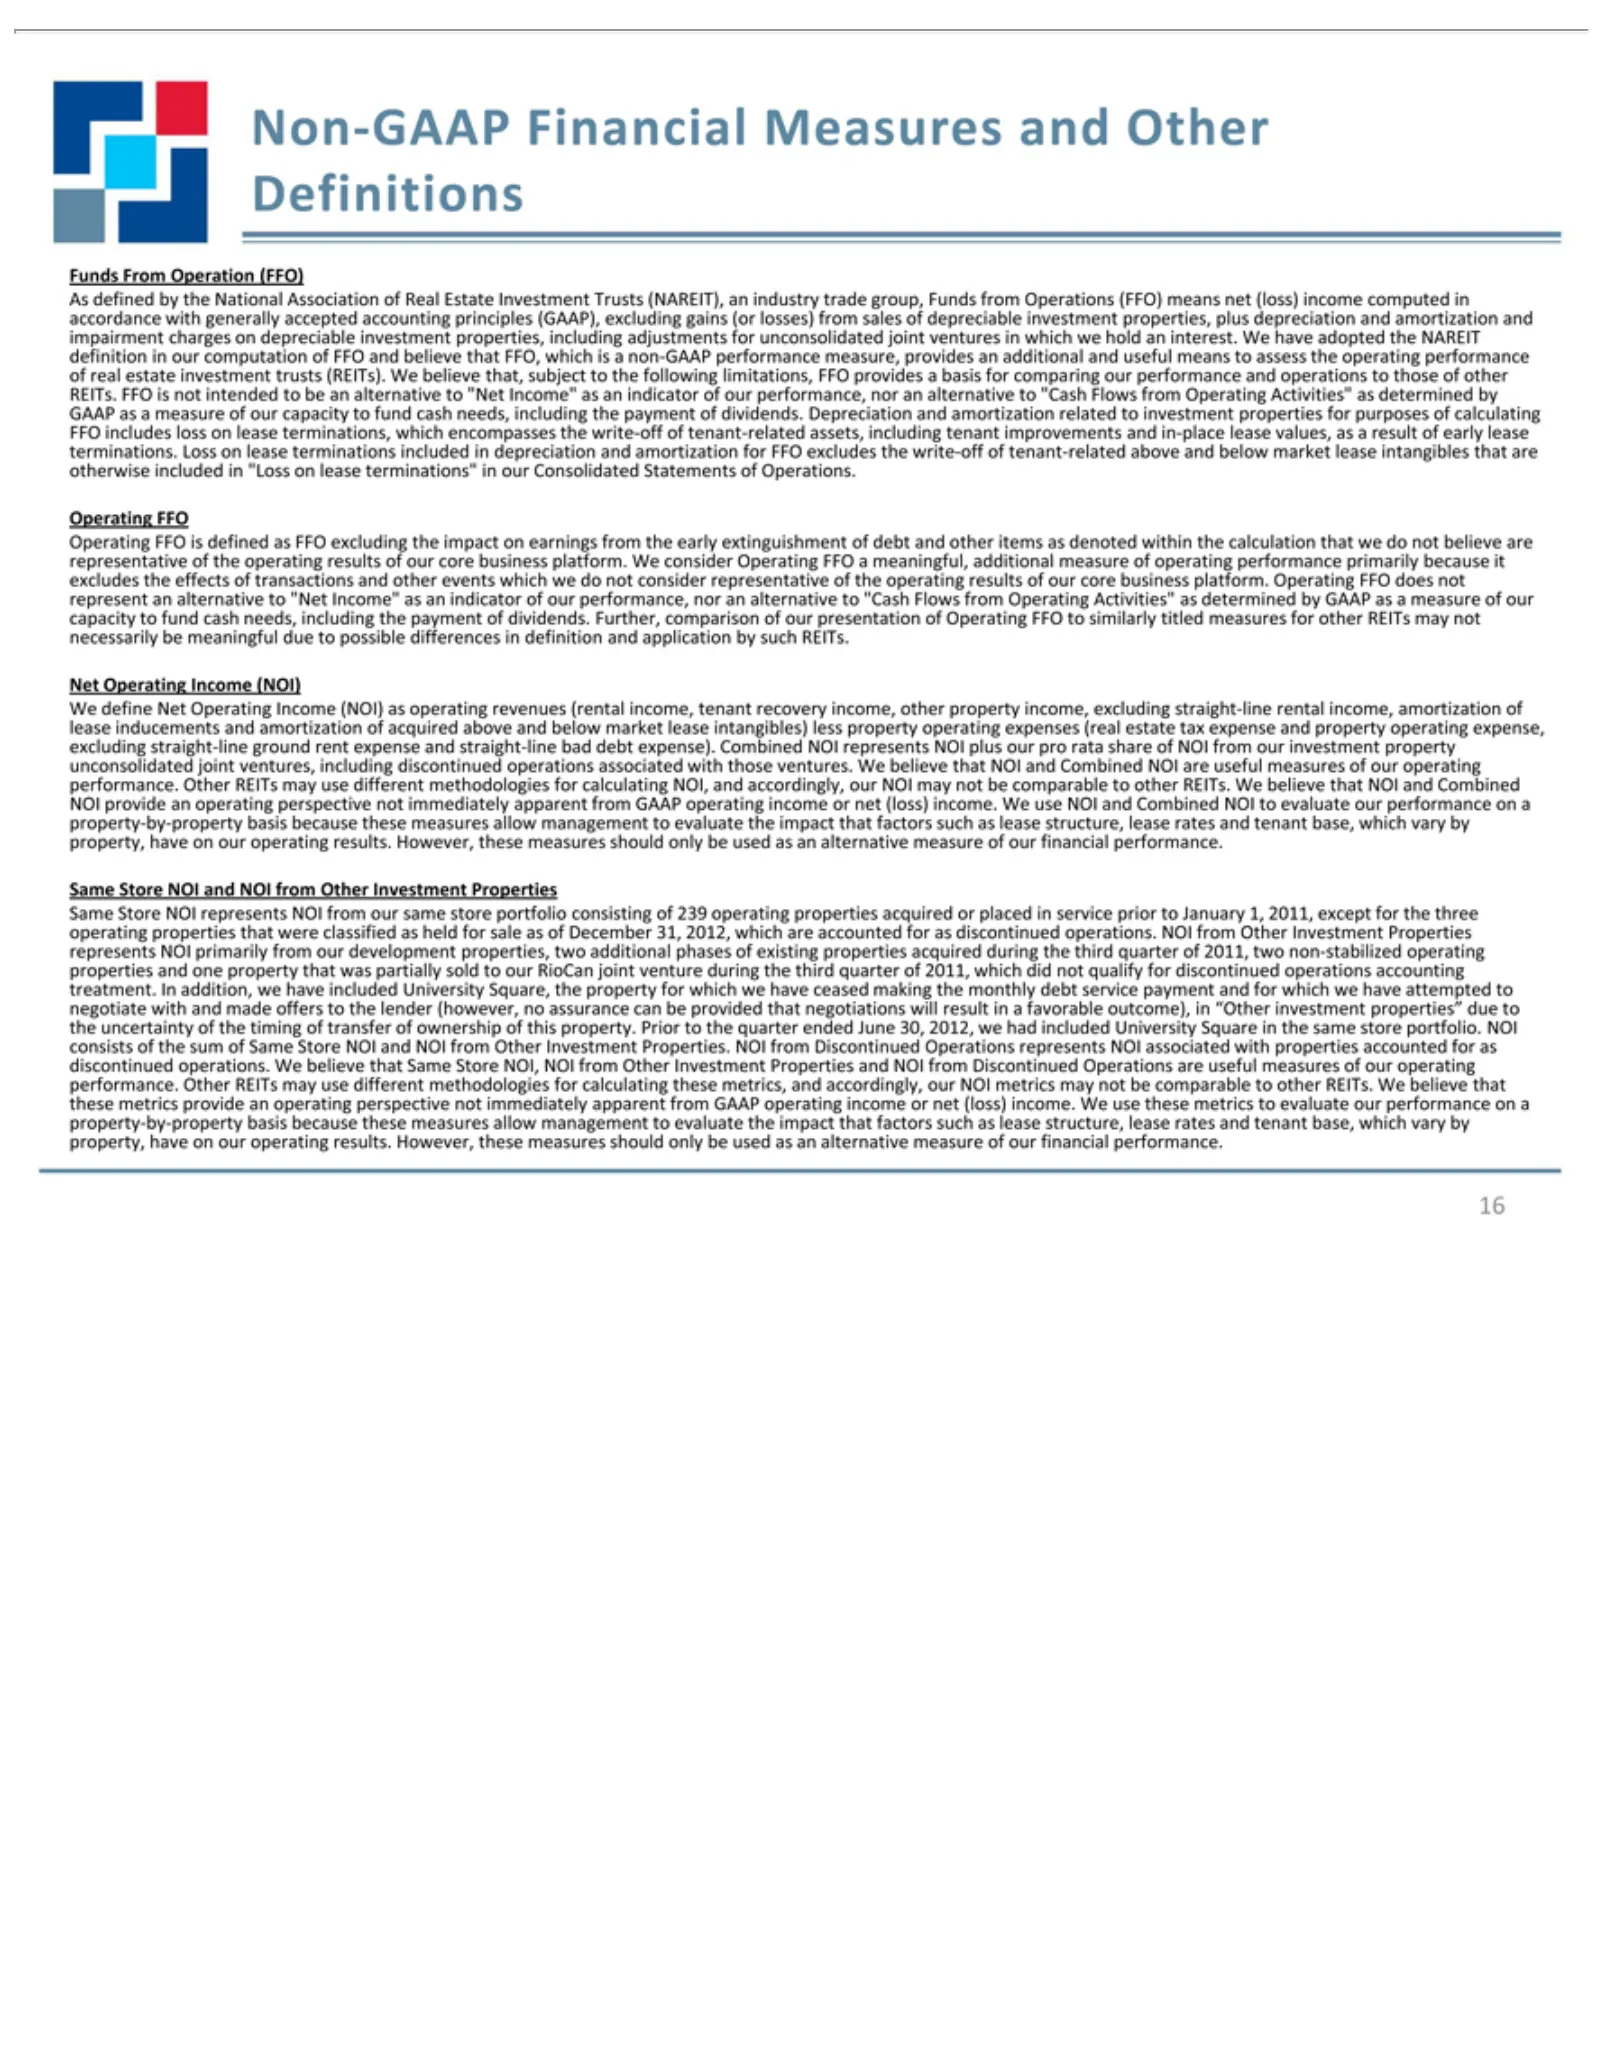
Non-GAAP Funds Definitions As accordance impairment definition of REITs. GAAP FFO terminations. otherwise Operating representative excludes represent capacity necessarily Net We lease excluding unconsolidated NOI Same operating represents properties treatment. negotiate the consists discontinued per
Slide 17: Non-GAAP Definitions (Continued)
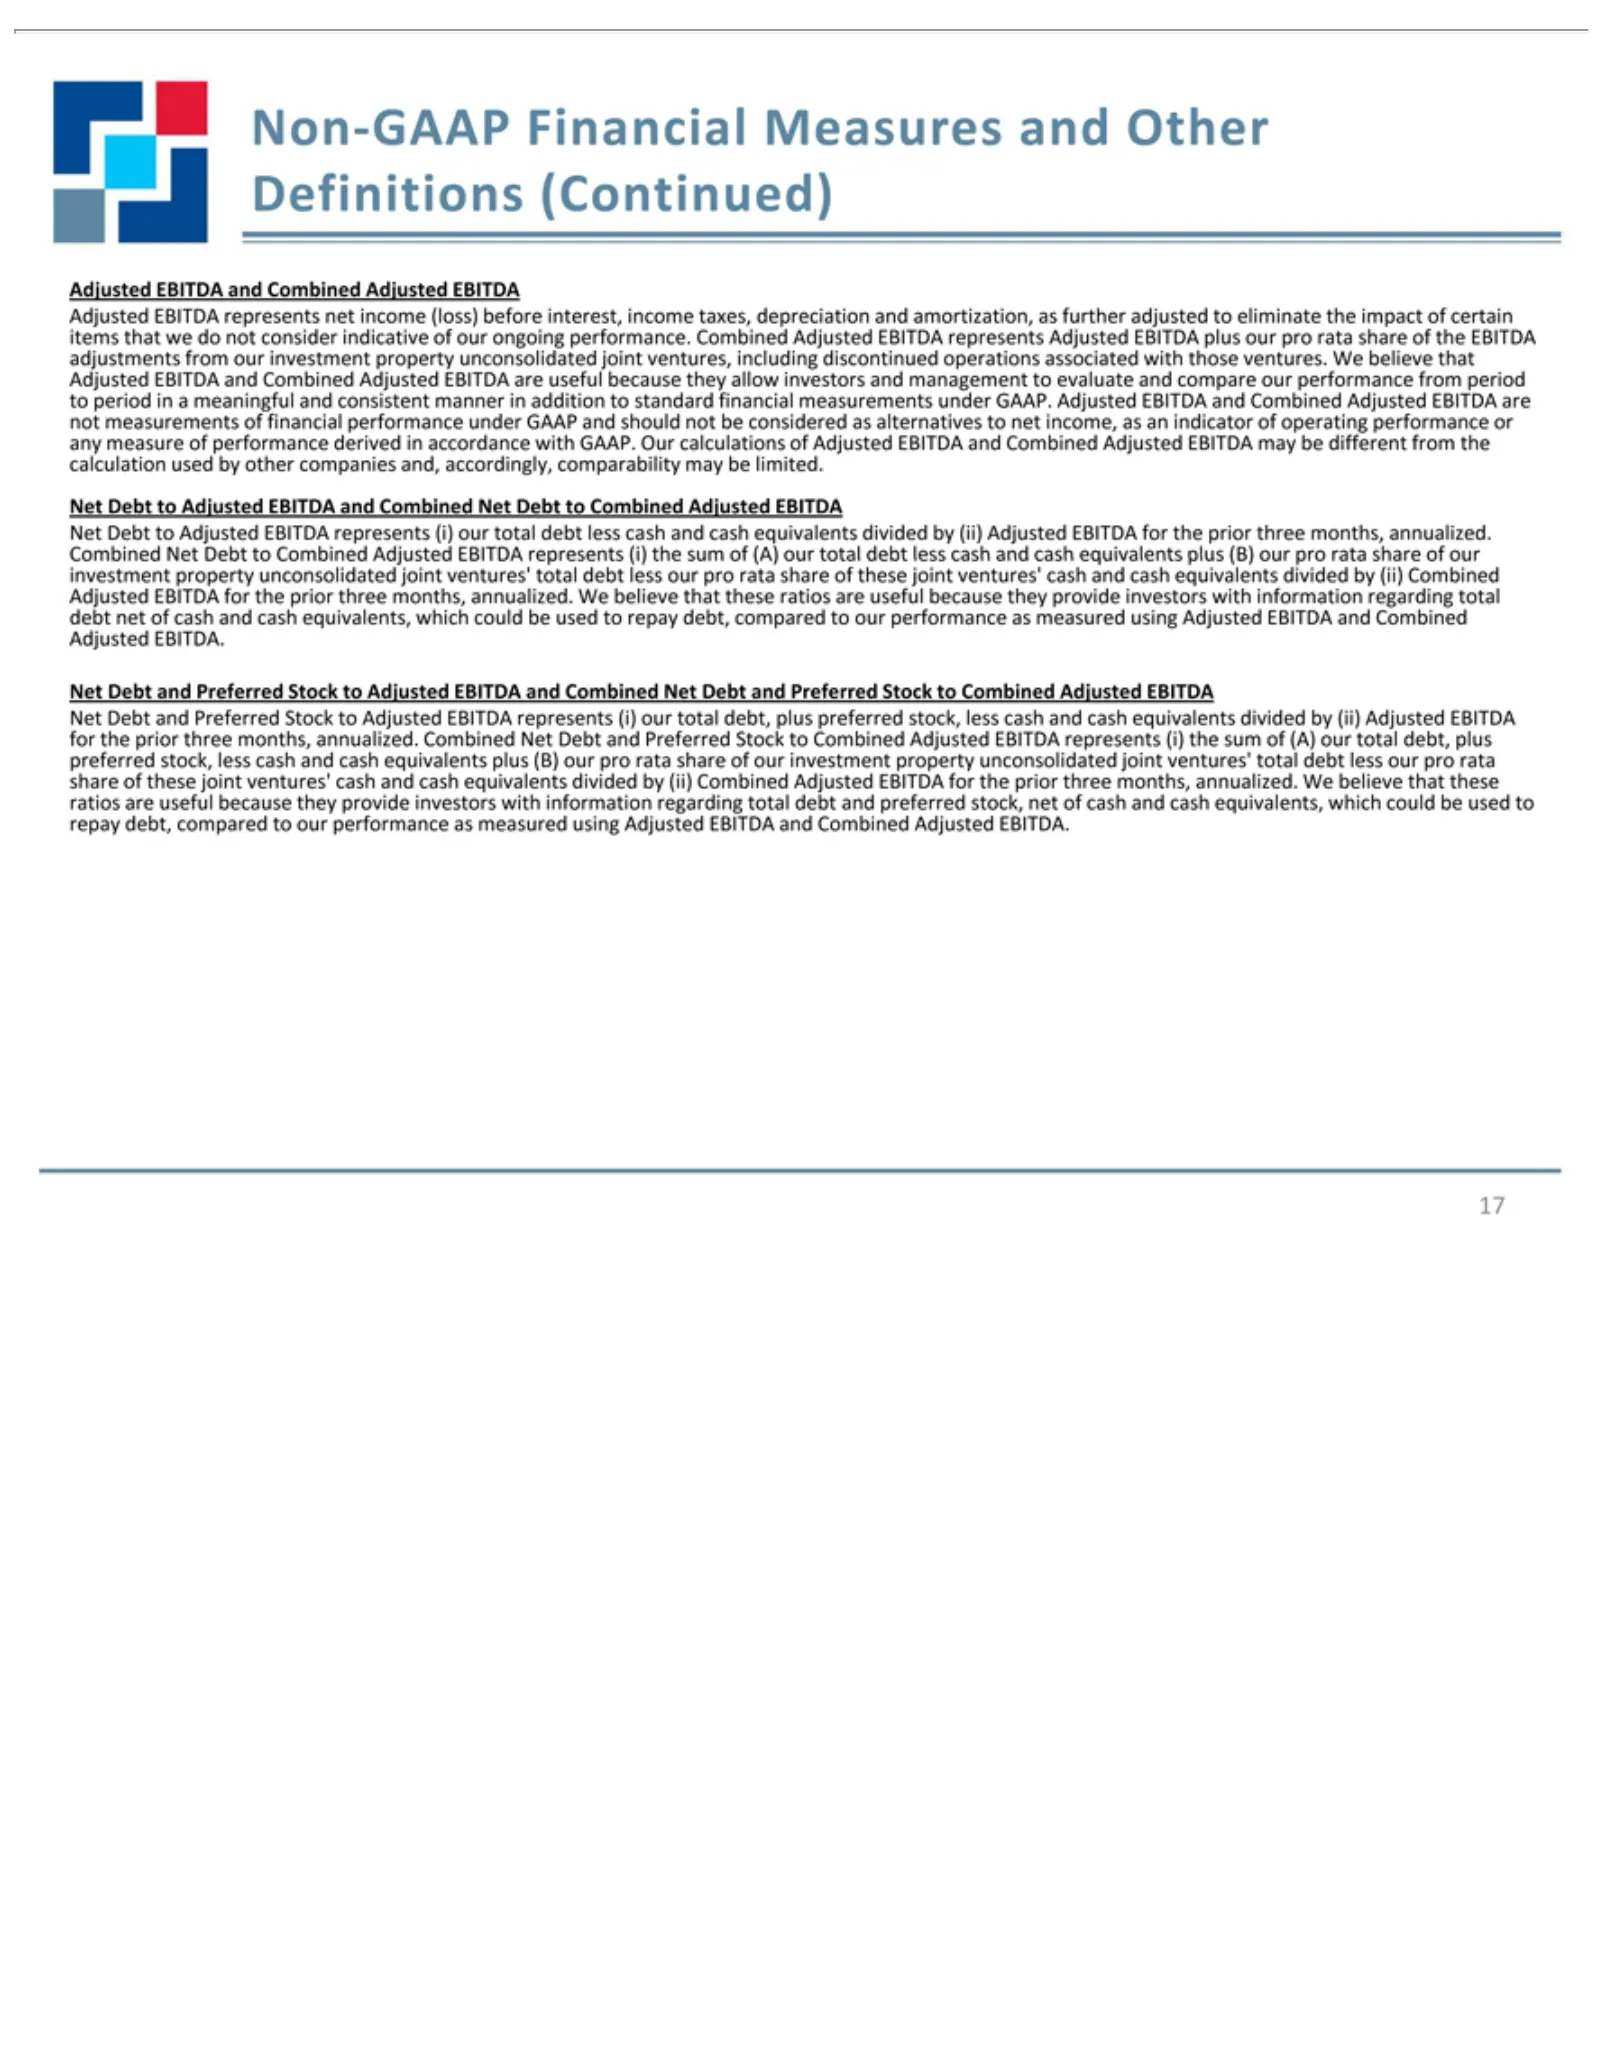
Non-GAAP Definitions items adjustments to not any calculation Combined investment debt Adjusted Net for preferred share ratios repay 17 period the measurements measure Debt net of that debt, are prior these ofin EBITDA EBITDA. to and stock, useful we Net cash used property compared (Continued) aAdju
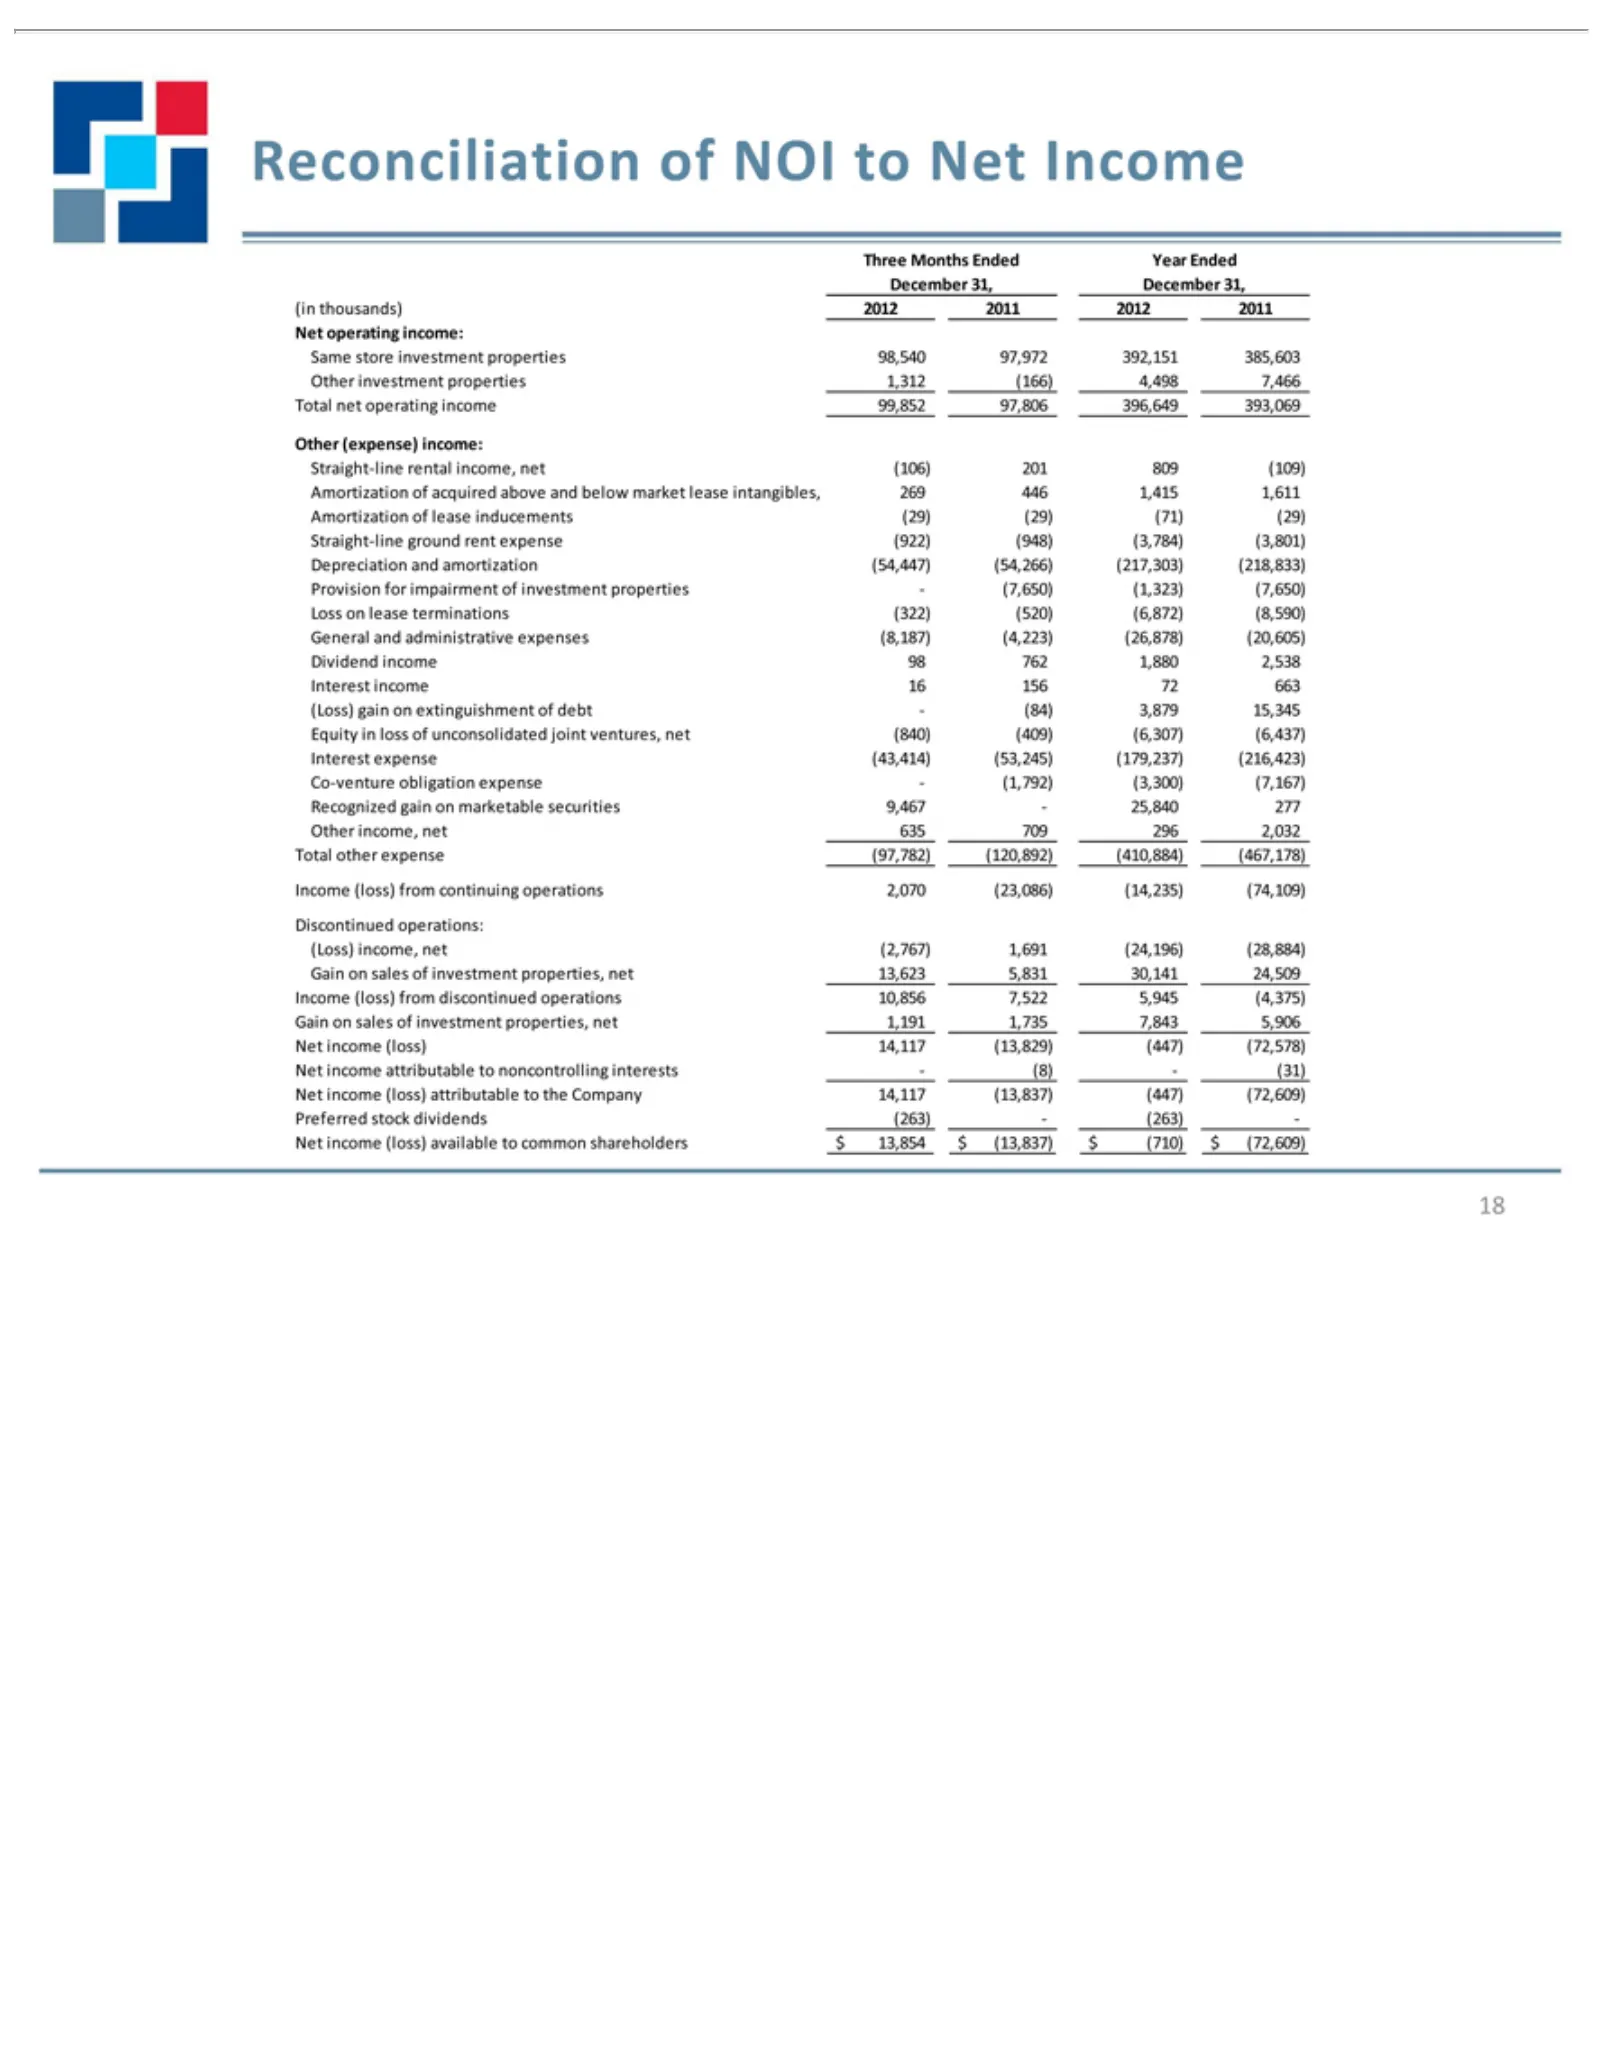
Slide 18: Same Store Operating Income Reconciliation
Reconciliation Three December (in Same Amortization Straight-line Depreciation Provision Loss General Dividend Equity Interest Co-venture Recognized Other Total Discontinued (Loss) Income Gain Preferred Net 18 thousands) operating income on net other store investment (expense) income, Months gain in
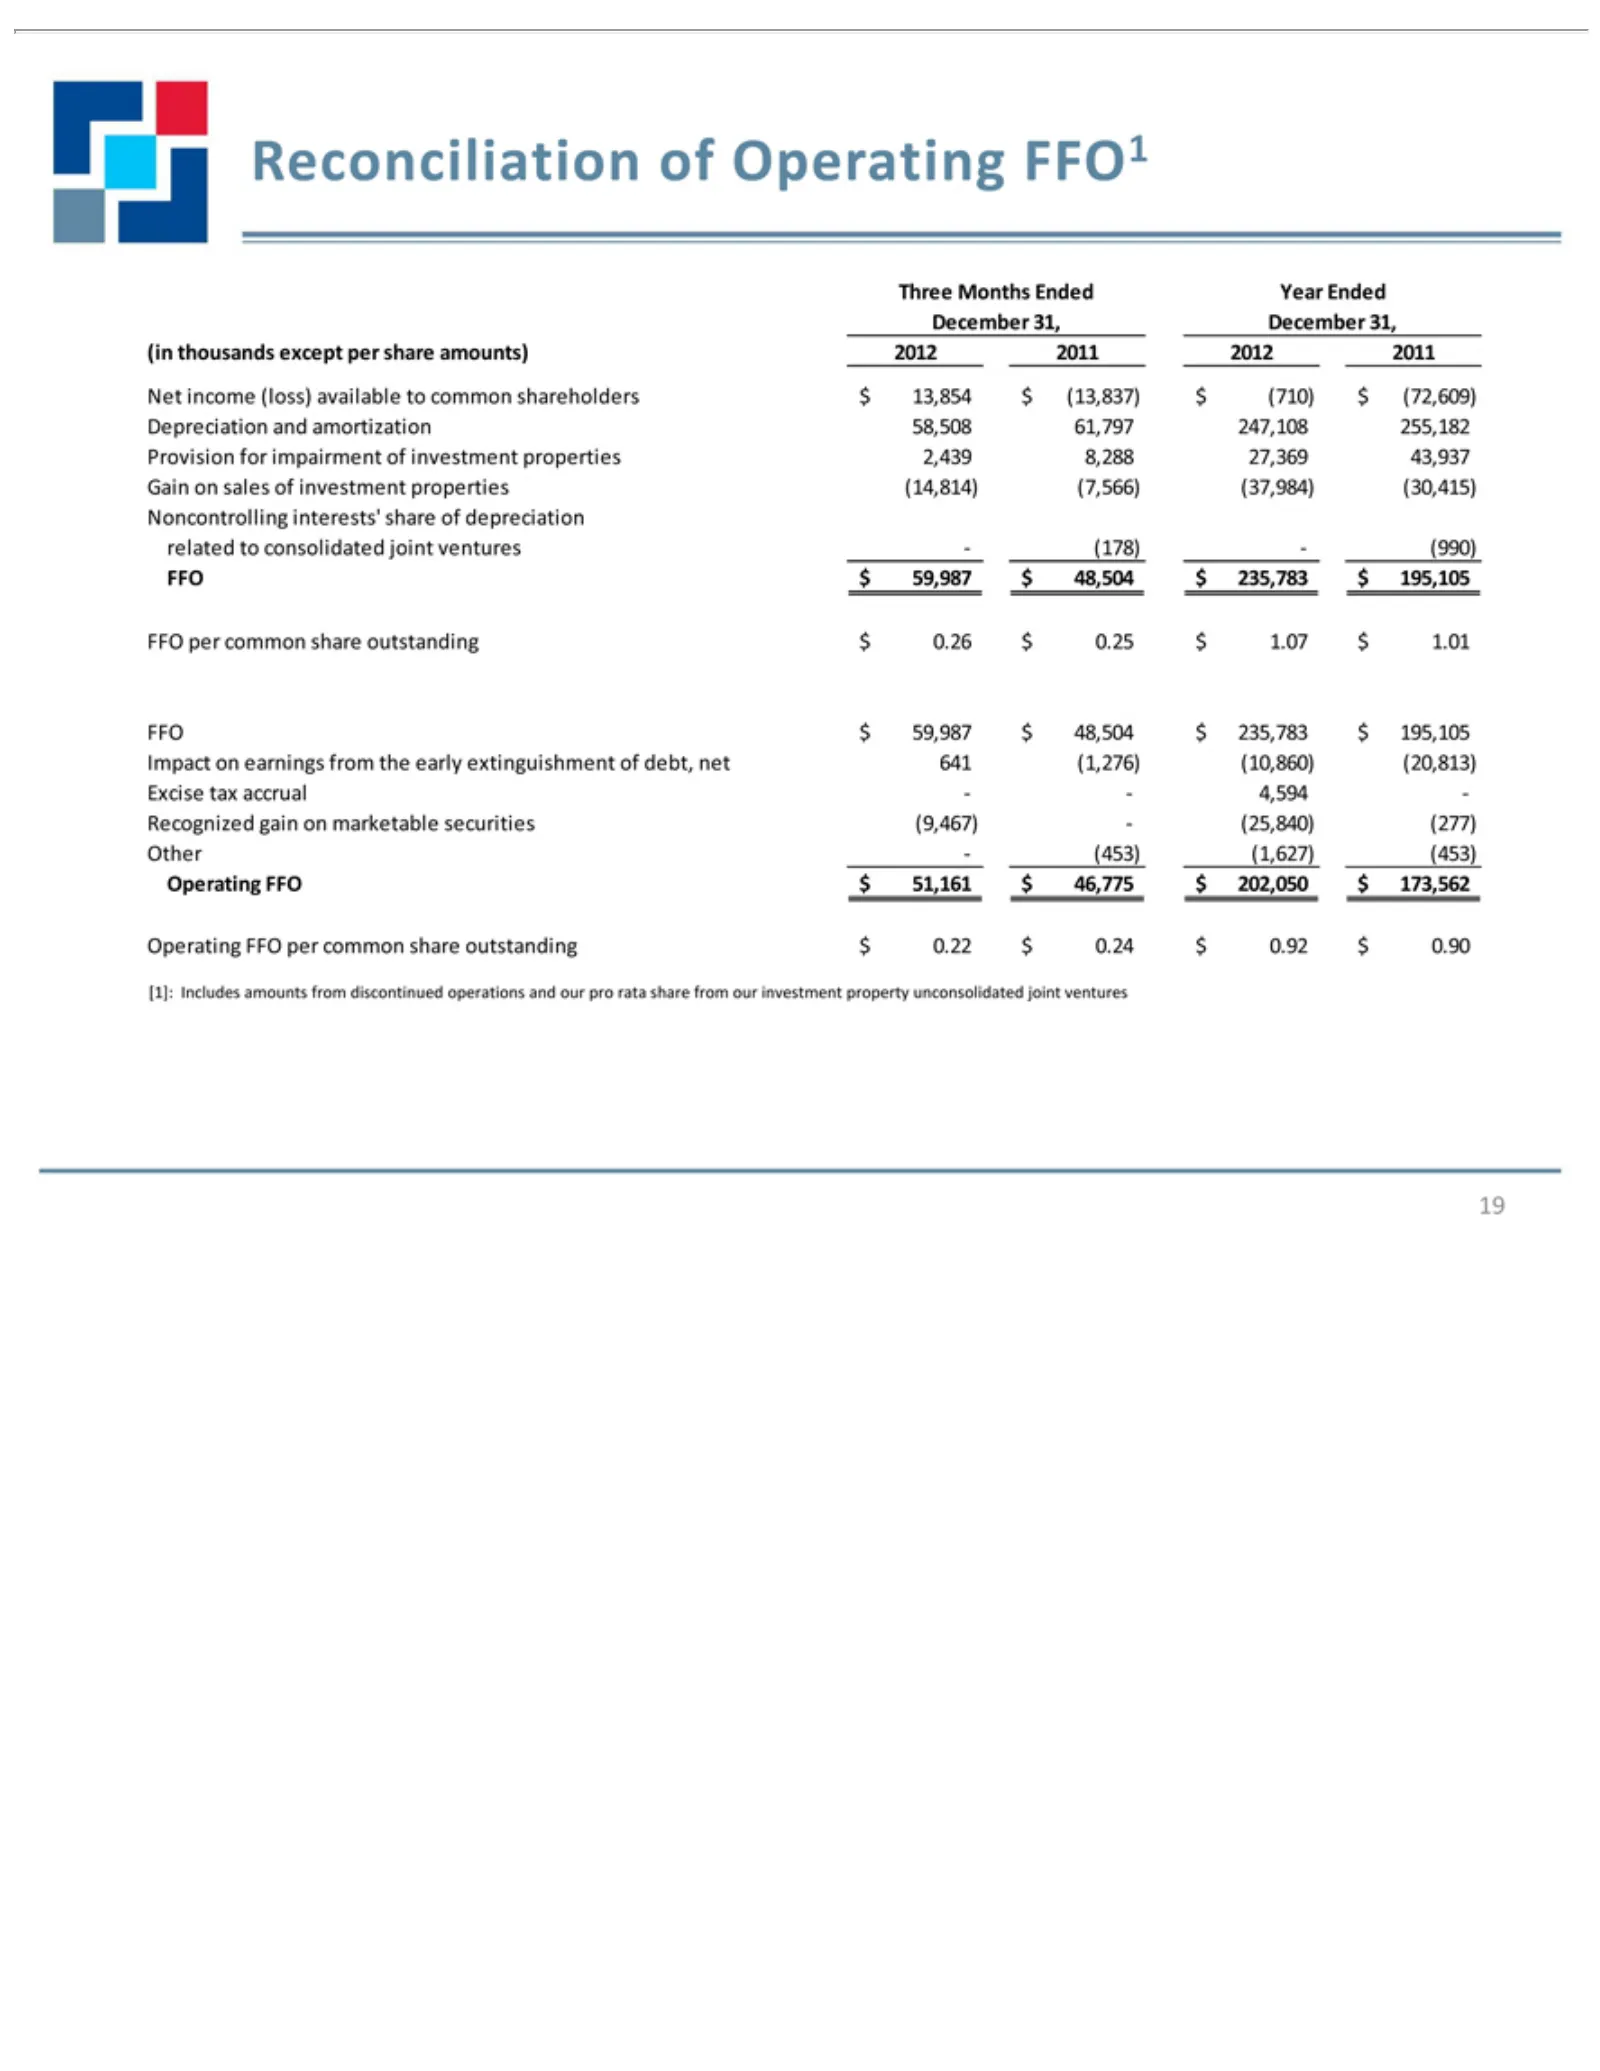
Slide 19: FFO Reconciliation
Reconciliation Three December (in Net Depreciation Provision Gain Noncontrolling related FFO Impact Excise Recognized Other Operating [1]: 19 thousands Includes income per $ on -Months 59,987 tax to on (453) sales common consolidated for FFO earnings 31, accrual (loss) gain amounts and impairment (1
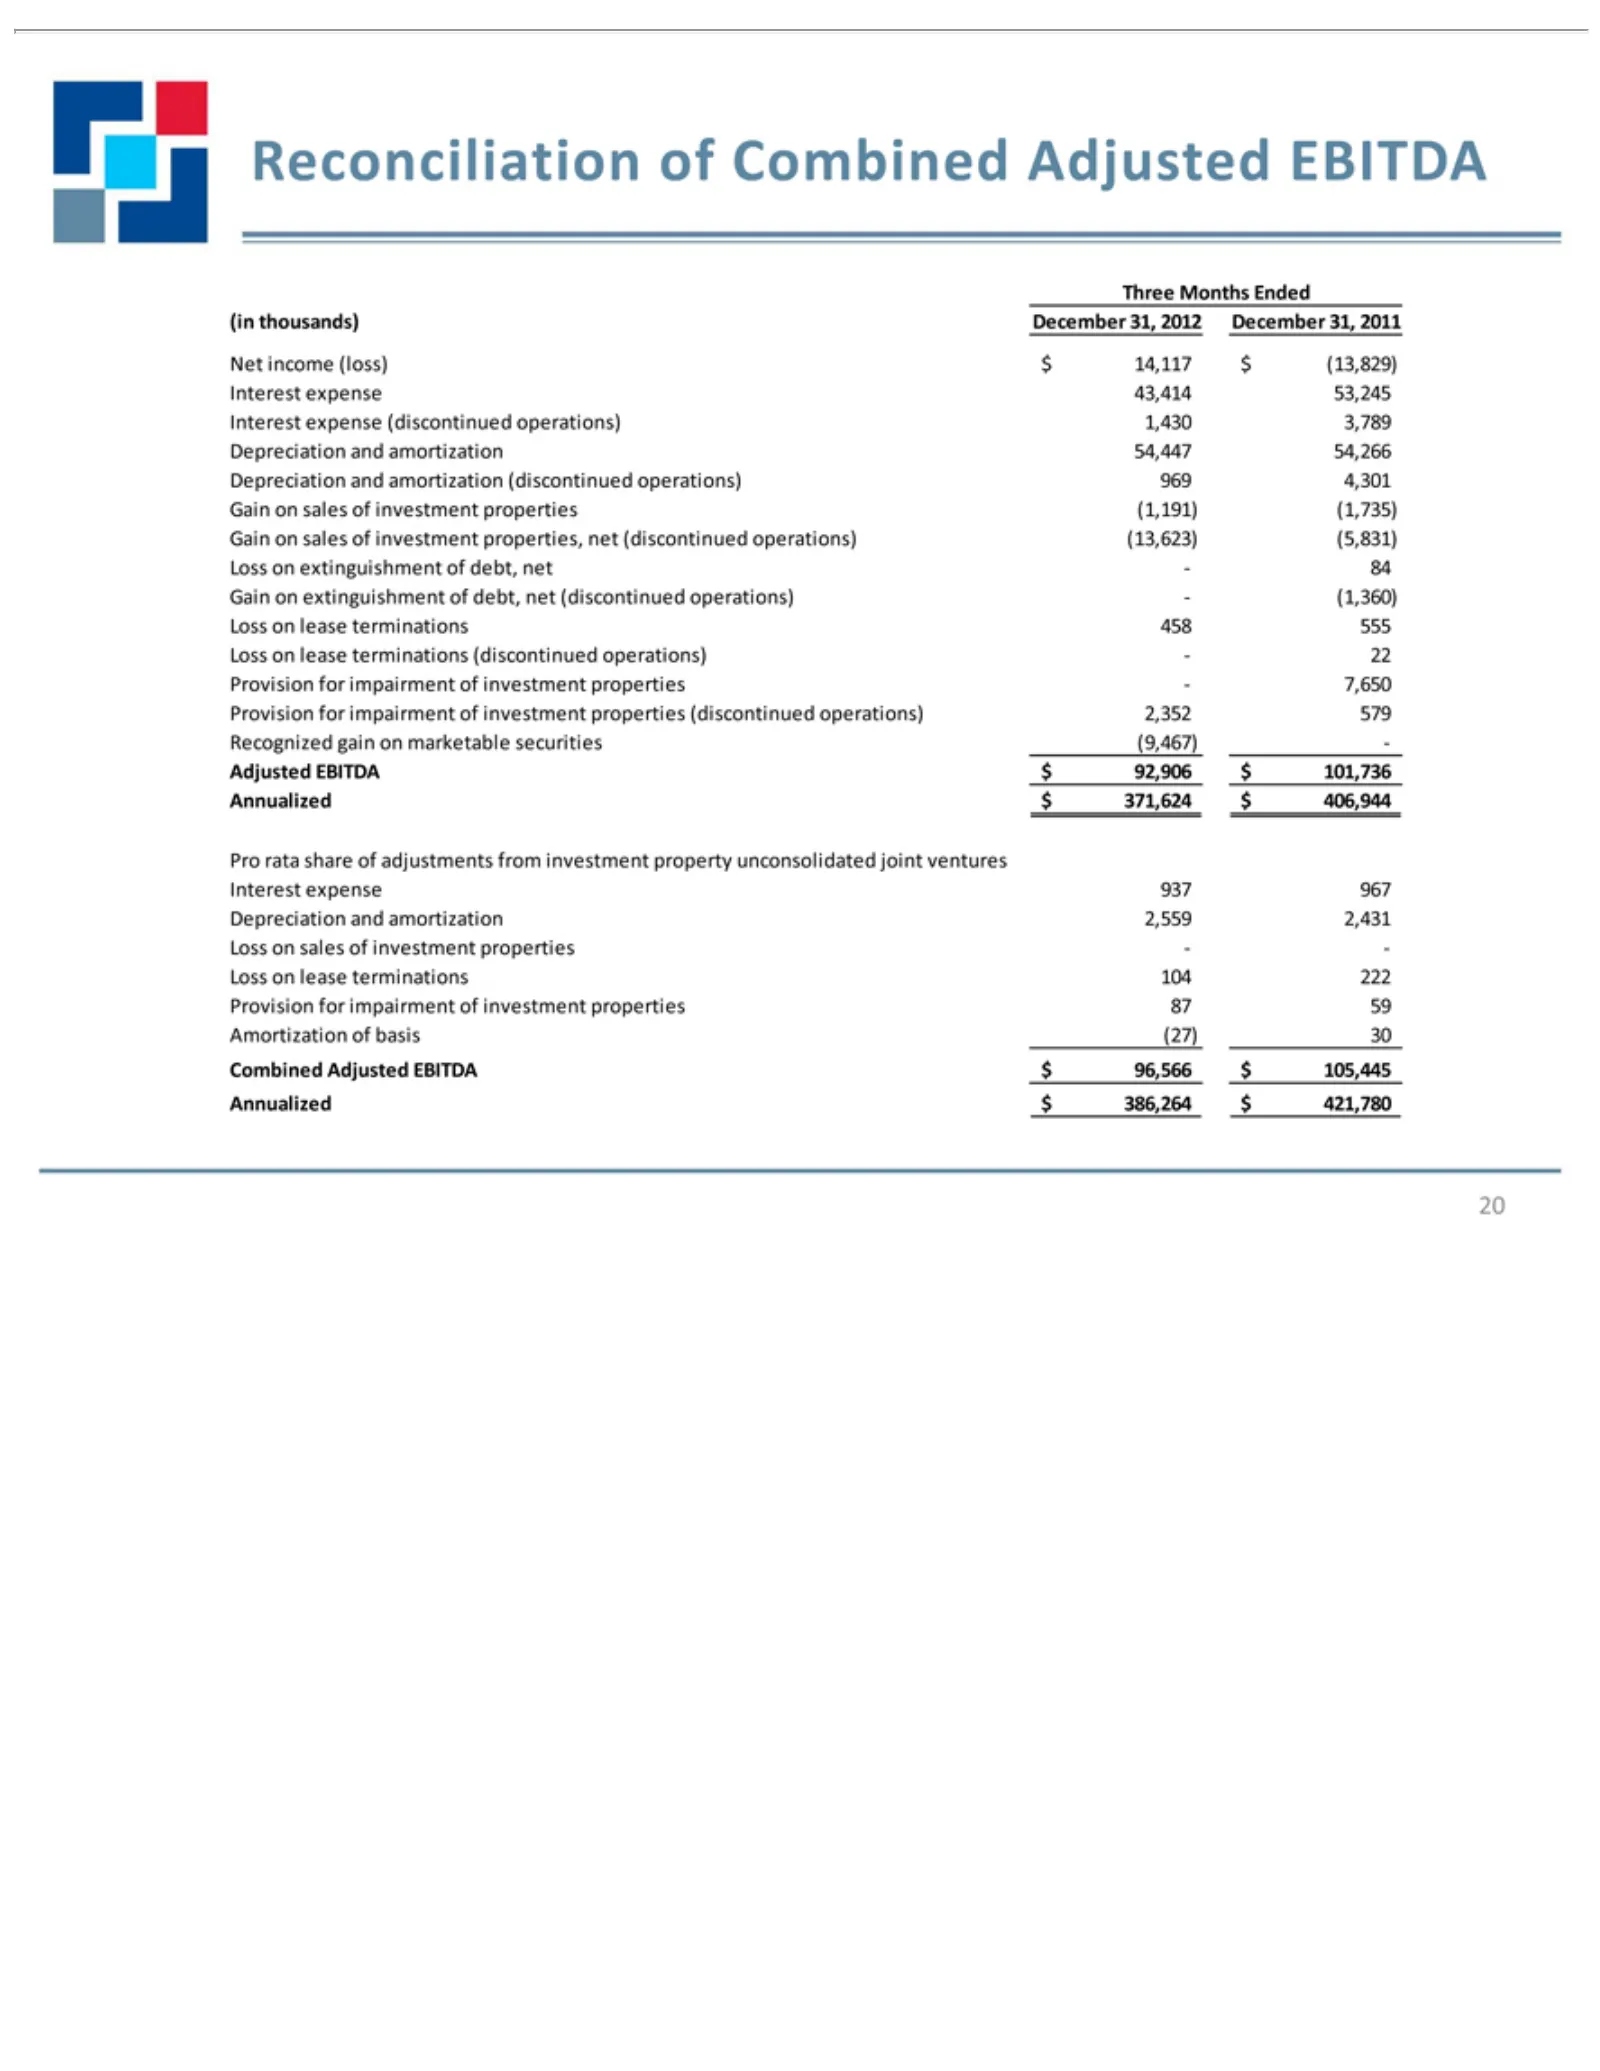
Slide 20: Combined Adjusted EBITDA Reconciliation
Reconciliation Three (in Net Gain Recognized Adjusted Pro Interest Depreciation Loss Provision Amortization Combined Annualized 20 thousands) rata income onMonths expense share extinguishment sales lease EBITDA for Adjusted $(loss) gain and impairment of 371,624 386,264 terminations of Ended Decembe
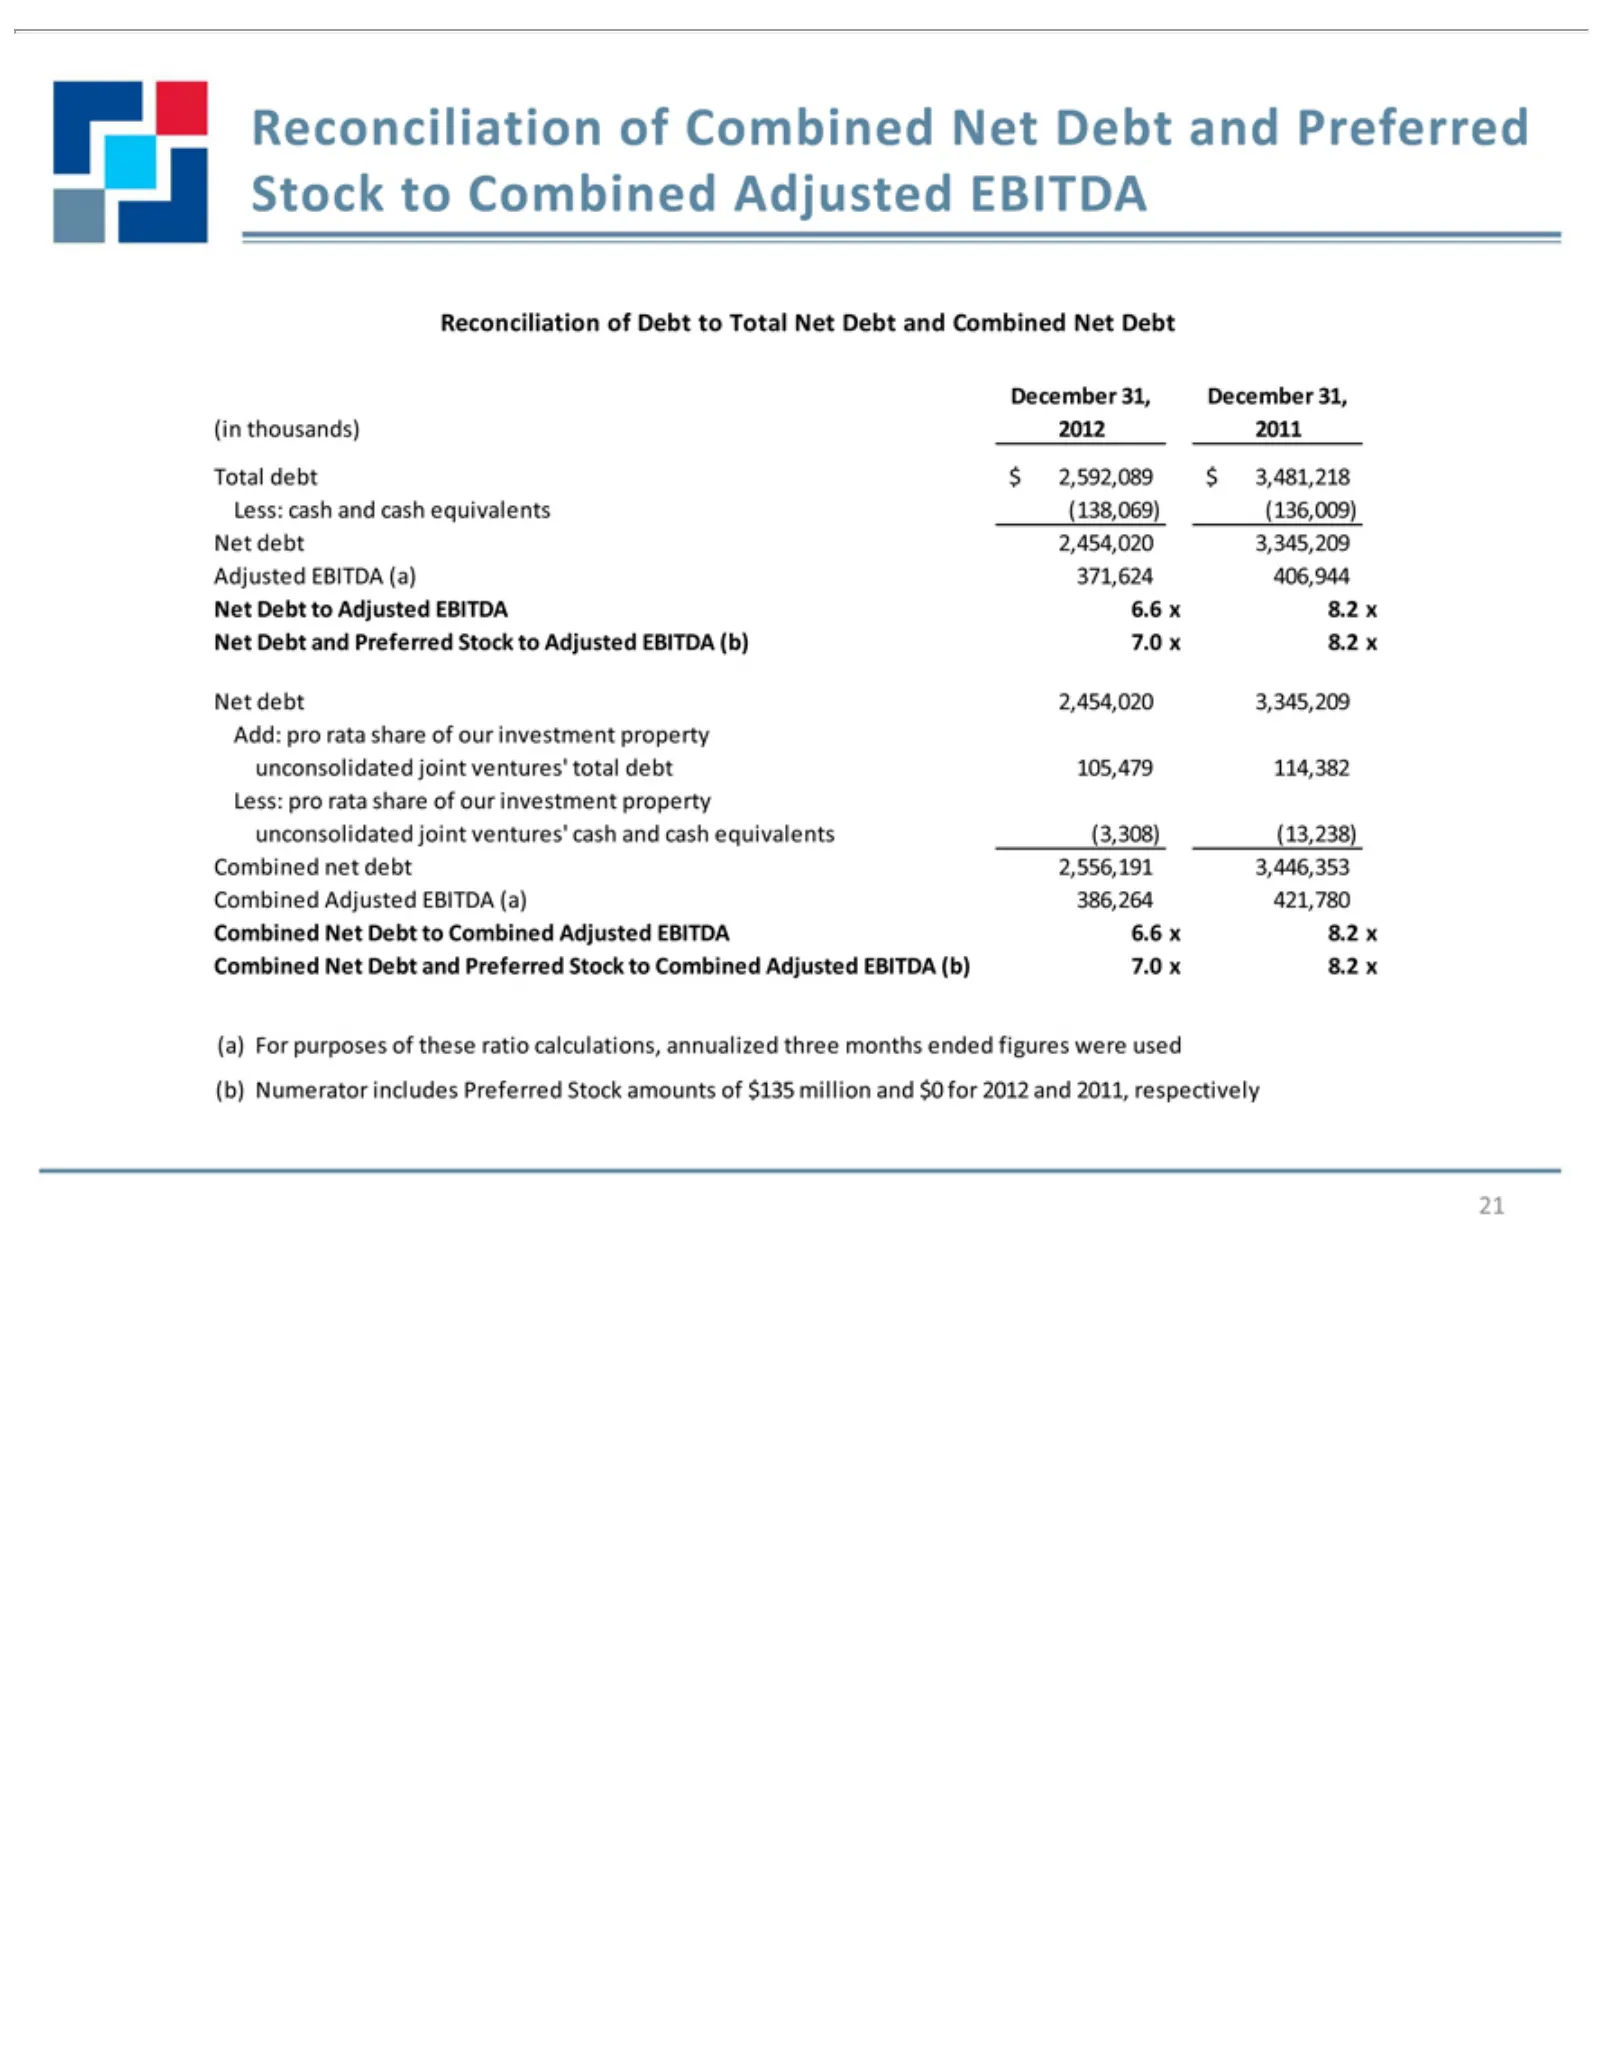
Slide 21: Net Debt to Adjusted EBITDA Reconciliation
Stock Reconciliation December (in Total Adjusted Net Add: Less: unconsolidated Combined (a) (b) 21 For thousands) Numerator Debt debt pro debt cash pro topurposes Combined 2,454,020 rata EBITDA to and rata $31, Adjusted and net Net Adjusted 2,592,089 share Preferred share December debt 2012 includes
Source: SEC EDGAR · 8-K filed Feb 26, 2013
More decks from Retail Properties of America Inc
 Merger or Acquisition (July 2021)17 slides · Jul 19, 2021
 Investor Presentation (July 2020)23 slides · Jul 17, 2020
 Q2 2019 Earnings Presentation5 slides · Jul 30, 2019
 Investor Day (September 2016)100 slides · Sep 21, 2016
 Investor Day (June 2013)68 slides · Jun 27, 2013
 Investor Presentation (November 2012)26 slides · Nov 13, 2012