Cal Dive International — Q4 2011 Earnings Presentation
12 slides from Cal Dive International's earnings presentation, Feb 29, 2012
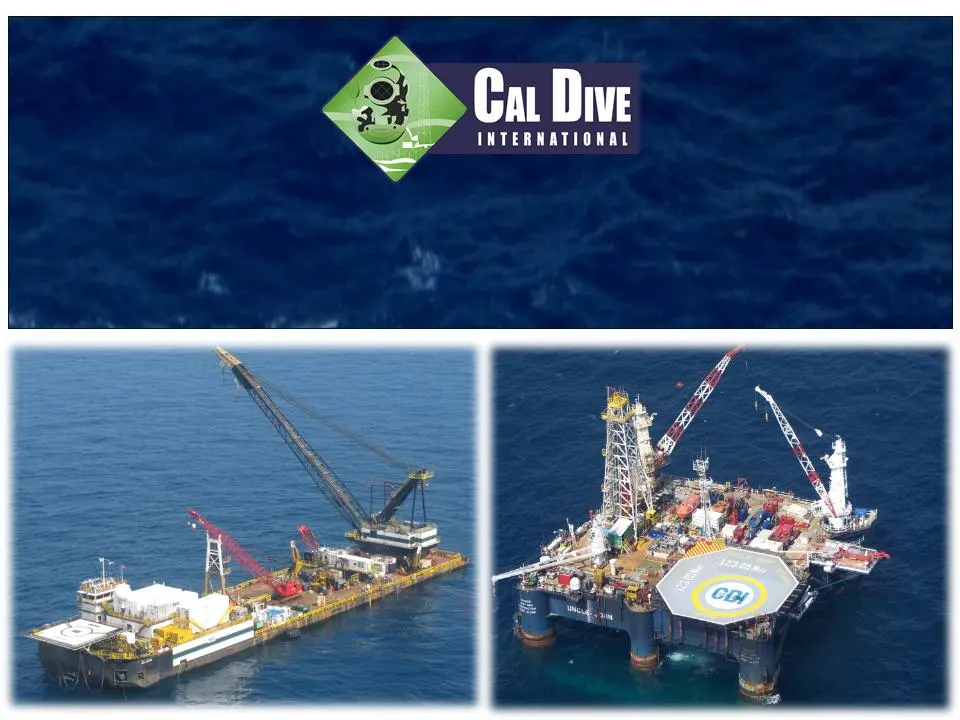
Slide 1: Cal Dive International 4th Quarter 2011 Earnings Conference Call
Cal Dive International 4 th Quarter 2011 Earnings Conference Call
Slide 2: Forward-Looking Statements
Forward-Looking Statements This presentation may include “forward-looking” statements that are generally identifiable through our use of words such as “believe,” “expect,” “anticipate,” “intend,” “plan,” “estimate,” “project” and similar expressions and include any statements that we make regarding
Slide 3: Presentation Outline
Presentation Outline Summary of 4Q 2011 Results Backlog Discussion of Financial Results Non-GAAP Reconciliations Questions & Answers

Slide 4: Summary of 4Q Results
Summary of 4Q Results Strong profitability in Australia for diving related work on Gorgon project. Decreased domestic financial results compared to 4Q 10 due to harsher weather in December and dry-dock of Uncle John. Bahamas construction project performed in 4Q 10 did not reoccur in 4Q 11. Strong fr
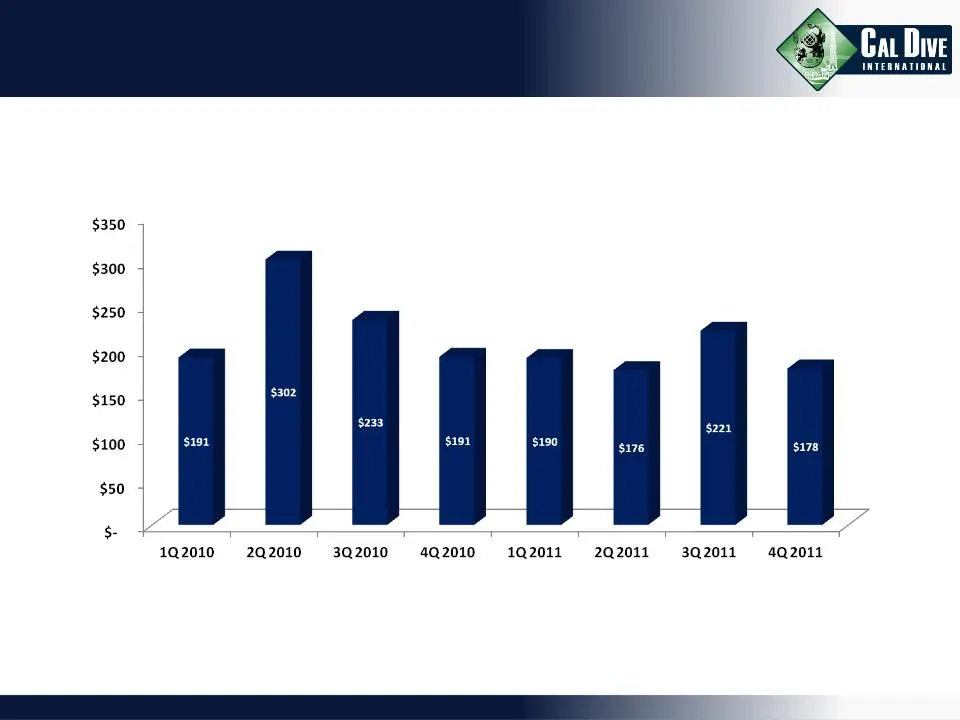
Slide 5: Ca Dive
Ca Dive INTERMATIONAL $221 $176 $178 if a 1Q2010 2Q2010 32010 4Q2010 1Q2011 2Q2011 3Q2011 4Q2011

Slide 6: Financial Results
Financial Results (all amounts in thousands, except per share amounts and percentages) Three Months Twelve Months Ended December 31, Ended December 31, 2011 2010 2011 2010 Revenues $127,434 $161,040 $479,811 $536,468 Gross Profit 7,788 23,673 14,266 62,442 Margins 6% 15% 3% 12% Net Loss ($8,771) ($2
Slide 7: Utilization
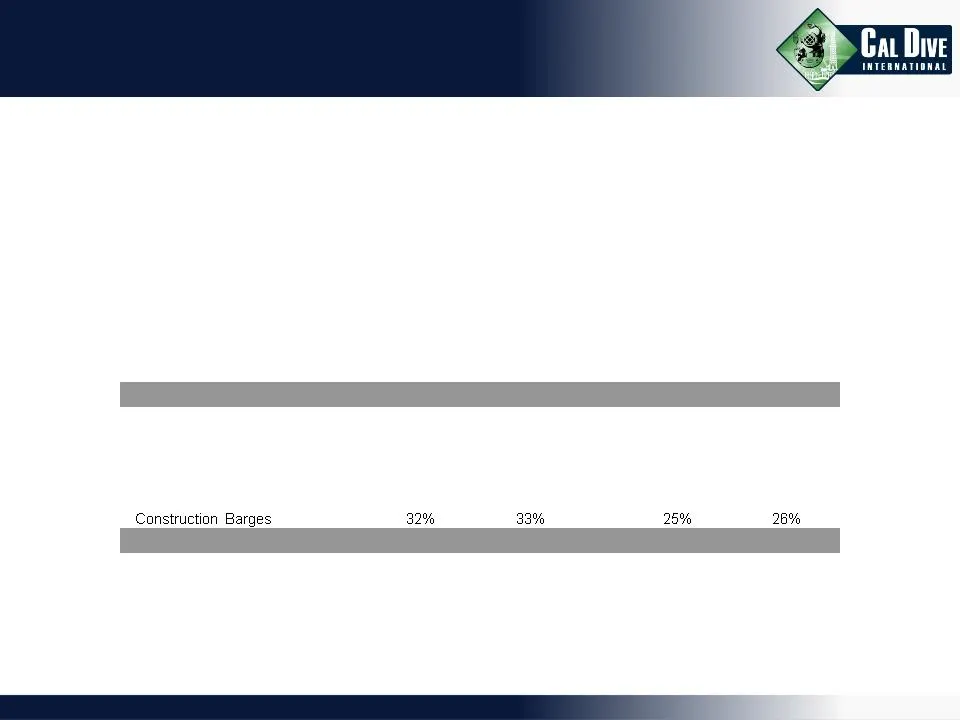
Utilization (The following statistics are for owned and operated vessels only) Three Months Twelve Months Ended December 31, Ended December 31, 2011 2010 2011 2010 Effective Utilization (1) - Saturation Diving Vessels 47% 66% 56% 65% Surface Diving Vessels 20% 46% 39% 51% Construction Barges 32% 33%
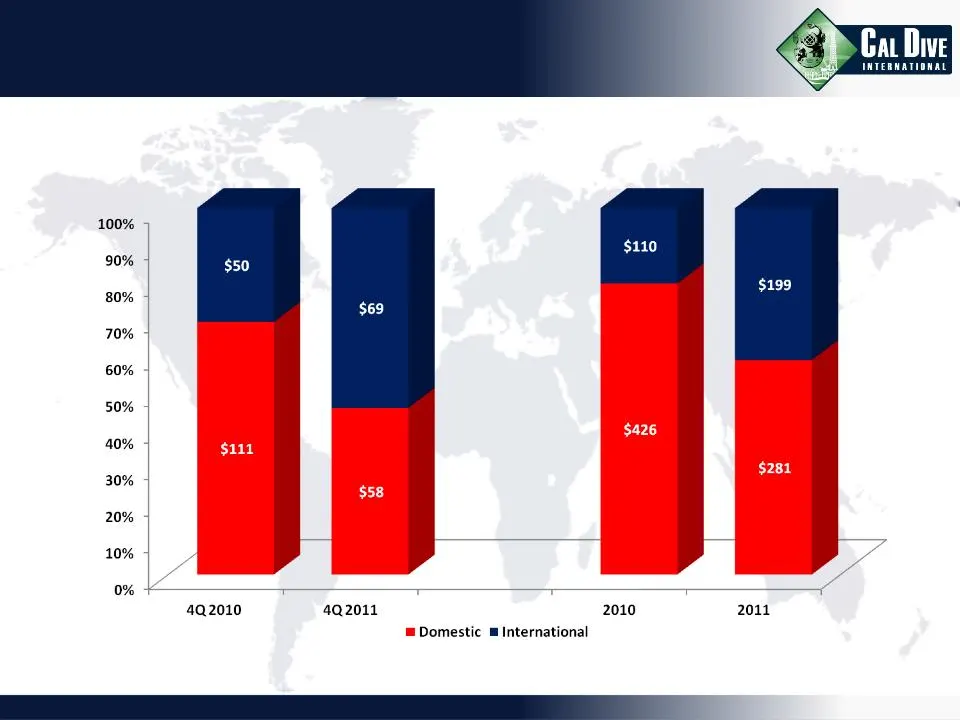
Slide 8: International Revenue
International Revenue ($ millions)
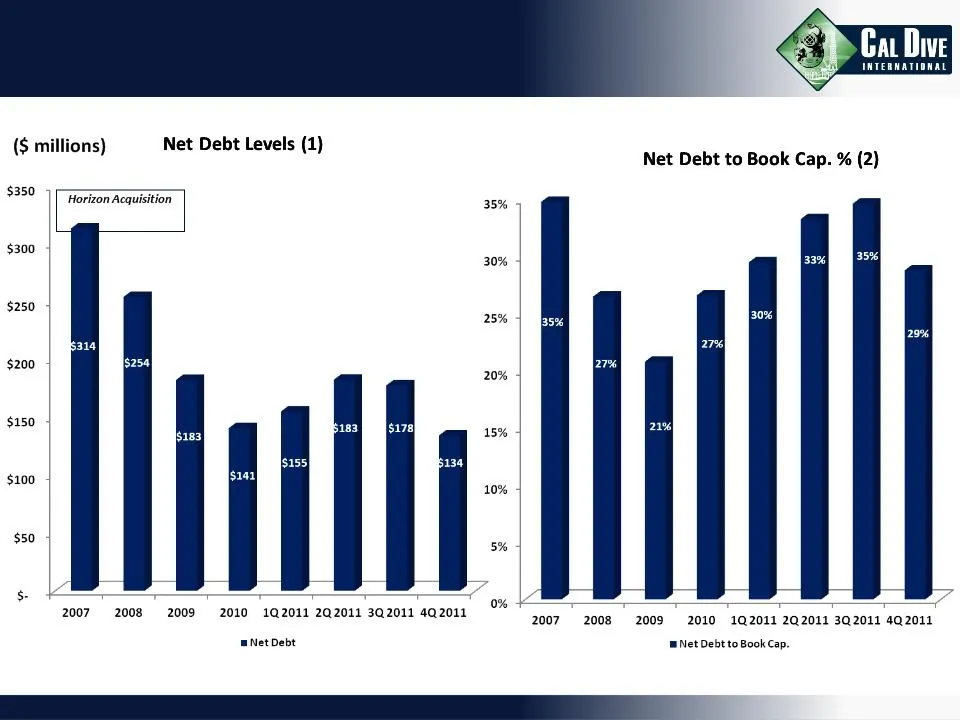
Slide 9: Debt Levels
Debt Levels (1) Calculated as Total Debt less Cash and Cash Equivalents. (2) Calculated as Net Debt divided by Stockholders’ Equity plus Net Debt.
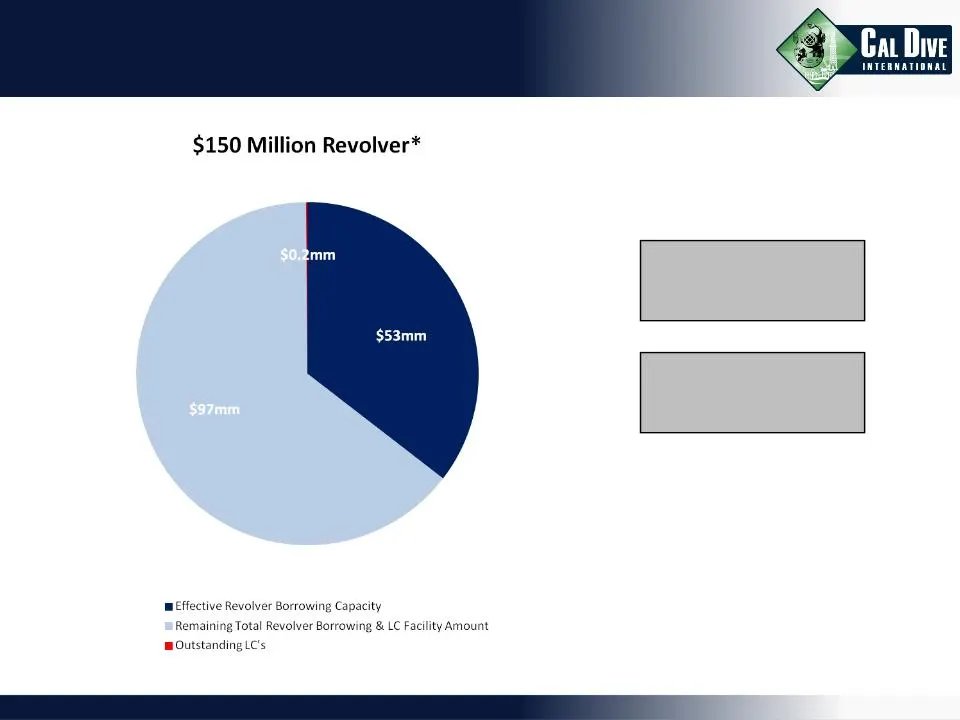
Slide 10: Liquidity
Liquidity Cash at 12/31/2011: $16 Million *Revolver size temporarily steps down to $75 million for 1Q12 and then subsequently returns to $150 million.
Slide 11: arr
: _ arr ¥ a ~ ‘ bs oF sept ; * + 43, Ta — ee Ca Dive INTERMATIONAL

Slide 12: EBITDA Reconciliations
EBITDA Reconciliations (all amounts in thousands) Three Months Twelve Months Ended December 31, Ended December 31, 2011 2010 2011 2010 EBITDA (unaudited) $12,610 $27,683 $36,913 $79,867 Less: Depreciation & Amortization 15,524 17,008 66,692 68,961 Less: Non-Cash Stock Comp. Expense 2,400 2,061 9,563
Source: SEC EDGAR · 8-K filed Feb 29, 2012
More decks from Cal Dive International Inc
 Q3 2014 Earnings Presentation12 slides · Nov 6, 2014
 Q2 2014 Earnings Presentation12 slides · Aug 11, 2014
 Q1 2014 Earnings Presentation12 slides · May 9, 2014
 Q4 2013 Earnings Presentation11 slides · Mar 5, 2014
 Q3 2013 Earnings Presentation11 slides · Nov 7, 2013
 Q2 2013 Earnings Presentation11 slides · Aug 8, 2013