Legacy Bancorp — Ryan Beck Investor Conference 2006
21 slides from Legacy Bancorp's conference presentation, Dec 7, 2006
Slide 1: Ryan Beck Investor Conference December 7, 2006
Ryan Beck Investor Conference December 7, 2006 Legacy Bancorp NASDAQ Listed: LEGC
Slide 2: Informational purposes disclaimer
This presentation is for informational purposes only and does not constitute an offer to sell shares of common stock of Legacy Bancorp, Inc. For more information, please refer to the Form 10-K for the year ended December 31, 2005 and Form 10-Q for the quarter ended September 30, 2006. 2 NASDAQ Liste
Slide 3: Forward Looking Statement
This presentation contains forward-looking statements which involve risks and uncertainties. The Company's actual results may differ significantly from the results discussed in the forward-looking statements. Factors that might cause such a difference include, but are not limited to changes in marke
Slide 4: Corporate Overview
Corporate Overview 175-year community banking history City Savings Bank acquired Lee National Bancorp - 1997 Mutual Bancorp merged with Lenox Financial Services - 1998 Merged subsidiary banks to form Legacy Banks - 2001 Full/Standard Mutual-to-Stock Conversion - October 2005 4 NASDAQ Listed: LEGC
Slide 5: Corporate Overview
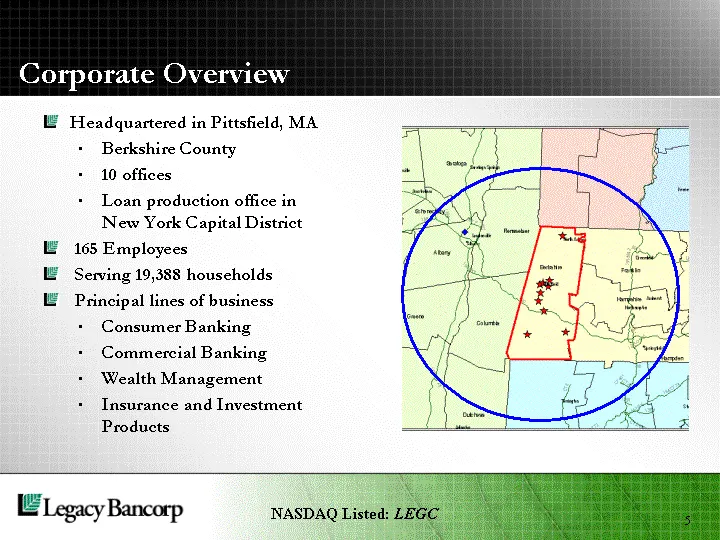
Corporate Overview Headquartered in Pittsfield, MA Berkshire County 10 offices Loan production office in New York Capital District 165 Employees Serving 19,388 households Principal lines of business Consumer Banking Commercial Banking Wealth Management Insurance and Investment Products 5 5 NASDAQ Li
Slide 6: Market Demographics
Market Demographics Berkshire County Population 131,868 Growth segments, although modestly declining overall Households 56,006 FDIC Summary of Deposits - Berkshire County 12 banks, 56 offices, $2.8 billion in deposits Legacy ranked 2nd with 17.8% market share Albany-Schenectady-Troy MSA in New York
Slide 7: Berkshire County Market Share
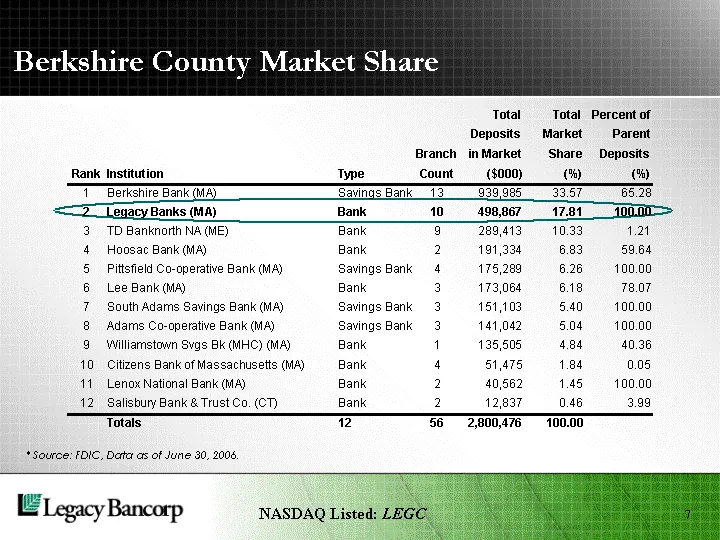
* Source: FDIC, Data as of June 30, 2006. Berkshire County Market Share 7 Total Total Percent of Deposits Market Parent Branch in Market Share Deposits Rank Institution Type Count ($000) (%) (%) 1 Berkshire Bank (MA) Savings Bank 13 939,985 33.57 65.28 2 Legacy Banks (MA) Bank 10 498,867 17.81 100.0
Slide 8: Corporate Culture
Corporate Culture Strong governance Embrace growth and change Strong asset quality Strong risk management Developing sales culture Service excellence Performance-based compensation Community Skilled and experienced management team 8 NASDAQ Listed: LEGC
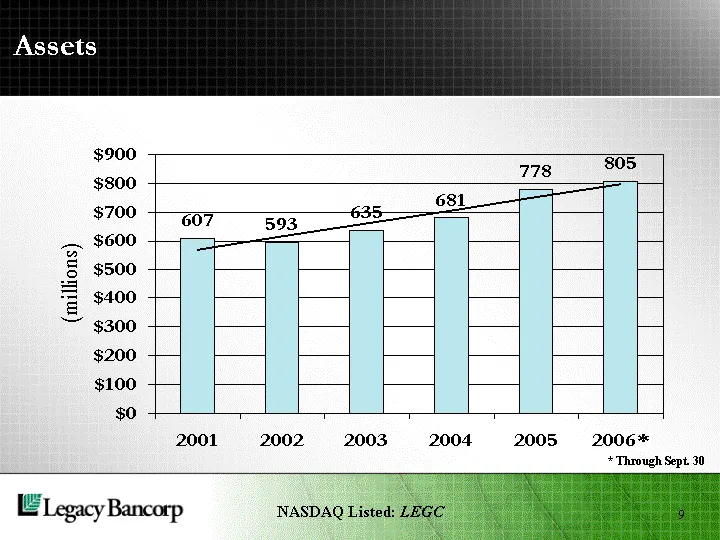
Slide 9: Assets
Assets 2001 2002 2003 2004 2005 2006* East 607 593 635 681 778 805 * Through Sept. 30 9 NASDAQ Listed: LEGC
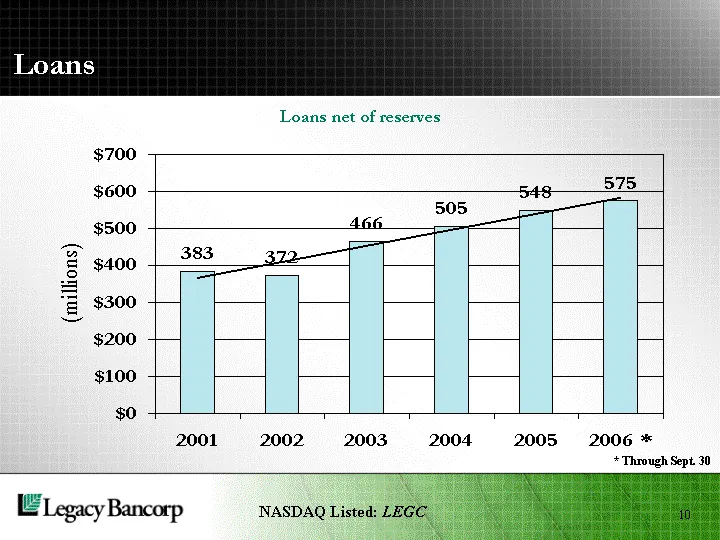
Slide 10: Loans
Loans 2001 2002 2003 2004 2005 2006 * East 383 372 466 505 548 575 Loans net of reserves * Through Sept. 30 10 NASDAQ Listed: LEGC
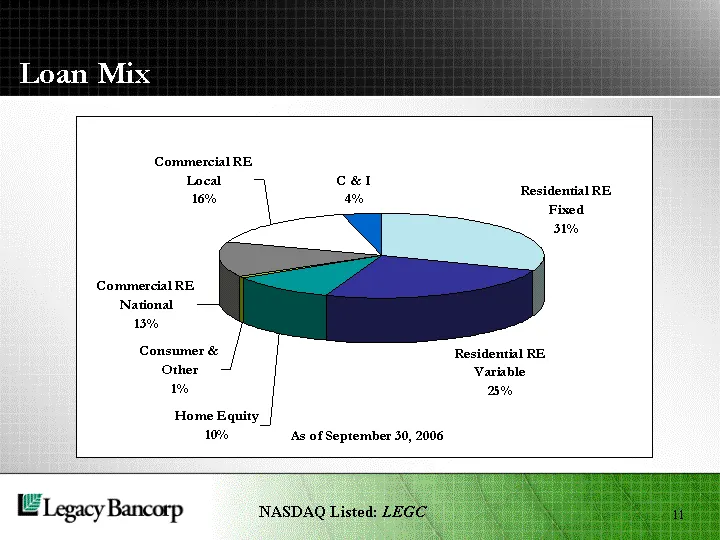
Slide 11: Loan Mix
Loan Mix Residential RE Fixed Residential RE Variable Home Equity Consumer & Other Commercial RE National Commercial RE Local C & I 9/30/2006 177.8 144.6 60.1 5.5 77.4 91.1 22.4 11 NASDAQ Listed: LEGC
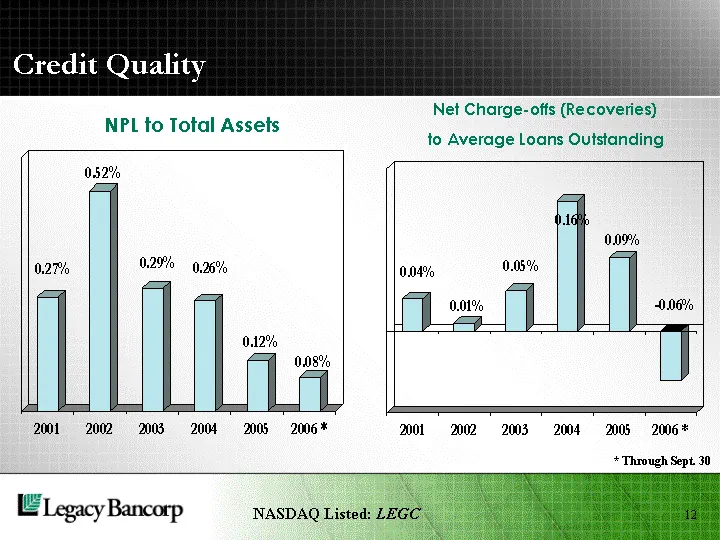
Slide 12: Credit Quality
Credit Quality 2001 2002 2003 2004 2005 2006 * East 0.0027 0.0052 0.0029 0.0026 0.0012 0.0008 NPL to Total Assets Net Charge-offs (Recoveries) to Average Loans Outstanding 2001 2002 2003 2004 2005 2006 * East 0.0004 0.0001 0.0005 0.0016 0.0009 -0.0006 * Through Sept. 30 12 NASDAQ Listed: LEGC
Slide 13: Credit Quality
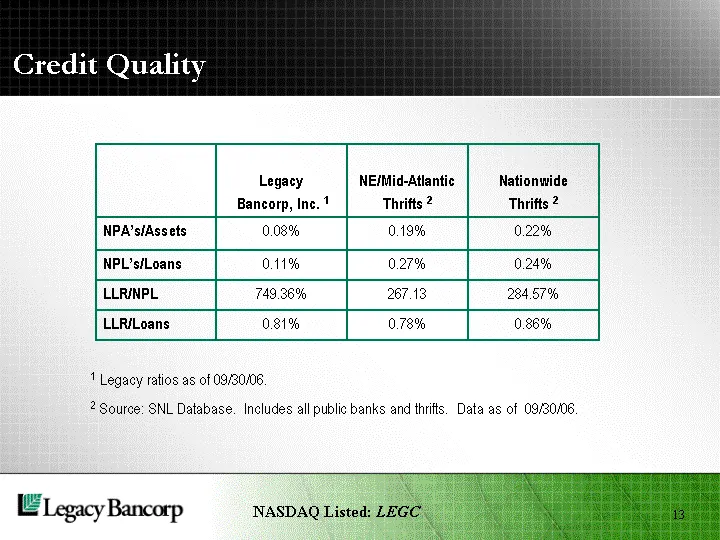
Credit Quality Legacy Bancorp, Inc. 1 NE/Mid-Atlantic Thrifts 2 Nationwide Thrifts 2 NPA's/Assets 0.08% 0.19% 0.22% NPL's/Loans 0.11% 0.27% 0.24% LLR/NPL 749.36% 267.13 284.57% LLR/Loans 0.81% 0.78% 0.86% 1 Legacy ratios as of 09/30/06. 2 Source: SNL Database. Includes all public banks and thrifts.
Slide 14: Deposits
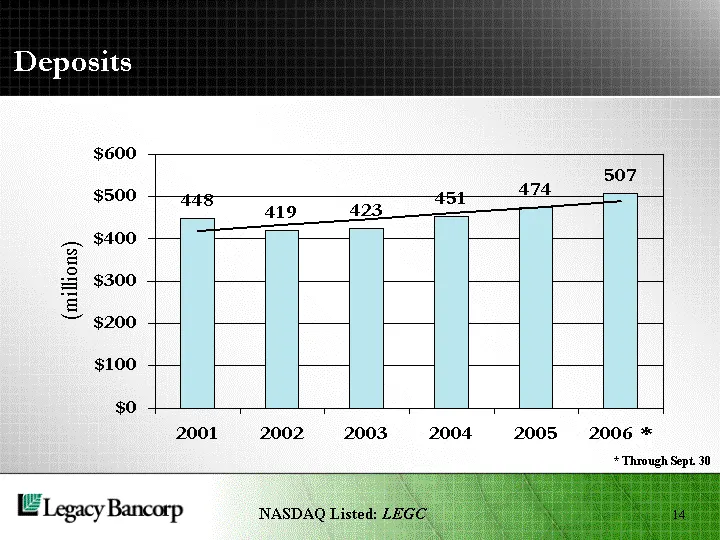
Deposits 2001 2002 2003 2004 2005 2006 * East 448 419 423 451 474 507 * Through Sept. 30 14 NASDAQ Listed: LEGC
Slide 15: Deposit Mix
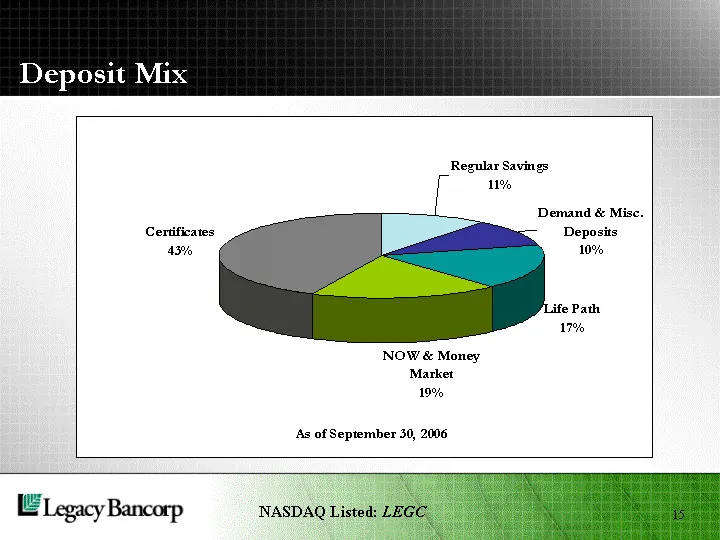
Deposit Mix Regular Savings Demand & Misc. Deposits Life Path NOW & Money Market Certificates 9/30/2006 54.2 51.1 88.1 96 217.8 15 NASDAQ Listed: LEGC
Slide 16: Revenue Mix
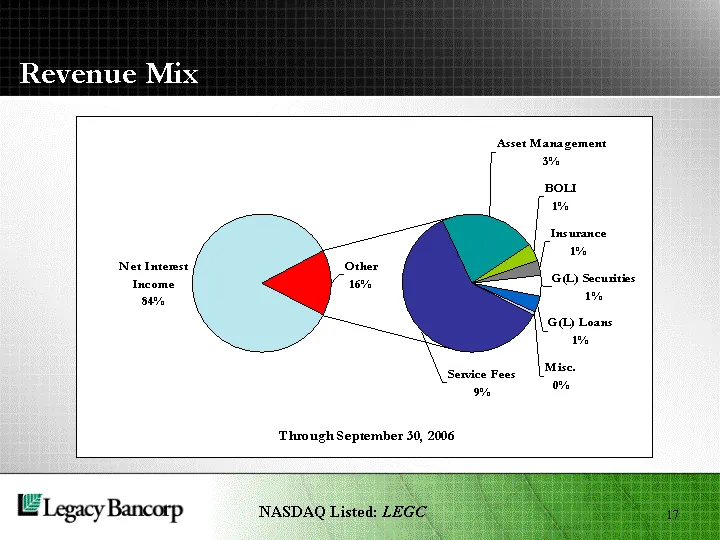
Revenue Mix Net Interest Income Service Fees Asset Management BOLI Insurance G(L) Securities G(L) Loans Misc. 9/30/2006 17889.0622 1994 739 142 122 152 124 32 17 NASDAQ Listed: LEGC
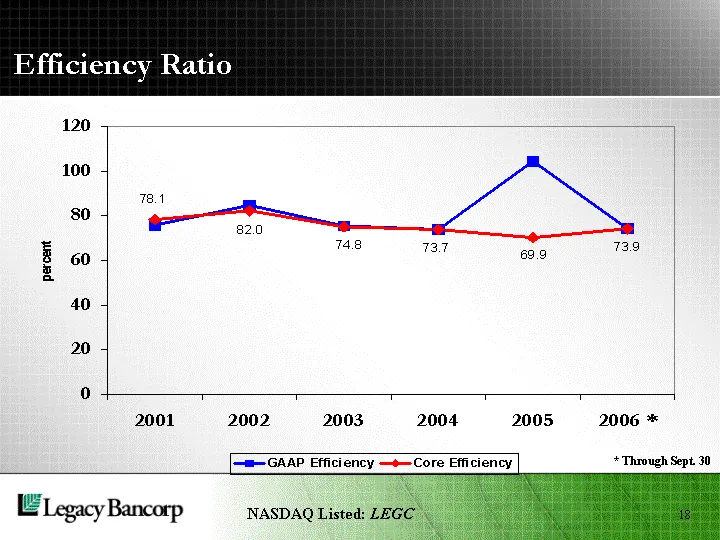
Slide 17: Efficiency Ratio
Efficiency Ratio 2001 2002 2003 2004 2005 2006 * GAAP Efficiency 75.9 84.5 75.2 73.8 104.2 73.9 Core Efficiency 78.1 82 74.8 73.7 69.9 73.9 * Through Sept. 30 18 NASDAQ Listed: LEGC
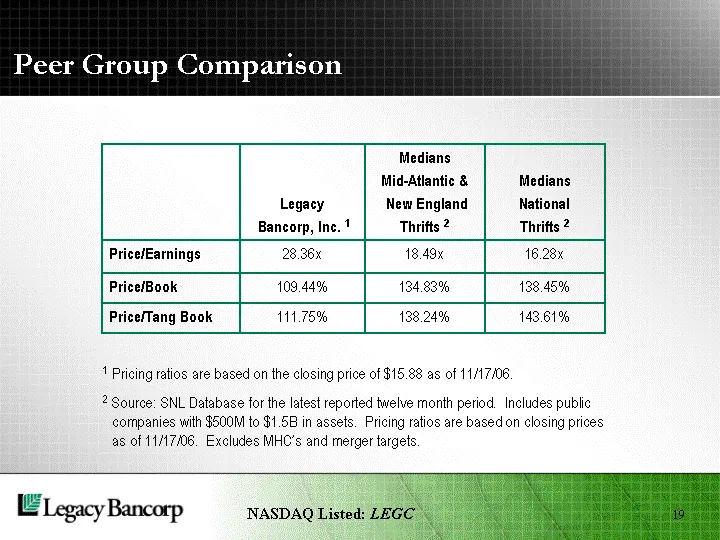
Slide 18: Peer Group Comparison
Peer Group Comparison Legacy Bancorp, Inc. 1 Medians Mid-Atlantic & New England Thrifts 2 Medians National Thrifts 2 Price/Earnings 28.36x 18.49x 16.28x Price/Book 109.44% 134.83% 138.45% Price/Tang Book 111.75% 138.24% 143.61% 1 Pricing ratios are based on the closing price of $15.88 as of 11/17/06
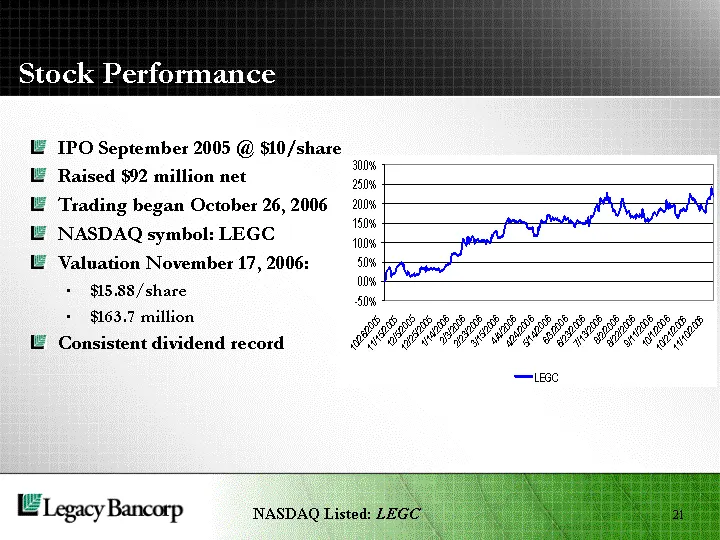
Slide 19: Stock Performance
Stock Performance IPO September 2005 @ $10/share Raised $92 million net Trading began October 26, 2006 NASDAQ symbol: LEGC Valuation November 17, 2006: $15.88/share $163.7 million Consistent dividend record 21 NASDAQ Listed: LEGC
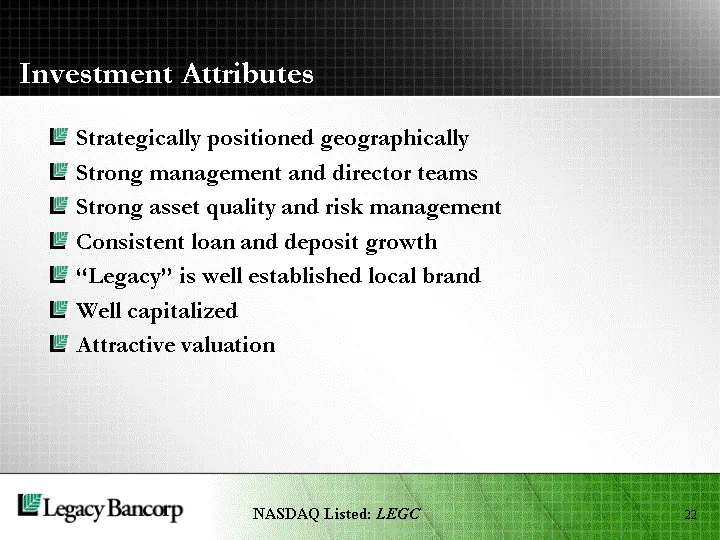
Slide 20: Investment Attributes
Investment Attributes Strategically positioned geographically Strong management and director teams Strong asset quality and risk management Consistent loan and deposit growth "Legacy" is well established local brand Well capitalized Attractive valuation 22 NASDAQ Listed: LEGC
Slide 21: Questions & Thank You
Questions & Thank You Legacy Bancorp 23 NASDAQ Listed: LEGC
Source: SEC EDGAR · 8-K filed Dec 7, 2006
More decks from Legacy Bancorp Inc
 KBW Investor Presentation 201021 slides · Jul 27, 2010
 Stifel Nicolaus Investor Meeting (June 2010)24 slides · Jun 2, 2010
 Shareholder Meeting (May 2009)21 slides · May 13, 2009
 Sterne Agee Bank and Thrift Symposium 200922 slides · Feb 9, 2009
 Stifel Nicolaus Investor Presentation (November 2008)22 slides · Nov 18, 2008
 Sterne Agee Investor Presentation (August 2008)21 slides · Aug 21, 2008