Legacy Bancorp — Stifel Nicolaus Investor Presentation (November 2008)
22 slides from Legacy Bancorp's conference presentation, Nov 18, 2008
Slide 1: Stifel Nicolaus Investor Presentation
Presented by J. Williar Dunlaevy, Chairman and CEO Legacy Bancorp Stifel Nicolas Investor PresentationNovember 18, 2008 NASDAQ listed: LEGC
Slide 2: Informational purposes only notice
This presentation is for informational purposes only and does not constitute an offer to sell shares of common stock of Legacy Bancorp, Inc. For more information, please refer to the Form 10-K for the year ended December 31, 2007 and Form 10-Q for the quarter ended September 30, 2008 NASDAQ listed:
Slide 3: Forward Looking Statement
Forward Looking Statement This presentation contains forward-looking statements which involve risks and uncertainties. TheCompany's actual results may differ significantly from the results discussed in the forward-lookingstatements. Factors that might cause such a difference include, but are not lim
Slide 4: Corporate Overview
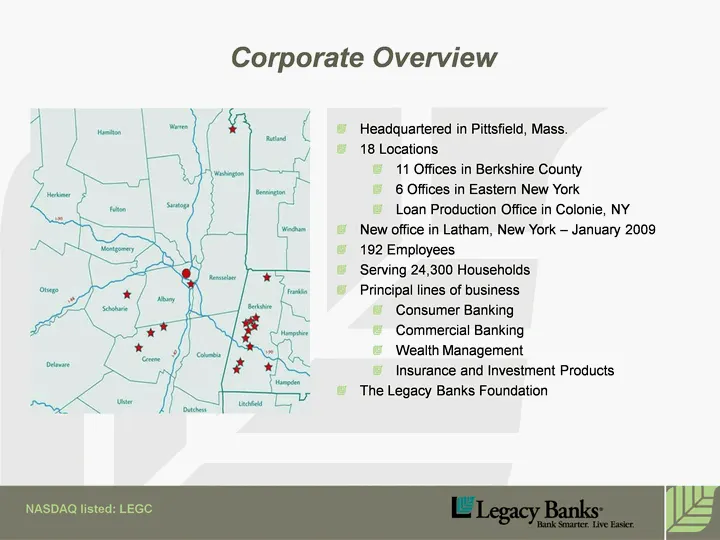
Headquartered in Pittsfield, Mass.18 Locations11 Offices in Berkshire County6 Offices in Eastern New YorkLoan Production Office in Colonie, NYNew office in Latham, New York - January 2009192 EmployeesServing 24,300 HouseholdsPrincipal lines of business Consumer BankingCommercial BankingWealth Manage
Slide 5: Market Demographics
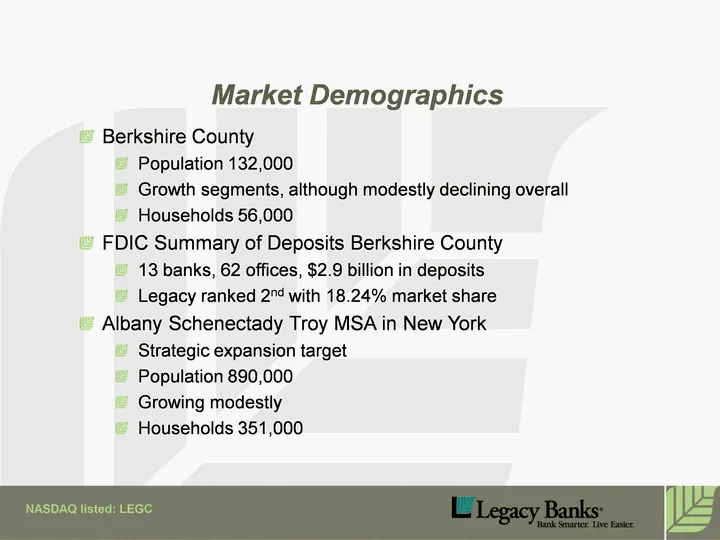
Market Demographics Berkshire CountyPopulation 132,000Growth segments, although modestly declining overall Households 56,000 FDIC Summary of Deposits Berkshire County13 banks, 62 offices, $2.9 billion in depositsLegacy ranked 2nd with 18.24% market shareAlbany Schenectady Troy MSA in New YorkStrateg
Slide 6: Berkshire County Market Share
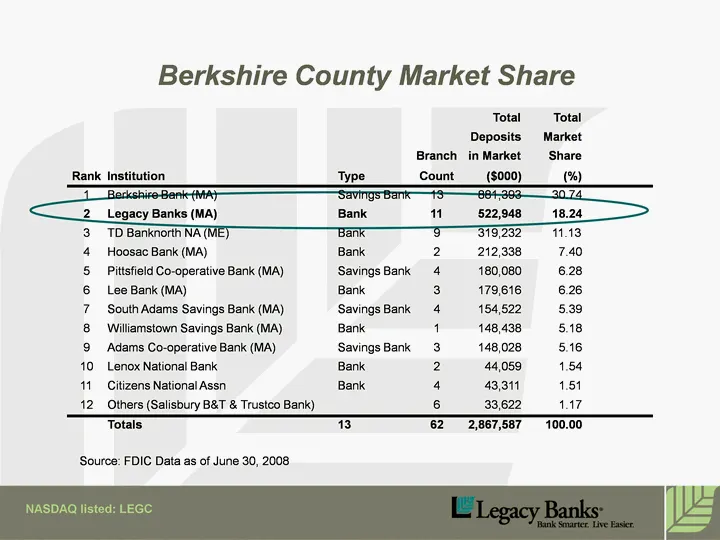
Berkshire County Market Share NASDAQ listed: LEGC Total Total Deposits Market Branch in Market Share Rank Institution Type Count ($000) (%) 1 Berkshire Bank (MA) Savings Bank 13 881,393 30.74 2 Legacy Banks (MA) Bank 11 522,948 18.24 3 TD Banknorth NA (ME) Bank 9 319,232 11.13 4 Hoosac Bank (MA) Ban
Slide 7: Strong Corporate Culture
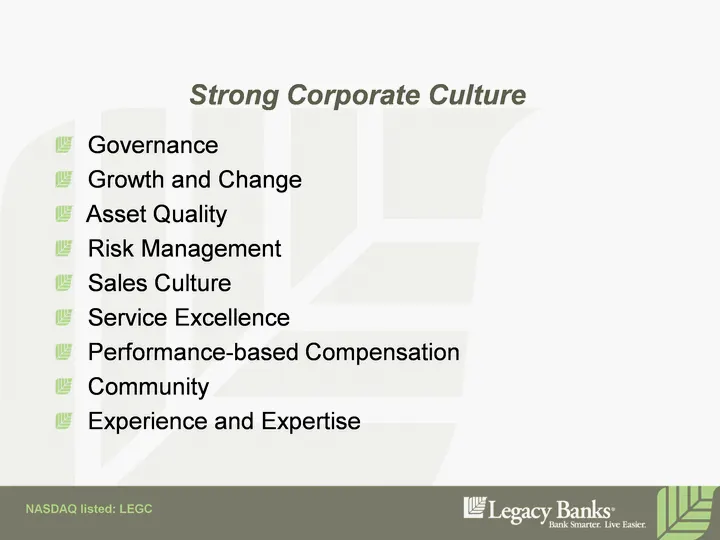
Strong Corporate Culture Governance Growth and Change Asset Quality Risk Management Sales Culture Service Excellence Performance-based Compensation Community Experience and Expertise NASDAQ listed: LEGC
Slide 8: Assets
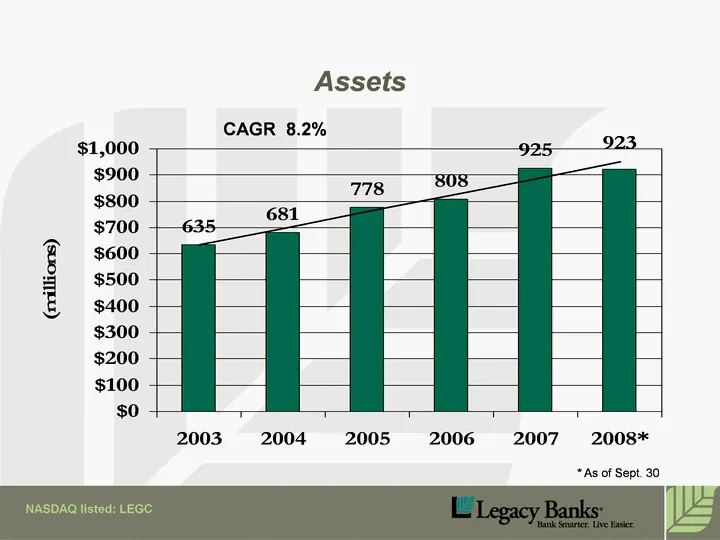
Assets CAGR 8.2% NASDAQ listed: LEGC 2003 2004 2005 2006 2007 2008* East 635 681 778 808 925 923 * As of Sept. 30
Slide 9: Loans
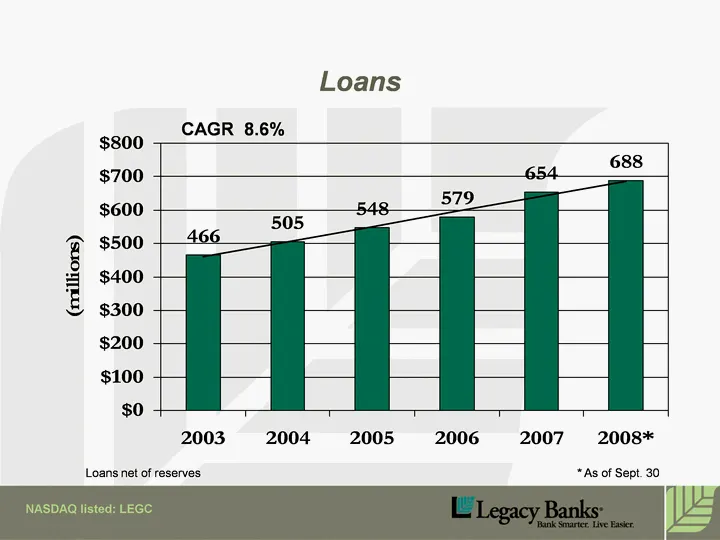
Loans CAGR 8.6% Loans net of reserves NASDAQ listed: LEGC 2003 2004 2005 2006 2007 2008* East 466 505 548 579 654 688 * As of Sept. 30
Slide 10: Loan Mix
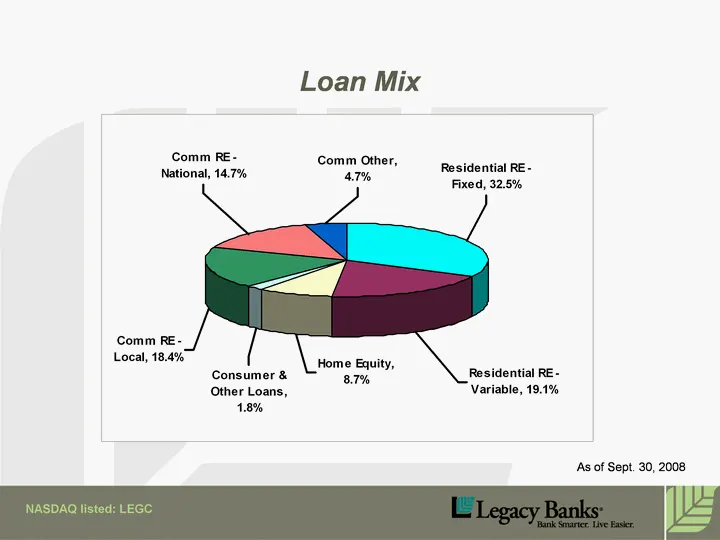
Loan Mix NASDAQ listed: LEGC As of Sept. 30, 2008
Slide 11: Credit Quality
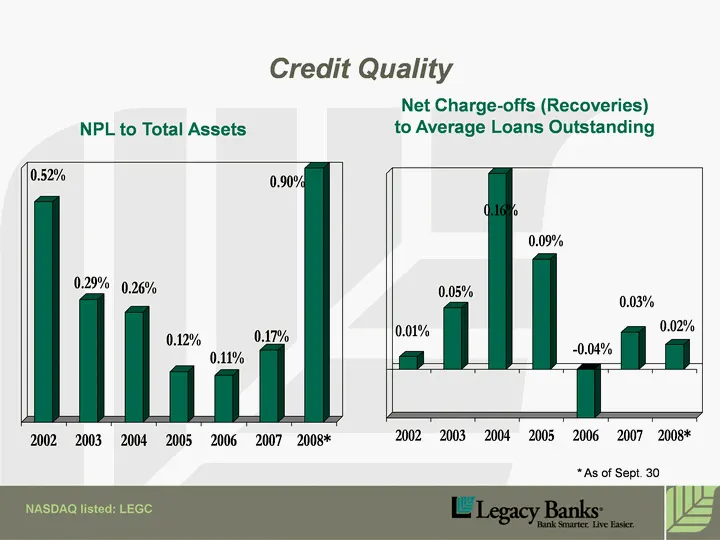
Net Charge-offs (Recoveries) to Average Loans Outstanding NPL to Total Assets Credit Quality NASDAQ listed: LEGC 2002 2003 2004 2005 2006 2007 2008* East 0.0052 0.0029 0.0026 0.0012 0.0011 0.0017 0.009 2002 2003 2004 2005 2006 2007 2008* East 0.0001 0.0005 0.0016 0.0009 -0.0004 0.0003 0.0002 * As of
Slide 12: Credit Quality
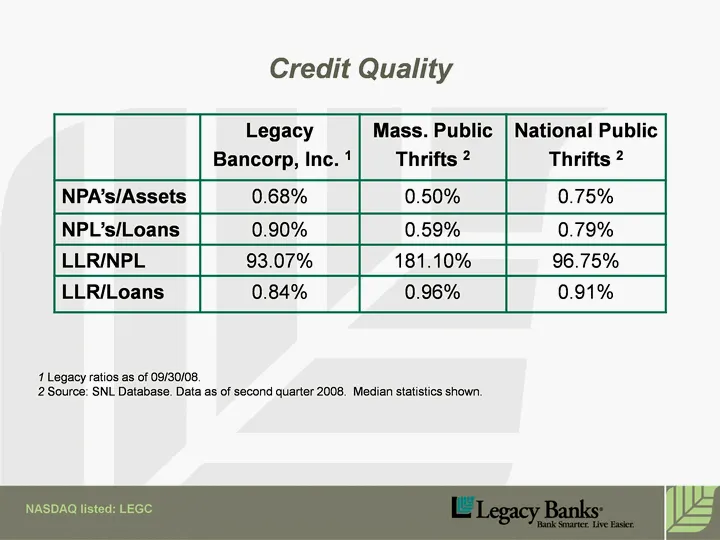
Credit Quality 1 Legacy ratios as of 09/30/08.2 Source: SNL Database. Data as of second quarter 2008. Median statistics shown. NASDAQ listed: LEGC Legacy Bancorp, Inc. 1 Mass. PublicThrifts 2 National PublicThrifts 2 NPA's/Assets 0.68% 0.50% 0.75% NPL's/Loans 0.90% 0.59% 0.79% LLR/NPL 93.07% 181.10%
Slide 13: Deposits
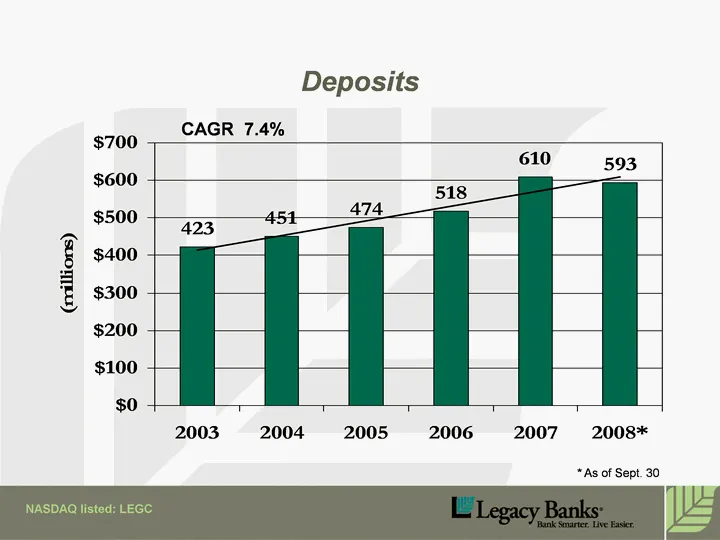
Deposits NASDAQ listed: LEGC 2003 2004 2005 2006 2007 2008* East 423 451 474 518 610 593 CAGR 7.4% * As of Sept. 30
Slide 14: Deposit Mix
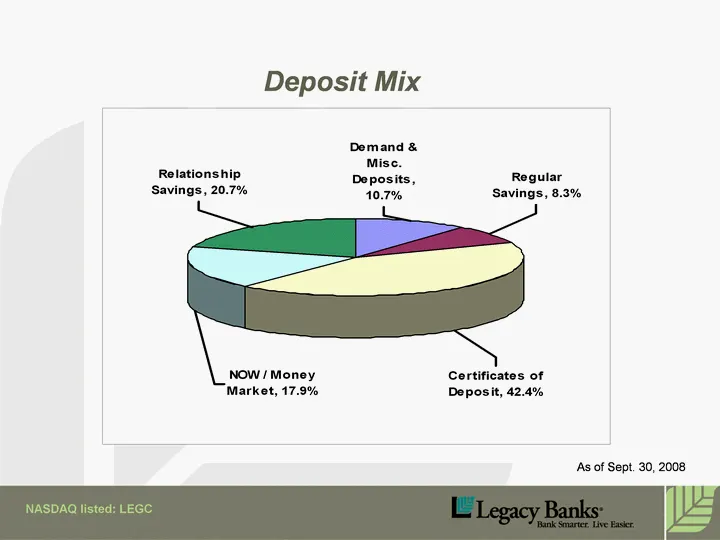
Deposit Mix NASDAQ listed: LEGC As of Sept. 30, 2008
Slide 15: Net Income
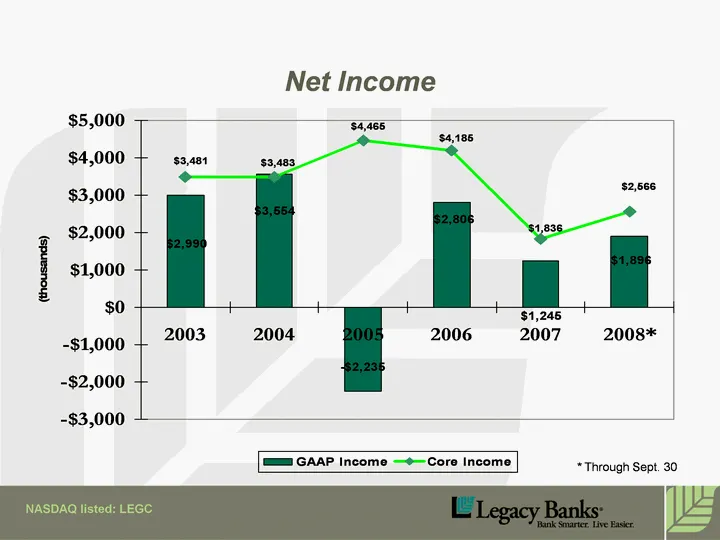
Net Income NASDAQ listed: LEGC 2003 2004 2005 2006 2007 2008* GAAP Income 2990 3554 -2235 2806 1245 1896 Core Income 3481 3483 4465 4185 1836 2566 * Through Sept. 30
Slide 16: Efficiency Ratio
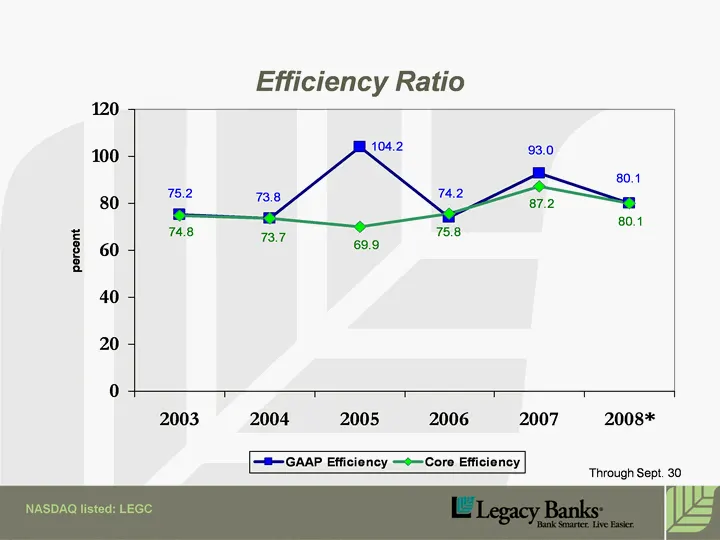
Efficiency Ratio NASDAQ listed: LEGC 2003 2004 2005 2006 2007 2008* GAAP Efficiency 75.2 73.8 104.2 74.2 93 80.1 Core Efficiency 74.8 73.7 69.9 75.8 87.2 80.1 Through Sept. 30
Slide 17: Strategic Plan - Delta Project
Strategic Plan - Delta Project Bank Smarter ~ Live Easier Creating Shareholder Value Culture of Growth and Change Core Deposits Non- Interest Income Growth & Opportunities Efficiency Relationship Banking Service Excellence NASDAQ listed: LEGC
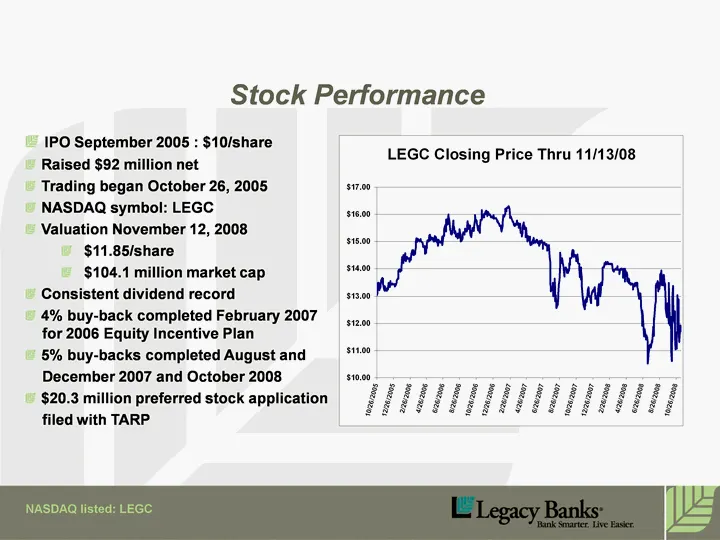
Slide 18: Stock Performance
Stock Performance IPO September 2005 : $10/share Raised $92 million net Trading began October 26, 2005 NASDAQ symbol: LEGC Valuation November 12, 2008$11.85/share$104.1 million market cap Consistent dividend record 4% buy-back completed February 2007 for 2006 Equity Incentive Plan 5% buy-backs compl
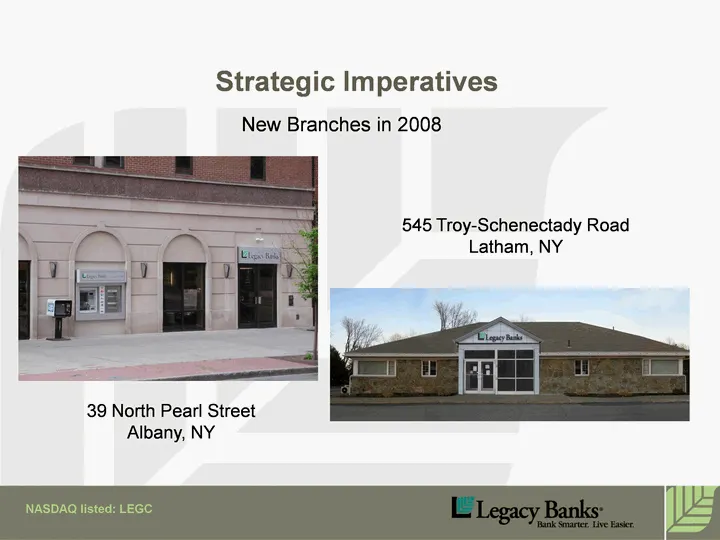
Slide 19: Strategic Imperatives
Strategic Imperatives New Branches in 2008 39 North Pearl StreetAlbany, NY 545 Troy-Schenectady RoadLatham, NY NASDAQ listed: LEGC
Slide 20: Investment Attributes
Investment Attributes Strategically positioned geographically Strong leadership and governance Strong asset quality and risk management Consistent annual loan and deposit growth "Legacy" is well established local brand Well capitalized Attractive valuation NASDAQ listed: LEGC
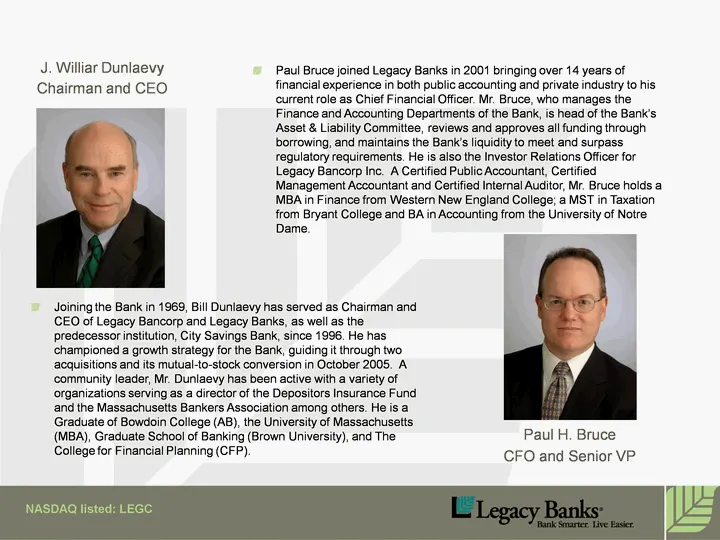
Slide 21: Management biographies
Paul Bruce joined Legacy Banks in 2001 bringing over 14 years of financial experience in both public accounting and private industry to his current role as Chief Financial Officer. Mr. Bruce, who manages the Finance and Accounting Departments of the Bank, is head of the Bank's Asset & Liability Comm
Slide 22: Questions & Thank You
Legacy Bancorp Questions&Thank You. NASDAQ listed: LEGC
Source: SEC EDGAR · 8-K filed Nov 18, 2008
More decks from Legacy Bancorp Inc
 KBW Investor Presentation 201021 slides · Jul 27, 2010
 Stifel Nicolaus Investor Meeting (June 2010)24 slides · Jun 2, 2010
 Shareholder Meeting (May 2009)21 slides · May 13, 2009
 Sterne Agee Bank and Thrift Symposium 200922 slides · Feb 9, 2009
 Sterne Agee Investor Presentation (August 2008)21 slides · Aug 21, 2008
 Shareholder Meeting (May 2008)17 slides · May 8, 2008