Legacy Bancorp — Stifel Nicolaus Investor Meeting (June 2010)
24 slides from Legacy Bancorp's conference presentation, Jun 2, 2010
Slide 1: Legacy Bancorp Stifel Nicolaus Investor Meeting
Legacy Bancorp Stifel Nicolaus Investor Meeting June 2, 2010 NASDAQ listed: LEGC
Slide 2: Bill Dunlaevy, Chairman & CEO
Bill Dunlaevy Chairman & CEO 2
Slide 3: Forward Looking Statement
Forward Looking Statement NASDAQ listed: LEGC 3 This presentation is for informational purposes only and does not constitute an offer to sell shares of common stock of Legacy Bancorp, Inc. This presentation contains forward-looking statements which involve risks and uncertainties. The Company's actu
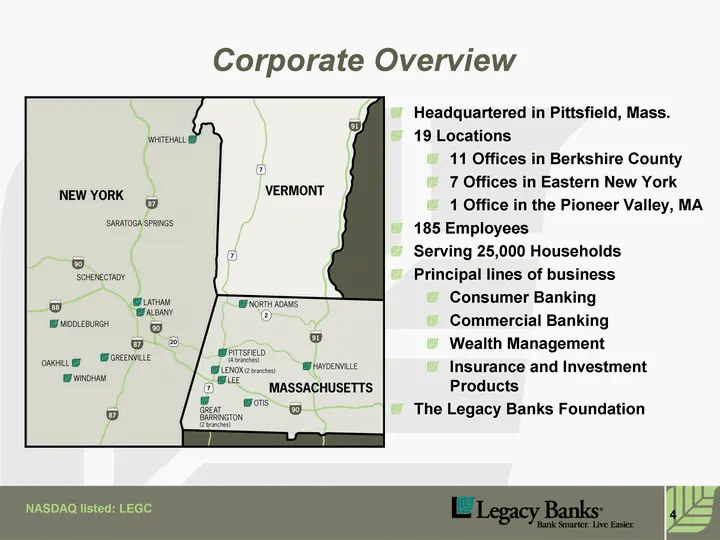
Slide 4: Corporate Overview
Headquartered in Pittsfield, Mass. 19 Locations 11 Offices in Berkshire County 7 Offices in Eastern New York 1 Office in the Pioneer Valley, MA 185 Employees Serving 25,000 Households Principal lines of business Consumer Banking Commercial Banking Wealth Management Insurance and Investment Products
Slide 5: Market Demographics
Market Demographics Berkshire County Population 132,000 Growth segments, although modestly declining overall Households 56,000 Albany Schenectady Troy MSA in New York Strategic expansion target Population 890,000 Growing modestly Households 351,000 NASDAQ listed: LEGC 5
Slide 6: Pat Sullivan, President, and CEO of Legacy Banks
Pat Sullivan President, and CEO of Legacy Banks 6
Slide 7: Core Strengths
Core Strengths NASDAQ listed: LEGC 7 Strong "At Home" Sound Balance Sheet & Capital Strong liquidity Opportunities to improve earnings without growth
Slide 8: Profit Improvement Fundamentals
Profit Improvement Fundamentals NASDAQ listed: LEGC Margin improvement through liability repricing Synergies with Wealth Management 20% additional non-interest income Commitment to improve risk management practices Change loan mix more towards C&I Expense opportunities of 5% reduction 8
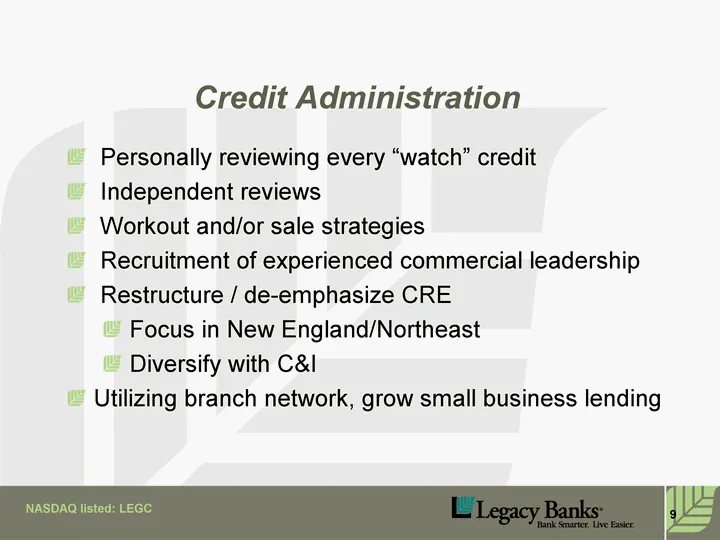
Slide 9: Credit Administration
Credit Administration NASDAQ listed: LEGC Personally reviewing every "watch" credit Independent reviews Workout and/or sale strategies Recruitment of experienced commercial leadership Restructure / de-emphasize CRE Focus in New England/Northeast Diversify with C&I Utilizing branch network, grow smal
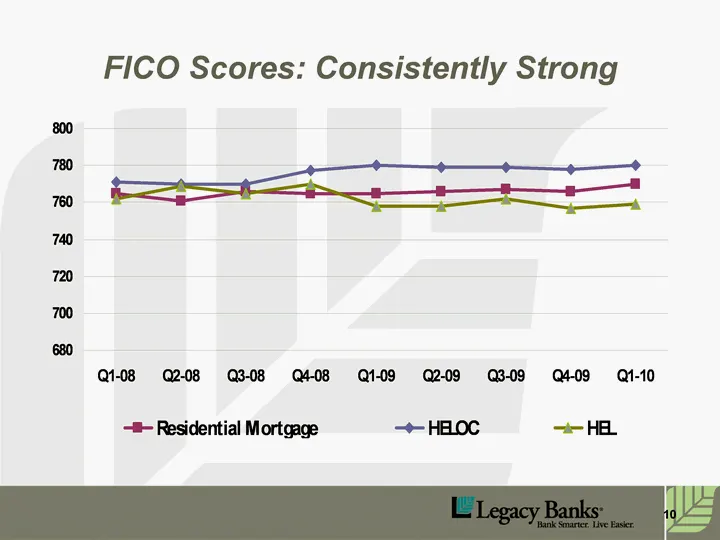
Slide 10: FICO Scores: Consistently Strong
FICO Scores: Consistently Strong 10
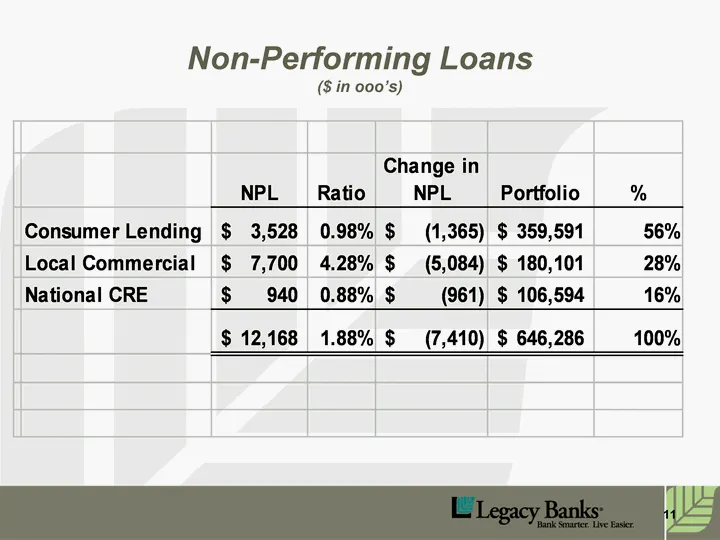
Slide 11: Non-Performing Loans
Non-Performing Loans ($ in ooo's) 11
Slide 12: Paul Bruce, Chief Financial Officer
Paul Bruce Chief Financial Officer 12
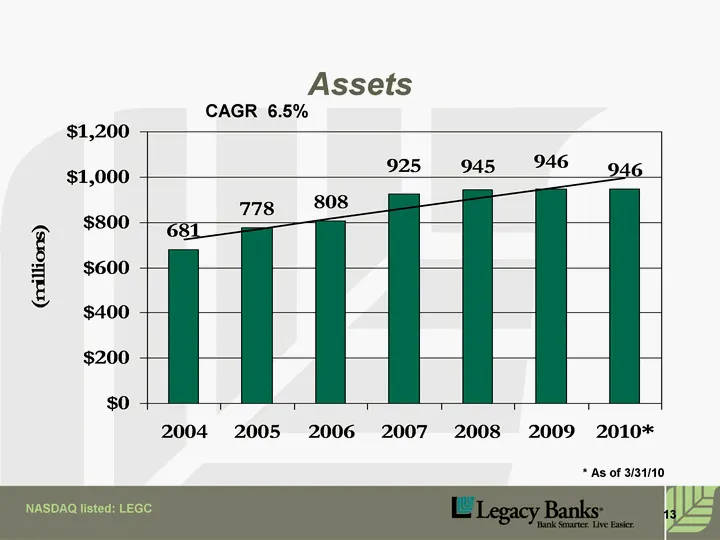
Slide 13: Assets
Assets CAGR 6.5% NASDAQ listed: LEGC 2003 2004 2005 2006 2007 2008 2009 2010* East 635 681 778 808 925 945 946 946 13 * As of 3/31/10
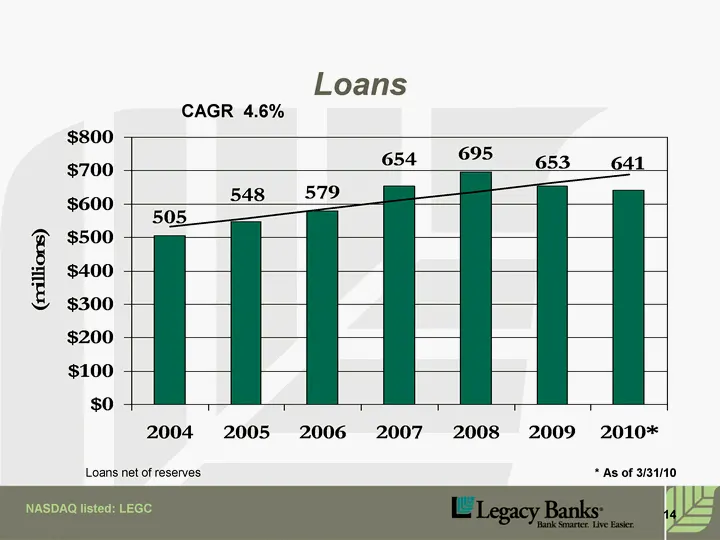
Slide 14: Loans
Loans CAGR 4.6% Loans net of reserves NASDAQ listed: LEGC 2003 2004 2005 2006 2007 2008 2009 2010* East 466 505 548 579 654 695 653 641 14 * As of 3/31/10
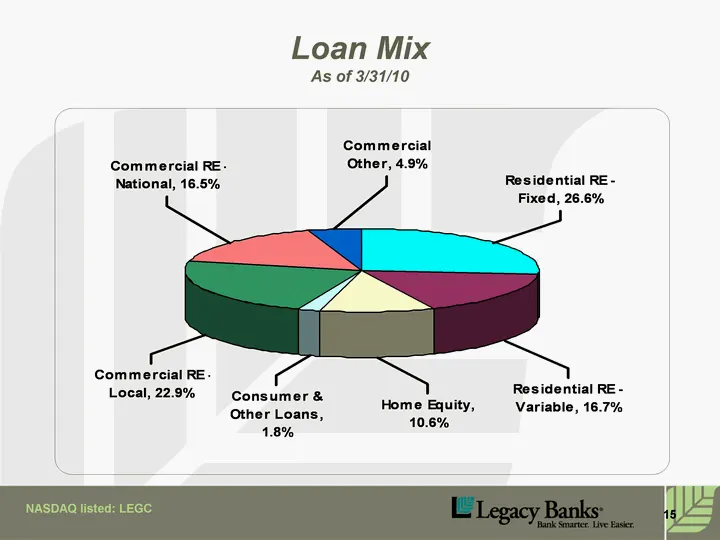
Slide 15: Loan Mix
Loan Mix As of 3/31/10 NASDAQ listed: LEGC 15
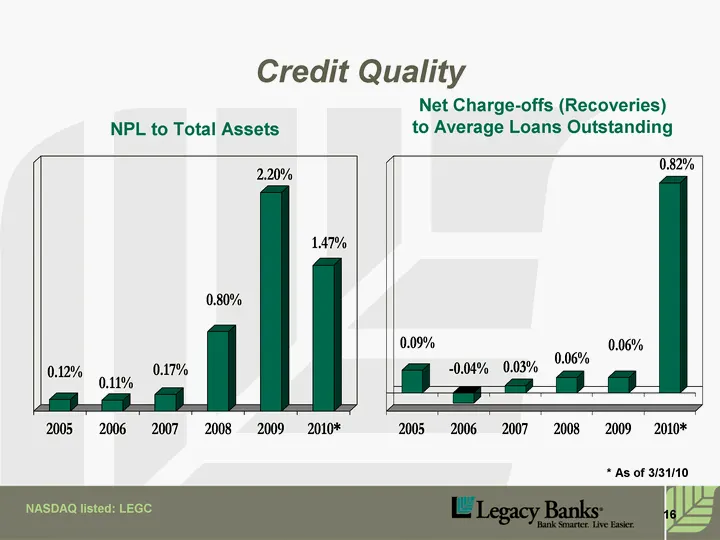
Slide 16: Credit Quality
Net Charge-offs (Recoveries) to Average Loans Outstanding NPL to Total Assets Credit Quality NASDAQ listed: LEGC 2002 2003 2004 2005 2006 2007 2008 2009 2010* East 0.0052 0.0029 0.0026 0.0012 0.0011 0.0017 0.008 0.022 0.0147 2002 2003 2004 2005 2006 2007 2008 2009 2010* East 0.0001 0.0005 0.0016 0.0
Slide 17: Credit Quality
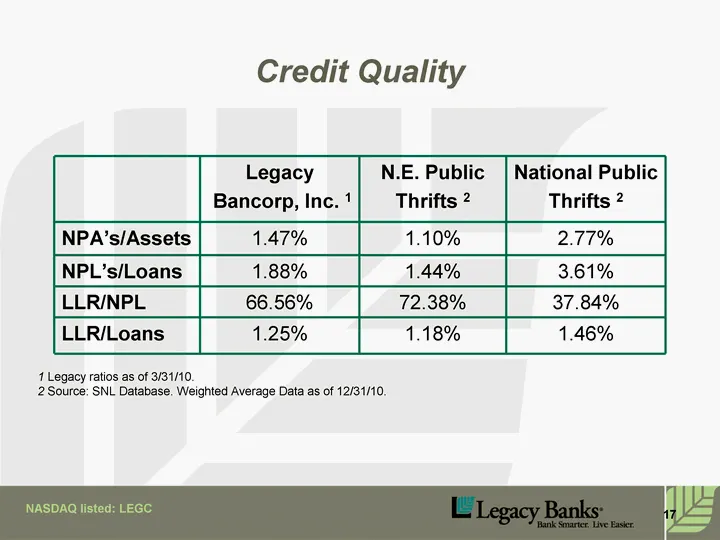
Credit Quality 1 Legacy ratios as of 3/31/10. 2 Source: SNL Database. Weighted Average Data as of 12/31/10. NASDAQ listed: LEGC Legacy Bancorp, Inc. 1 N.E. Public Thrifts 2 National Public Thrifts 2 NPA's/Assets 1.47% 1.10% 2.77% NPL's/Loans 1.88% 1.44% 3.61% LLR/NPL 66.56% 72.38% 37.84% LLR/Loans 1
Slide 18: Deposits
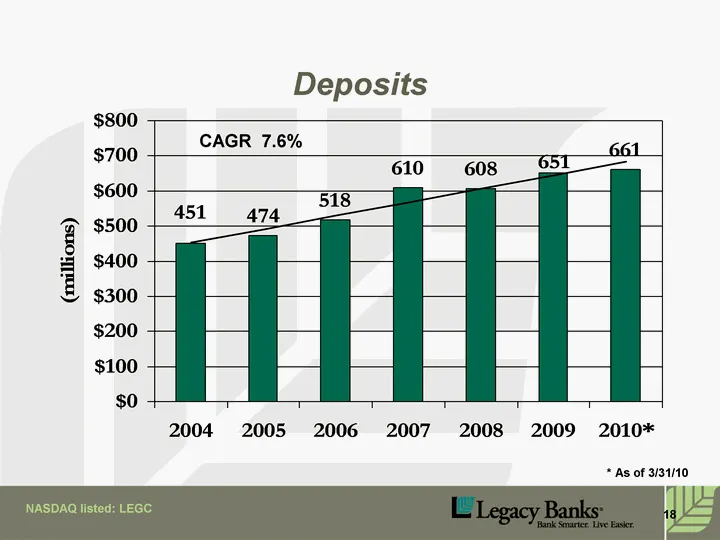
Deposits NASDAQ listed: LEGC 2003 2004 2005 2006 2007 2008 2009 2010* East 423 451 474 518 610 608 651 661 CAGR 7.6% 18 * As of 3/31/10
Slide 19: Deposit Mix
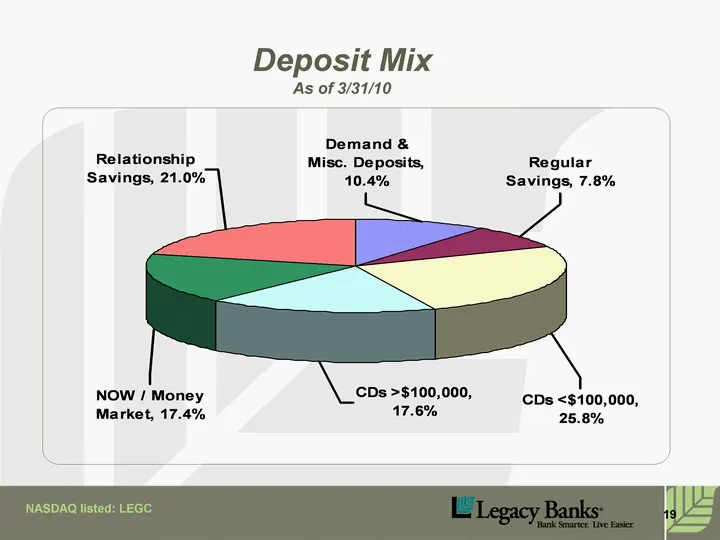
Deposit Mix As of 3/31/10 NASDAQ listed: LEGC 19
Slide 20: Net Income
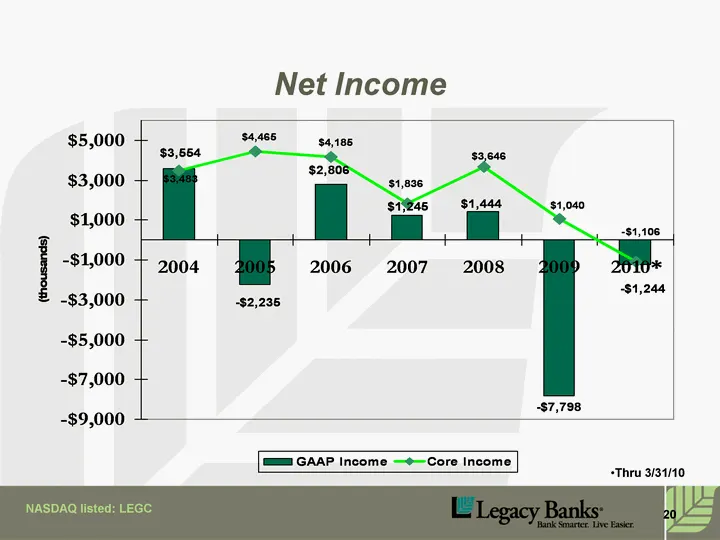
Net Income NASDAQ listed: LEGC 2003 2004 2005 2006 2007 2008 2009 2010* GAAP Income 2990 3554 -2235 2806 1245 1444 -7798 -1244 Core Income 3481 3483 4465 4185 1836 3646 1040 -1106 20 Thru 3/31/10
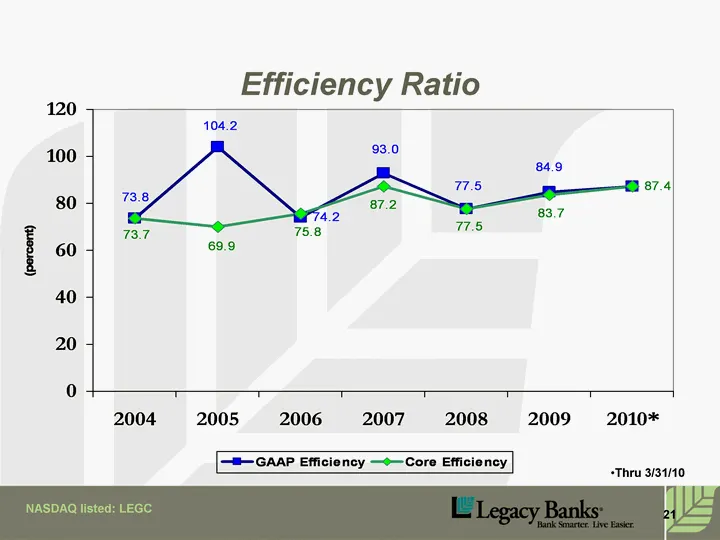
Slide 21: Efficiency Ratio
Efficiency Ratio NASDAQ listed: LEGC 2003 2004 2005 2006 2007 2008 2009 2010* GAAP Efficiency 75.2 73.8 104.2 74.2 93 77.5 84.9 87.4 Core Efficiency 74.8 73.7 69.9 75.8 87.2 77.5 83.7 87.4 21 Thru 3/31/10
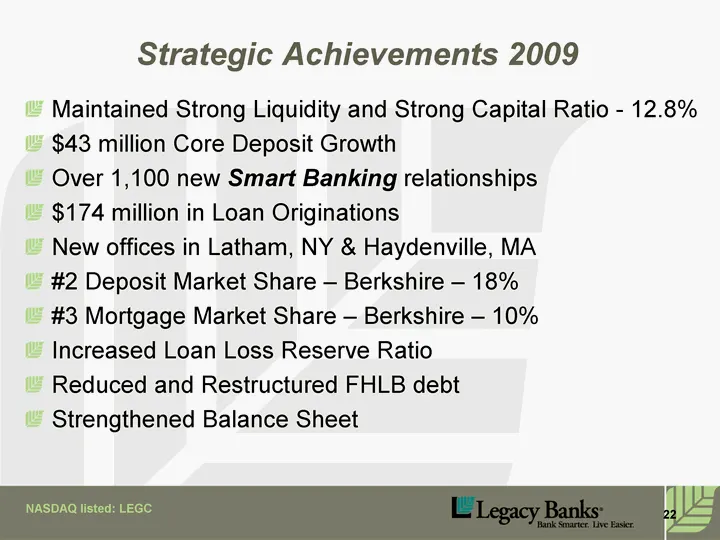
Slide 22: Strategic Achievements 2009
Strategic Achievements 2009 Maintained Strong Liquidity and Strong Capital Ratio - 12.8% $43 million Core Deposit Growth Over 1,100 new Smart Banking relationships $174 million in Loan Originations New offices in Latham, NY & Haydenville, MA #2 Deposit Market Share - Berkshire - 18% #3 Mortgage Mark
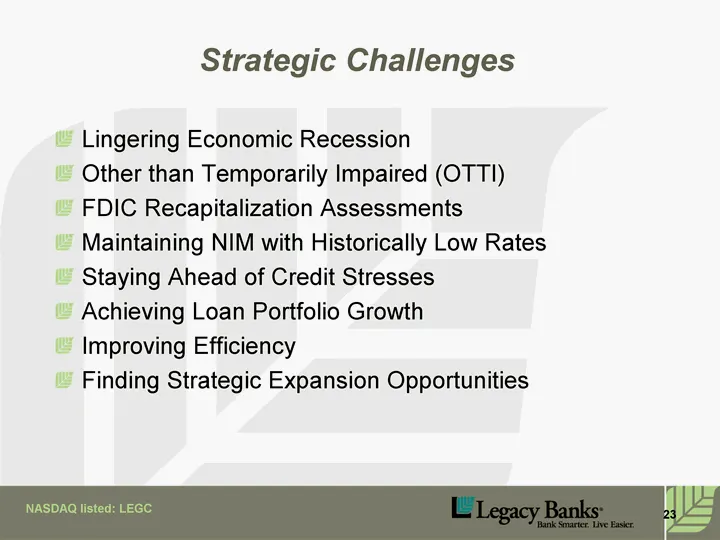
Slide 23: Strategic Challenges
Strategic Challenges Lingering Economic Recession Other than Temporarily Impaired (OTTI) FDIC Recapitalization Assessments Maintaining NIM with Historically Low Rates Staying Ahead of Credit Stresses Achieving Loan Portfolio Growth Improving Efficiency Finding Strategic Expansion Opportunities NASDA
Slide 24: Legacy Bancorp Questions & Thank You
Legacy Bancorp Questions & Thank You. NASDAQ listed: LEGC 24
Source: SEC EDGAR · 8-K filed Jun 2, 2010
More decks from Legacy Bancorp Inc
 KBW Investor Presentation 201021 slides · Jul 27, 2010
 Shareholder Meeting (May 2009)21 slides · May 13, 2009
 Sterne Agee Bank and Thrift Symposium 200922 slides · Feb 9, 2009
 Stifel Nicolaus Investor Presentation (November 2008)22 slides · Nov 18, 2008
 Sterne Agee Investor Presentation (August 2008)21 slides · Aug 21, 2008
 Shareholder Meeting (May 2008)17 slides · May 8, 2008