Freedom Financial Holdings Inc · OTC:FDVA
Freedom Financial — Q4 2021 Earnings Presentation
41 slides from Freedom Financial's earnings presentation, February 2022
Slide 1: Presentation to Investors
Presentation to Investors February 2022 Joseph J. Thomas - President & CEO 1
Slide 2: Disclosure
Disclosure This presentation contains forward-looking statements, including our expectations with respect to future events that are subject to various risks and uncertainties. Factors that could cause actual results to differ materially from management's projections, forecasts, estimates, and expect
Slide 3: Agenda
Agenda Company Overview Management, Model & Market Clients, Capabilities & Communities Q4 and FY 2021 Financial Results Investment Summary 3
Slide 4: Our Company
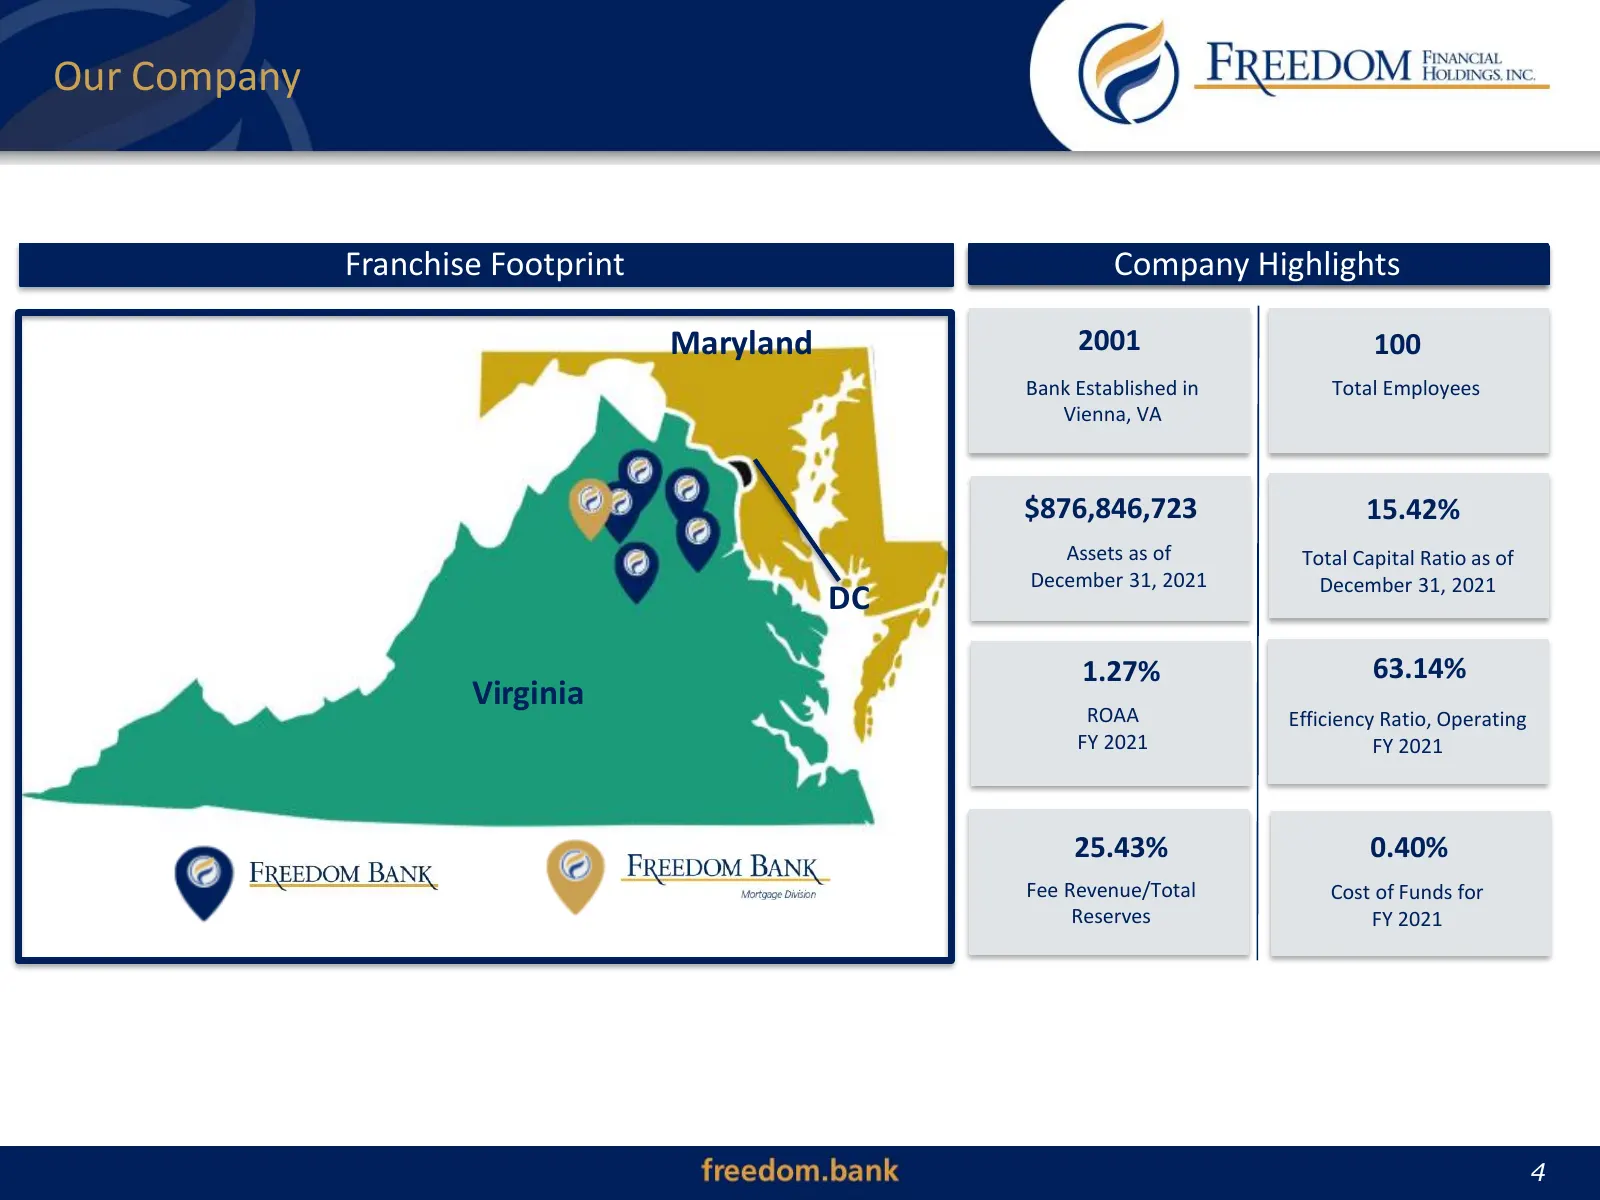
Our Company Franchise Footprint Company CompanyOverview Highlights Maryland 2001 100 Bank Established in Total Employees Vienna, VA $876,846,723 15.42% Assets as of Total Capital Ratio as of December 31, 2021 December 31, 2021 DC 1.27% 63.14% Virginia ROAA Efficiency Ratio, Operating FY 2021 FY 2021
Slide 5: Company History
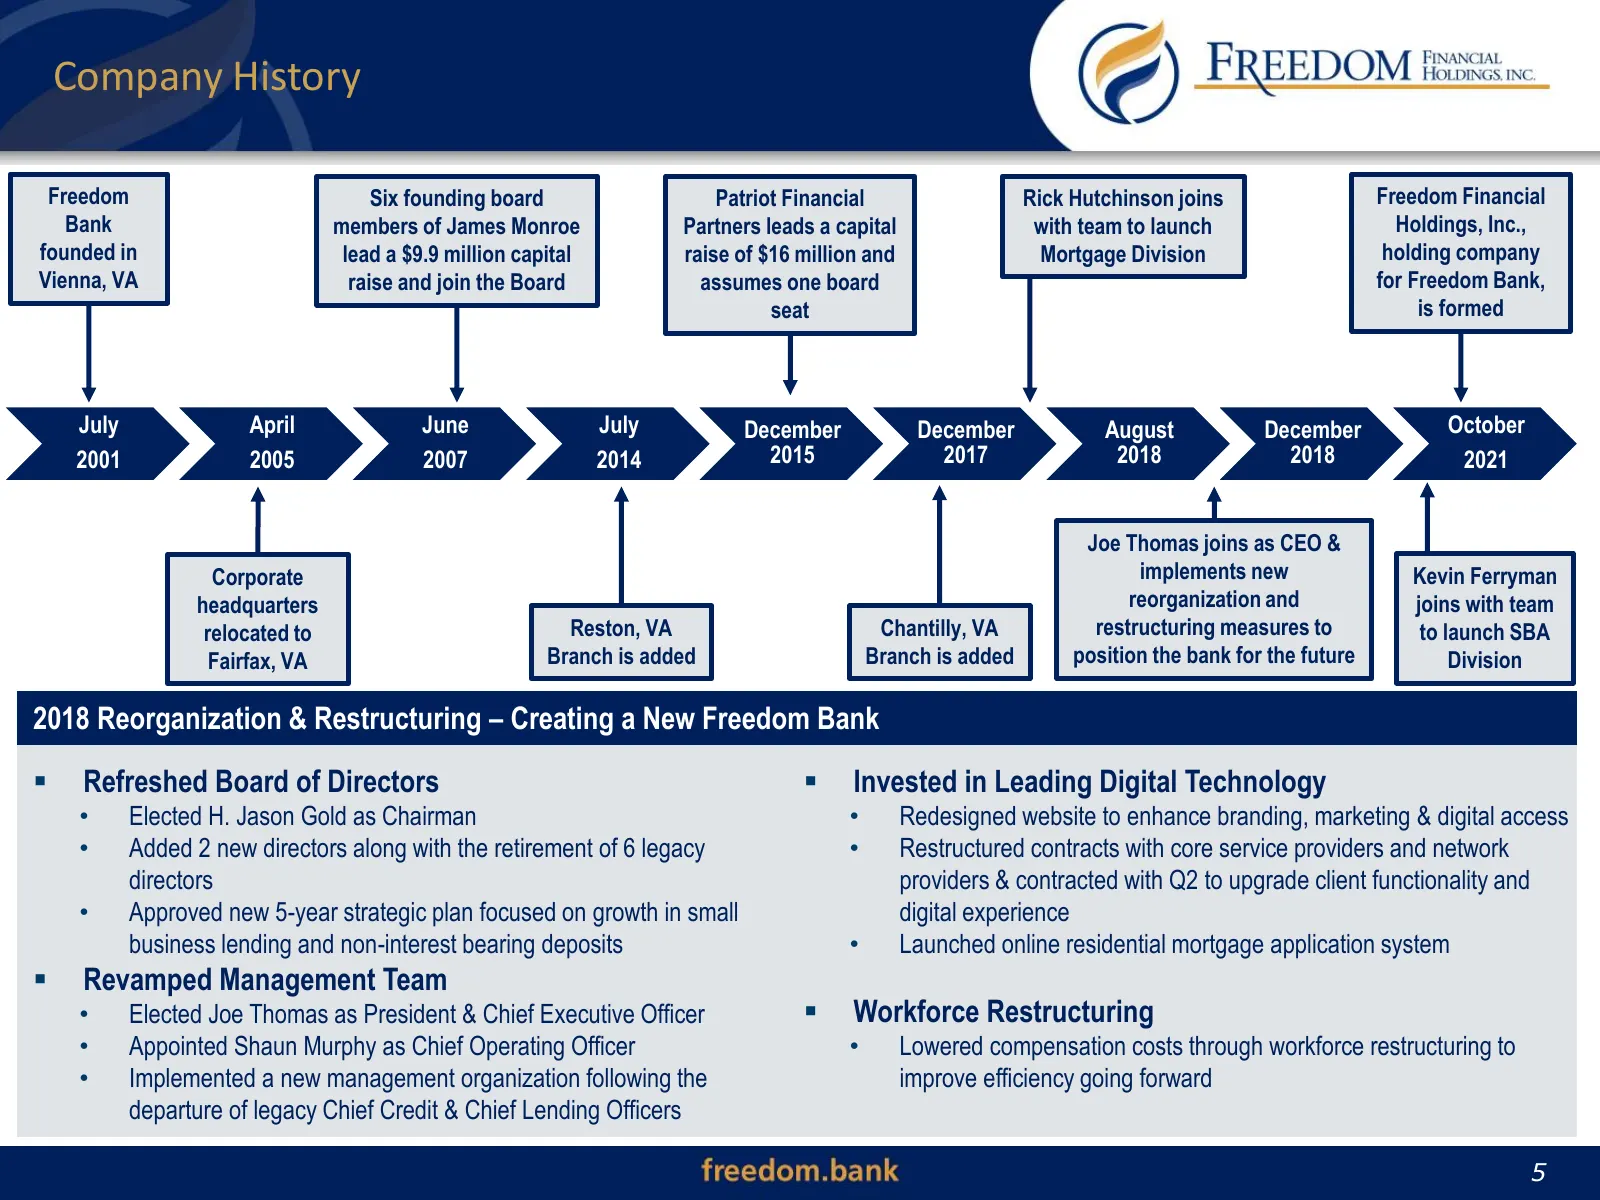
Company History Freedom Six founding board Patriot Financial Rick Hutchinson joins Freedom Financial Bank members of James Monroe Partners leads a capital with team to launch Holdings, Inc., founded in lead a $9.9 million capital raise of $16 million and Mortgage Division holding company Vienna, VA
Slide 6: Financial Highlights
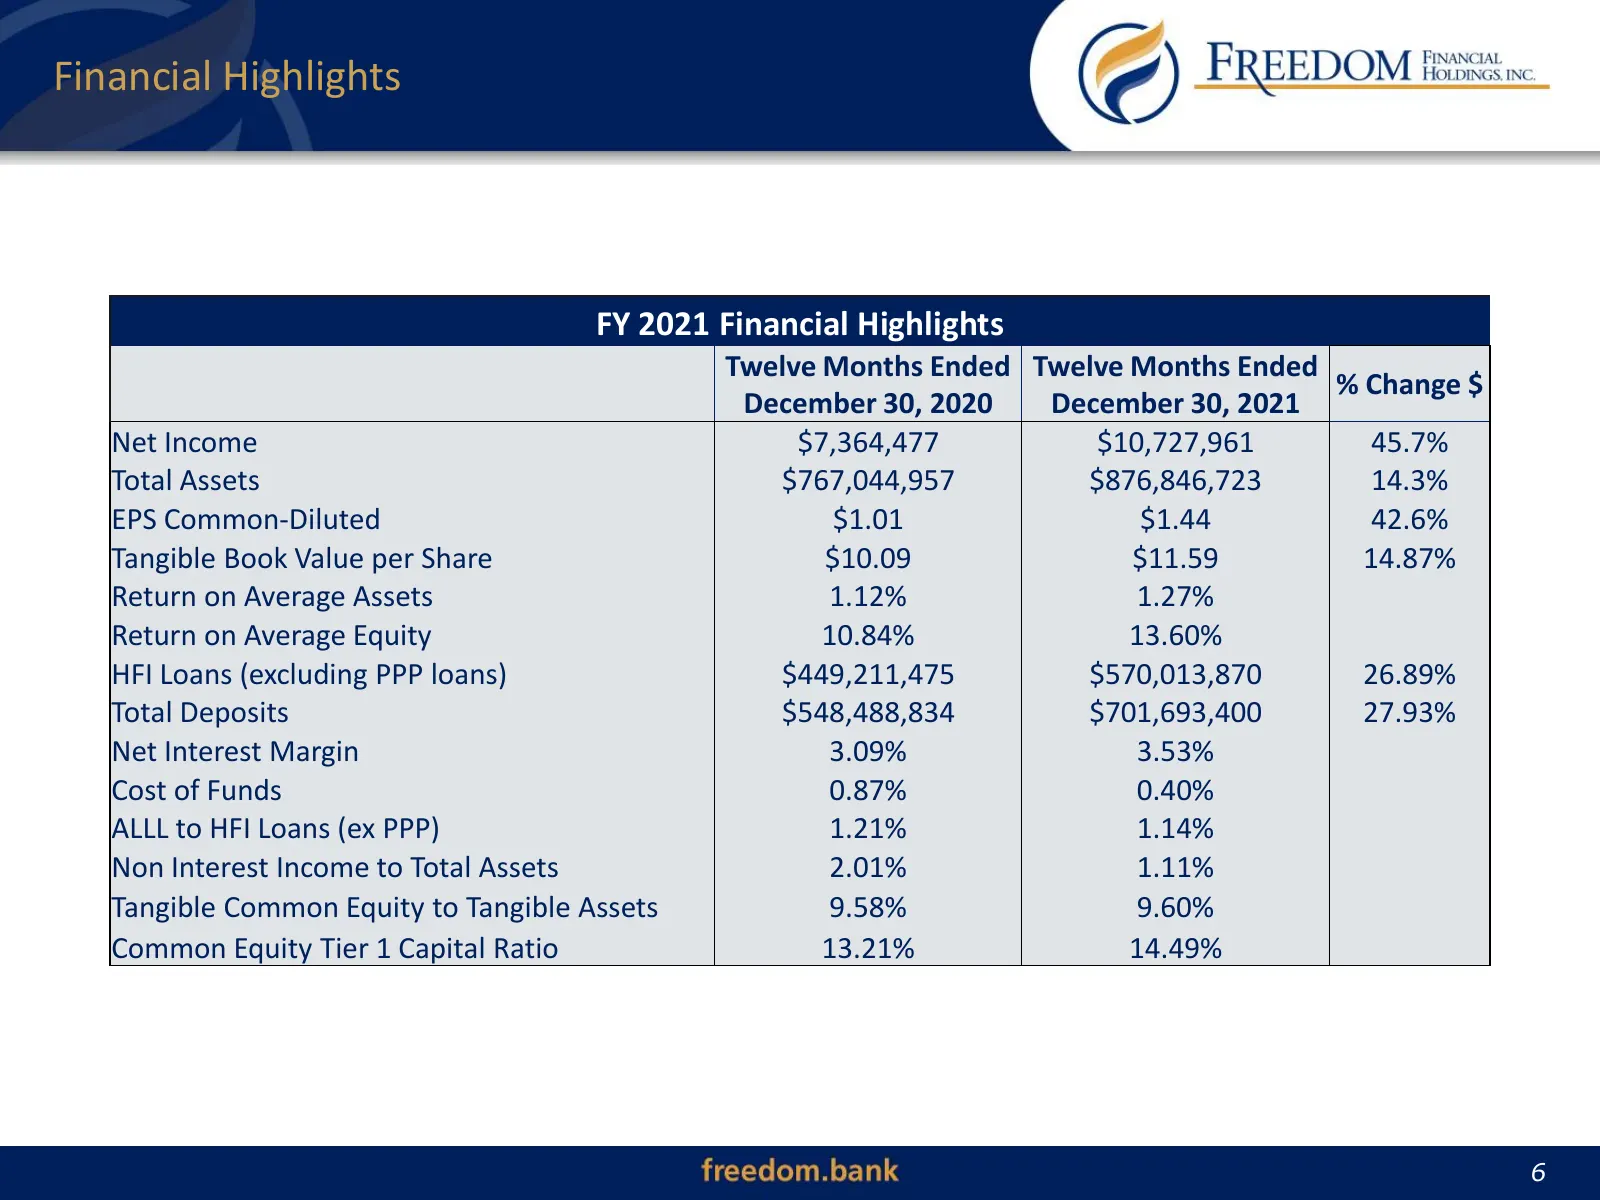
Financial Highlights FY 2021 Financial Highlights Twelve Months Ended Twelve Months Ended % Change $ December 30, 2020 December 30, 2021 Net Income $7,364,477 $10,727,961 45.7% Total Assets $767,044,957 $876,846,723 14.3% EPS Common-Diluted $1.01 $1.44 42.6% Tangible Book Value per Share $10.09 $11.
Slide 7: Top Quartile Profitability Amongst Peers
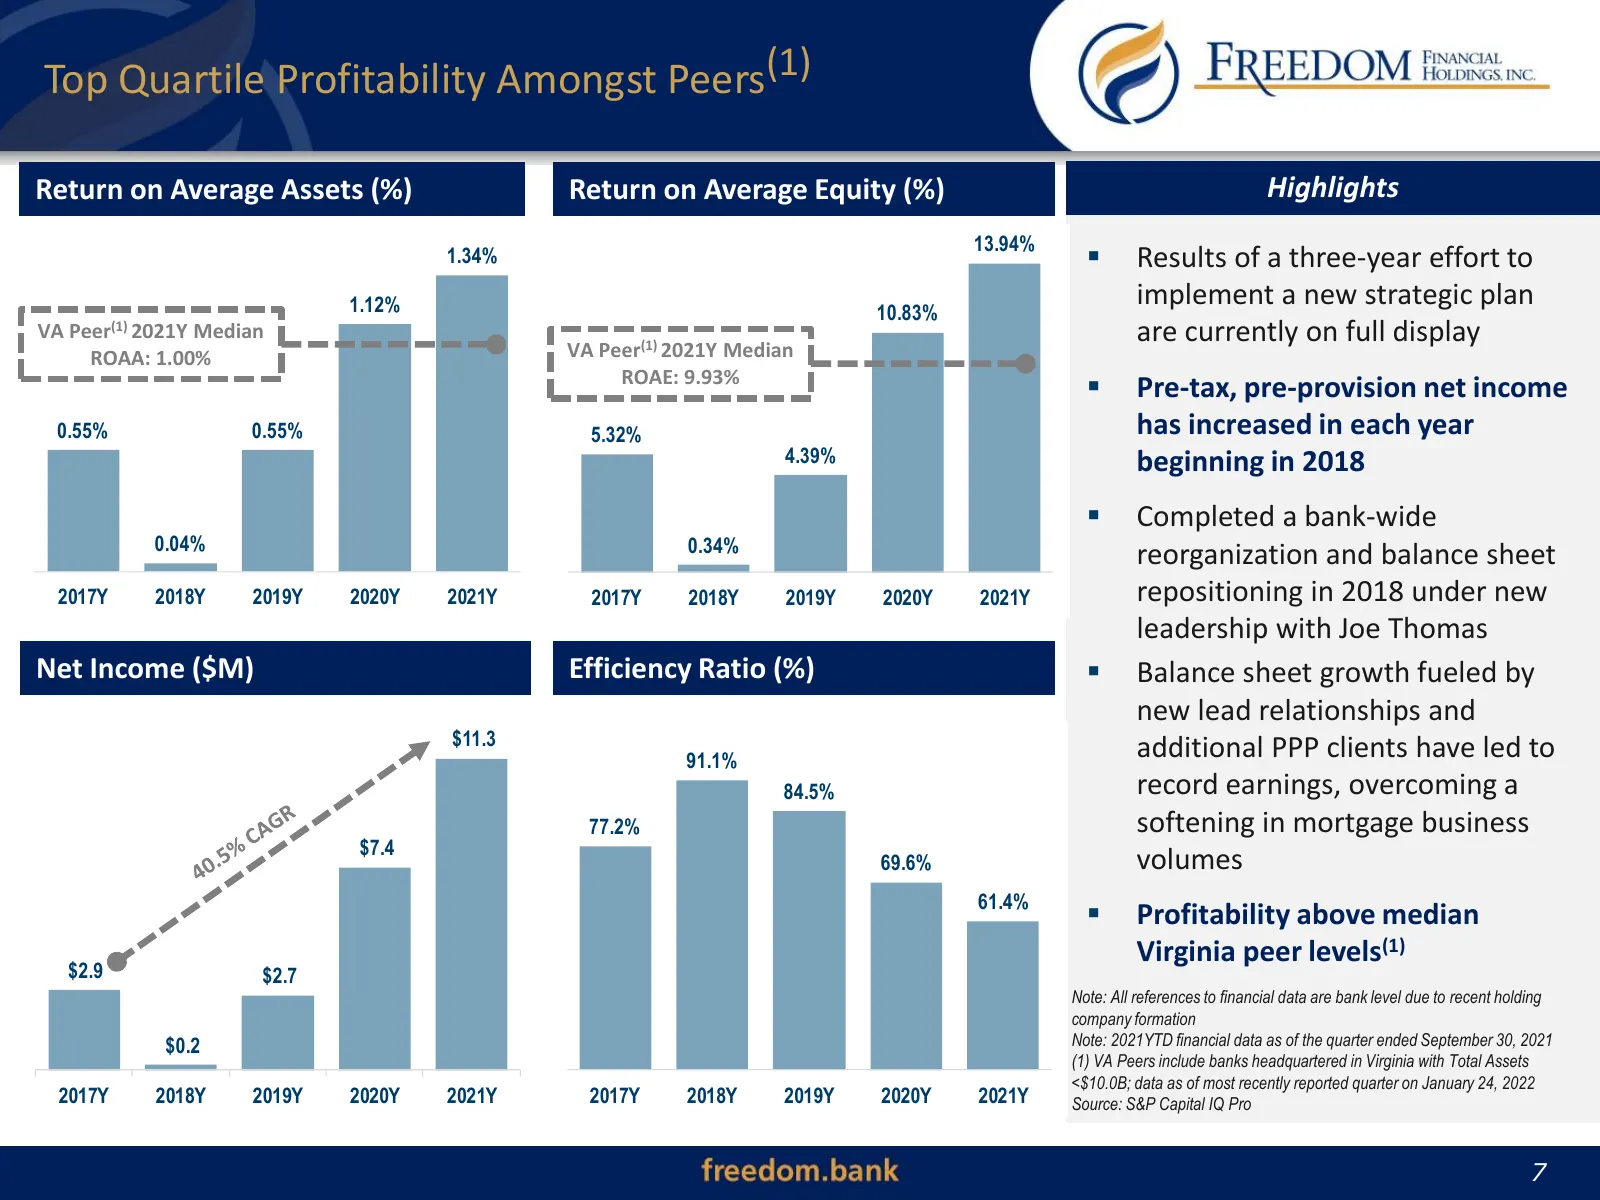
Top Quartile Profitability Amongst Peers(1) Return on Average Assets (%) Return on Average Equity (%) Highlights 13.94% 1.34% ▪ Results of a three-year effort to 1.12% implement a new strategic plan 10.83% VA Peer(1) 2021Y Median are currently on full display ROAA: 1.00% VA Peer(1) 2021Y Median ROAE
Slide 8: Investment Highlights
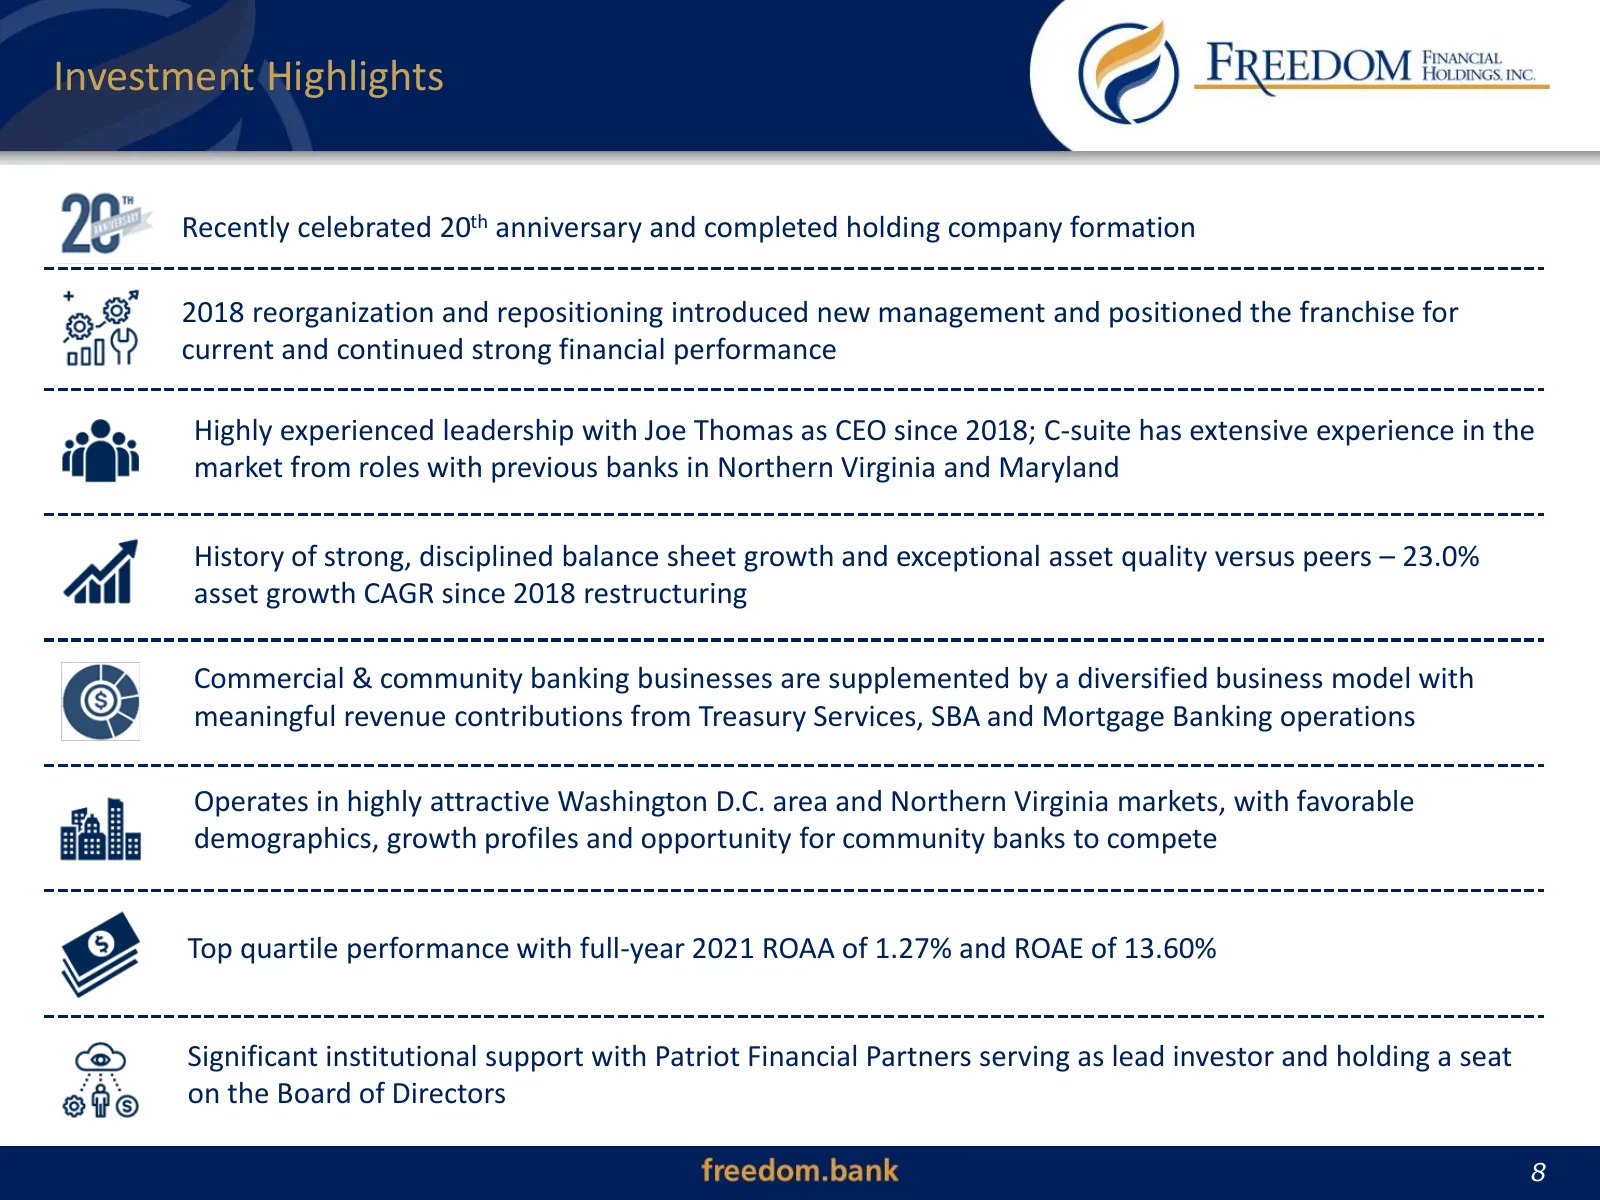
Investment Highlights ▪ Recently celebrated 20th anniversary and completed holding company formation ▪ 2018 reorganization and repositioning introduced new management and positioned the franchise for current and continued strong financial performance ▪ Highly experienced leadership with Joe Thomas a
Slide 9: Management, Model & Market
Management, Model & Market 9
Slide 10: Board of Directors
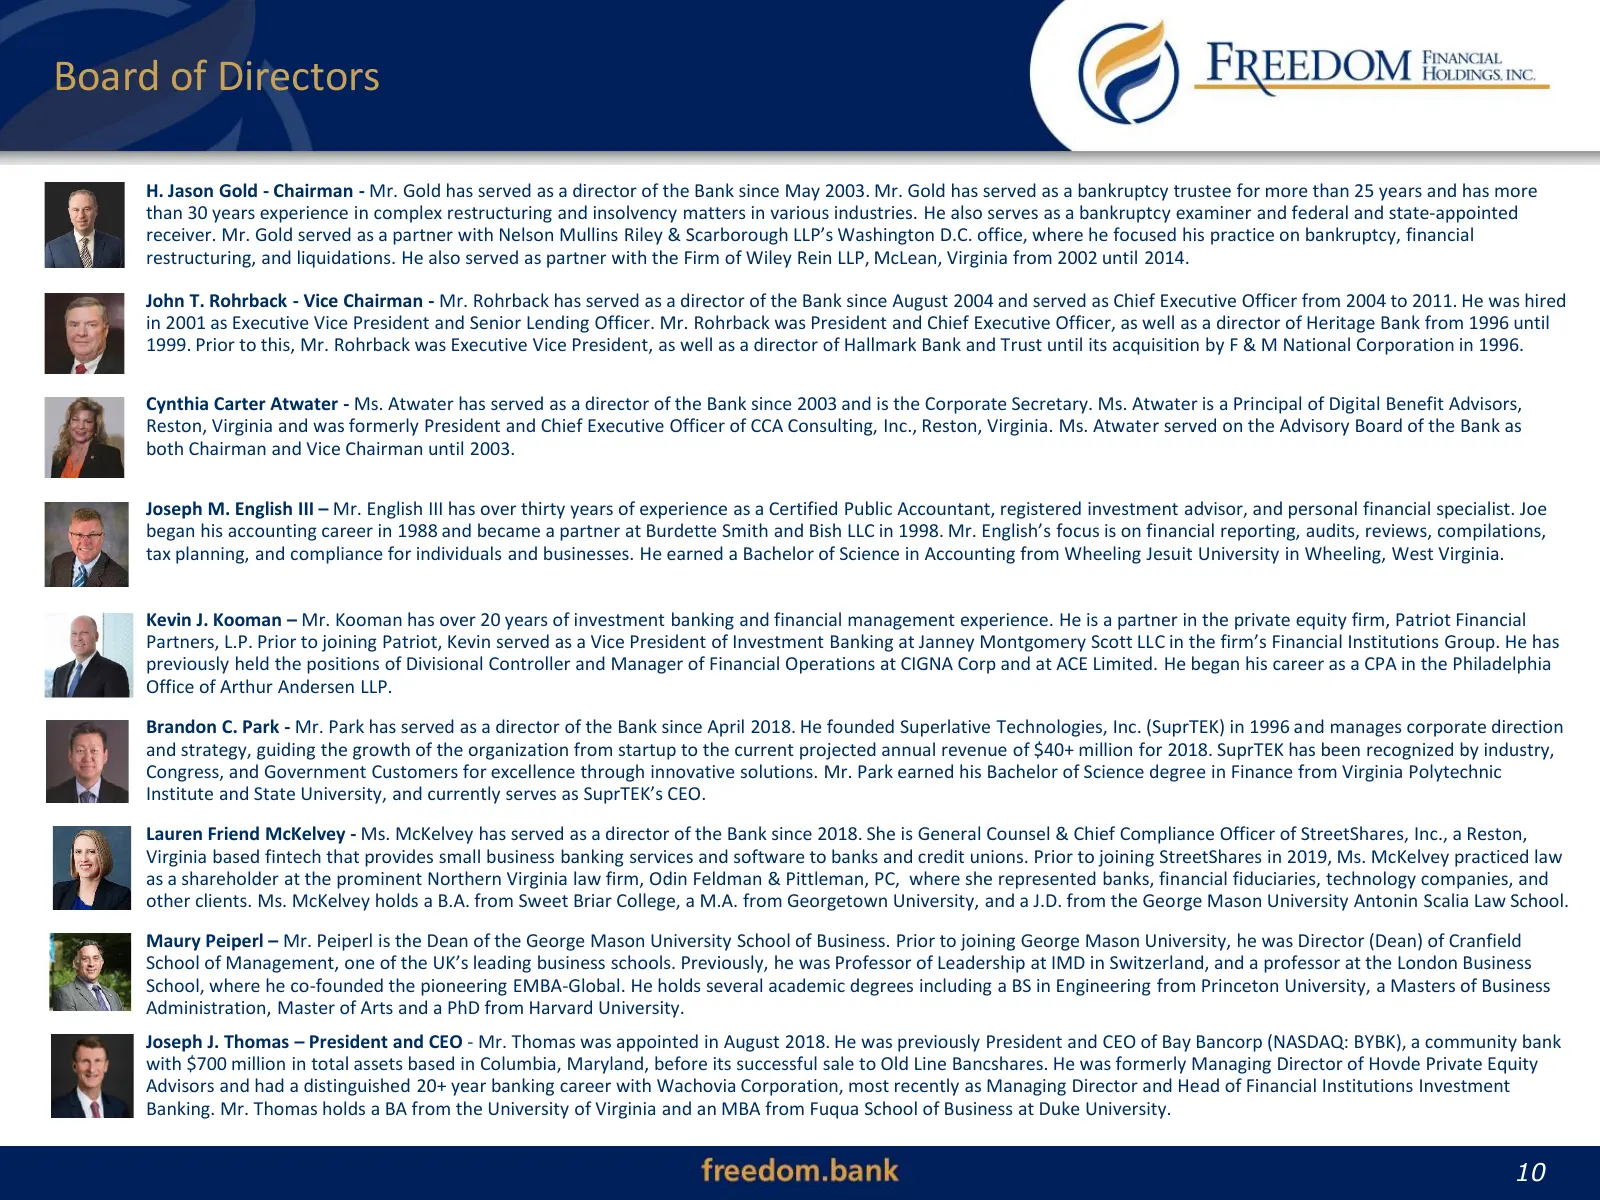
Board of Directors H. Jason Gold - Chairman - Mr. Gold has served as a director of the Bank since May 2003. Mr. Gold has served as a bankruptcy trustee for more than 25 years and has more than 30 years experience in complex restructuring and insolvency matters in various industries. He also serves a
Slide 11: Senior Management
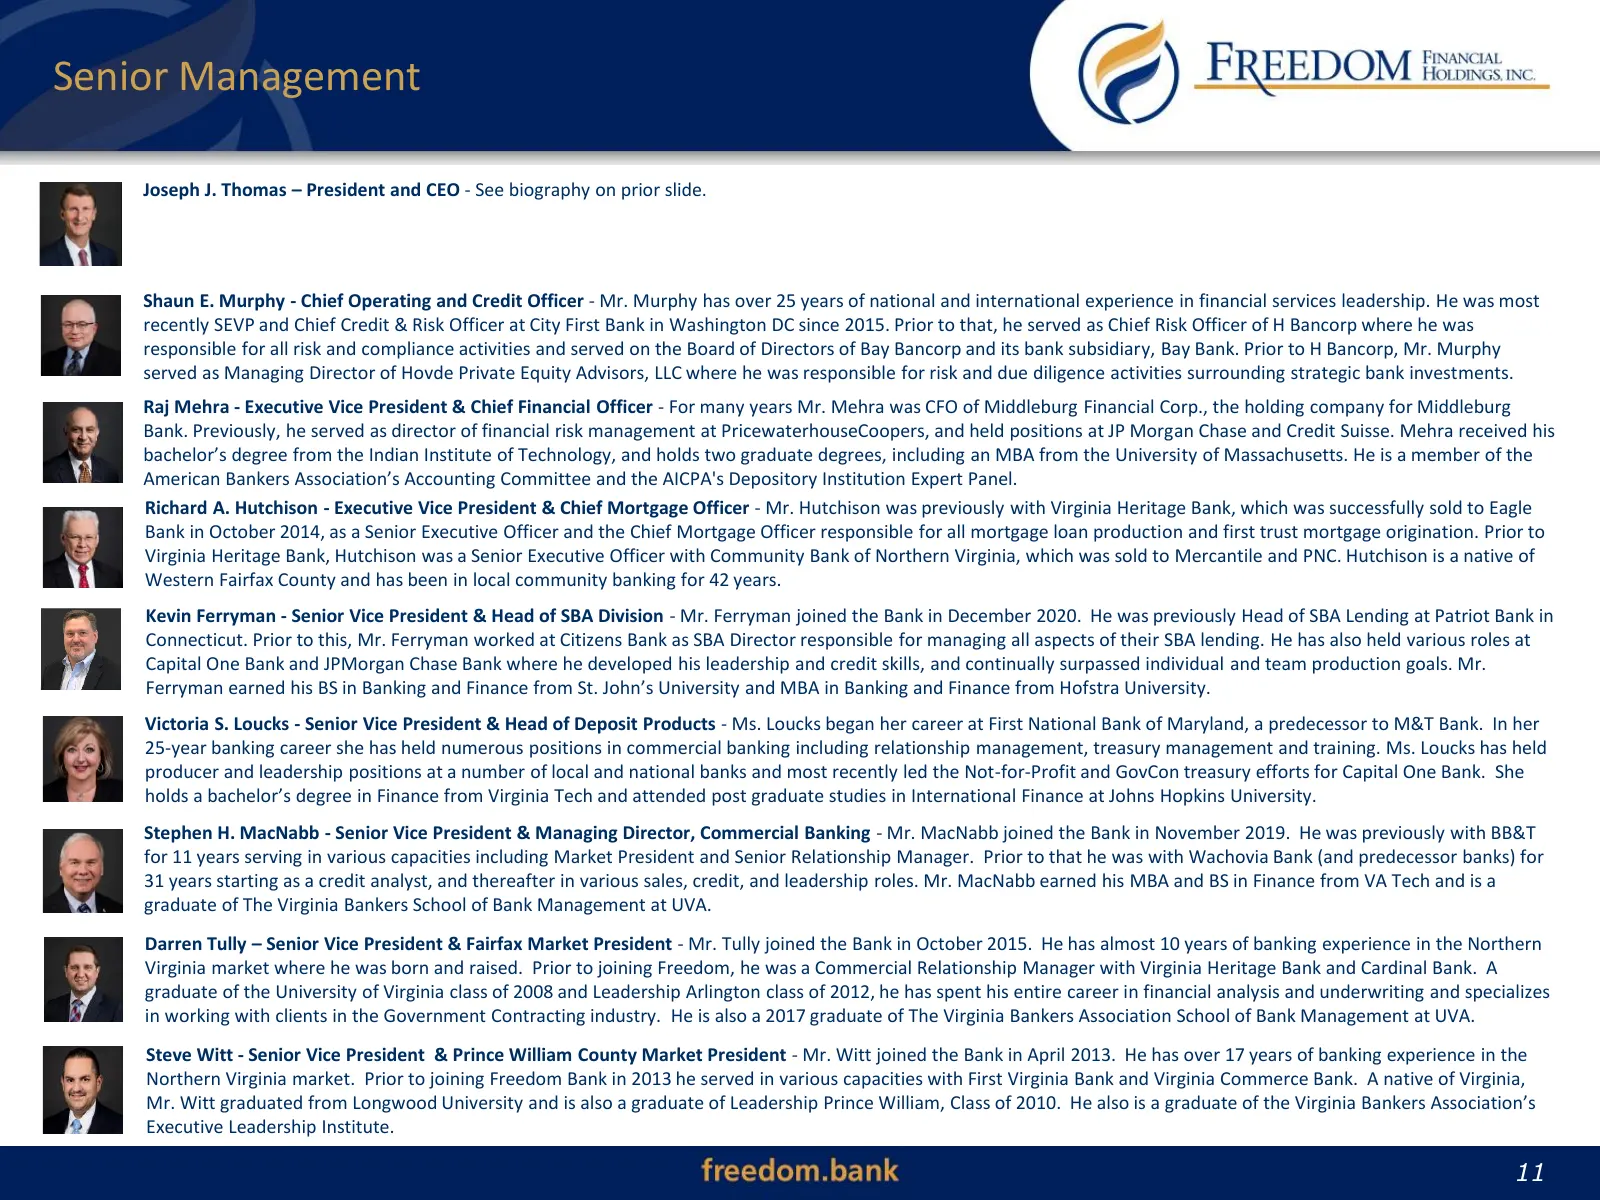
Senior Management Joseph J. Thomas – President and CEO - See biography on prior slide. Shaun E. Murphy - Chief Operating and Credit Officer - Mr. Murphy has over 25 years of national and international experience in financial services leadership. He was most recently SEVP and Chief Credit & Risk Offi
Slide 12: Diverse Business Lines
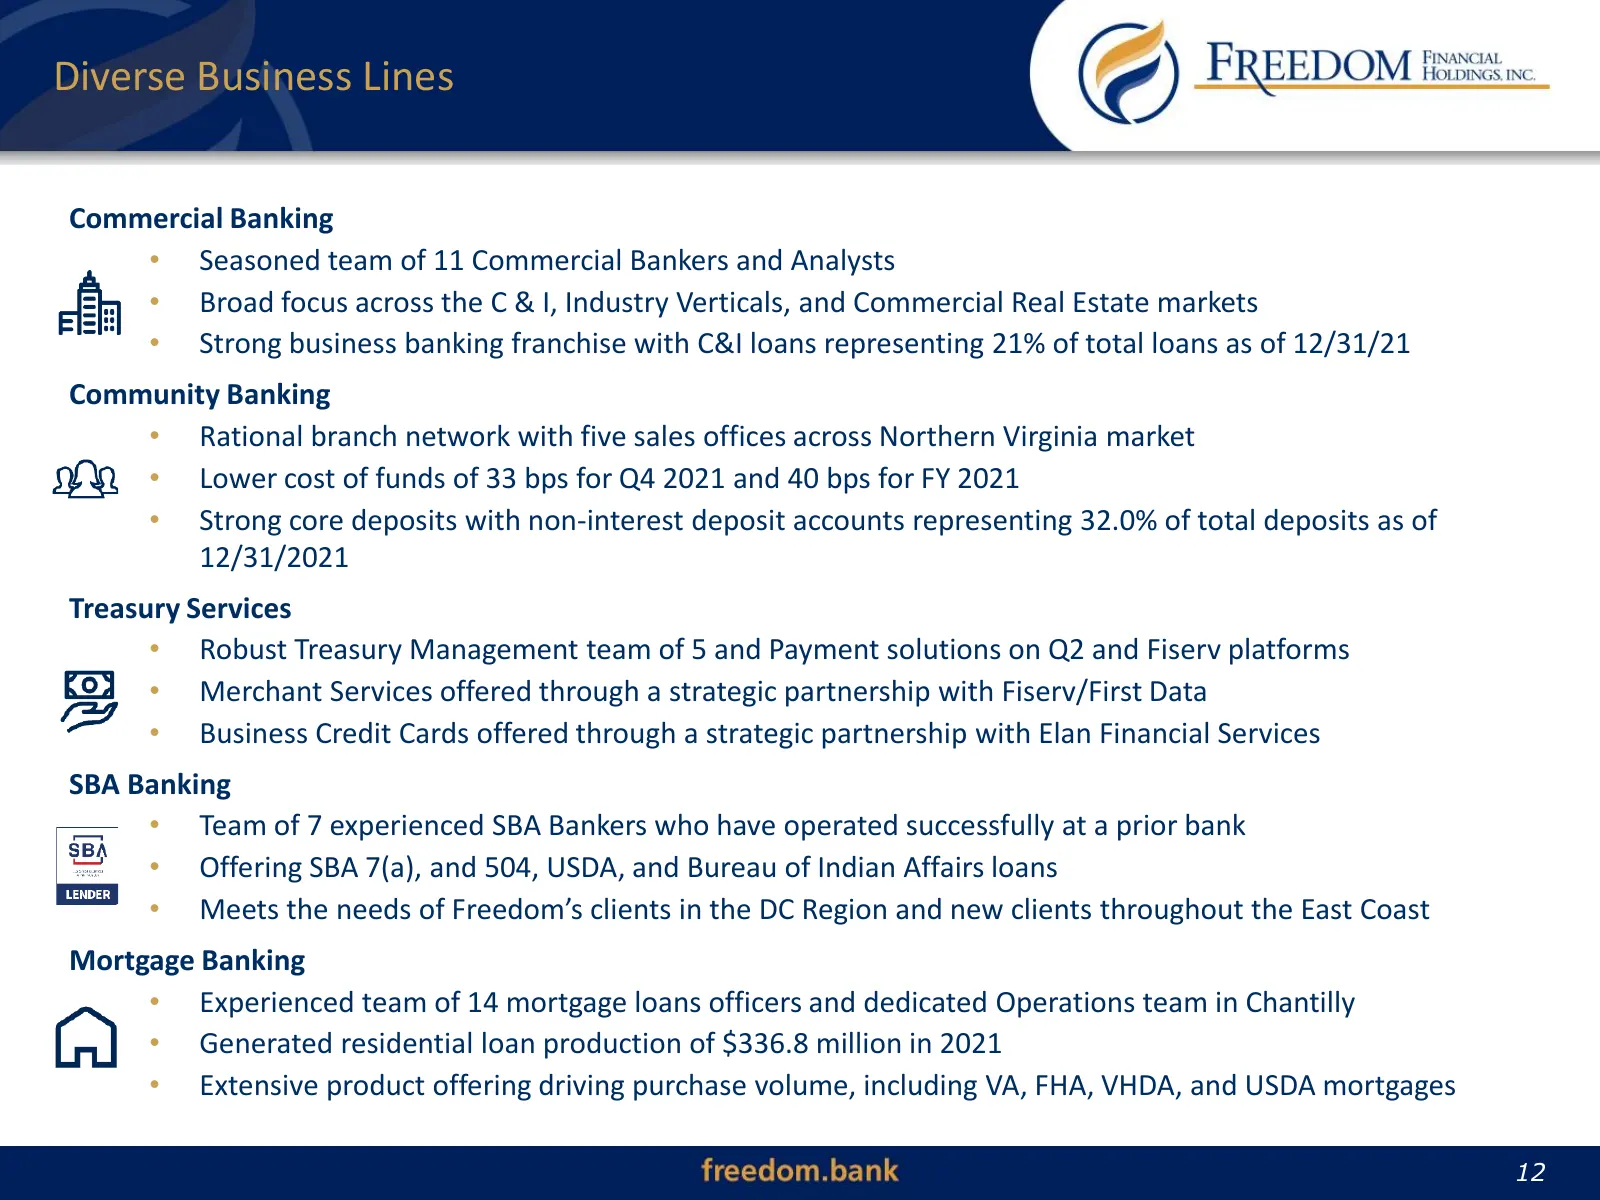
Diverse Business Lines Commercial Banking • Seasoned team of 11 Commercial Bankers and Analysts • Broad focus across the C & I, Industry Verticals, and Commercial Real Estate markets • Strong business banking franchise with C&I loans representing 21% of total loans as of 12/31/21 Community Banking •
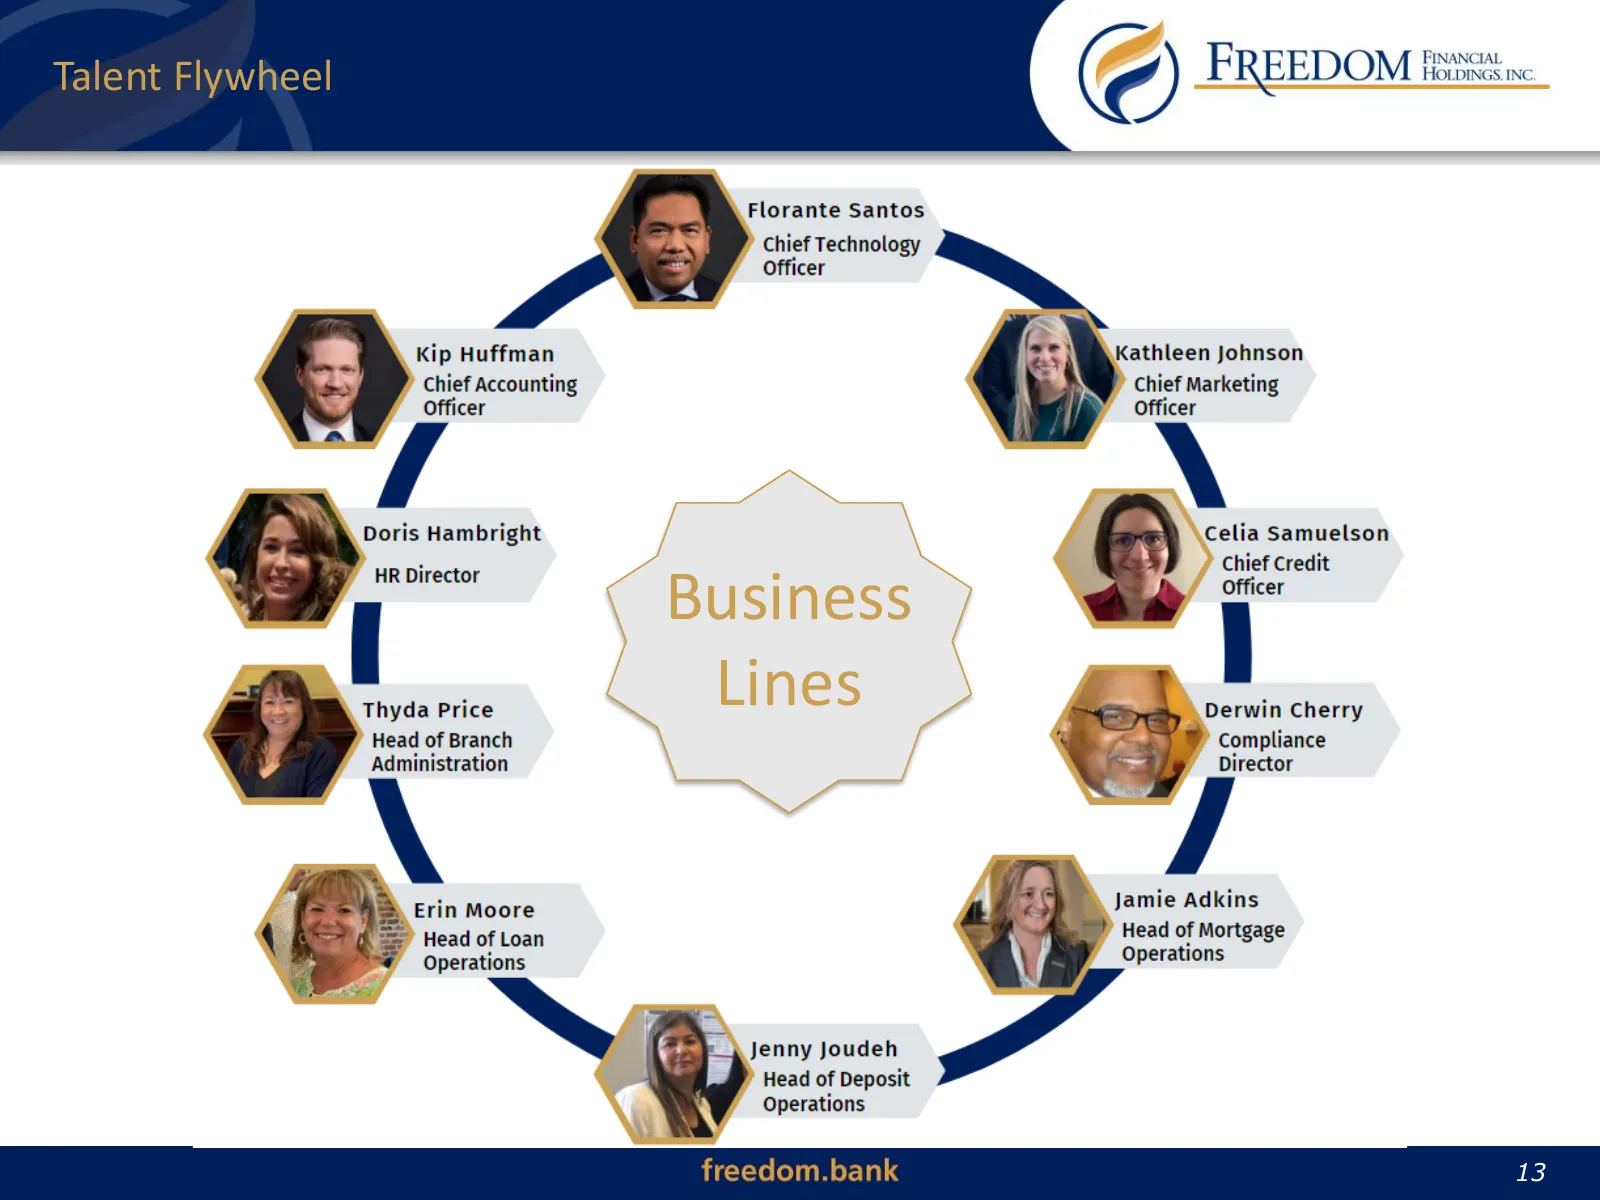
Slide 13: Business Lines
Talent Flywheel Business Lines 13 13
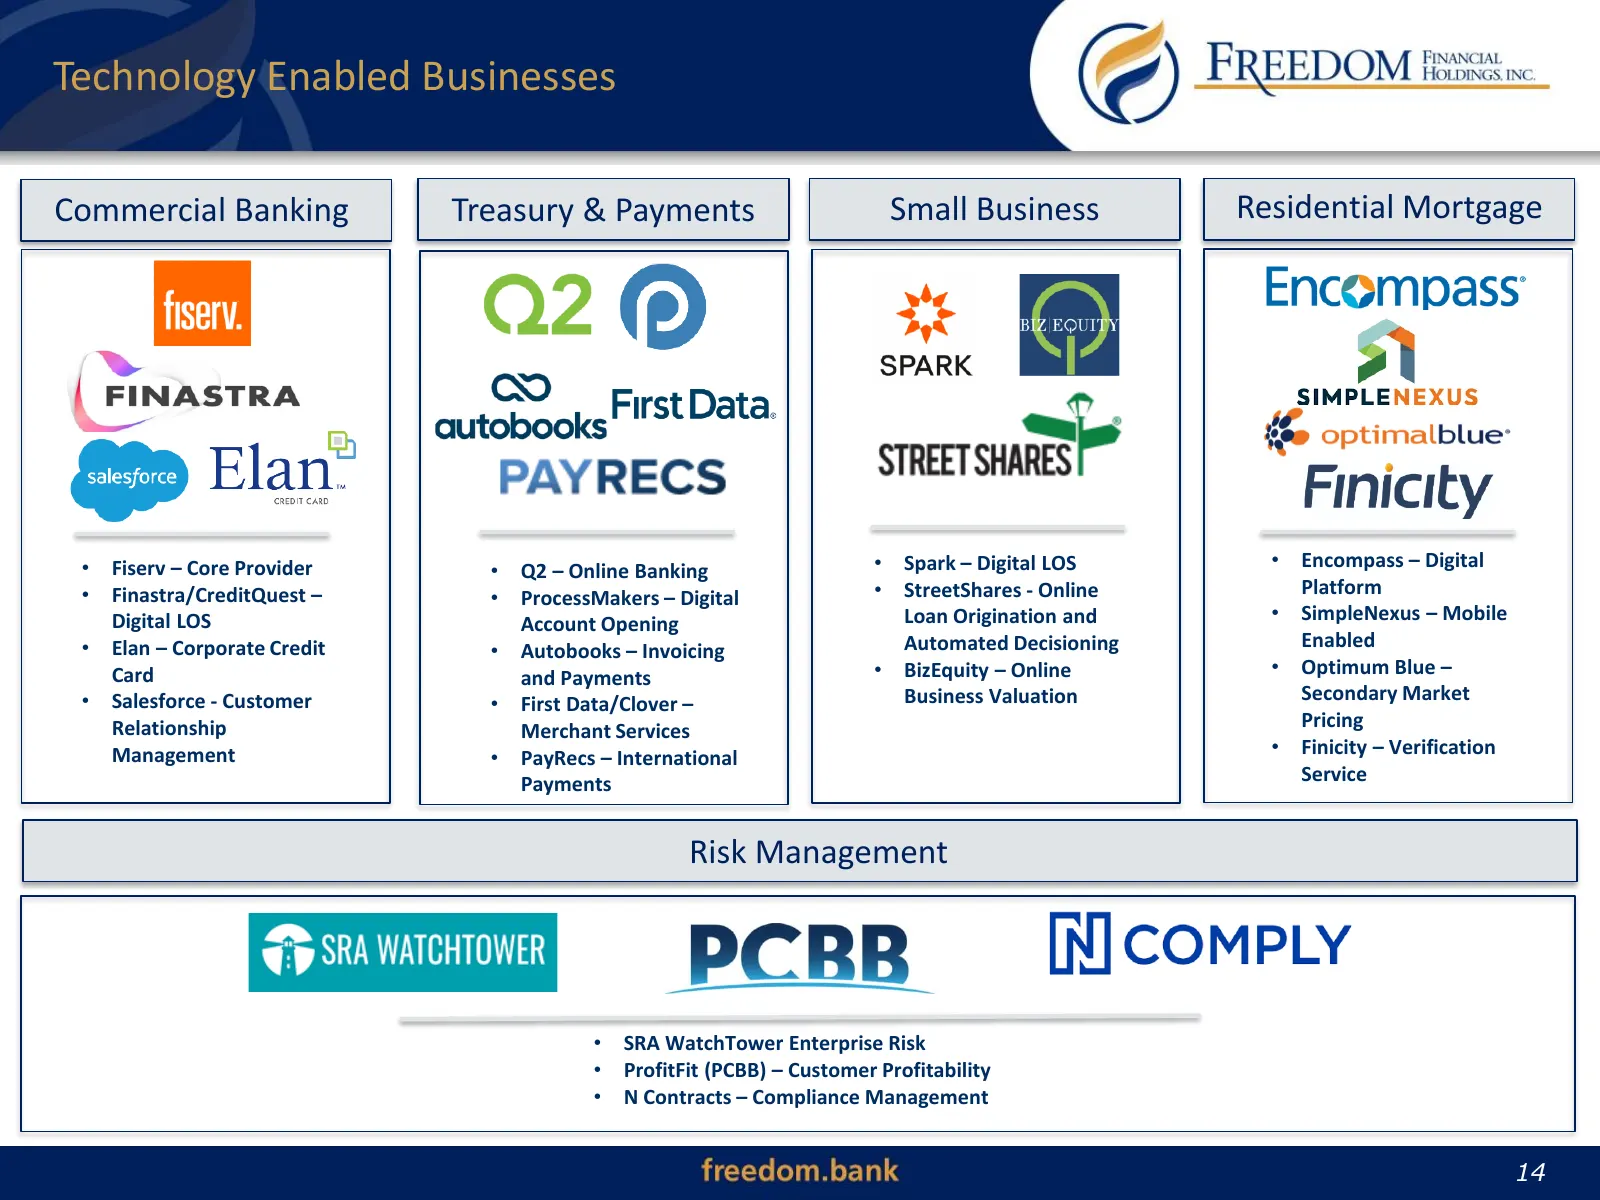
Slide 14: Technology Enabled Businesses
Technology Enabled Businesses Commercial Banking Treasury & Payments Small Business Residential Mortgage • Fiserv – Core Provider • Q2 – Online Banking • Spark – Digital LOS • Encompass – Digital • Finastra/CreditQuest – • ProcessMakers – Digital • StreetShares - Online Platform Digital LOS Account
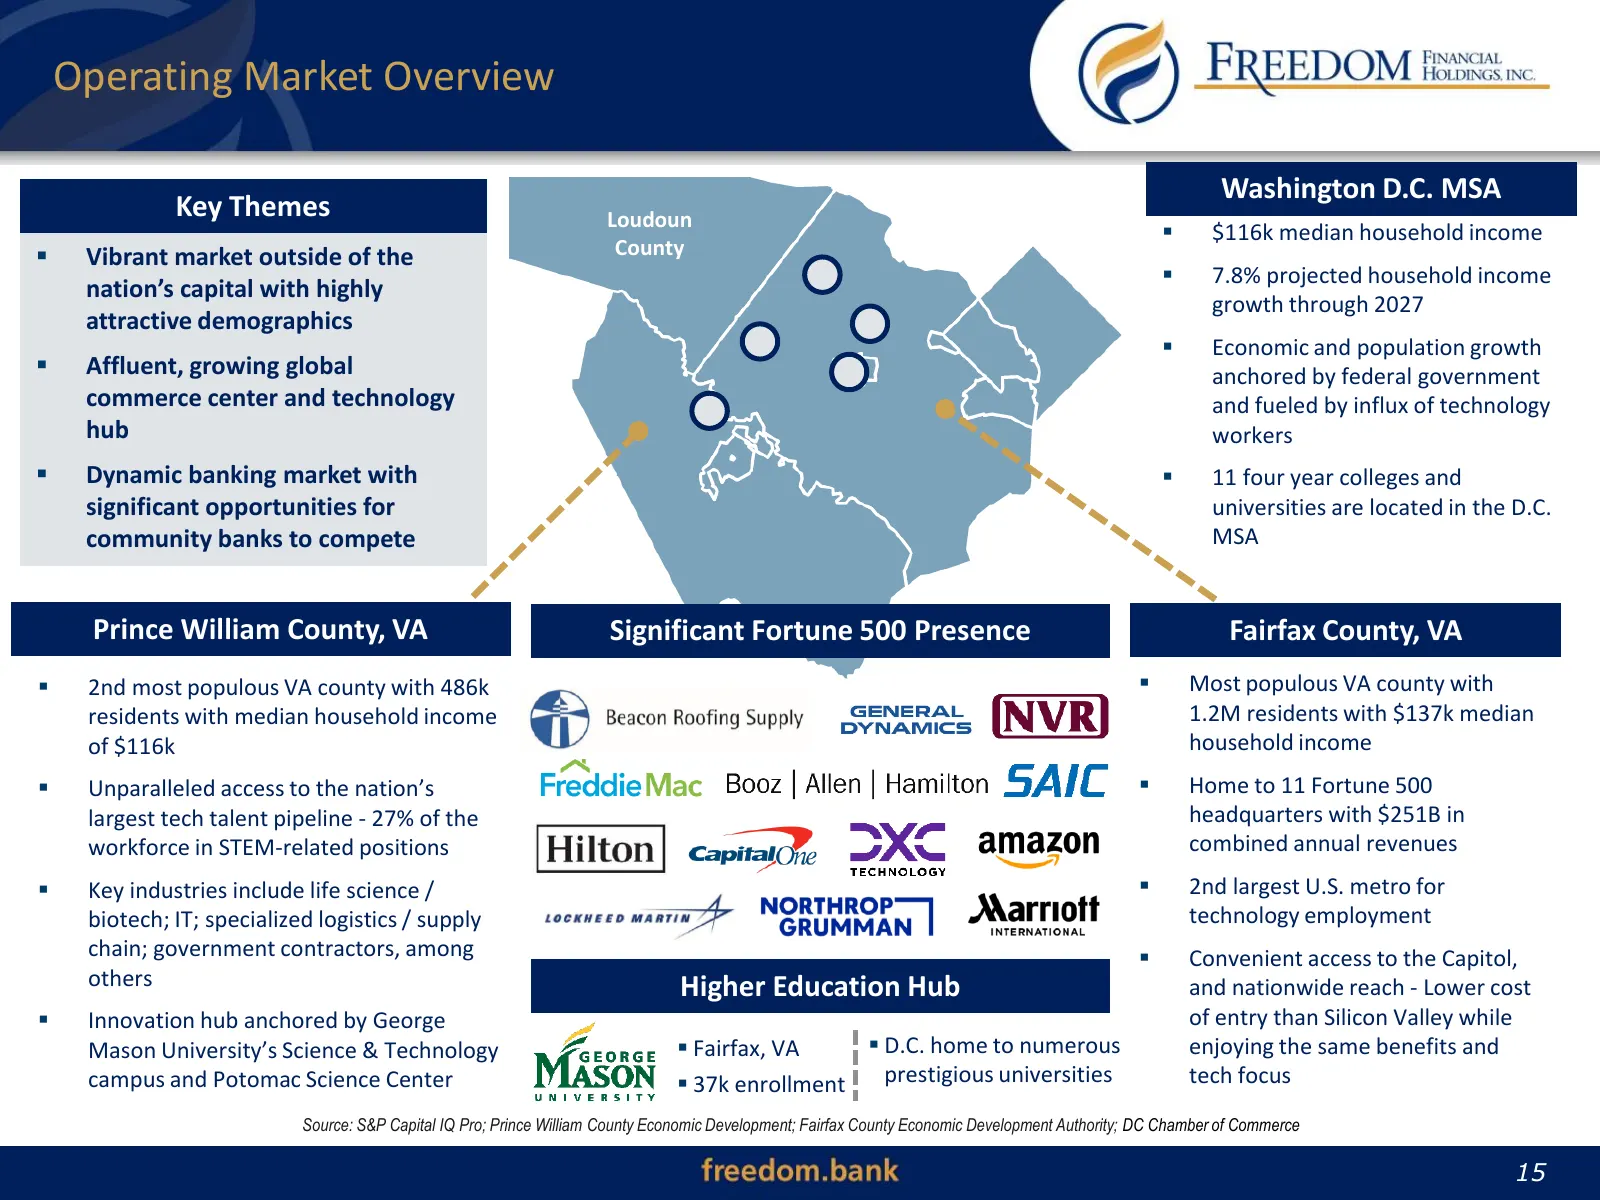
Slide 15: Operating Market Overview
Operating Market Overview Washington D.C. MSA Key Themes Loudoun ▪ $116k median household income ▪ Vibrant market outside of the County ▪ 7.8% projected household income nation’s capital with highly growth through 2027 attractive demographics ▪ Economic and population growth ▪ Affluent, growing glob
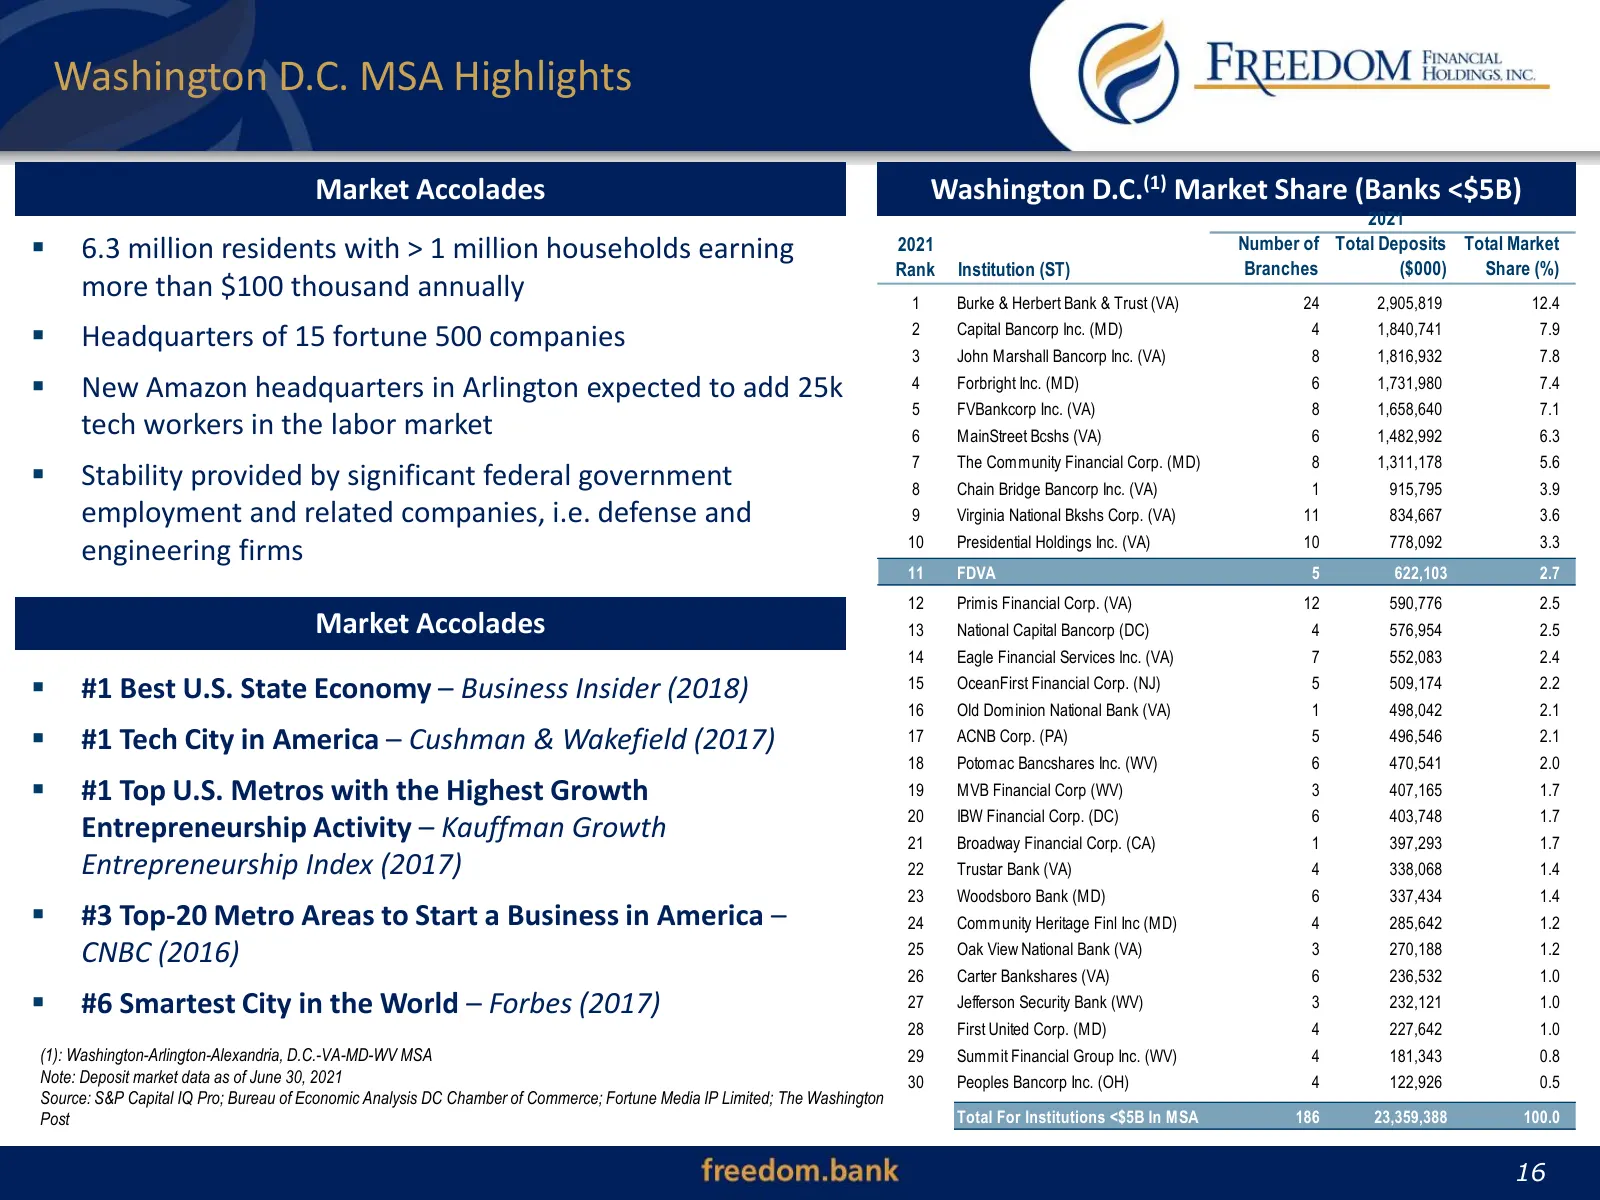
Slide 16: Washington D.C. MSA Highlights
Washington D.C. MSA Highlights Market Accolades Washington D.C.(1) Market Share (Banks <$5B) 2021 ▪ 6.3 million residents with > 1 million households earning 2021 Number of Total Deposits Total Market Rank Institution (ST) Branches ($000) Share (%) more than $100 thousand annually 1 Burke & Herbert
Slide 17: Demographics & Deposit Market Share
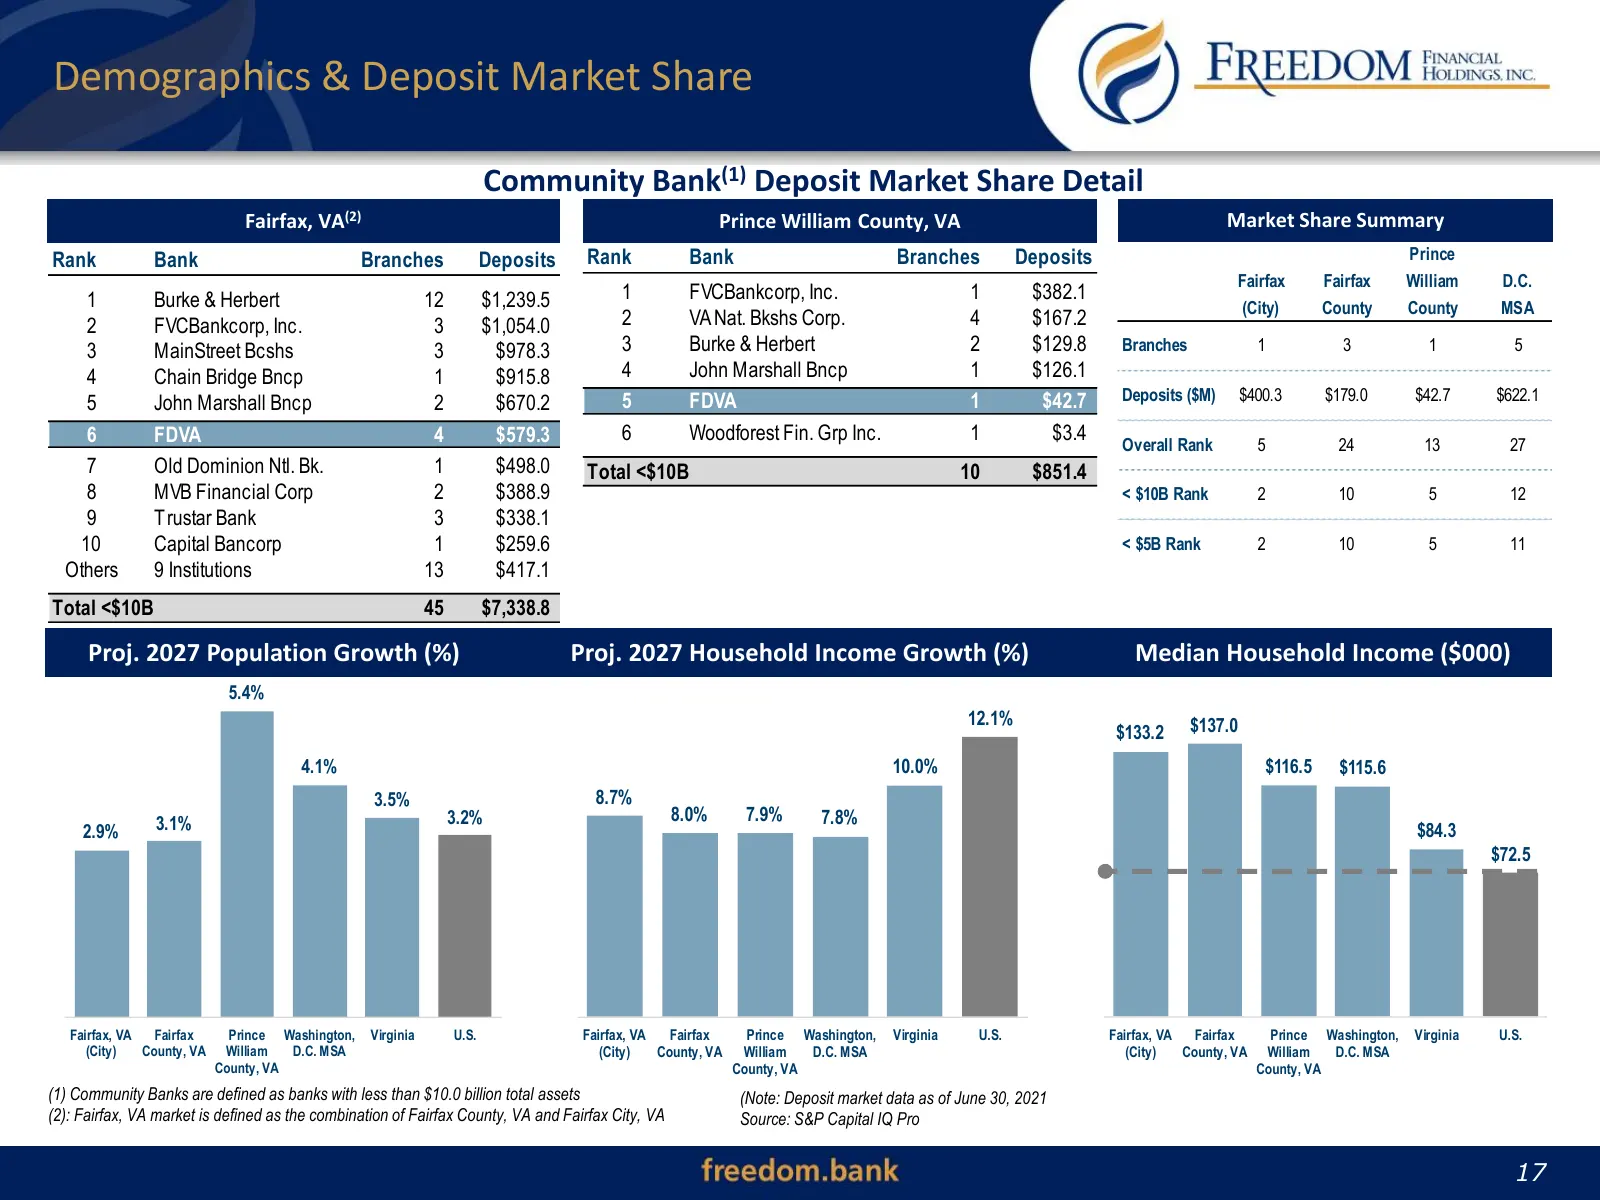
Demographics & Deposit Market Share Community Bank(1) Deposit Market Share Detail Fairfax, VA(2) Prince William County, VA Market Share Summary Rank Bank Branches Deposits Rank Bank Branches Deposits Prince Fairfax Fairfax William D.C. 1 Burke & Herbert 12 $1,239.5 1 FVCBankcorp, Inc. 1 $382.1 (City
Slide 18: Clients, Capabilities & Communities
Clients, Capabilities & Communities 18
Slide 19: 2021 Accomplishments - Colleagues
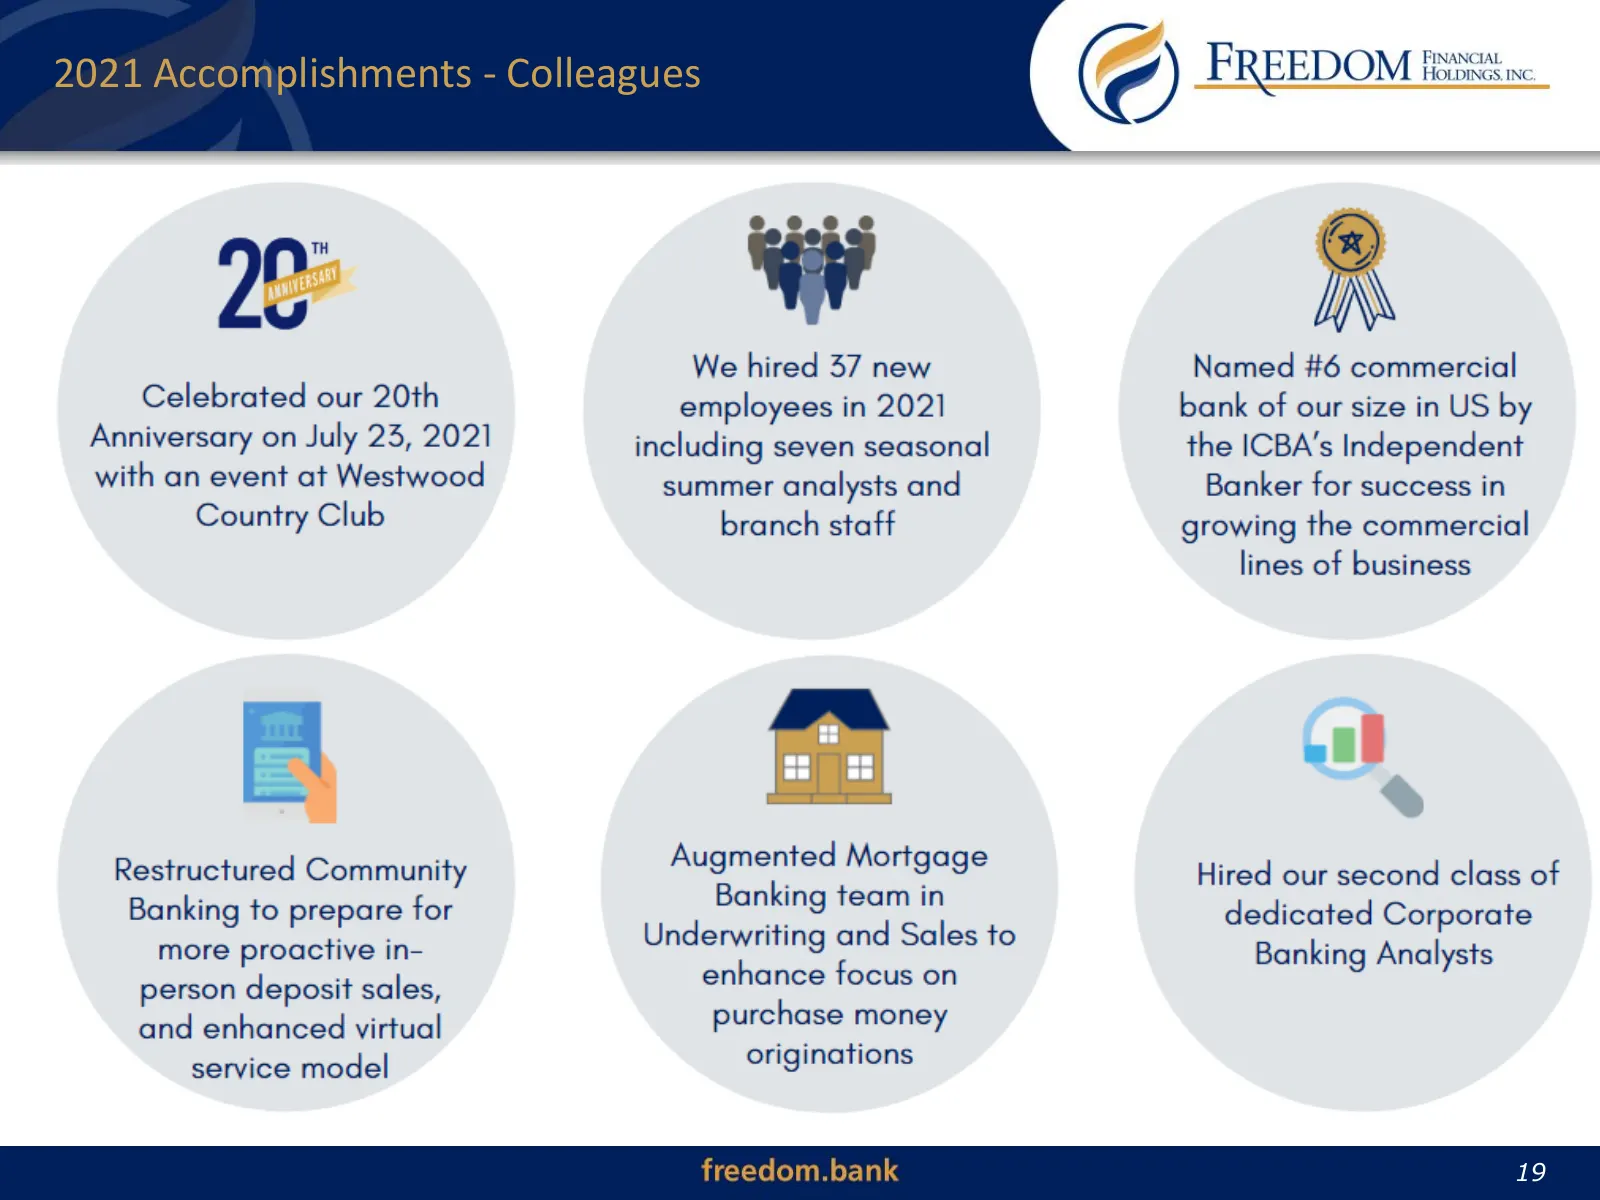
2021 Accomplishments - Colleagues 19 19
Slide 20: 2021 Accomplishments - Clients
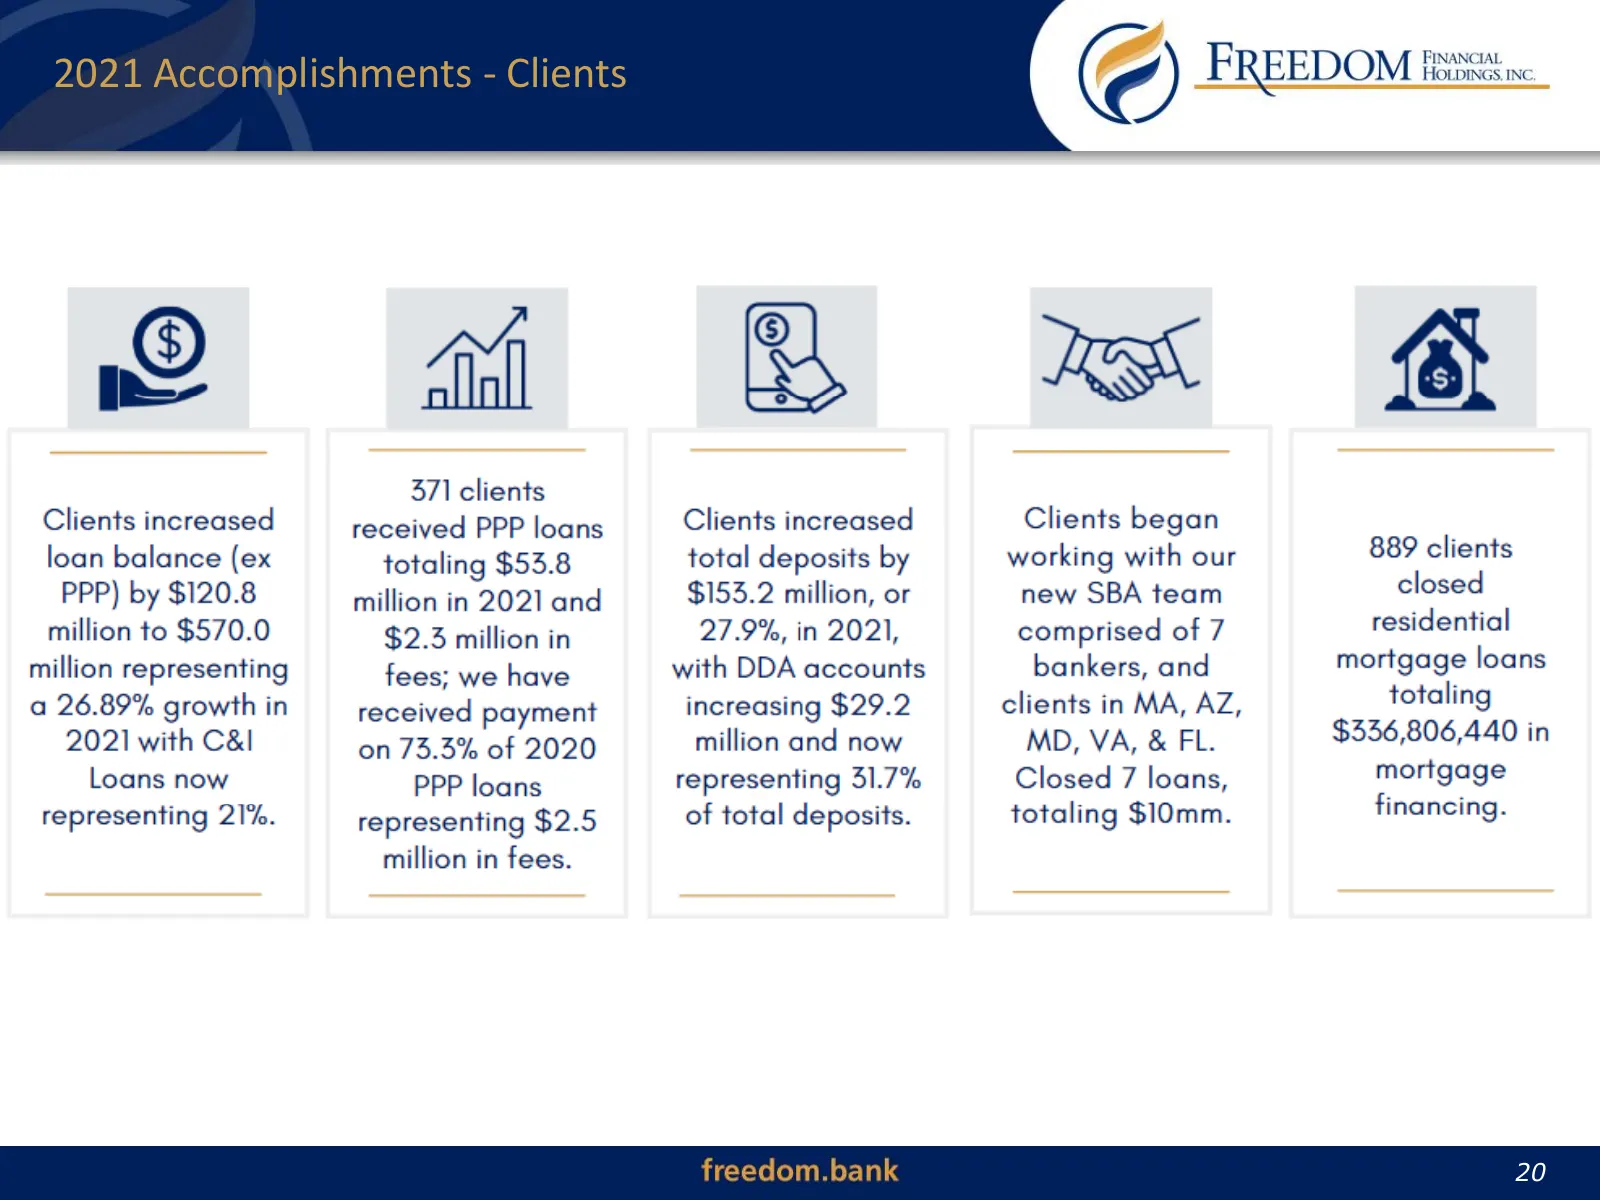
2021 Accomplishments - Clients 20 20
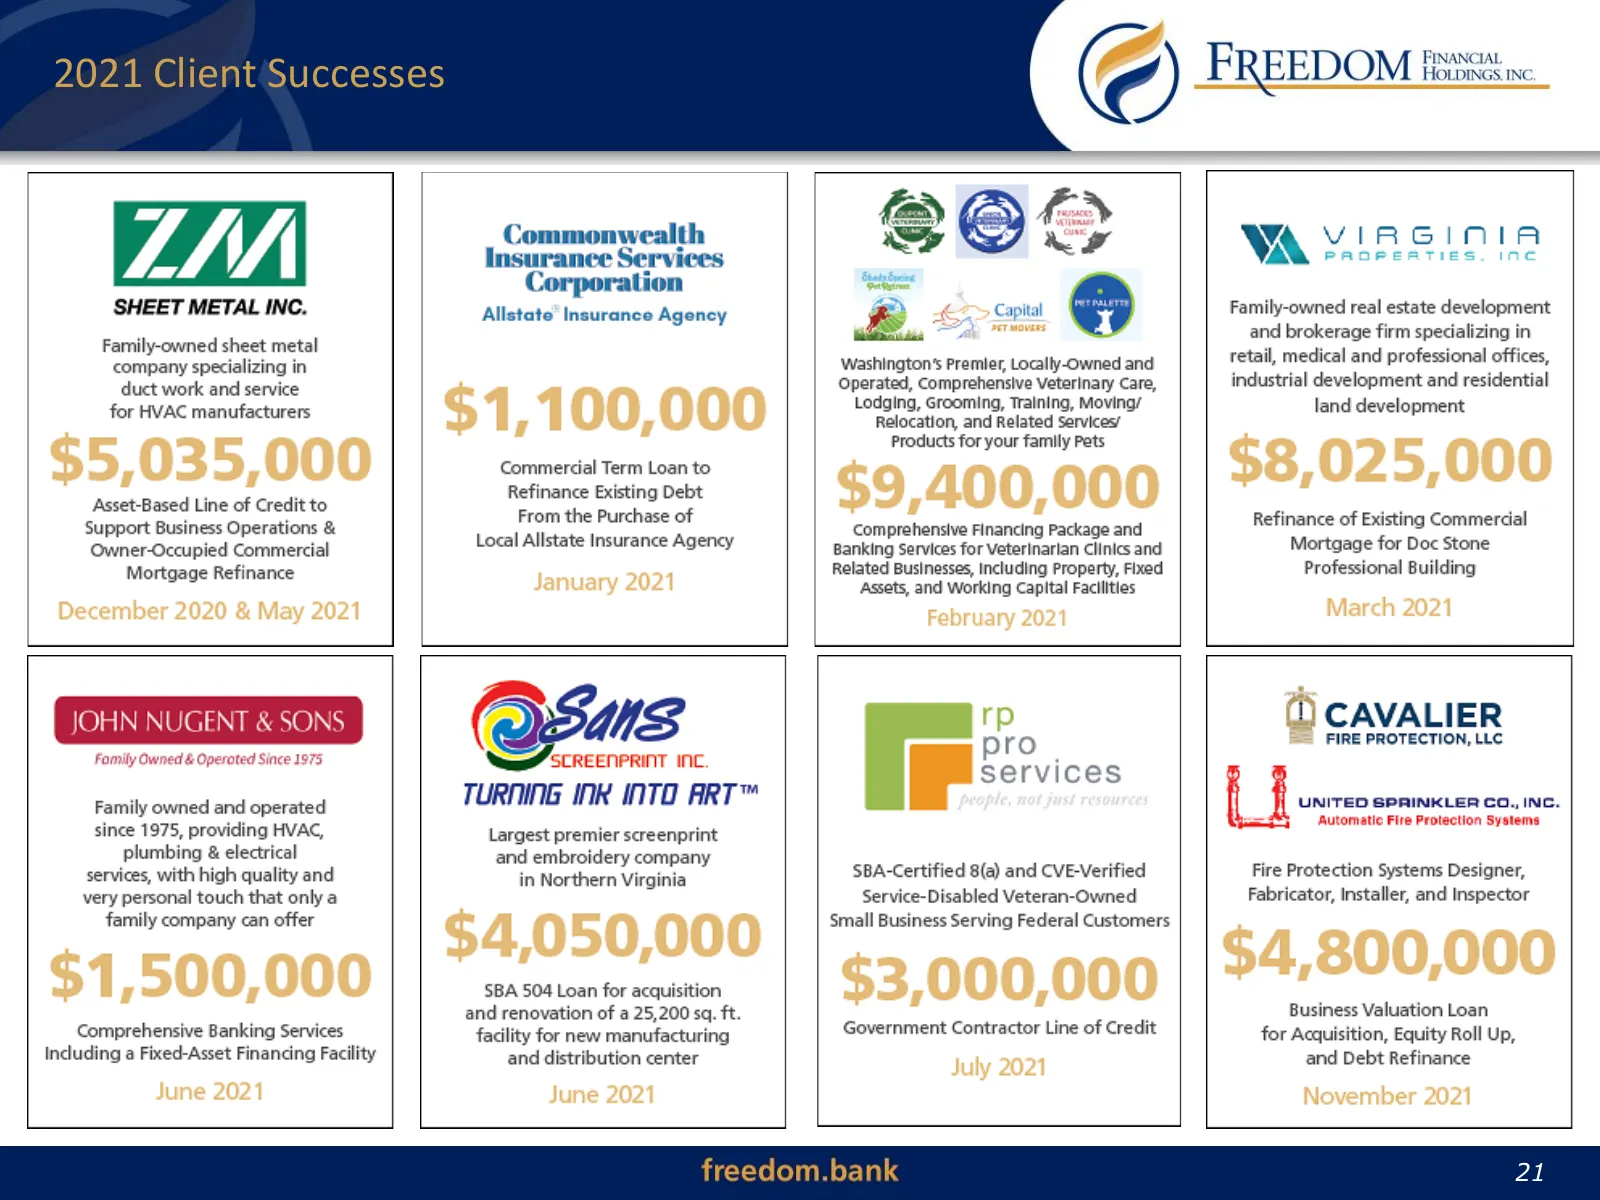
Slide 21: 2021 Client Successes
021 Client Successes IMMA SHEET METAL INC. Family-owned sheet metal company specializing in duct work and service for HVAC manufacturers Asset-Based Line of Credit to Support Business Operations & Owner-Occupied Commercial Mortgage Refinance Corporat Allstate’ Insurance Agency Commercial Term Loan t
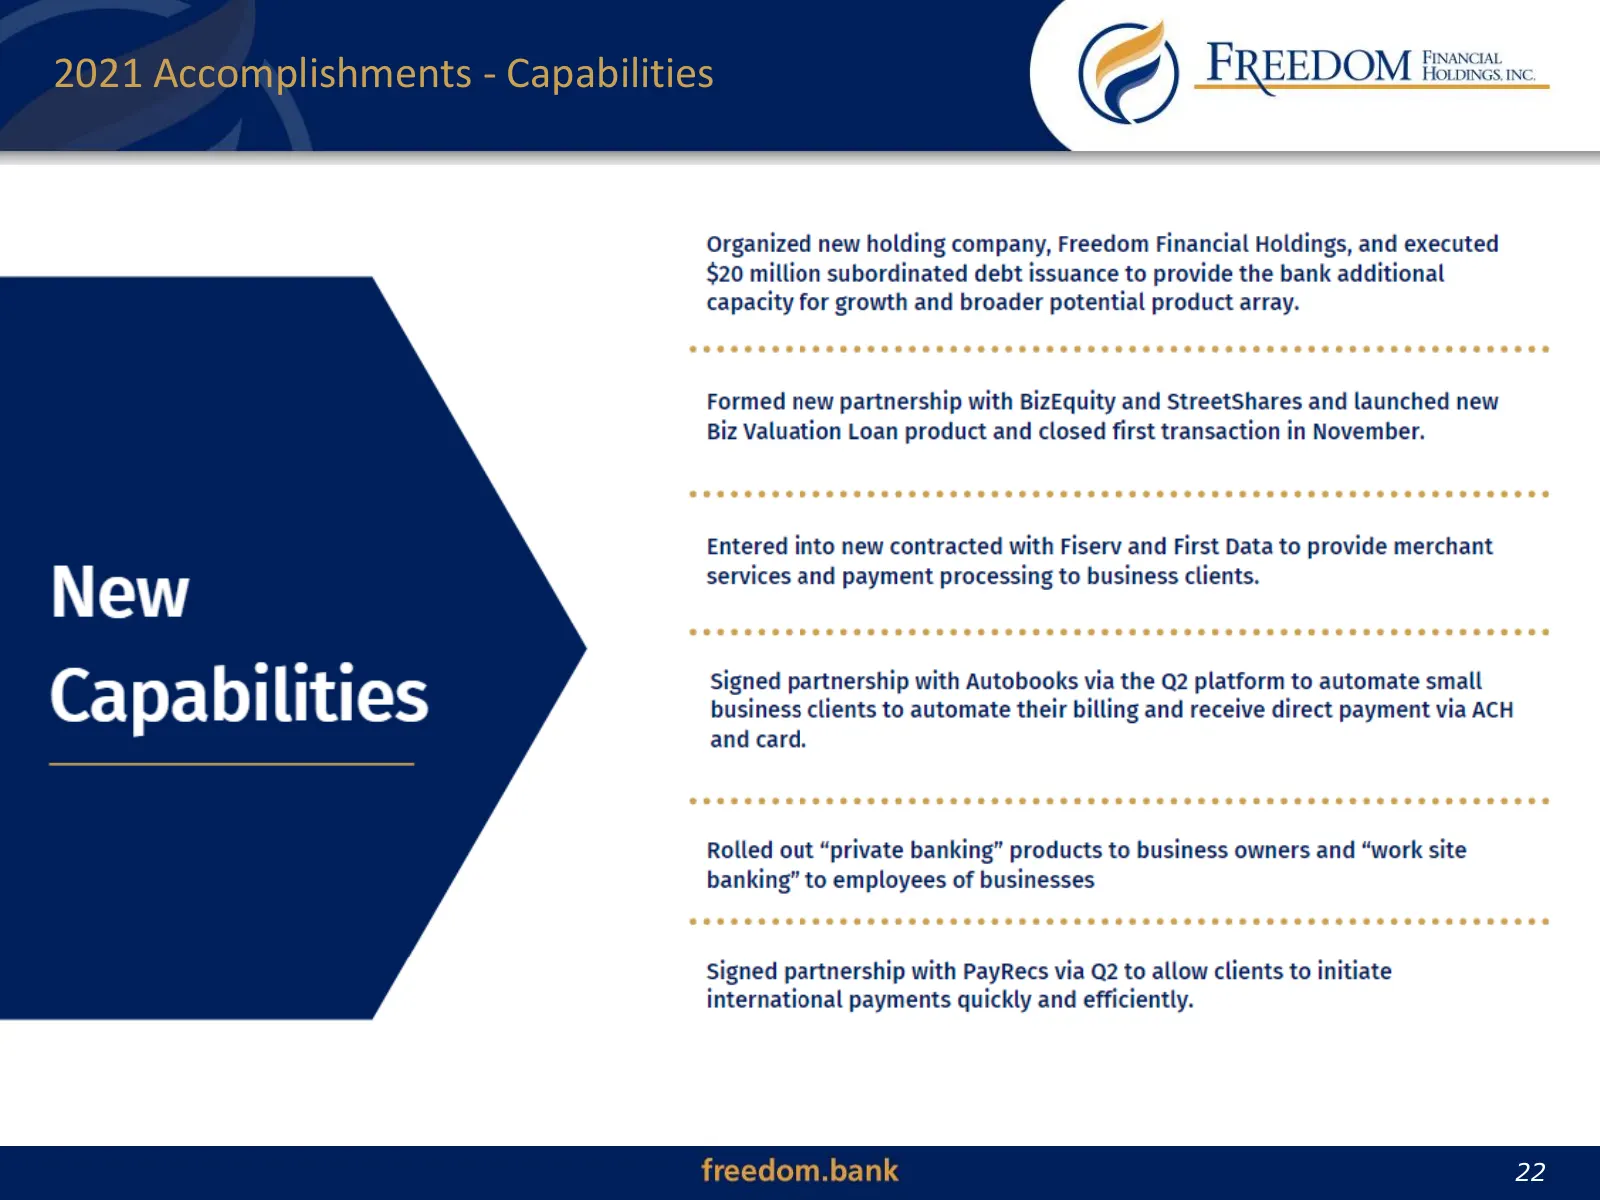
Slide 22: 2021 Accomplishments - Capabilities
2021 Accomplishments - Capabilities 22 22
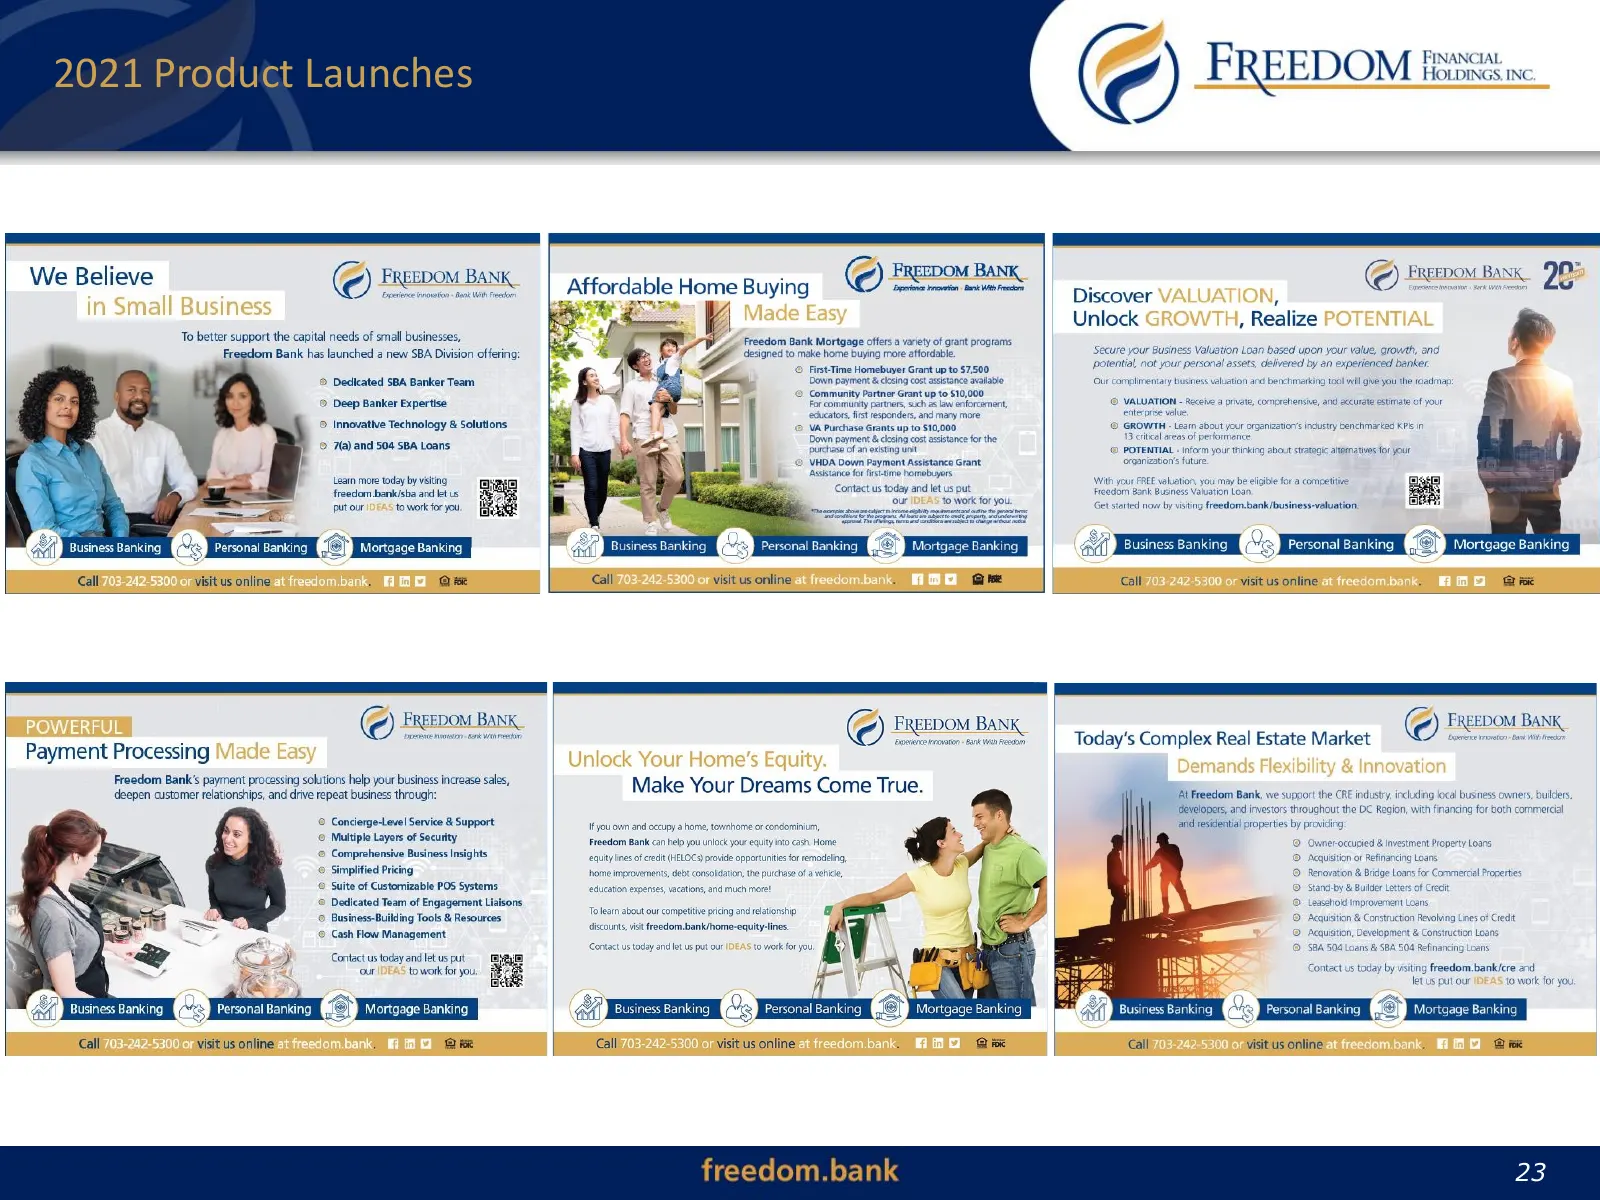
Slide 23: 2021 Product Launches
2021 Product Launches We Believe © FREEDOM BANK To better support the capital needs of small businesses, Freedom Bank has launched a new SBA Division offering © Dedicated SBA Banker Team > Deep Banker Expertise © Innovative Technology & Solutions > 7(a) and 508 SBA Loans Lean more today by ving free
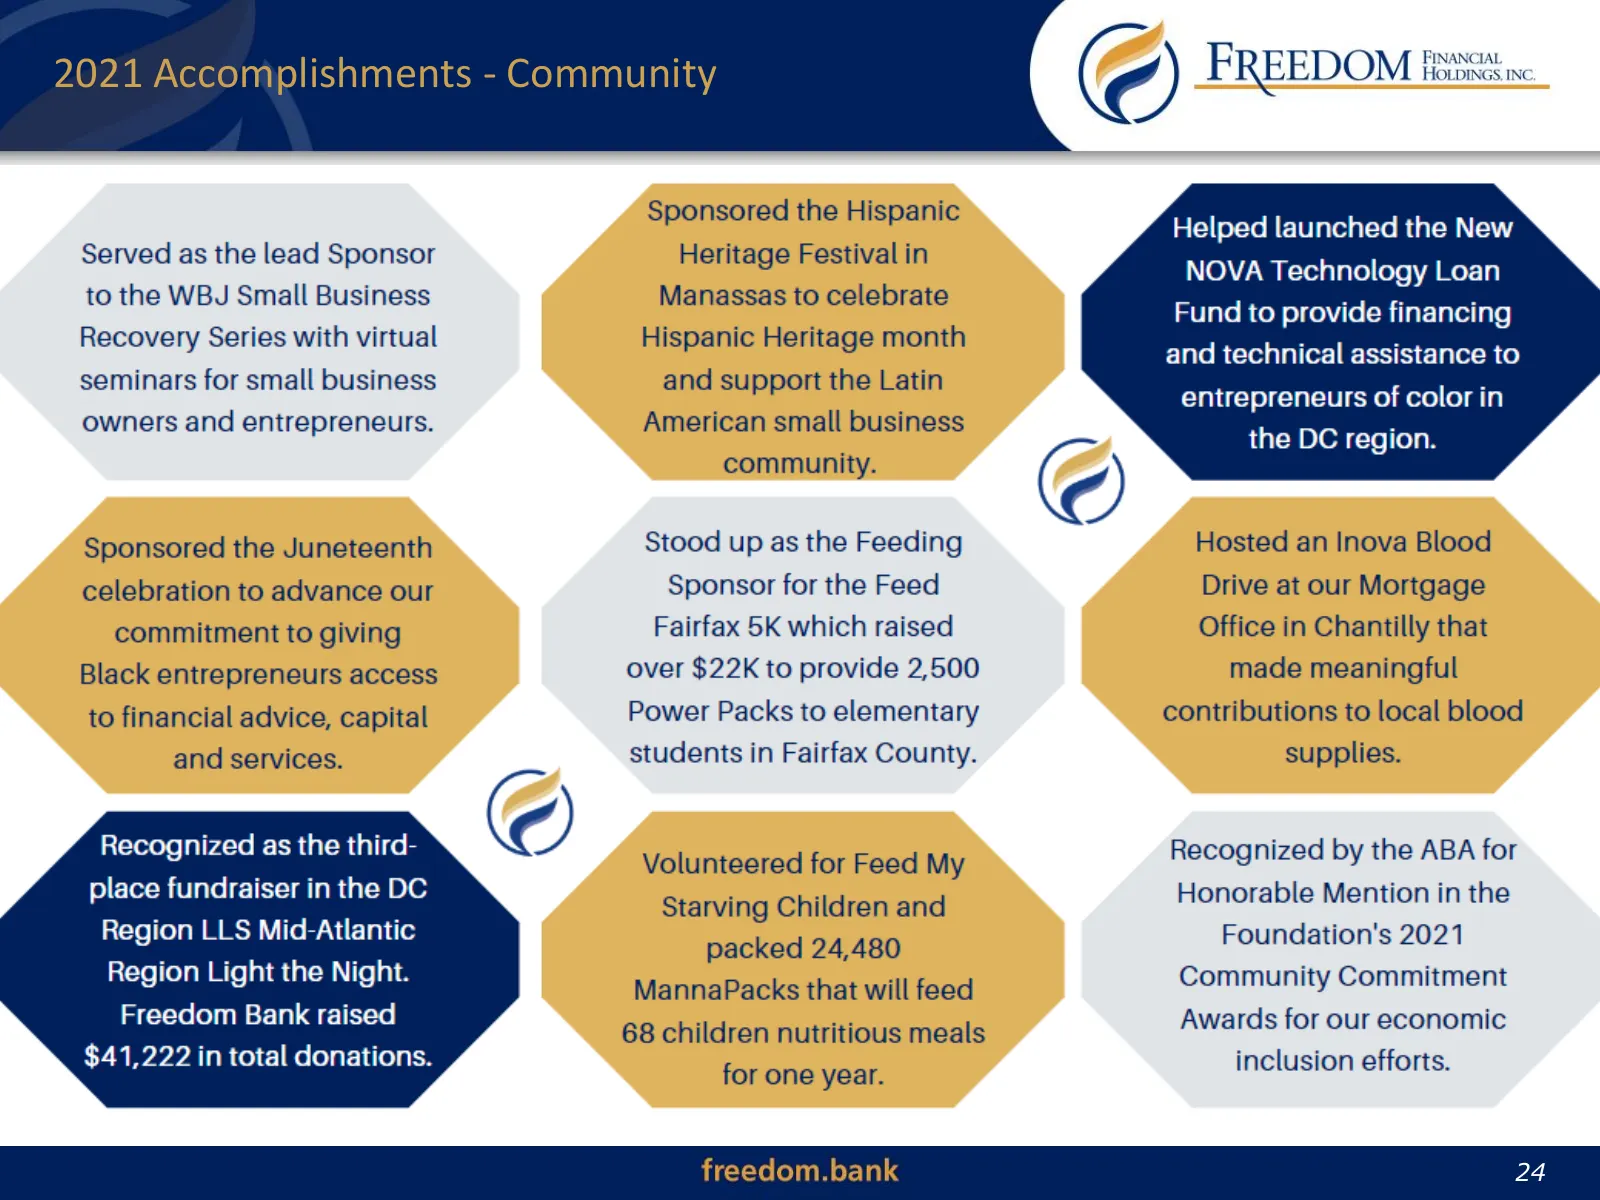
Slide 24: 2021 Accomplishments - Community
2021 Accomplishments - Community 24 24
Slide 25: 2021 Community Events
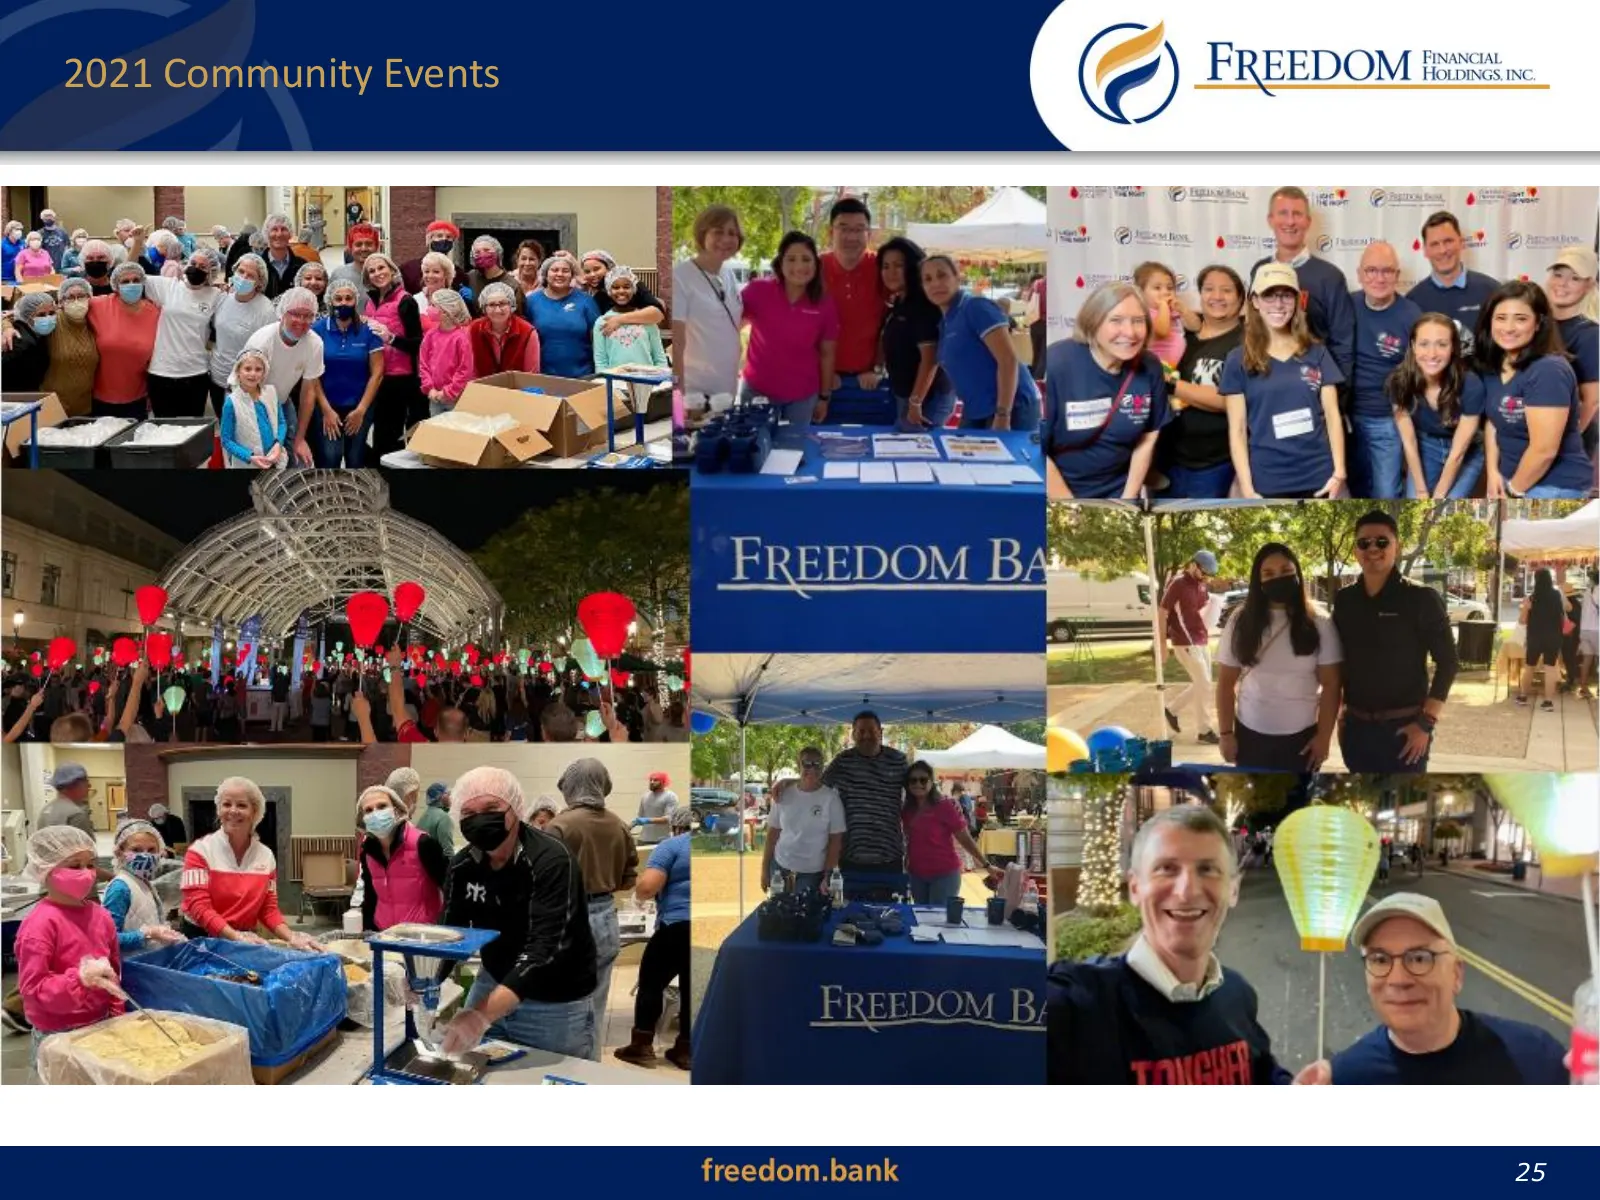
2021 Community Events 25 25
Slide 26: Marketing Milestones
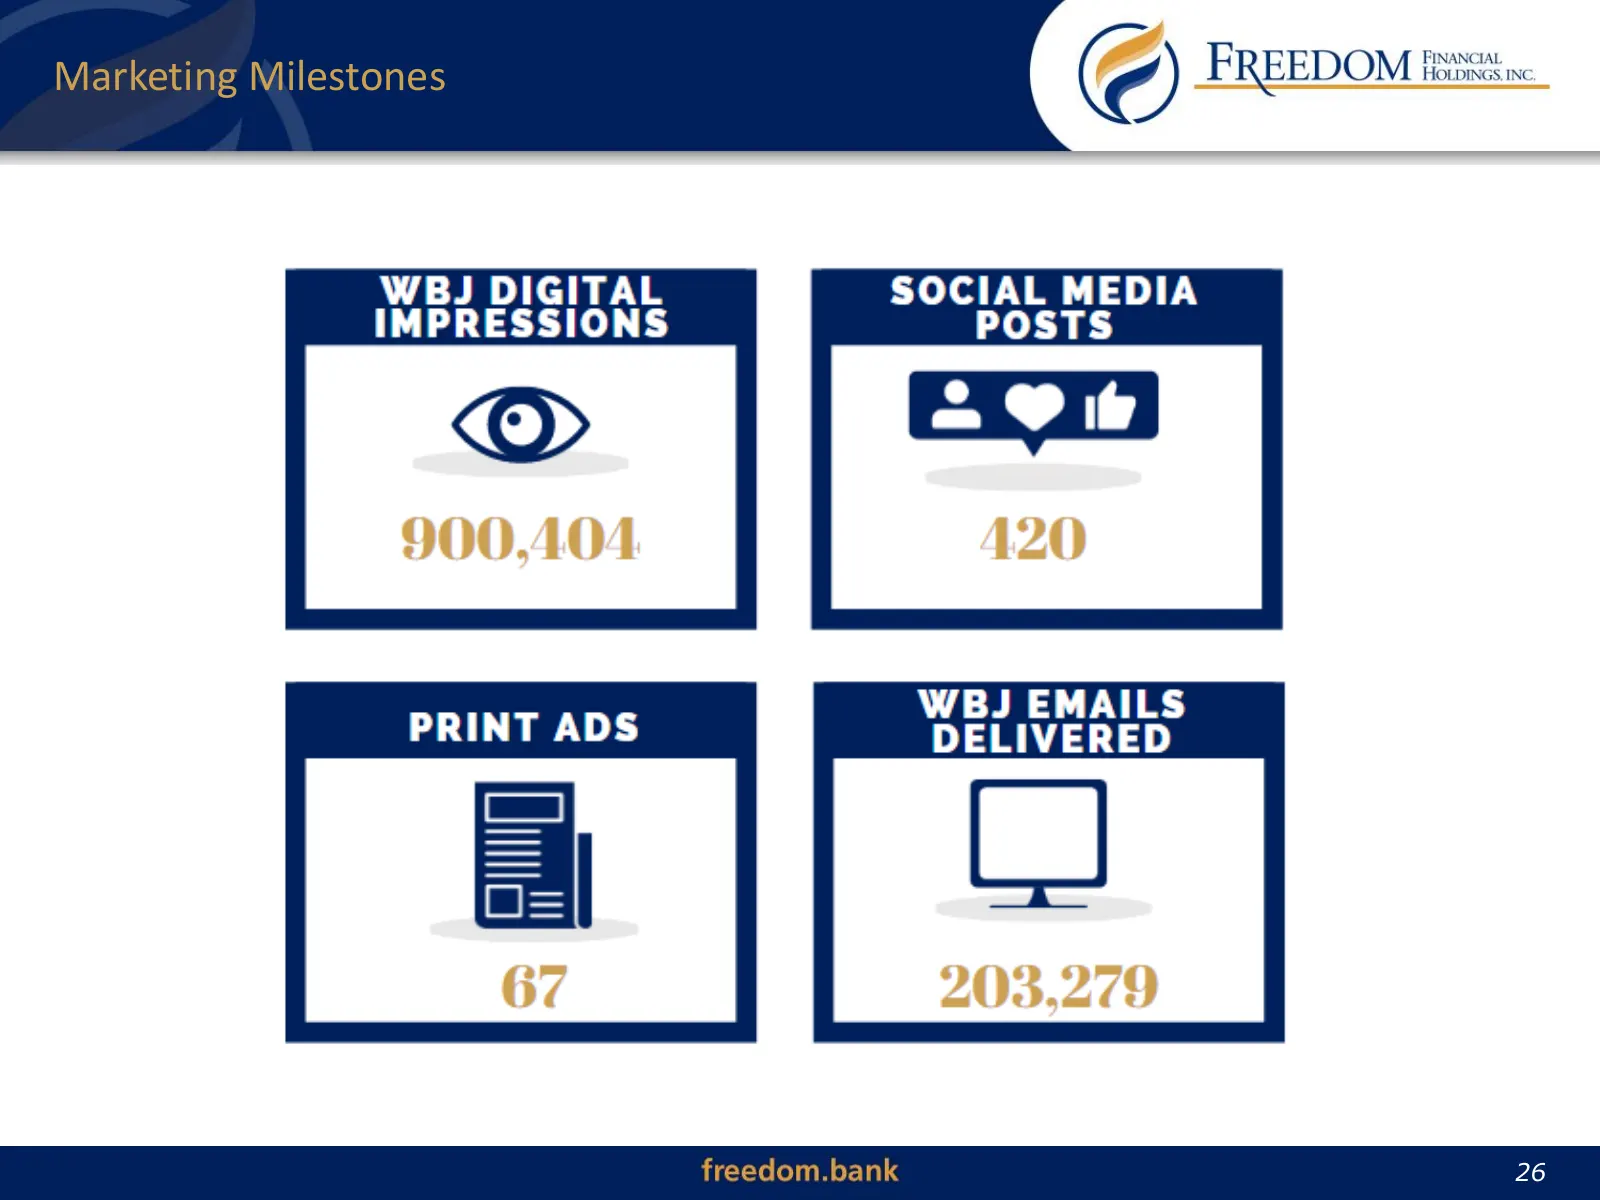
Marketing Milestones ©) FREEDOM HOLDINGS Ne WBJ EMAILS PRINT ADS DELIVERED freedom.bank
Slide 27: Q4 and FY 2021 Financial Results
Q4 and FY 2021 Financial Results 27
Slide 28: Summary of Income Statements
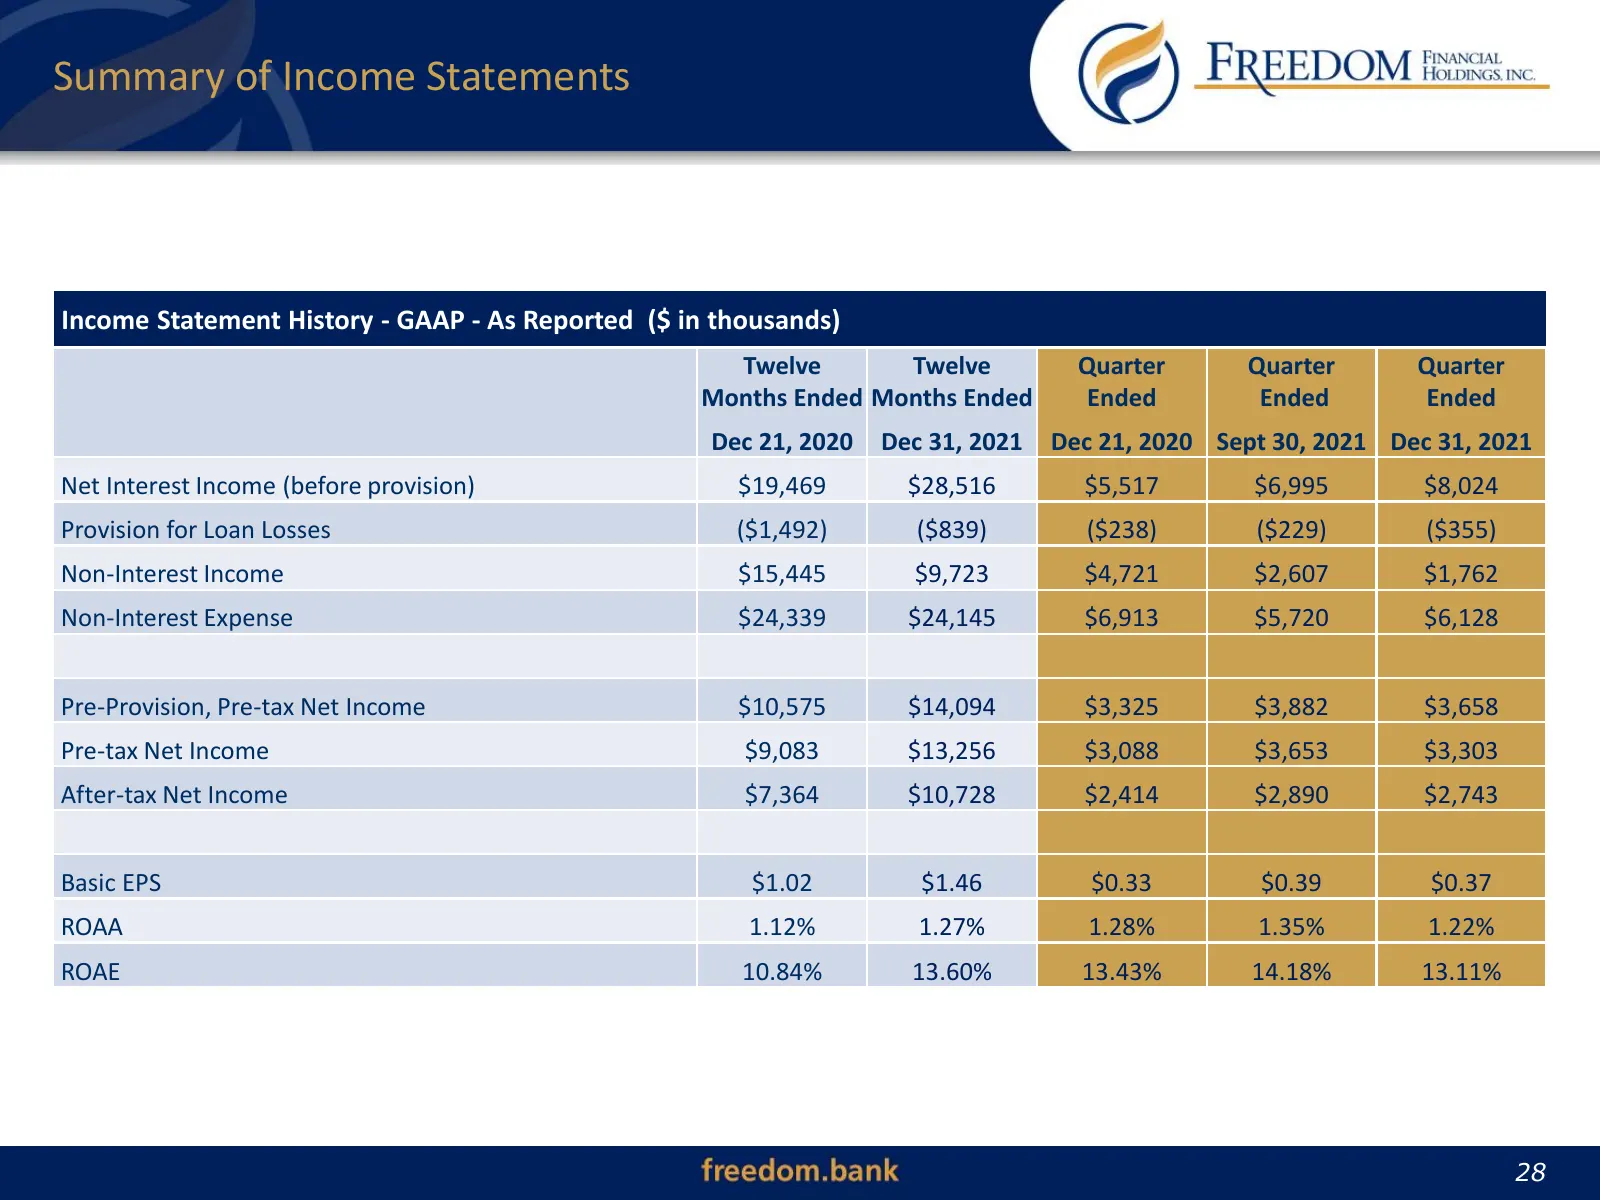
Summary of Income Statements Income Statement History - GAAP - As Reported ($ in thousands) Twelve Twelve Quarter Quarter Quarter Months Ended Months Ended Ended Ended Ended Dec 21, 2020 Dec 31, 2021 Dec 21, 2020 Sept 30, 2021 Dec 31, 2021 Net Interest Income (before provision) $19,469 $28,516 $5,51
Slide 29: Summary of Balance Sheets
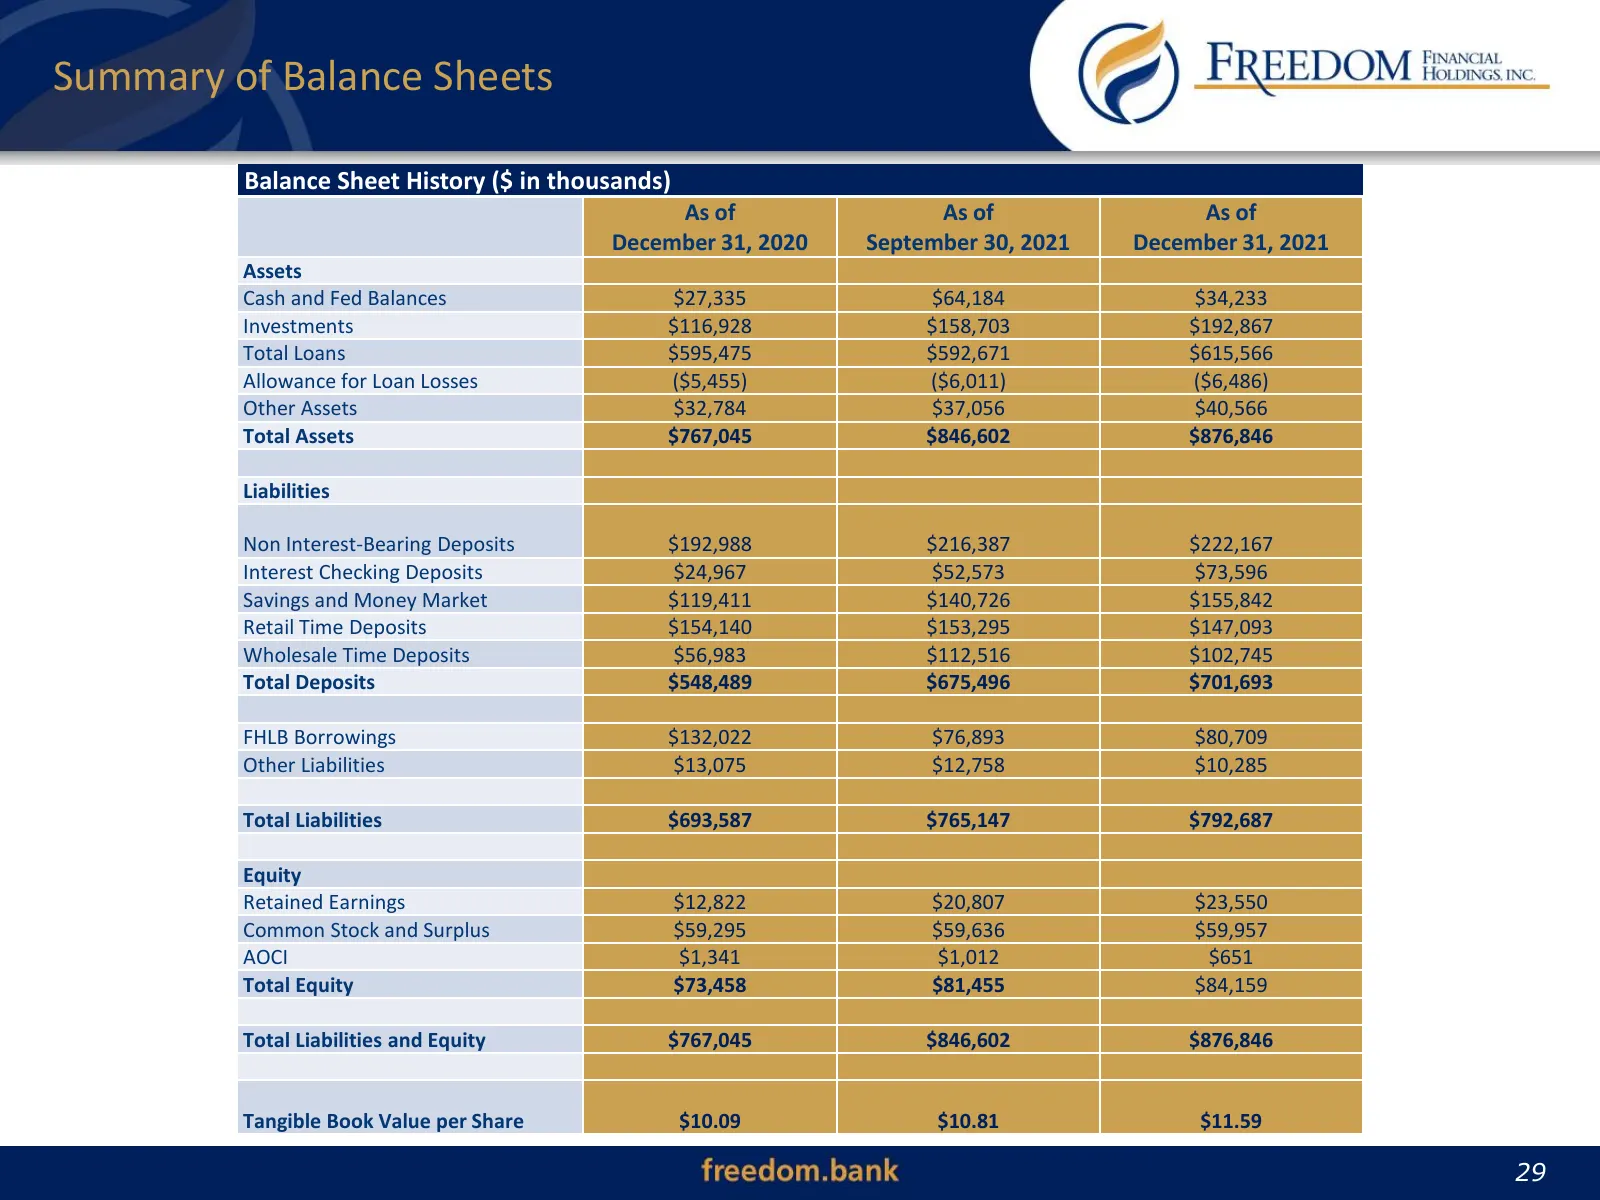
Summary of Balance Sheets Balance Sheet History ($ in thousands) As of As of As of December 31, 2020 September 30, 2021 December 31, 2021 Assets Cash and Fed Balances $27,335 $64,184 $34,233 Investments $116,928 $158,703 $192,867 Total Loans $595,475 $592,671 $615,566 Allowance for Loan Losses ($5,4
Slide 30: Rising Loan Yields and Lower Cost of Funds Push NIM Higher
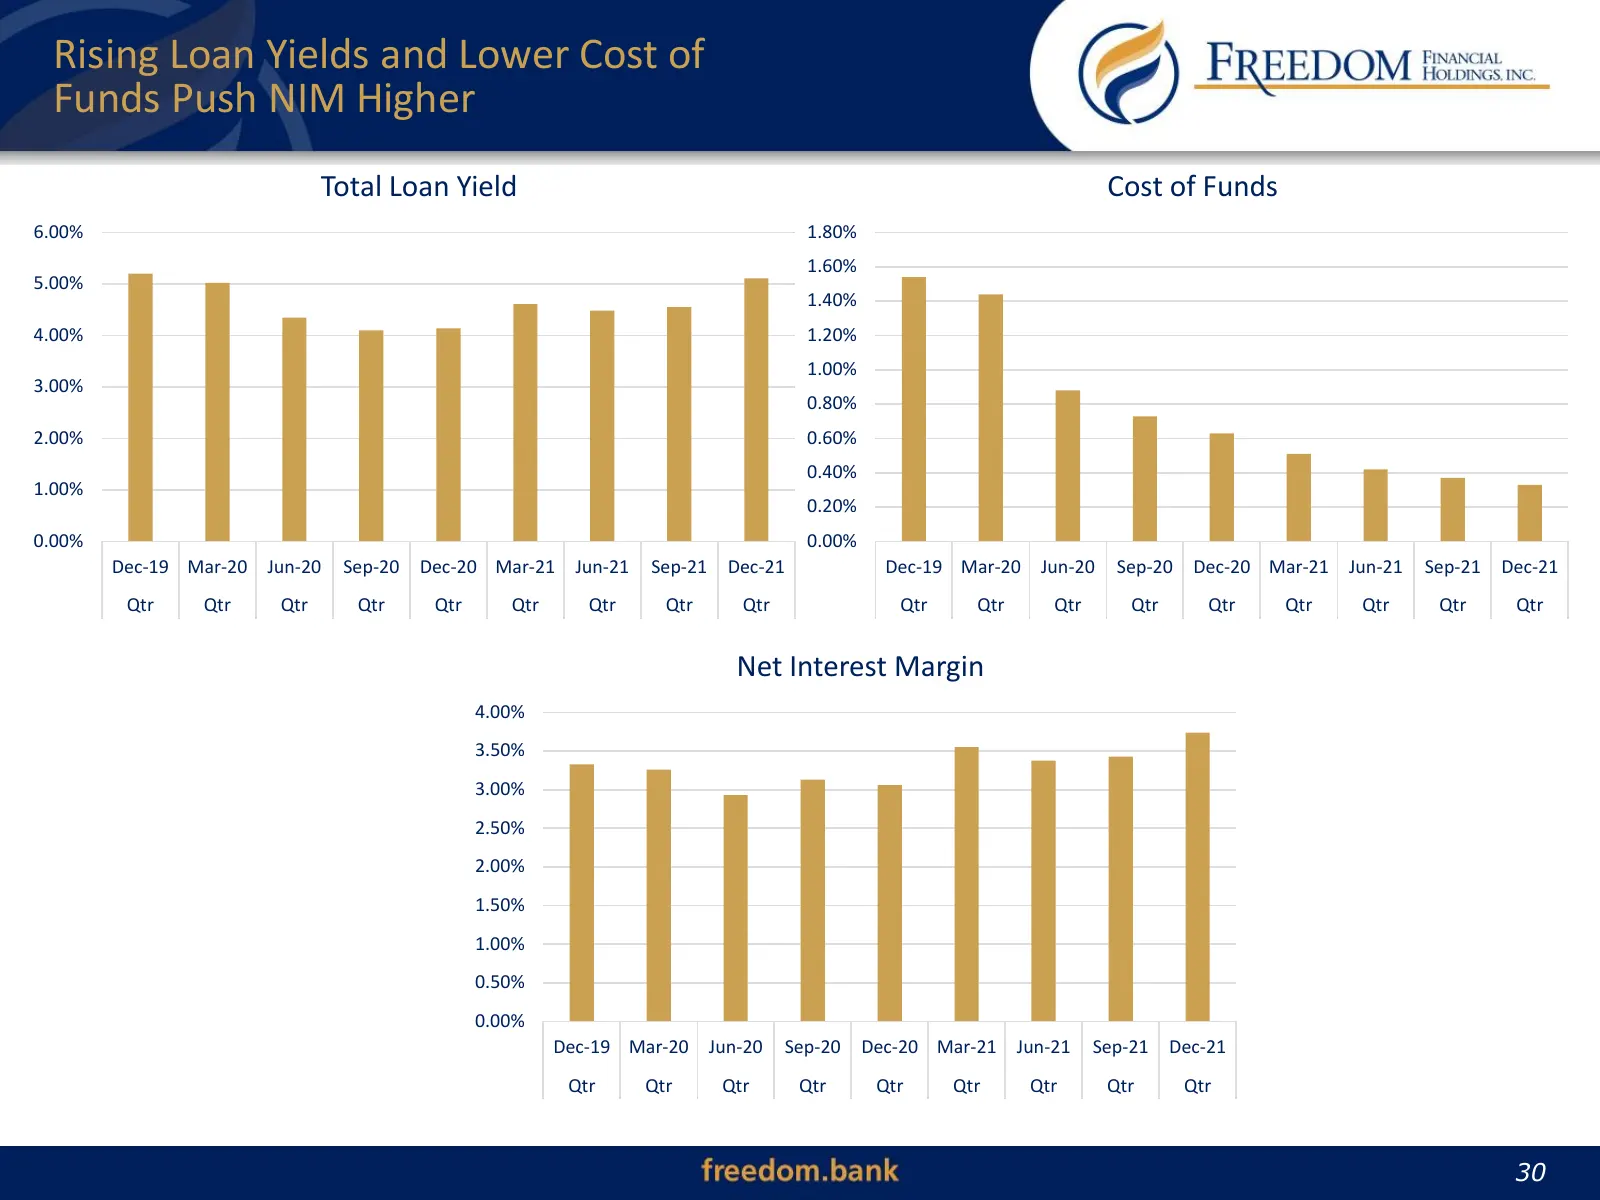
Rising Loan Yields and Lower Cost of Funds Push NIM Higher Total Loan Yield Cost of Funds 6.00% 1.80% 1.60% 5.00% 1.40% 4.00% 1.20% 1.00% 3.00% 0.80% 2.00% 0.60% 0.40% 1.00% 0.20% 0.00% 0.00% Dec-19 Mar-20 Jun-20 Sep-20 Dec-20 Mar-21 Jun-21 Sep-21 Dec-21 Dec-19 Mar-20 Jun-20 Sep-20 Dec-20 Mar-21 Jun
Slide 31: Fee Revenues and Improved Efficiency Drive EPS Increases
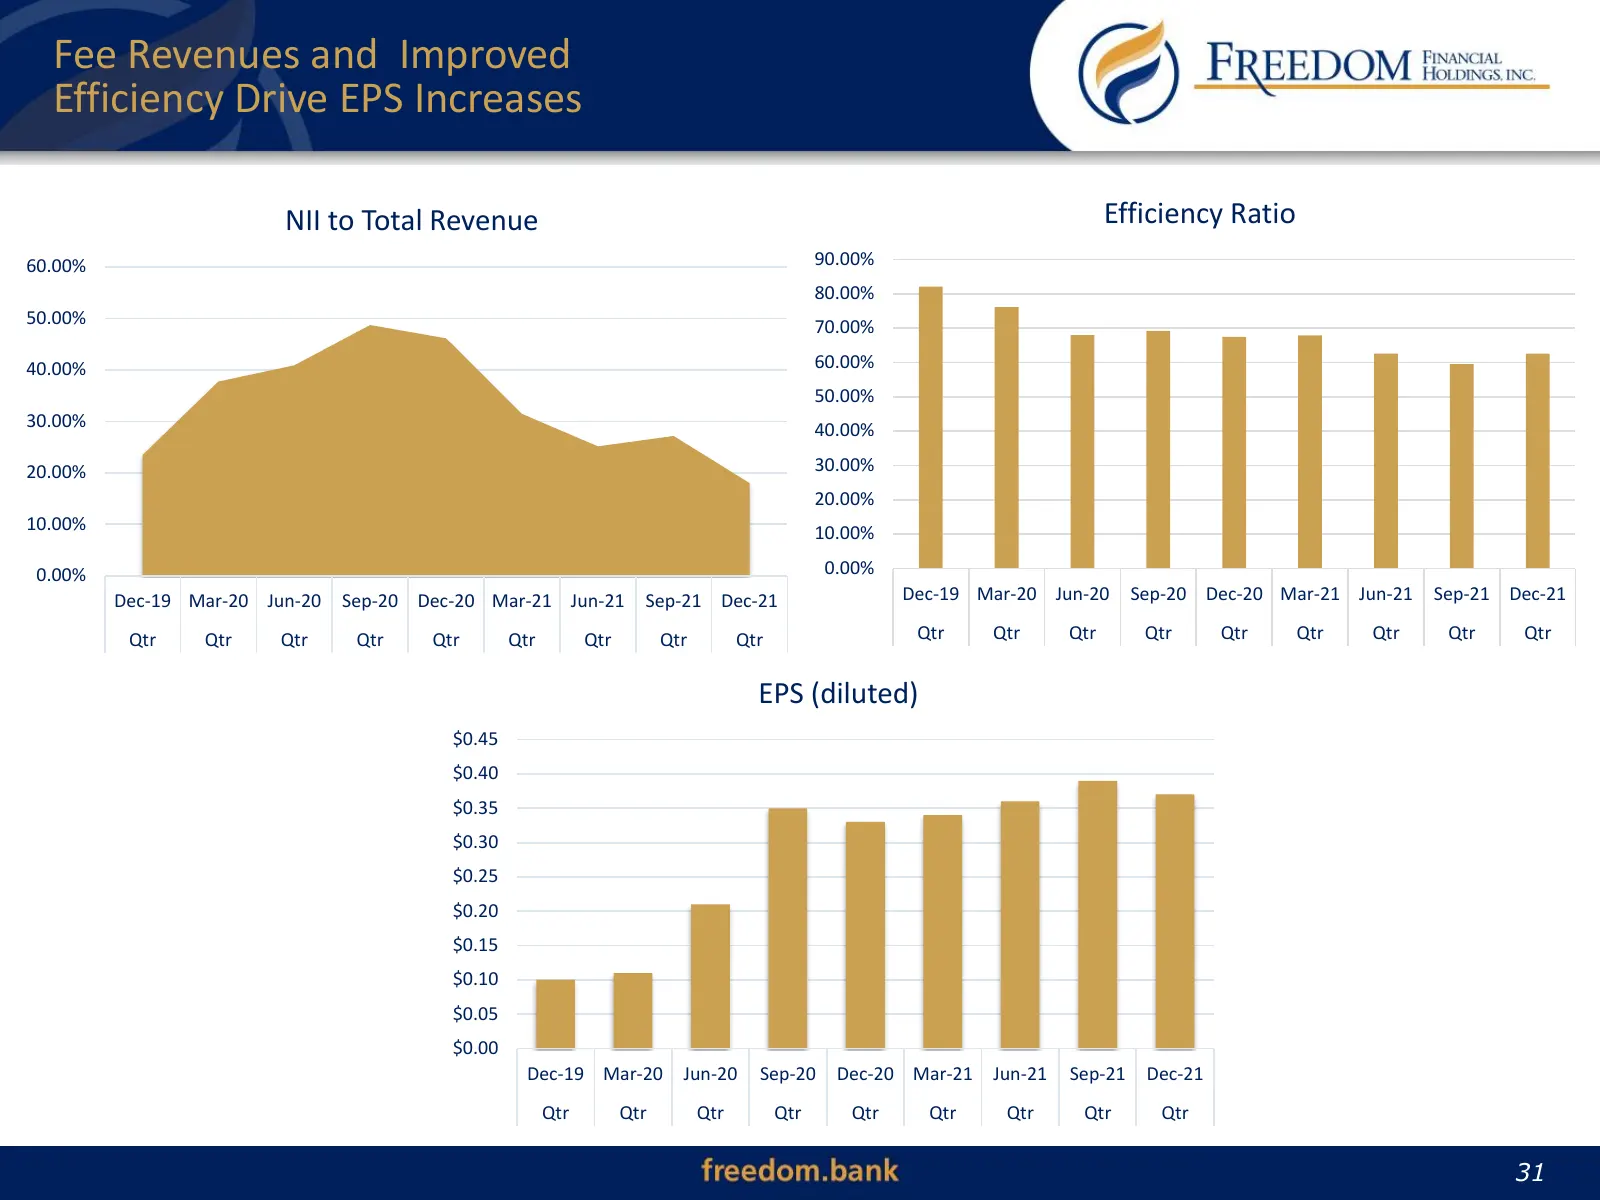
Fee Revenues and Improved Efficiency Drive EPS Increases NII to Total Revenue Efficiency Ratio 60.00% 90.00% 80.00% 50.00% 70.00% 40.00% 60.00% 50.00% 30.00% 40.00% 20.00% 30.00% 20.00% 10.00% 10.00% 0.00% 0.00% Dec-19 Mar-20 Jun-20 Sep-20 Dec-20 Mar-21 Jun-21 Sep-21 Dec-21 Dec-19 Mar-20 Jun-20 Sep-
Slide 32: Improving ROA & ROE Build Tangible Book Value per Share
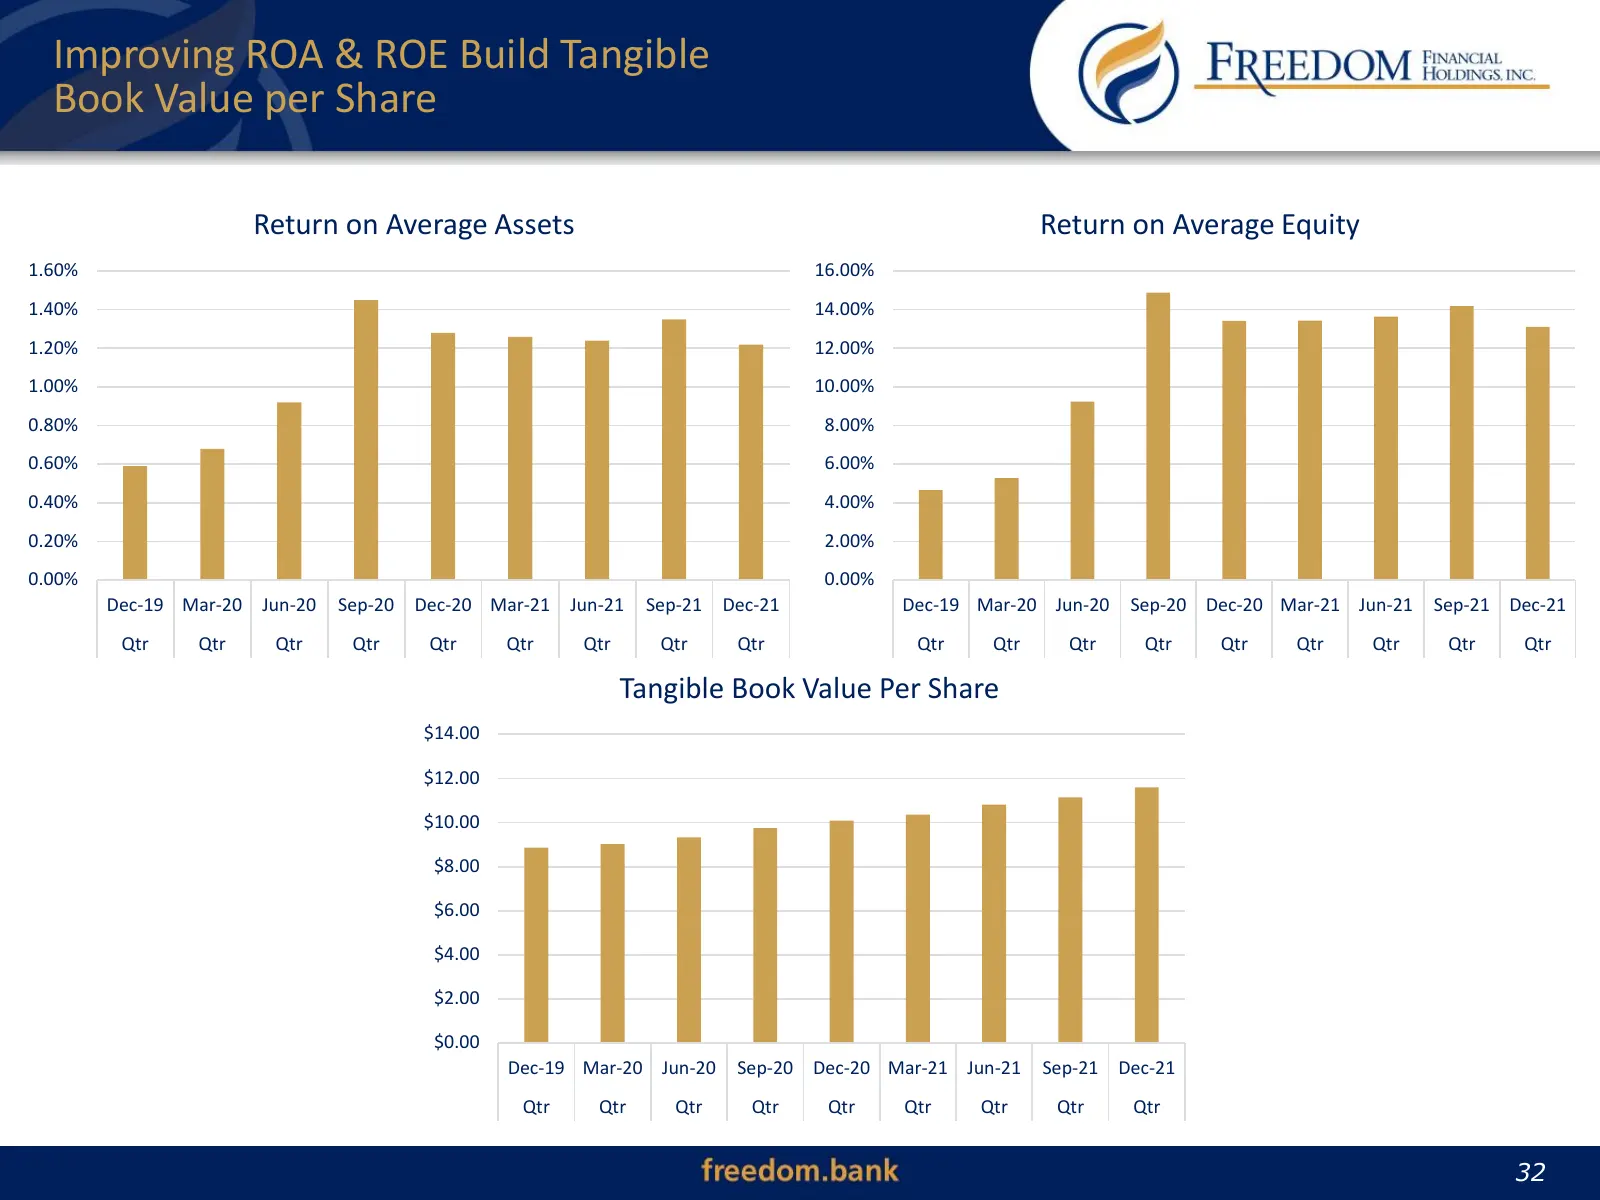
Improving ROA & ROE Build Tangible Book Value per Share Return on Average Assets Return on Average Equity 1.60% 16.00% 1.40% 14.00% 1.20% 12.00% 1.00% 10.00% 0.80% 8.00% 0.60% 6.00% 0.40% 4.00% 0.20% 2.00% 0.00% 0.00% Dec-19 Mar-20 Jun-20 Sep-20 Dec-20 Mar-21 Jun-21 Sep-21 Dec-21 Dec-19 Mar-20 Jun-2
Slide 33: Core Deposit Mix
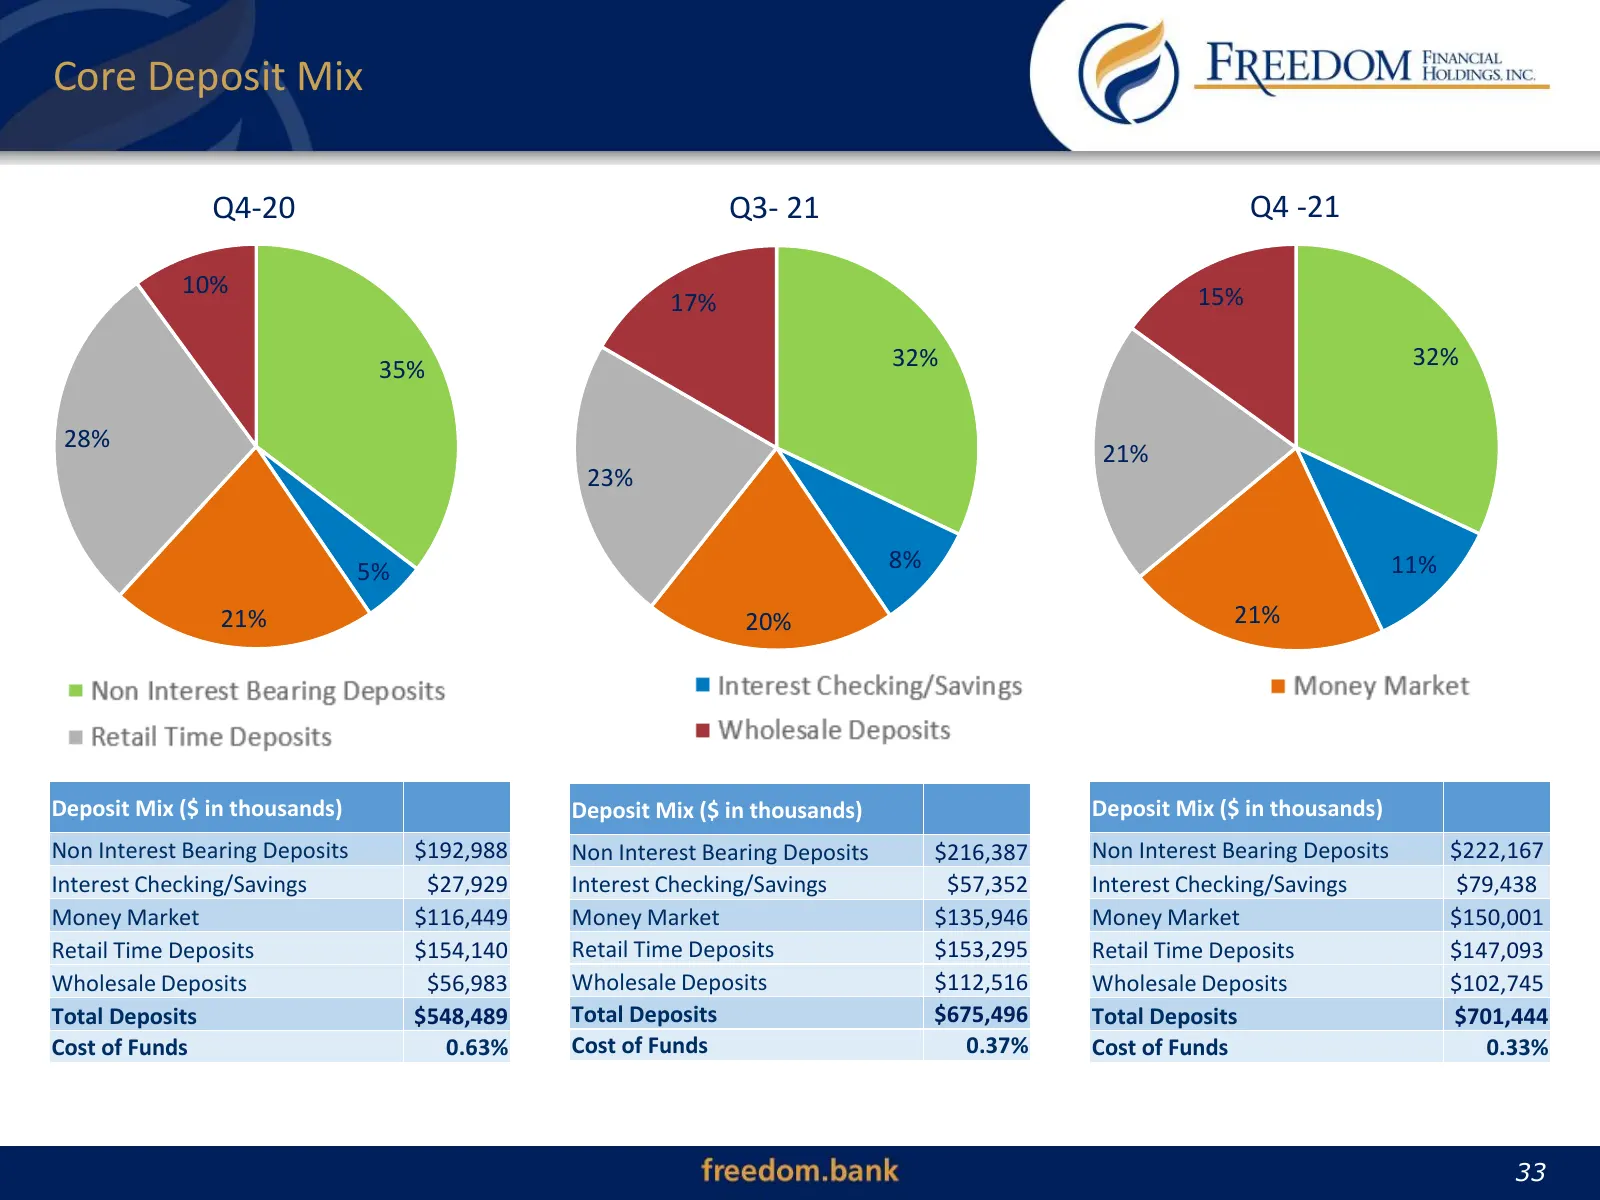
Core Deposit Mix Q4-20 Q3- 21 Q4 -21 10% 15% 17% 32% 32% 35% 28% 21% 23% 5% 8% 11% 21% 20% 21% Deposit Mix ($ in thousands) Deposit Mix ($ in thousands) Deposit Mix ($ in thousands) Non Interest Bearing Deposits $192,988 Non Interest Bearing Deposits $216,387 Non Interest Bearing Deposits $222,167 I
Slide 34: Organic Loan Mix
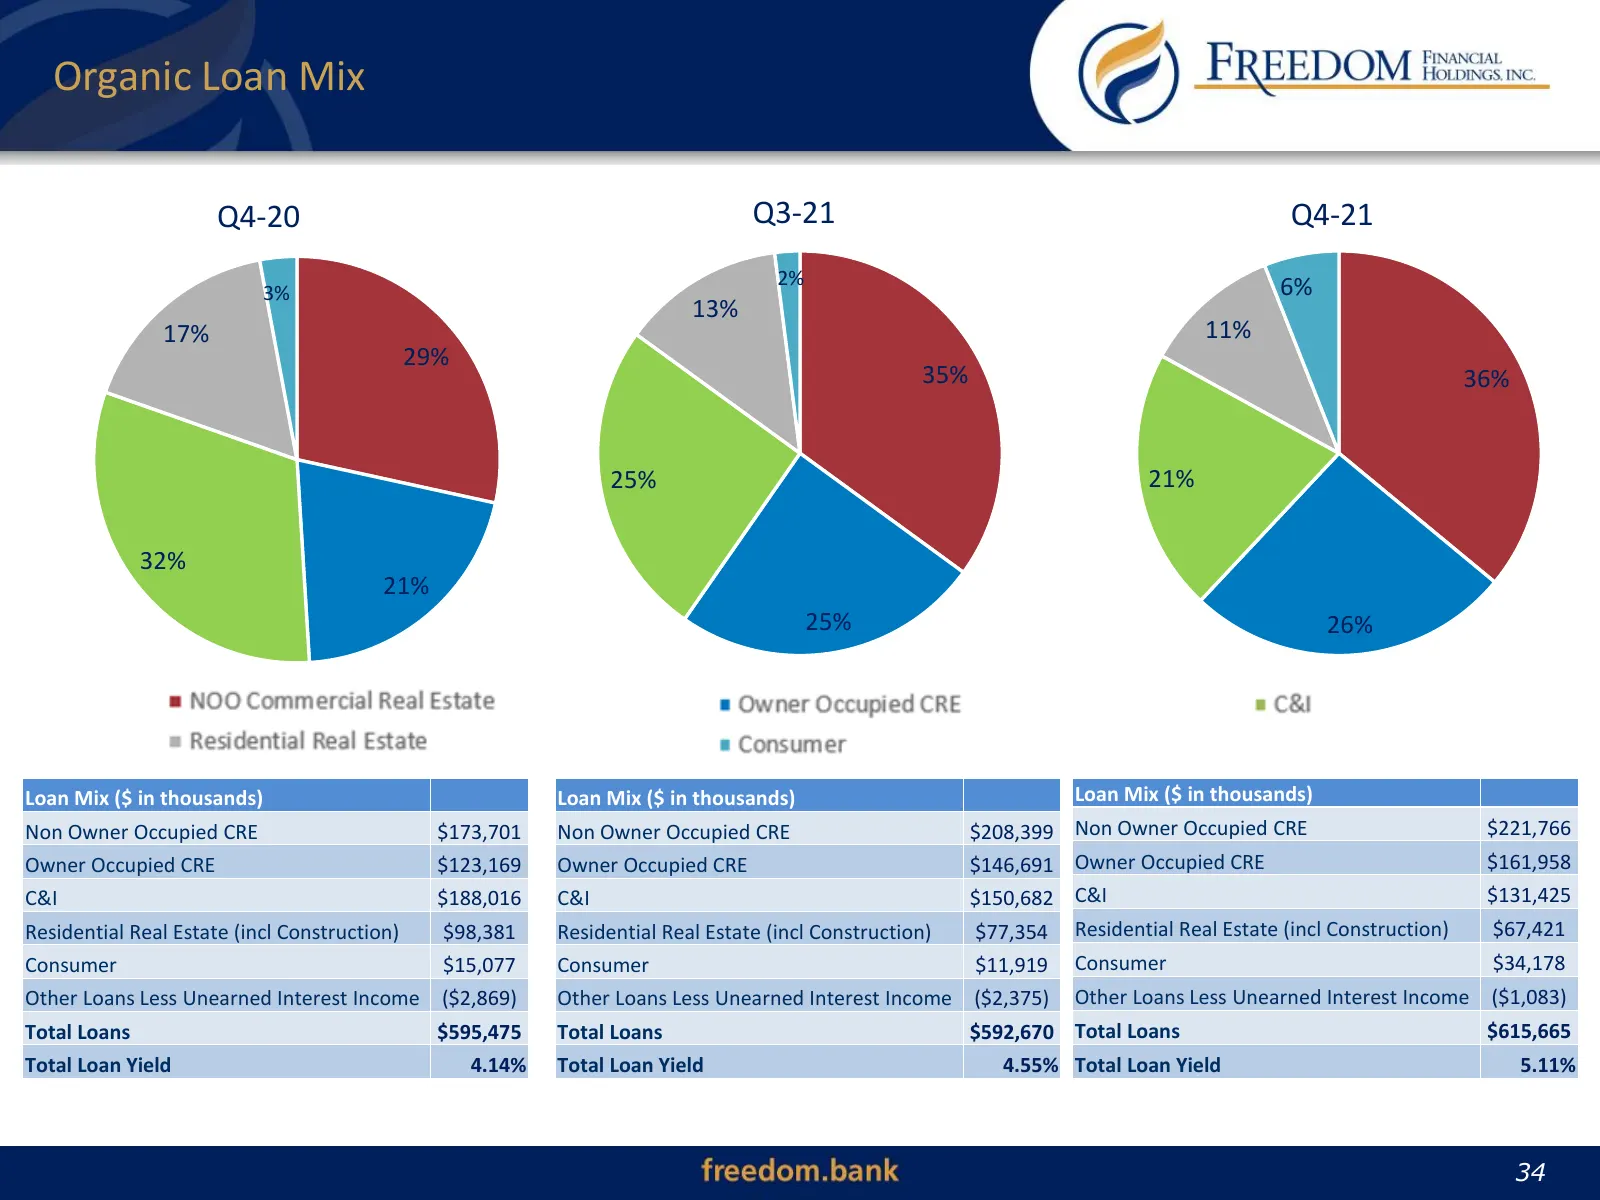
Organic Loan Mix Q4-20 Q3-21 Q4-21 2% 6% 3% 13% 17% 11% 29% 35% 36% 25% 21% 32% 21% 25% 26% Loan Mix ($ in thousands) Loan Mix ($ in thousands) Loan Mix ($ in thousands) Non Owner Occupied CRE $173,701 Non Owner Occupied CRE $208,399 Non Owner Occupied CRE $221,766 Owner Occupied CRE $123,169 Owner
Slide 35: Investment Summary
Investment Summary 35
Slide 36: Vision and Values
Vision and Values VISION • Provide compelling ideas, relevant financial products, and exceptional service to our clients in the way they wish to be served. • Focus on building lead relationships with businesses, real estate owners, and professionals with sales offices across Northern Virginia/DC MSA
Slide 37: Investing in our Strategic Plan
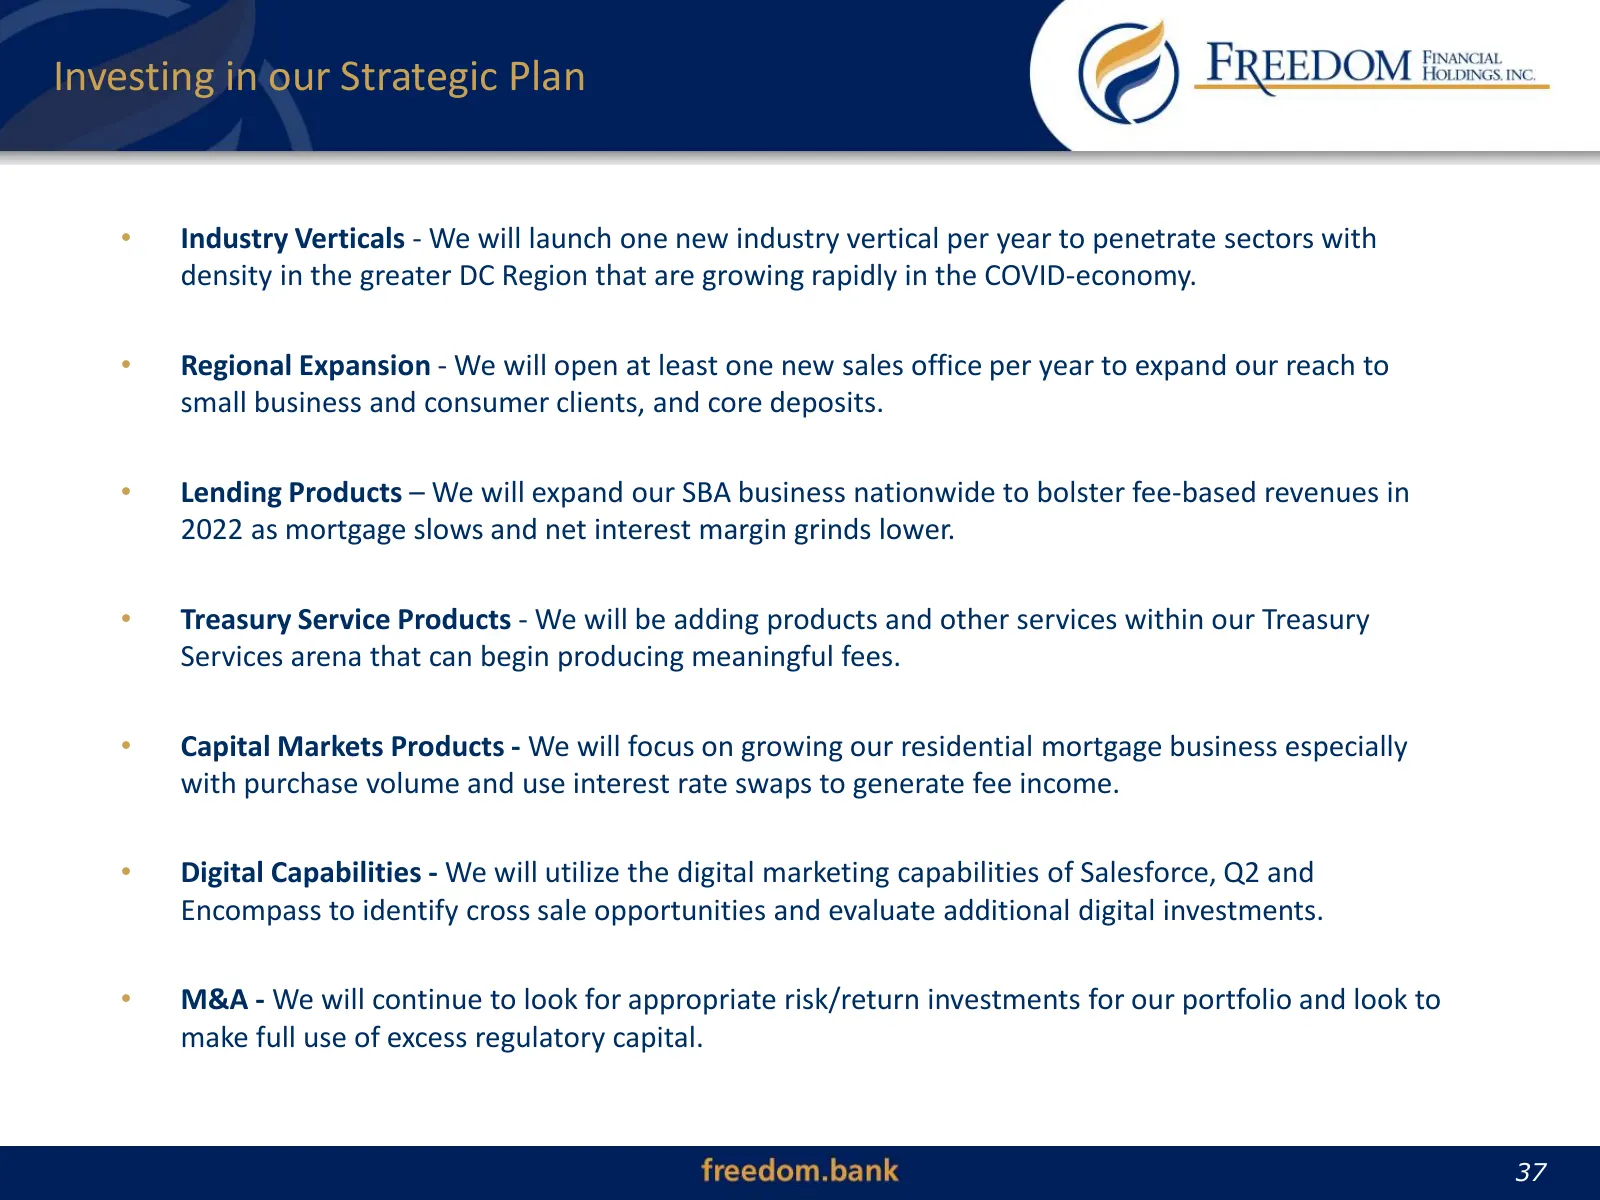
Investing in our Strategic Plan • Industry Verticals - We will launch one new industry vertical per year to penetrate sectors with density in the greater DC Region that are growing rapidly in the COVID-economy. • Regional Expansion - We will open at least one new sales office per year to expand our
Slide 38: Driving Improved Performance
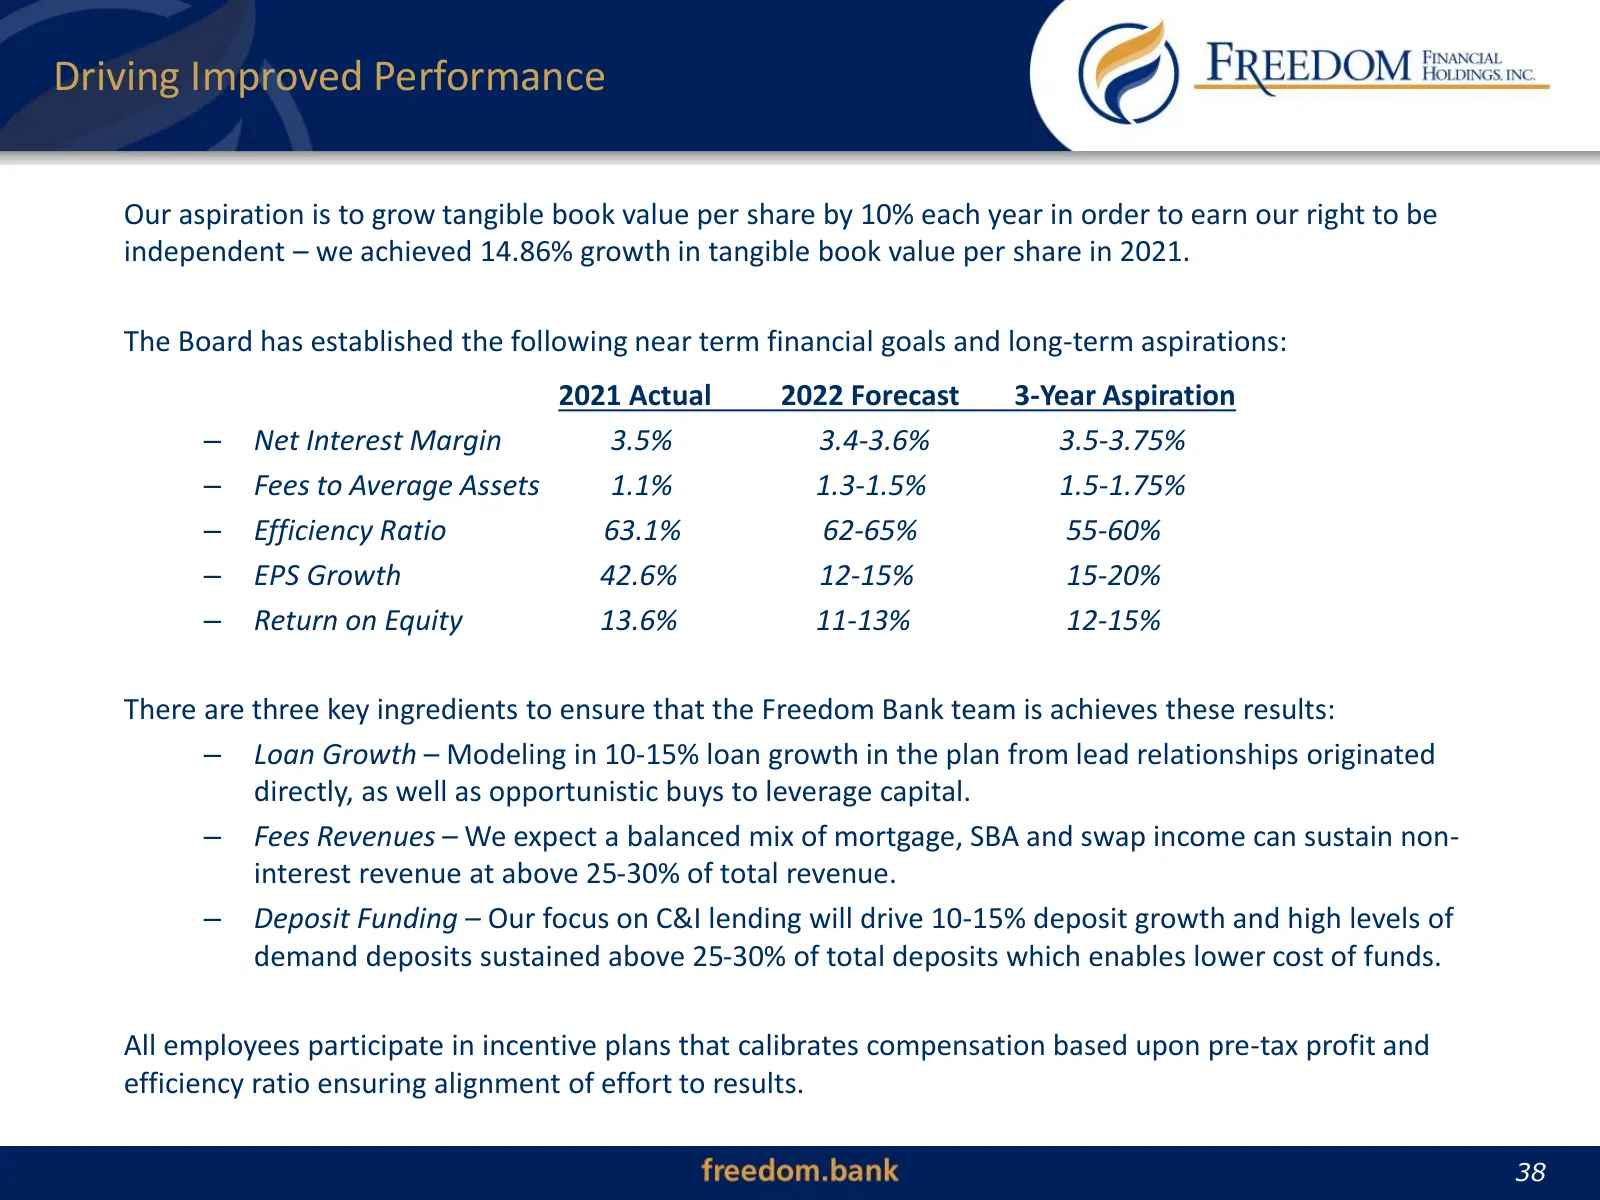
Driving Improved Performance Our aspiration is to grow tangible book value per share by 10% each year in order to earn our right to be independent – we achieved 14.86% growth in tangible book value per share in 2021. The Board has established the following near term financial goals and long-term asp
Slide 39: Summary of Corporate Attributes
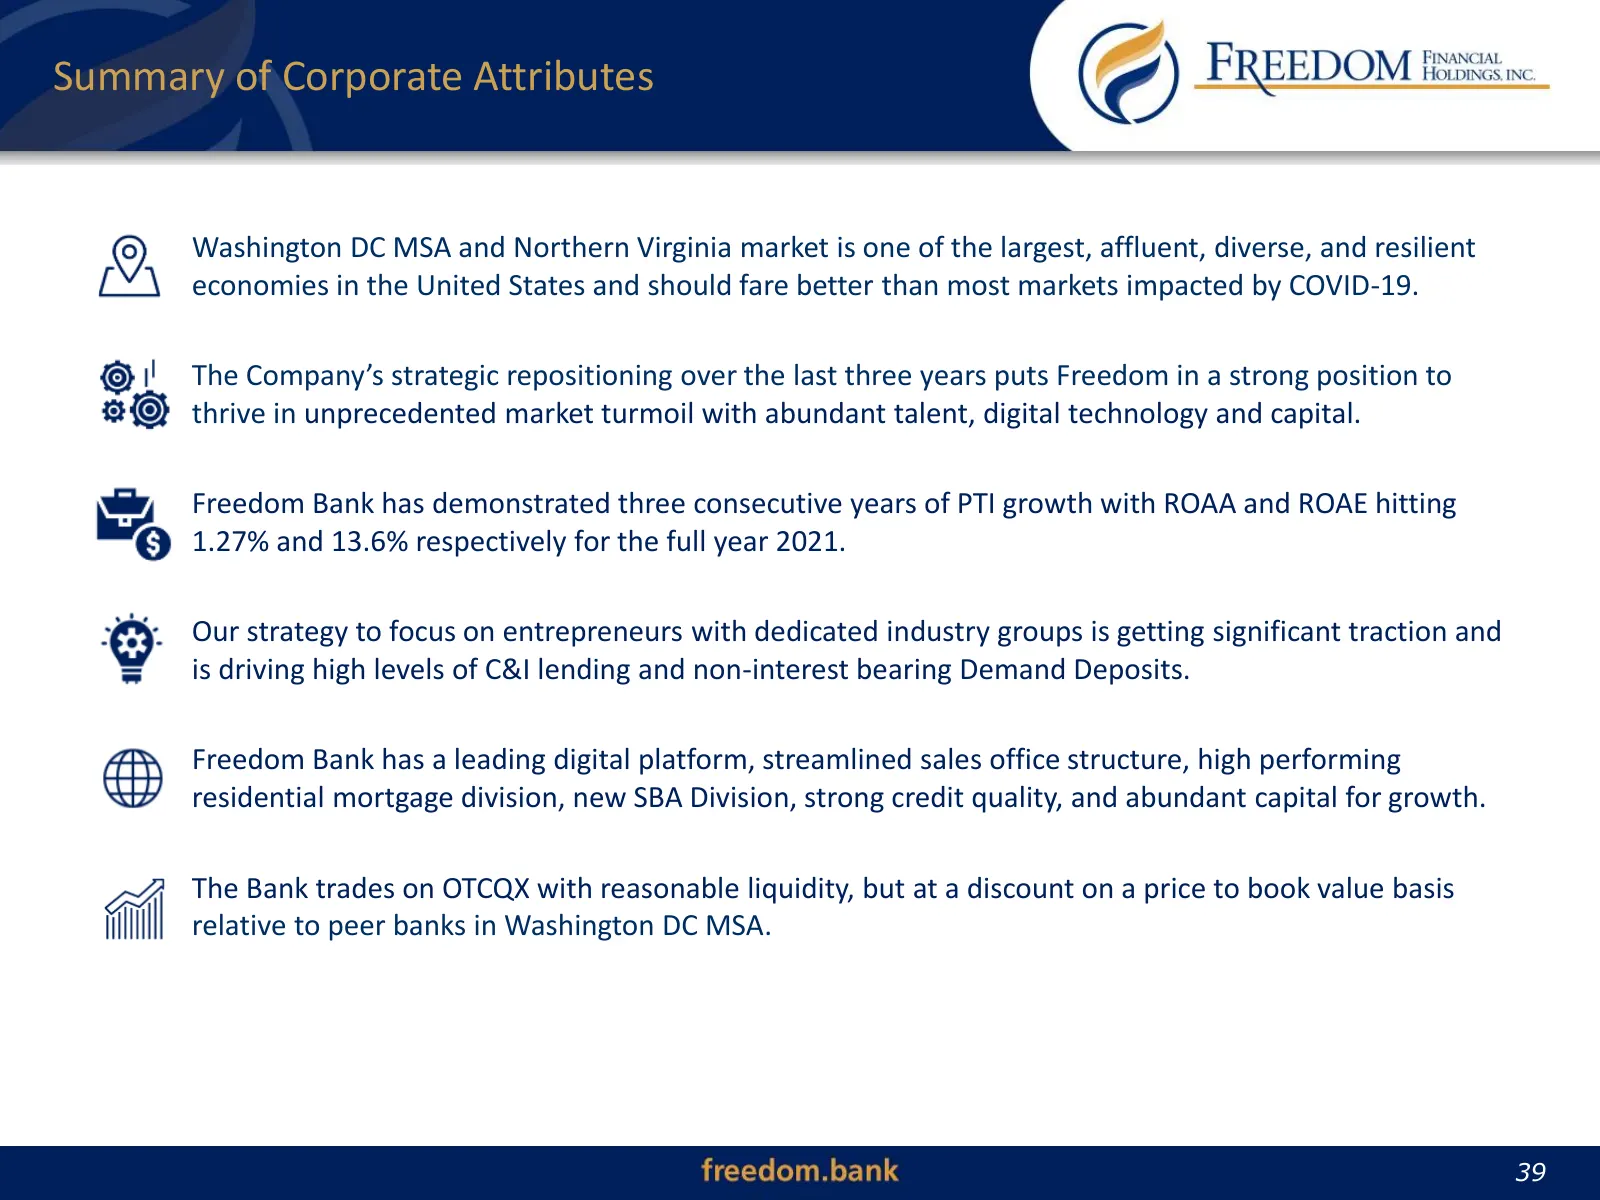
Summary of Corporate Attributes Washington DC MSA and Northern Virginia market is one of the largest, affluent, diverse, and resilient economies in the United States and should fare better than most markets impacted by COVID-19. The Company’s strategic repositioning over the last three years puts Fr
Slide 40: Building Shareholder Value
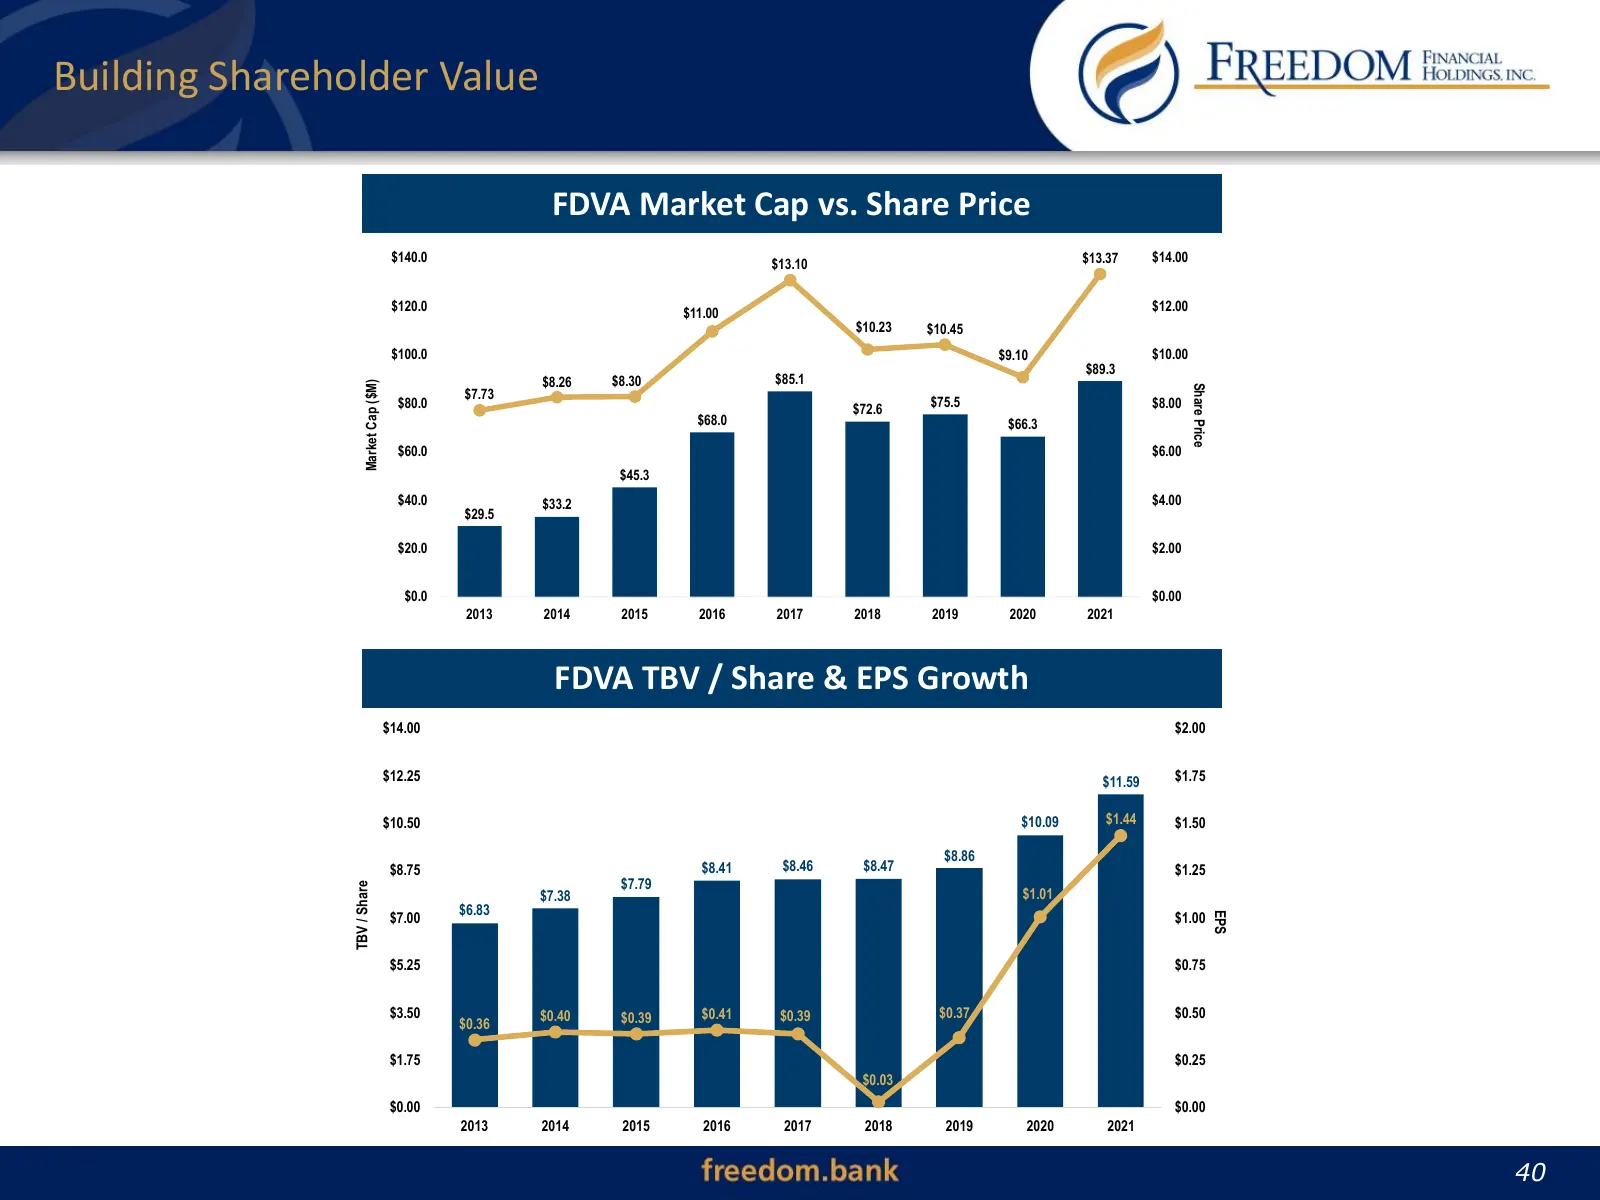
Building Shareholder Value FDVA Market Cap vs. Share Price $140.0 $13.10 $13.37 $14.00 $120.0 $12.00 $11.00 $10.23 $10.45 $100.0 $9.10 $10.00 $89.3 $8.26 $8.30 $85.1 Market Cap ($M) Share Price $7.73 $80.0 $72.6 $75.5 $8.00 $68.0 $66.3 $60.0 $6.00 $45.3 $40.0 $33.2 $4.00 $29.5 $20.0 $2.00 $0.0 $0.00
Slide 41: Contact Information
Contact Information Joseph J. Thomas, CFA President and CEO [email protected] 703-667-4161 10555 Main Street, Suite 600 Fairfax, VA 22030 41 41
Source: company website
More decks from Freedom Financial Holdings Inc
 Q3 2026 Earnings Presentation32 slides · Nov 3, 2026
 Q2 2026 Earnings Presentation31 slides · Aug 3, 2026
 Shareholder Meeting (April 2026)41 slides · Apr 30, 2026
 Q4 2025 Earnings Presentation39 slides · Jan 30, 2026
 Q3 2025 Earnings Presentation39 slides · Oct 31, 2025
 Q2 2025 Earnings Presentation38 slides · Aug 4, 2025