Freedom Financial Holdings Inc · OTC:FDVA
Freedom Financial — Q3 2026 Earnings Presentation
32 slides from Freedom Financial's earnings presentation, Nov 3, 2026
Slide 1: Investor Presentation Q3 2026 Update
INVESTOR PRESENTATION Q3 2026 Update November 3, 2026 Joseph J. Thomas President & Chief Executive Officer Scott B. Clark SEVP & Chief Financial Officer O TC Q X : F D V A Freedom Financial Holdings, Inc.
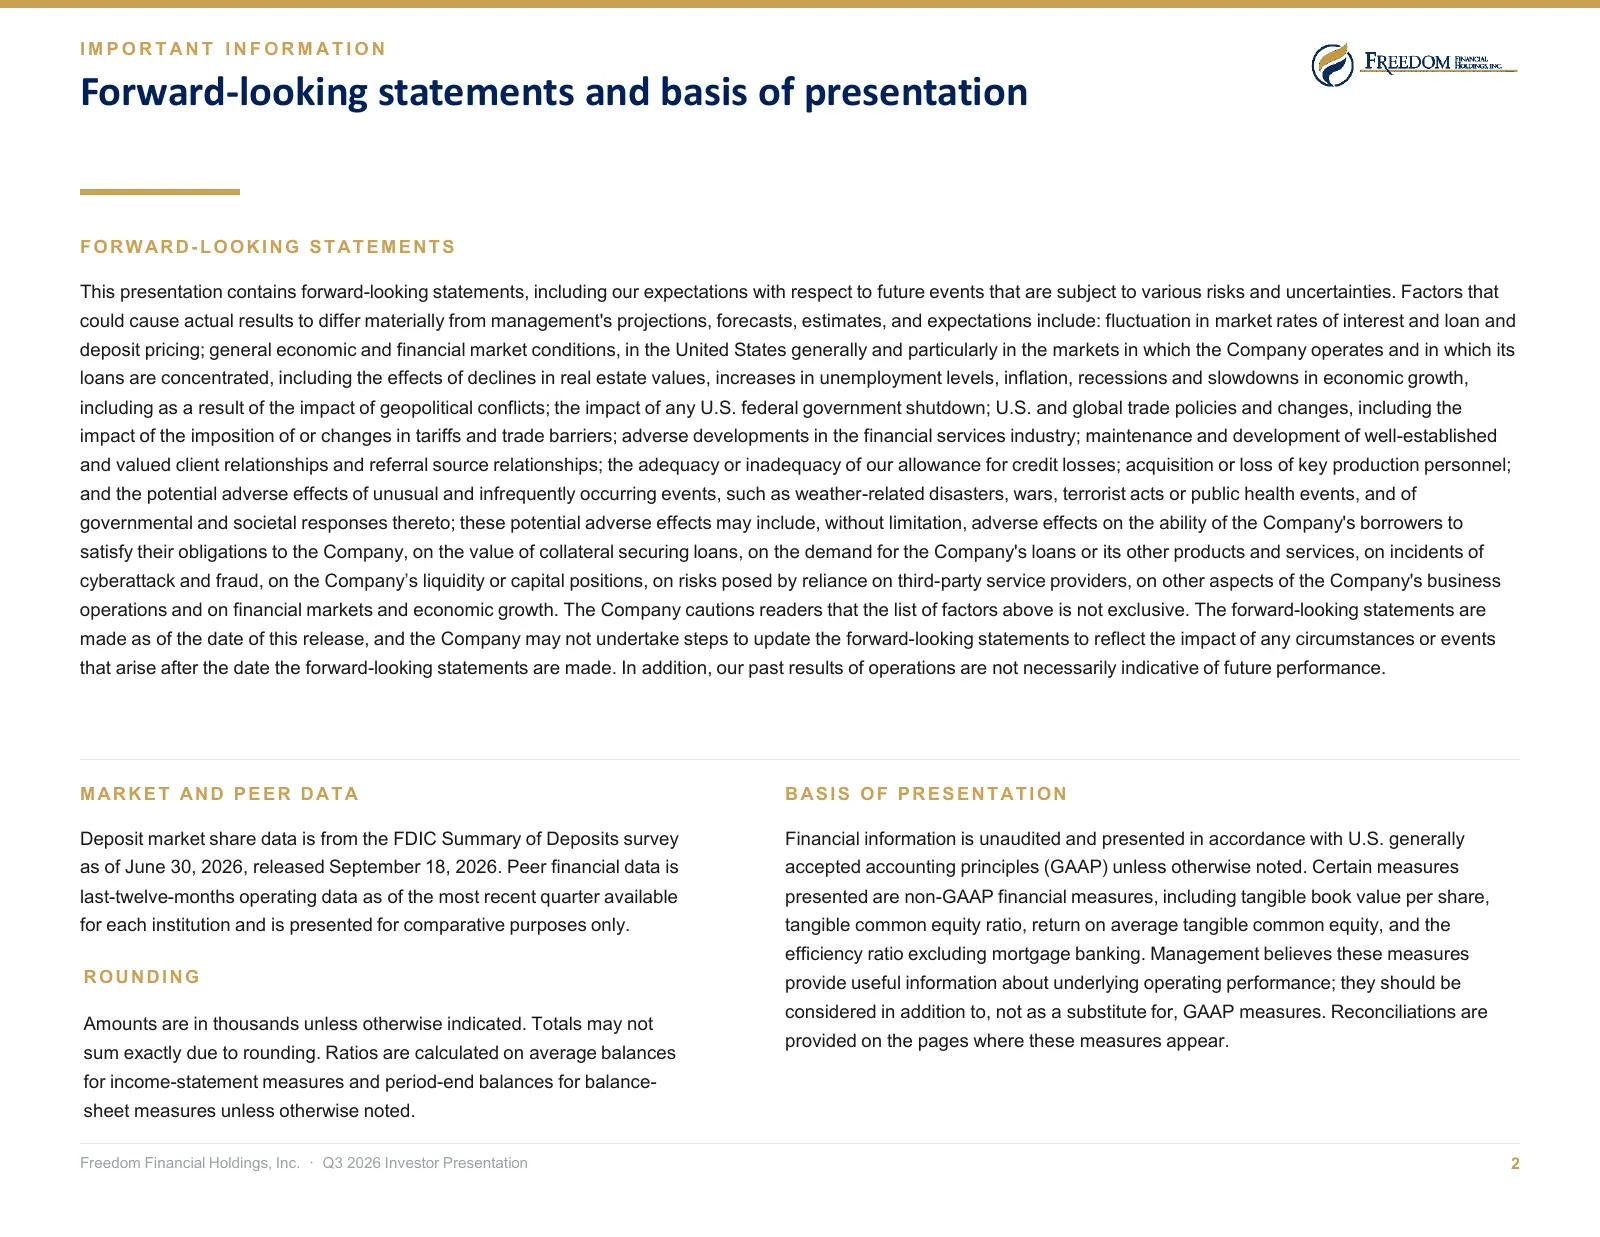
Slide 2: Forward-looking statements and basis of presentation
IMPORTANT INFORMATION Forward-looking statements and basis of presentation FORWARD-LOOKING STATEMENTS This presentation contains forward-looking statements, including our expectations with respect to future events that are subject to various risks and uncertainties. Factors that could cause actual r
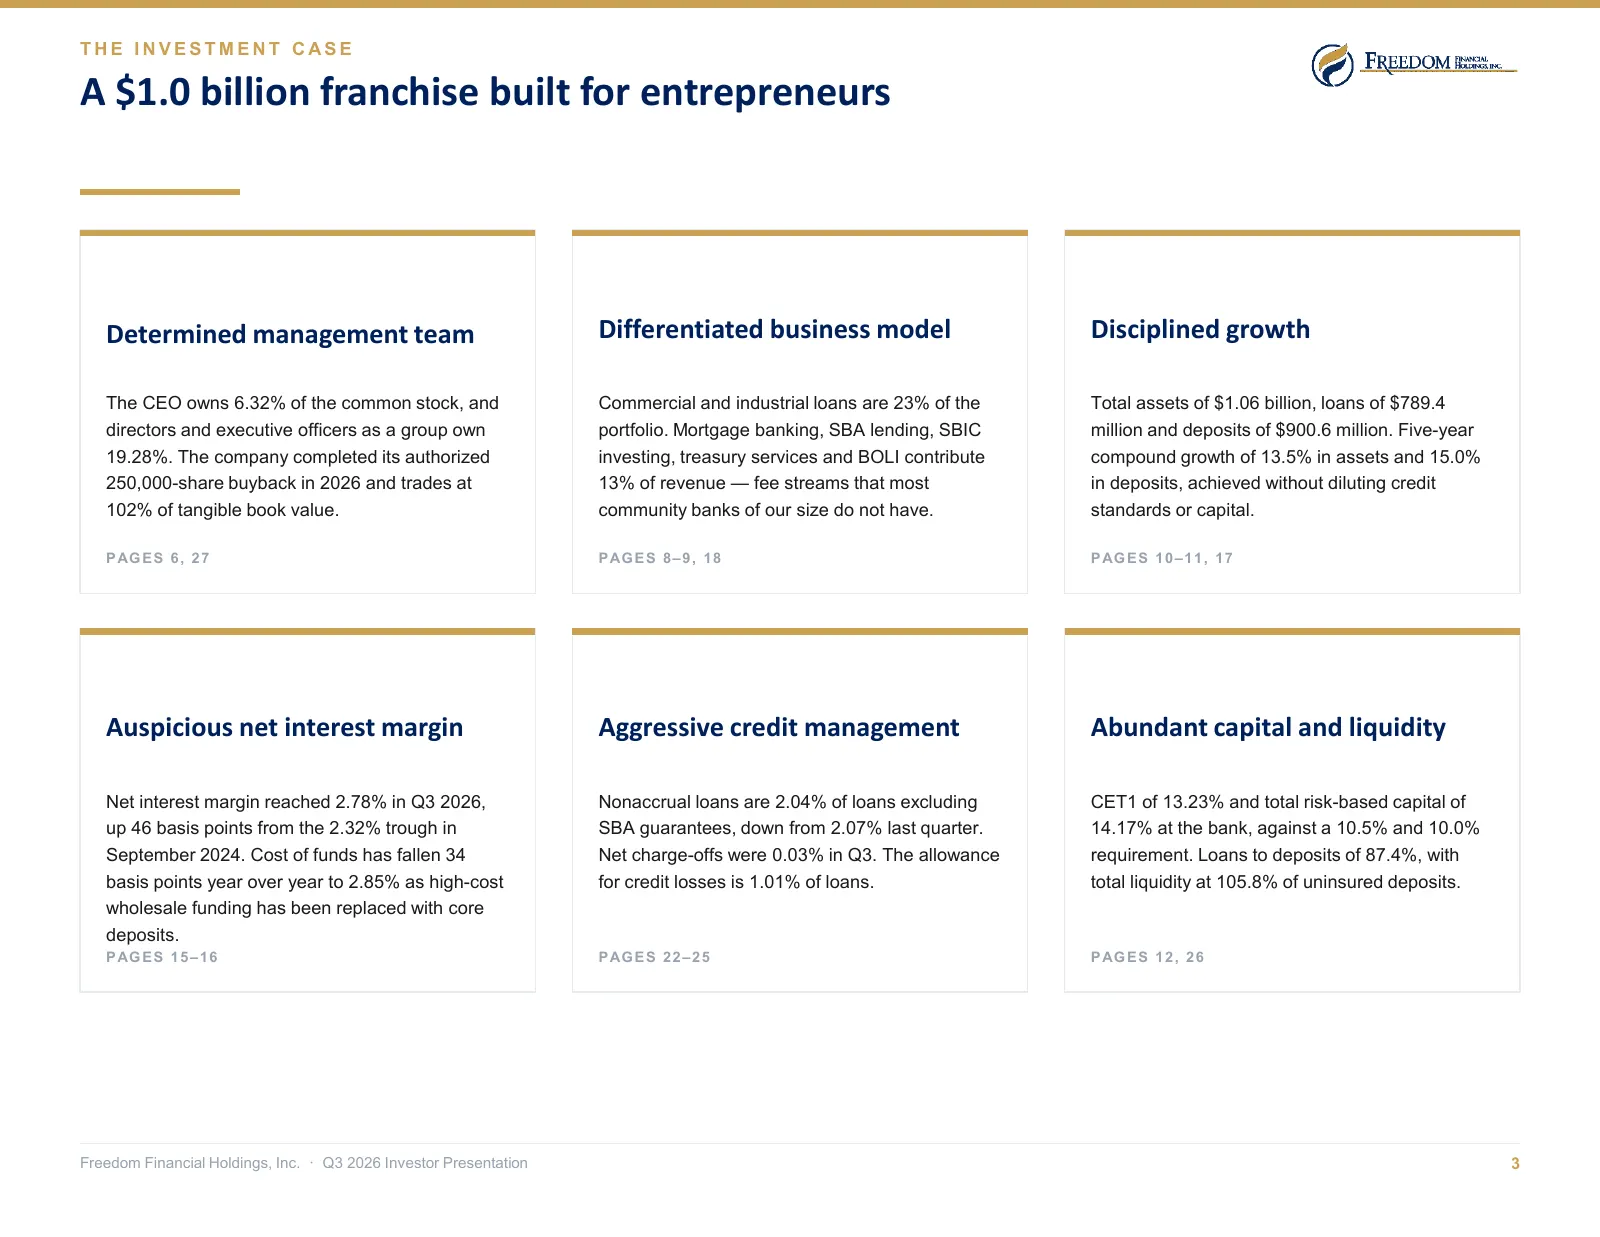
Slide 3: A $1.0 billion franchise built for entrepreneurs
THE INVESTMENT CASE A $1.0 billion franchise built for entrepreneurs Determined management team Differentiated business model Disciplined growth The CEO owns 6.32% of the common stock, and Commercial and industrial loans are 23% of the Total assets of $1.06 billion, loans of $789.4 directors and exe
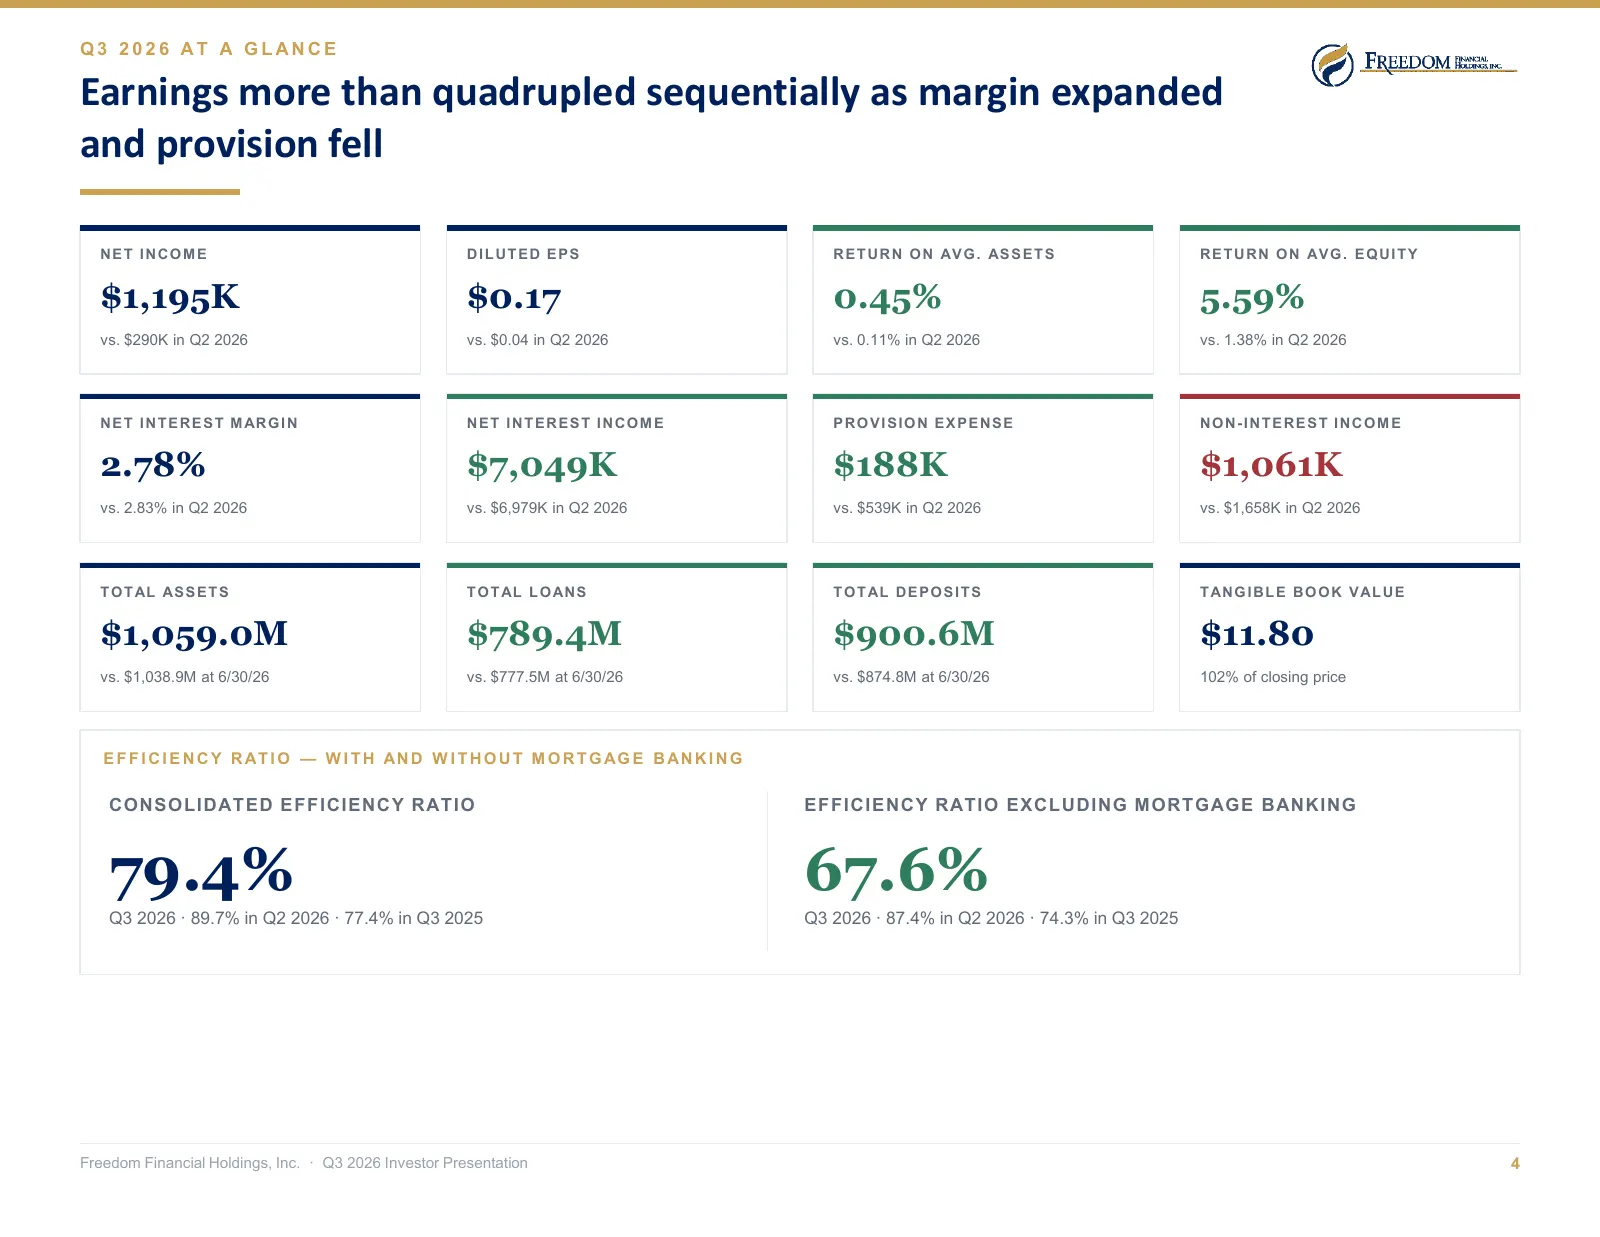
Slide 4: Earnings more than quadrupled sequentially as margin expanded and provision fell
Q3 2026 AT A GLANCE Earnings more than quadrupled sequentially as margin expanded and provision fell NET INCOME DILUTED EPS R E T U R N O N AV G . AS S E T S R E T U R N O N AV G . E Q U I T Y $1,195K $0.17 0.45% 5.59% vs. $290K in Q2 2026 vs. $0.04 in Q2 2026 vs. 0.11% in Q2 2026 vs. 1.38% in Q2 20
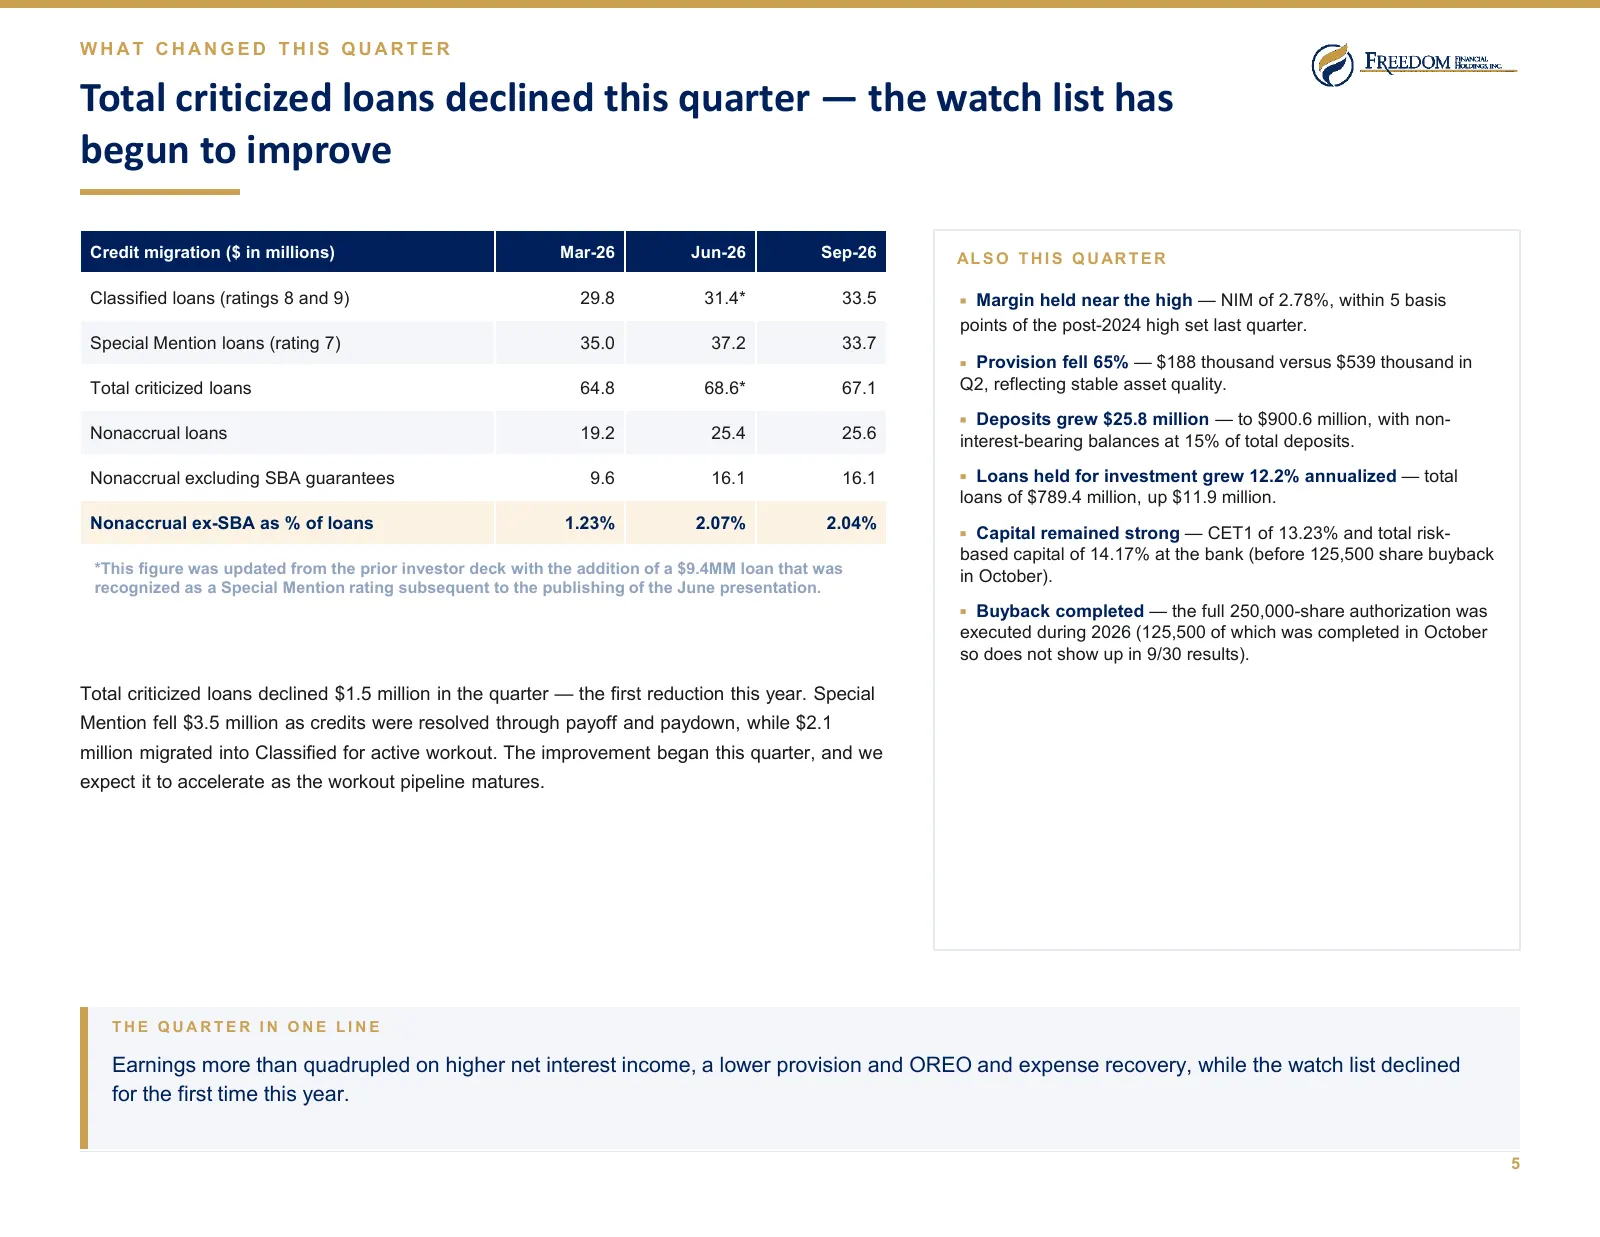
Slide 5: Total criticized loans declined this quarter — the watch list has begun to improve
WHAT CHANGED THIS QUARTER Total criticized loans declined this quarter — the watch list has begun to improve Credit migration ($ in millions) Mar-26 Jun-26 Sep-26 AL S O T H I S Q U AR T E R Classified loans (ratings 8 and 9) 29.8 31.4* 33.5 Margin held near the high — NIM of 2.78%, within 5 basis p
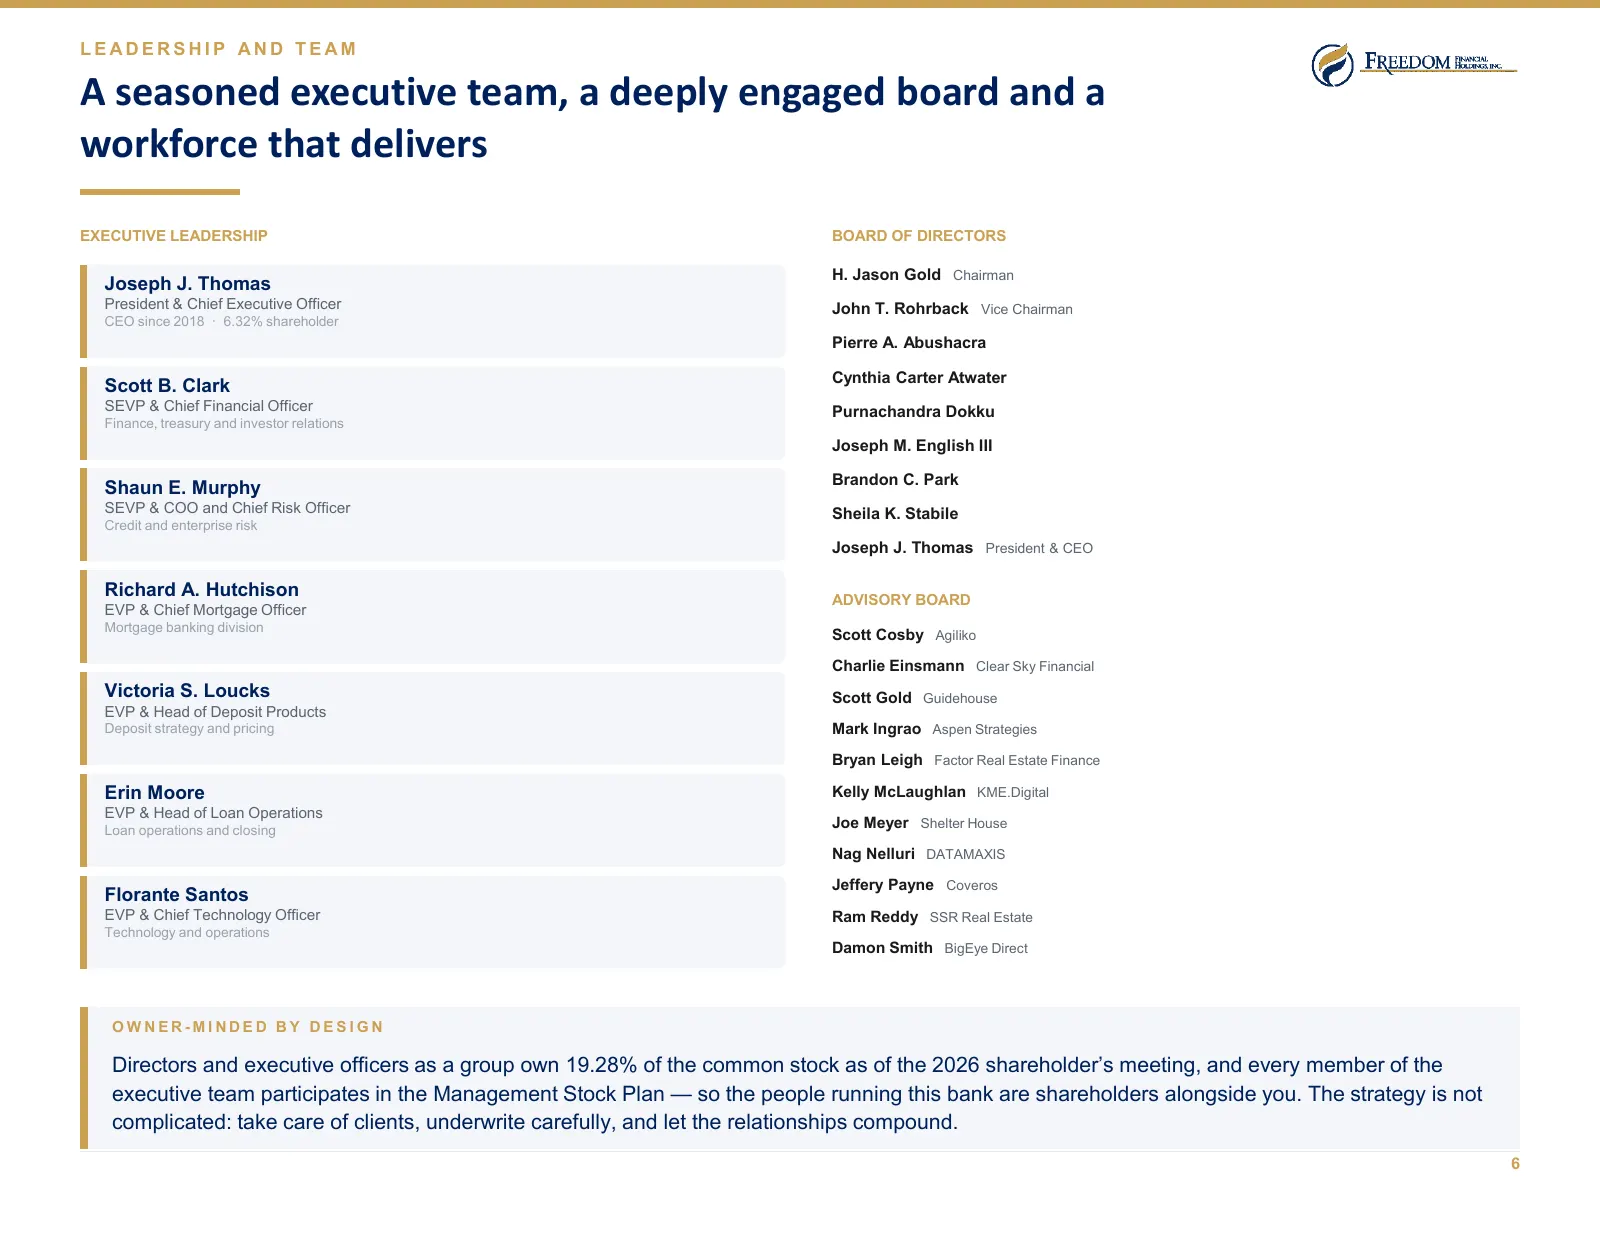
Slide 6: A seasoned executive team, a deeply engaged board and a workforce that delivers
LEADERSHIP AND TEAM A seasoned executive team, a deeply engaged board and a workforce that delivers EXECUTIVE LEADERSHIP BOARD OF DIRECTORS H. Jason Gold Chairman Joseph J. Thomas President & Chief Executive Officer John T. Rohrback Vice Chairman CEO since 2018 · 6.32% shareholder Pierre A. Abushacr
Slide 7: The Franchise
01 The Franchise A $1.06 billion institution built around commercial relationships in the Washington metropolitan area Freedom Financial Holdings, Inc. · Q3 2026 Investor Presentation 7
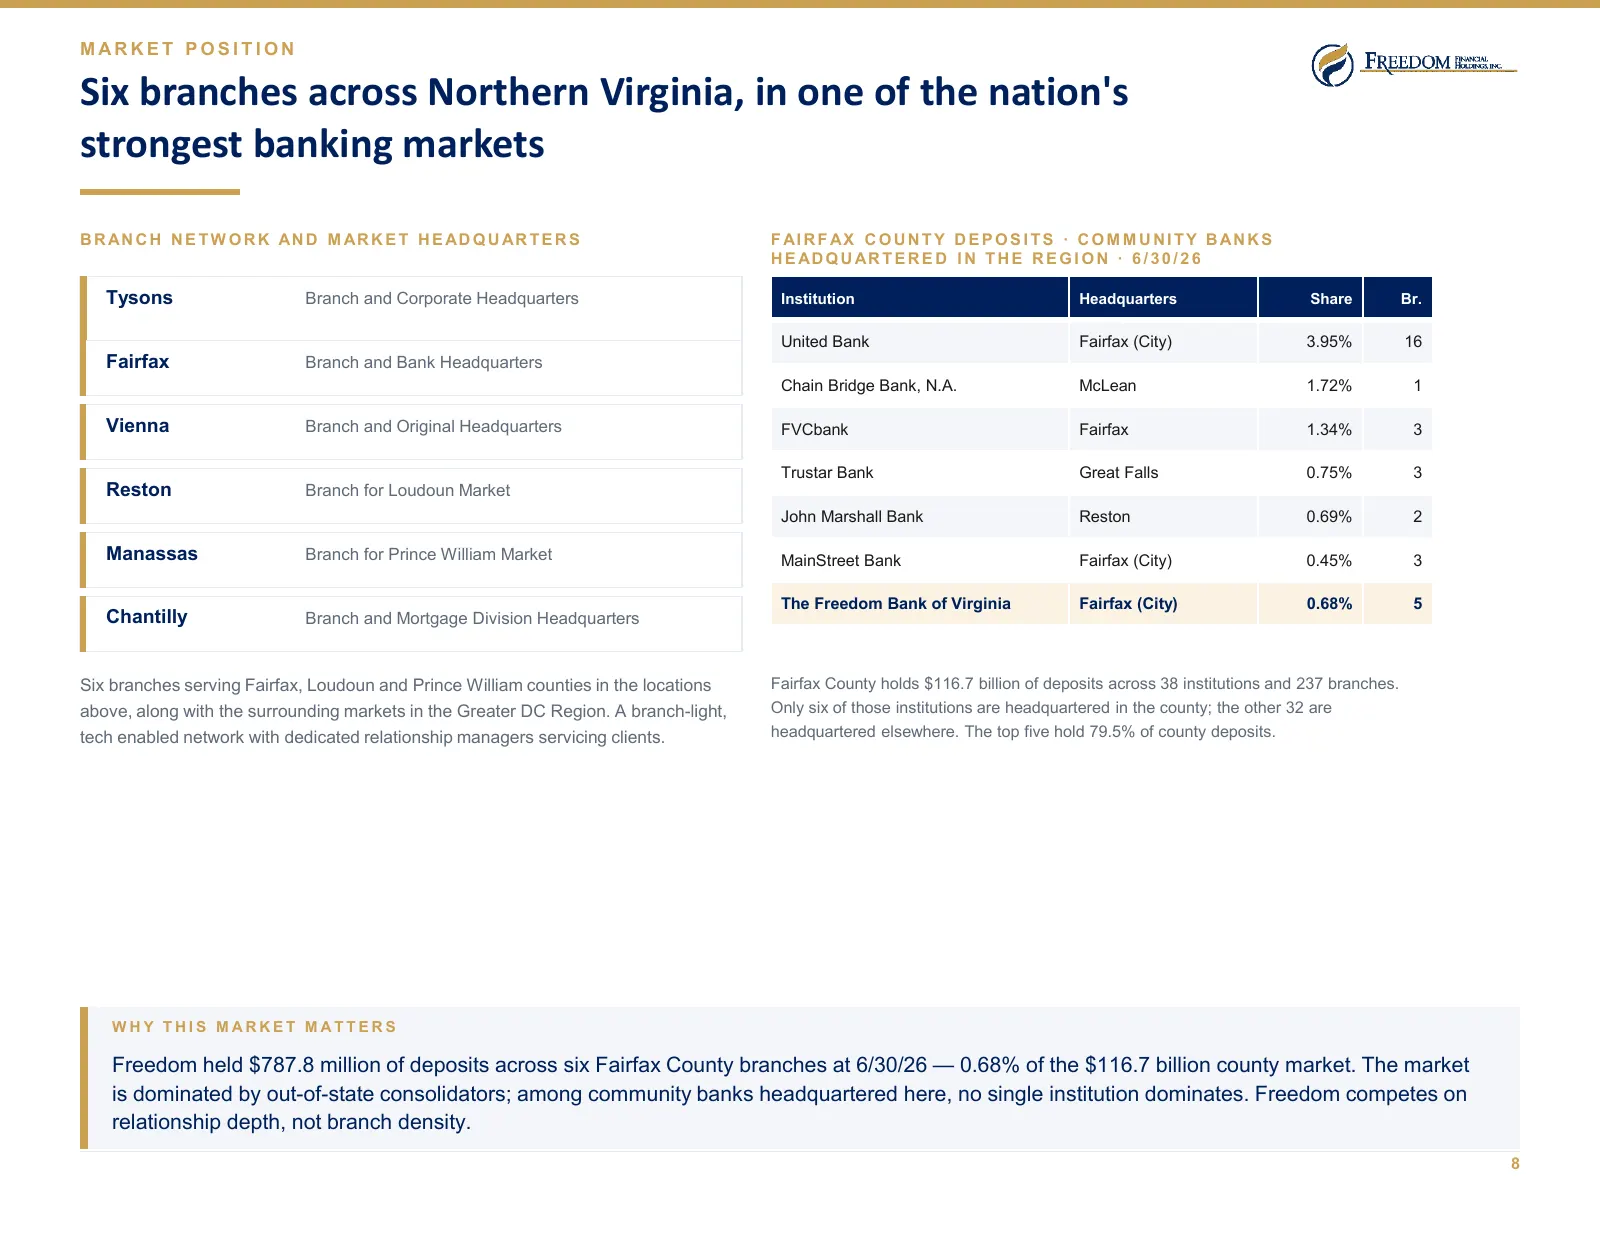
Slide 8: Six branches across Northern Virginia, in one of the nation's strongest banking markets
MARKET POSITION Six branches across Northern Virginia, in one of the nation's strongest banking markets B R AN C H N E T W O R K AN D M AR K E T H E AD Q U AR T E R S F AI R F AX C O U N T Y D E P O S I T S · C O M M U N I T Y B AN K S H E AD Q U AR T E R E D I N T H E R E G I O N · 6 / 3 0 / 2 6 Ty
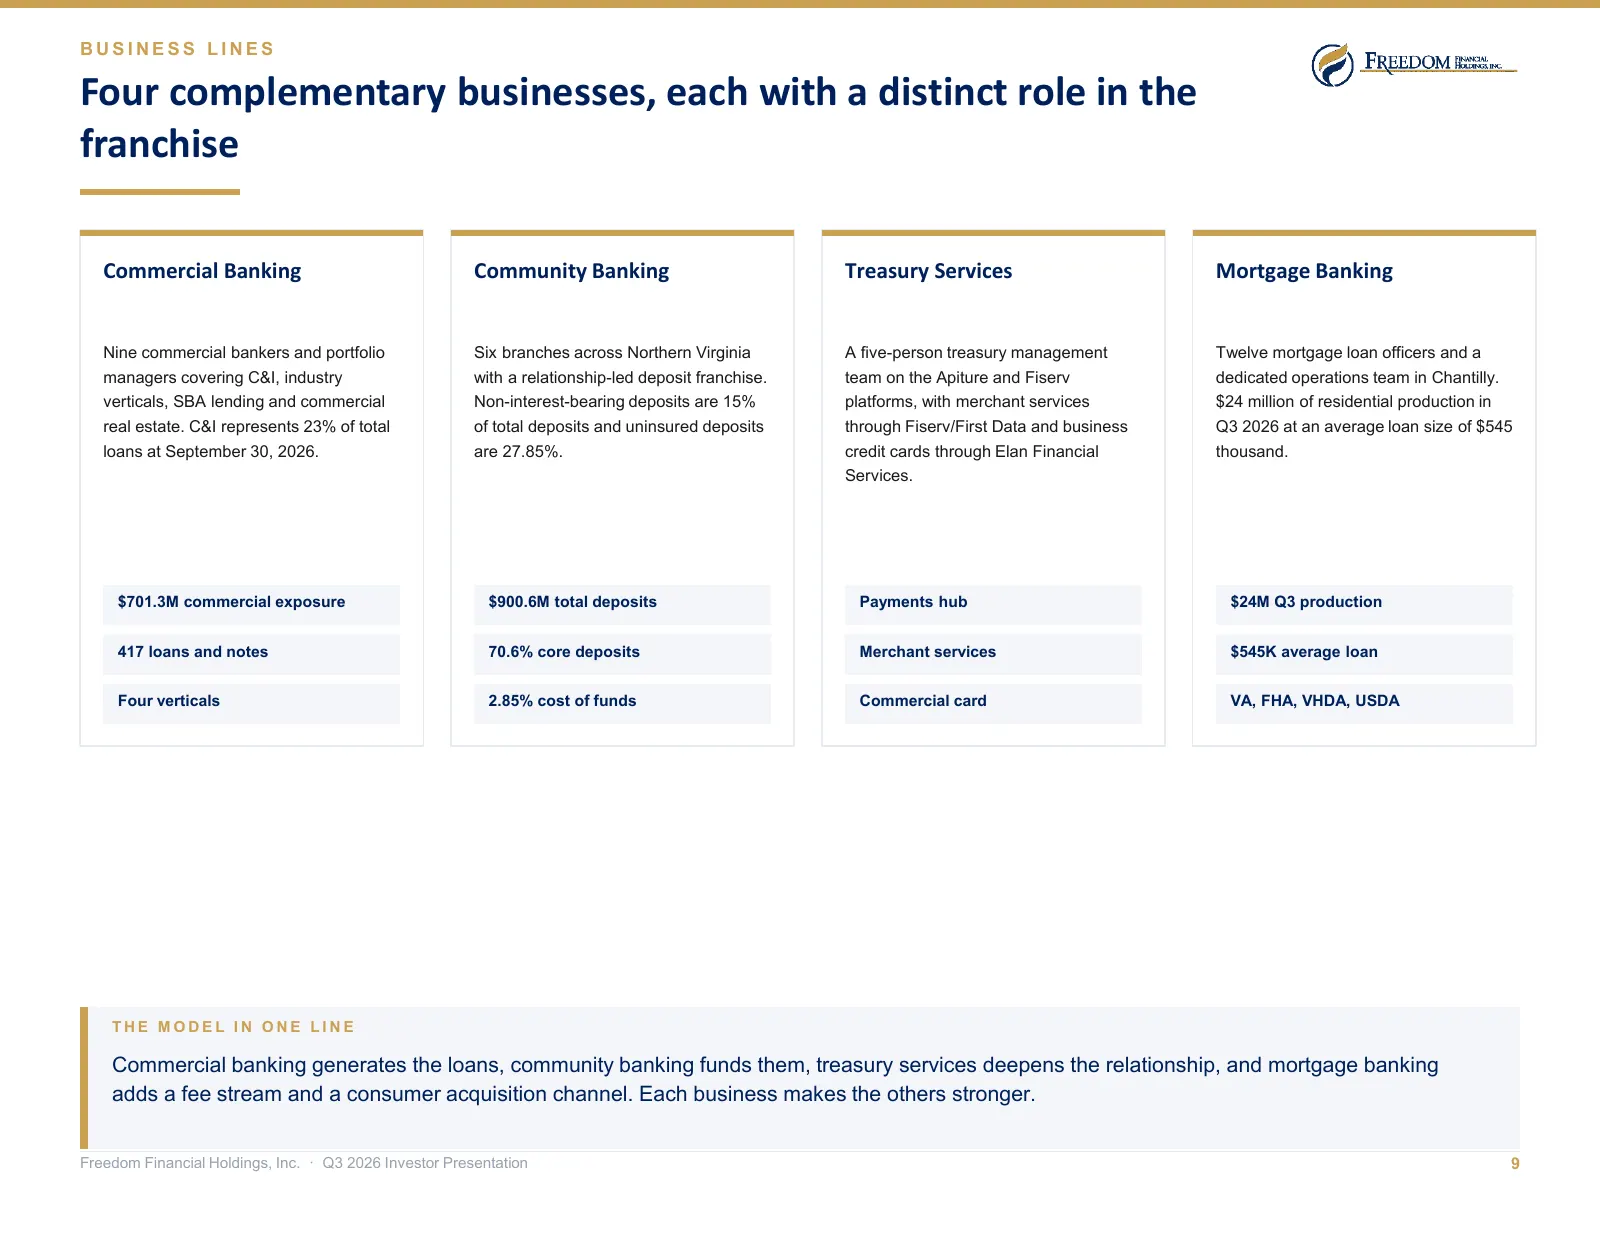
Slide 9: Four complementary businesses, each with a distinct role in the franchise
BUSINESS LINES Four complementary businesses, each with a distinct role in the franchise Commercial Banking Community Banking Treasury Services Mortgage Banking Nine commercial bankers and portfolio Six branches across Northern Virginia A five-person treasury management Twelve mortgage loan officers
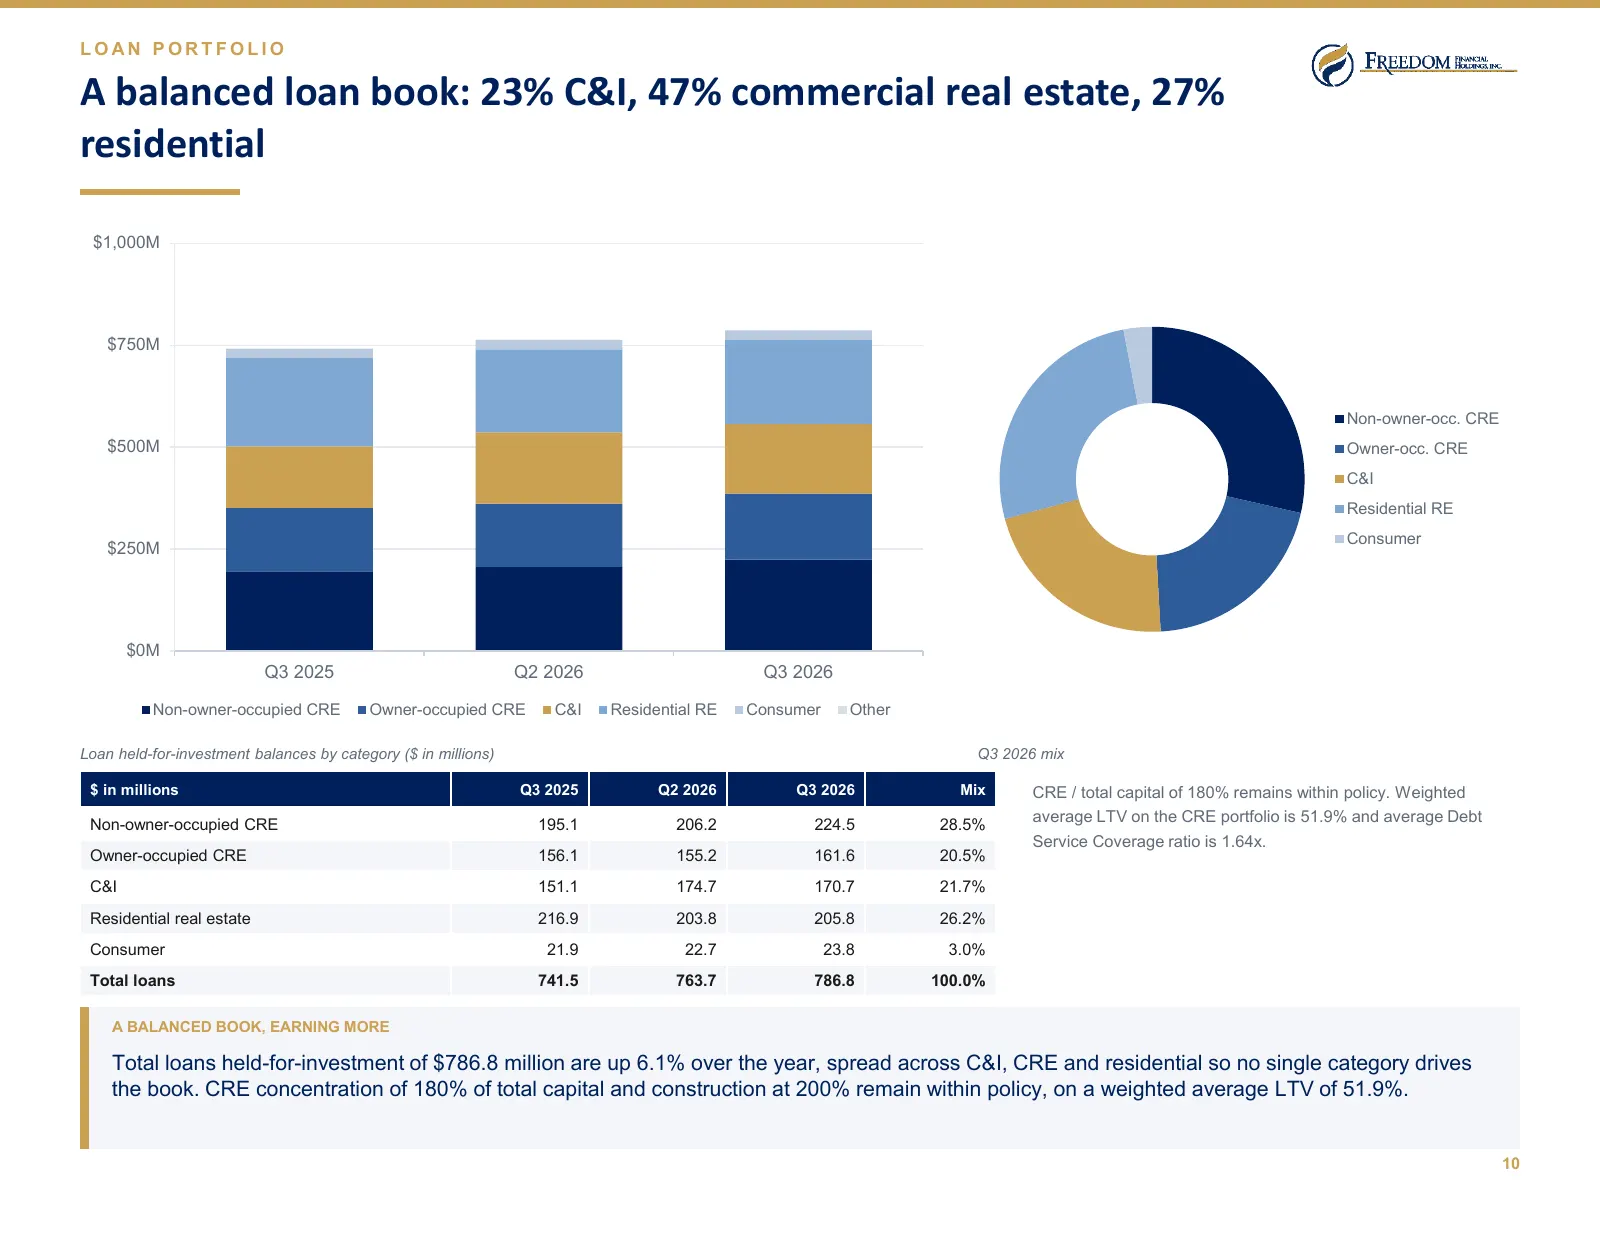
Slide 10: A balanced loan book: 23% C&I, 47% commercial real estate, 27% residential
LOAN PORTFOLIO A balanced loan book: 23% C&I, 47% commercial real estate, 27% residential $1,000M $750M Non-owner-occ. CRE $500M Owner-occ. CRE C&I Residential RE Consumer $250M $0M Q3 2025 Q2 2026 Q3 2026 Non-owner-occupied CRE Owner-occupied CRE C&I Residential RE Consumer Other Loan held-for-inve
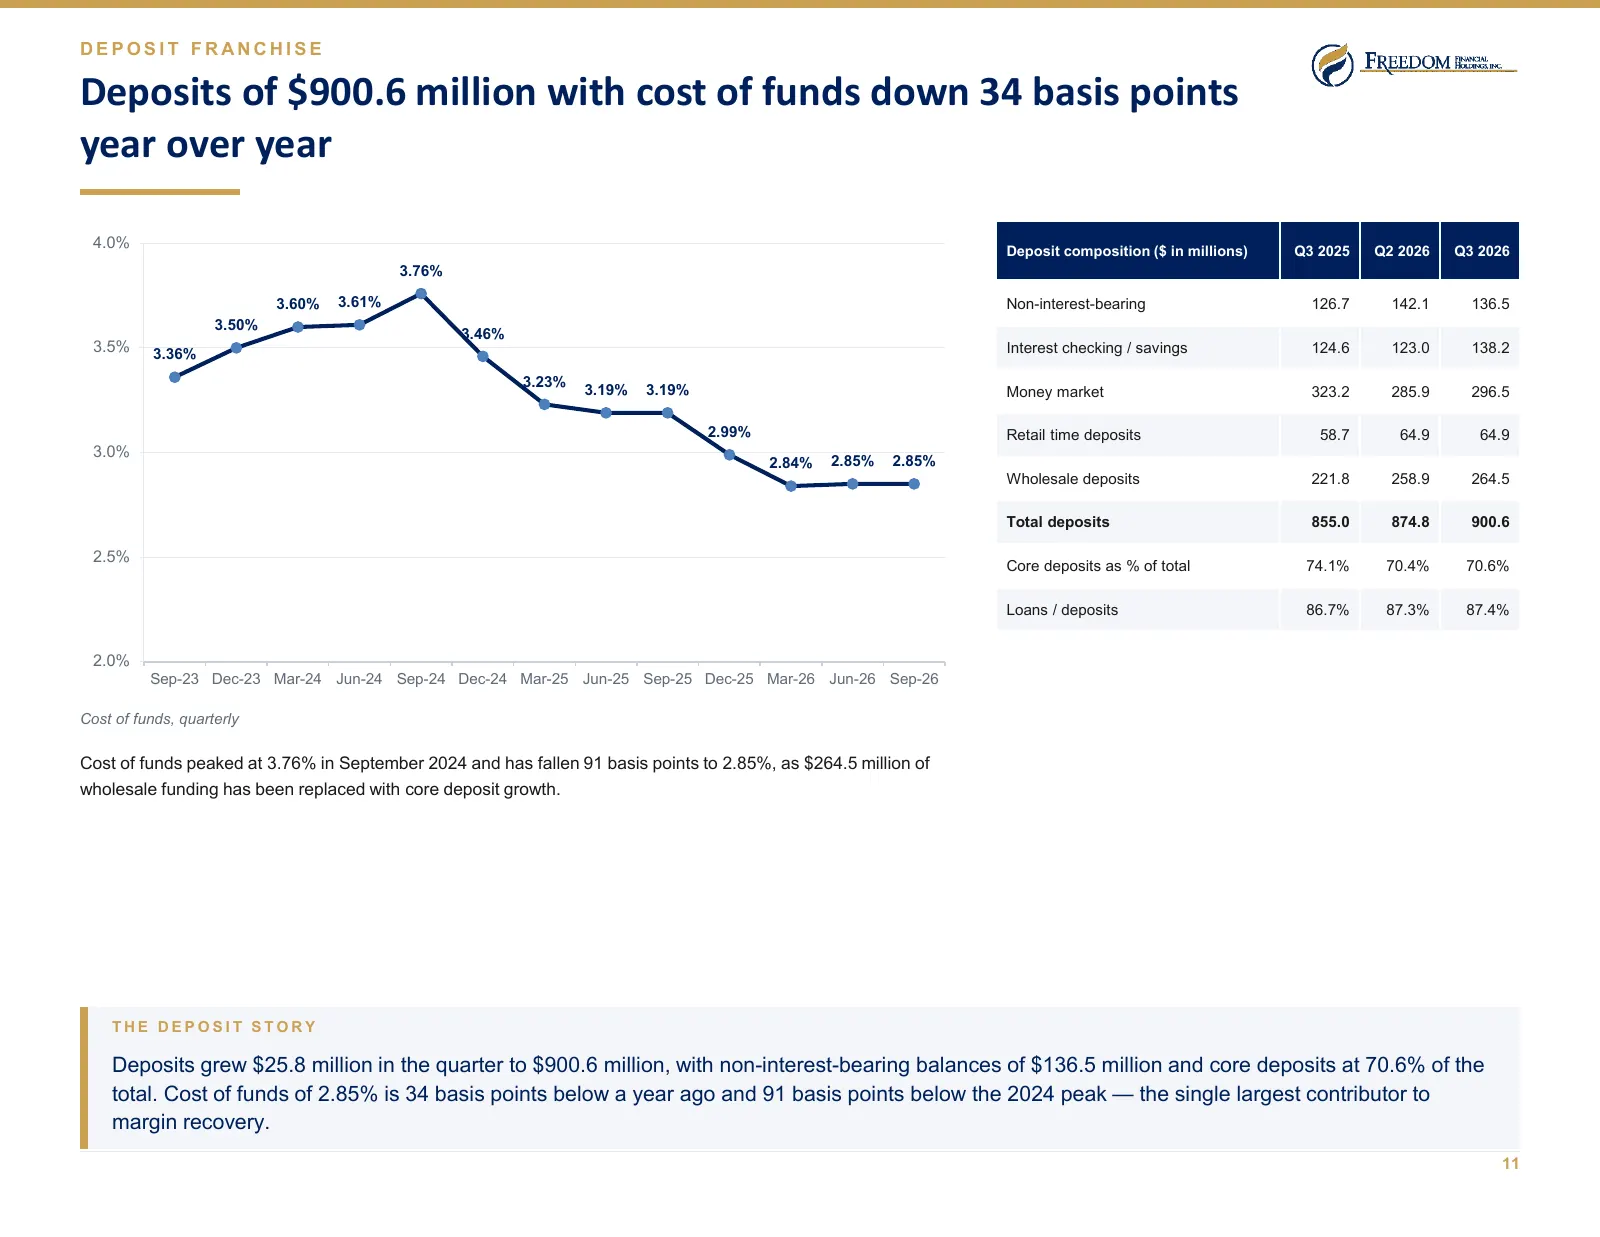
Slide 11: Deposits of $900.6 million with cost of funds down 34 basis points year over year
DEPOSIT FRANCHISE Deposits of $900.6 million with cost of funds down 34 basis points year over year 4.0% Deposit composition ($ in millions) Q3 2025 Q2 2026 Q3 2026 3.76% 3.60% 3.61% Non-interest-bearing 126.7 142.1 136.5 3.50% 3.46% 3.5% 3.36% Interest checking / savings 124.6 123.0 138.2 3.23% 3.1
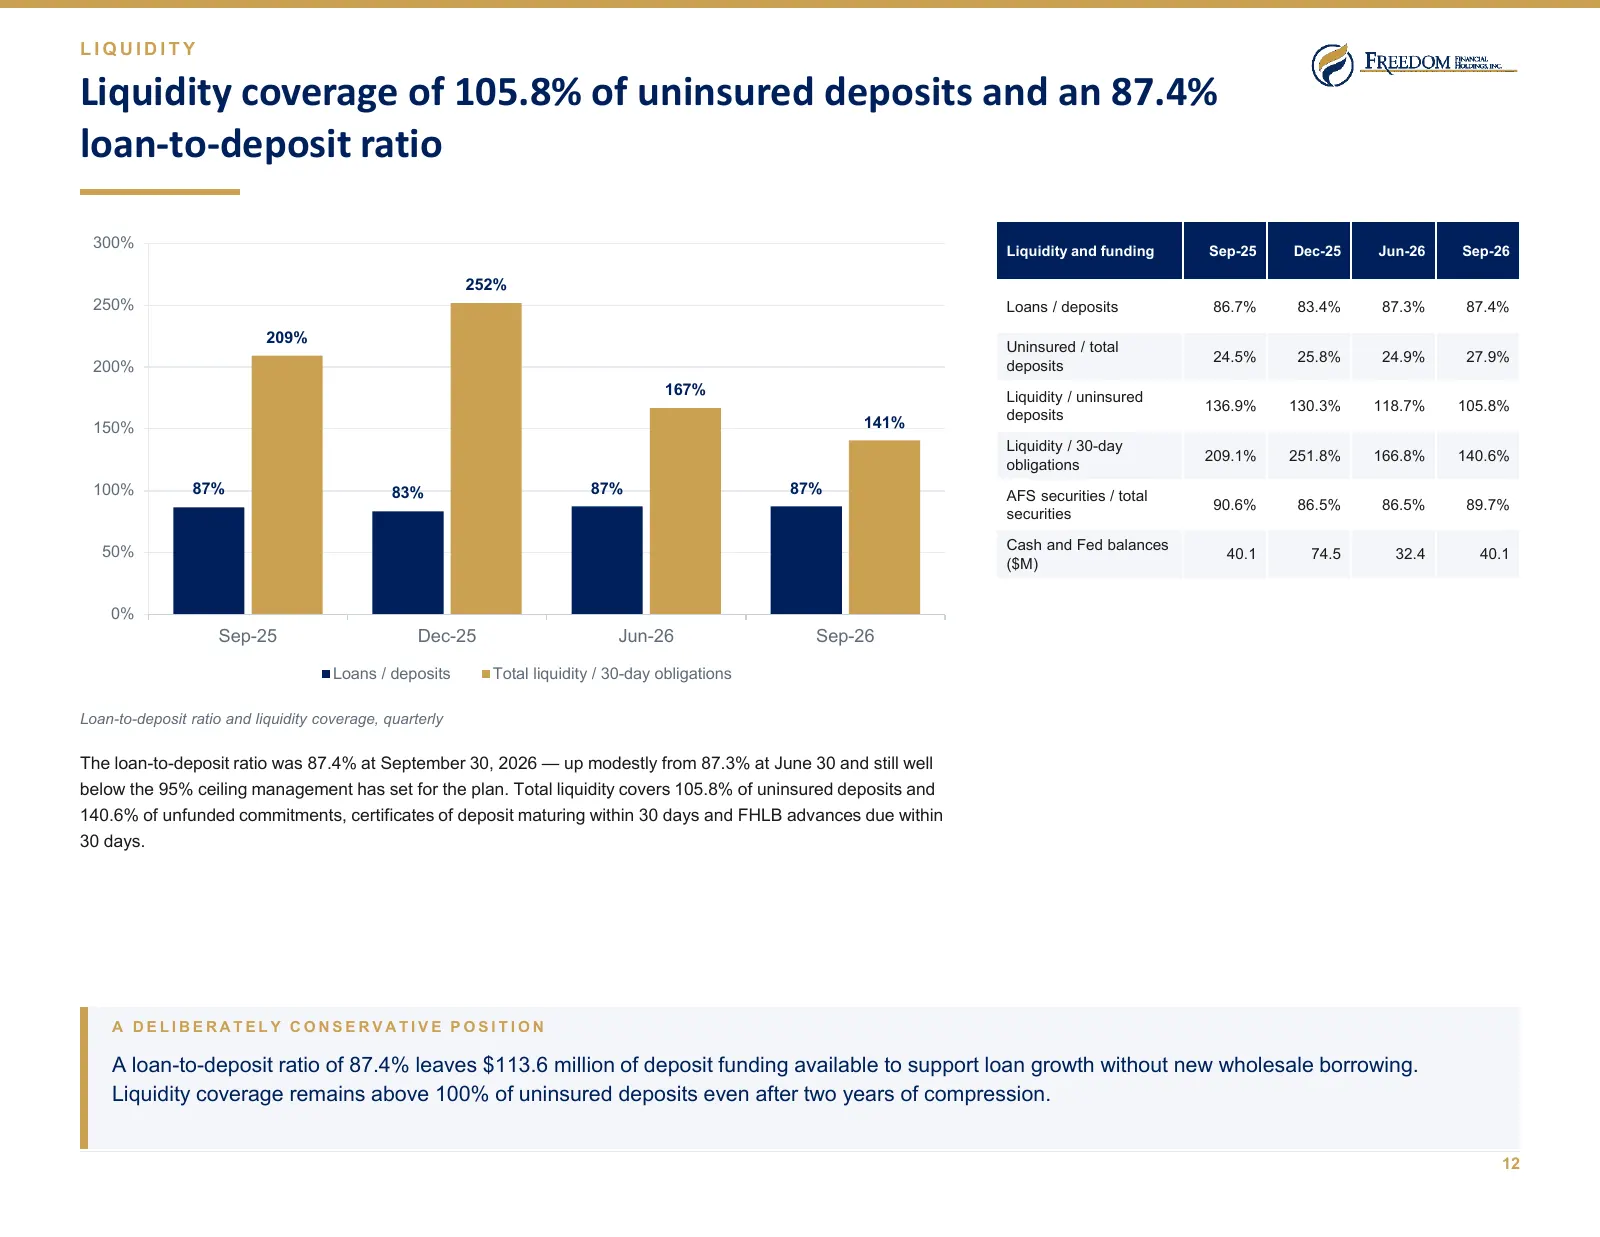
Slide 12: Liquidity coverage of 105.8% of uninsured deposits and an 87.4% loan-to-deposit ratio
LIQUIDITY Liquidity coverage of 105.8% of uninsured deposits and an 87.4% loan-to-deposit ratio 300% Liquidity and funding Sep-25 Dec-25 Jun-26 Sep-26 252% 250% Loans / deposits 86.7% 83.4% 87.3% 87.4% 209% Uninsured / total 24.5% 25.8% 24.9% 27.9% 200% deposits 167% Liquidity / uninsured 136.9% 130
Slide 13: Q3 2026 Results
02 Q3 2026 Results Earnings more than quadrupled sequentially on net interest income, a lower provision and disciplined expense management Freedom Financial Holdings, Inc. · Q3 2026 Investor Presentation 13
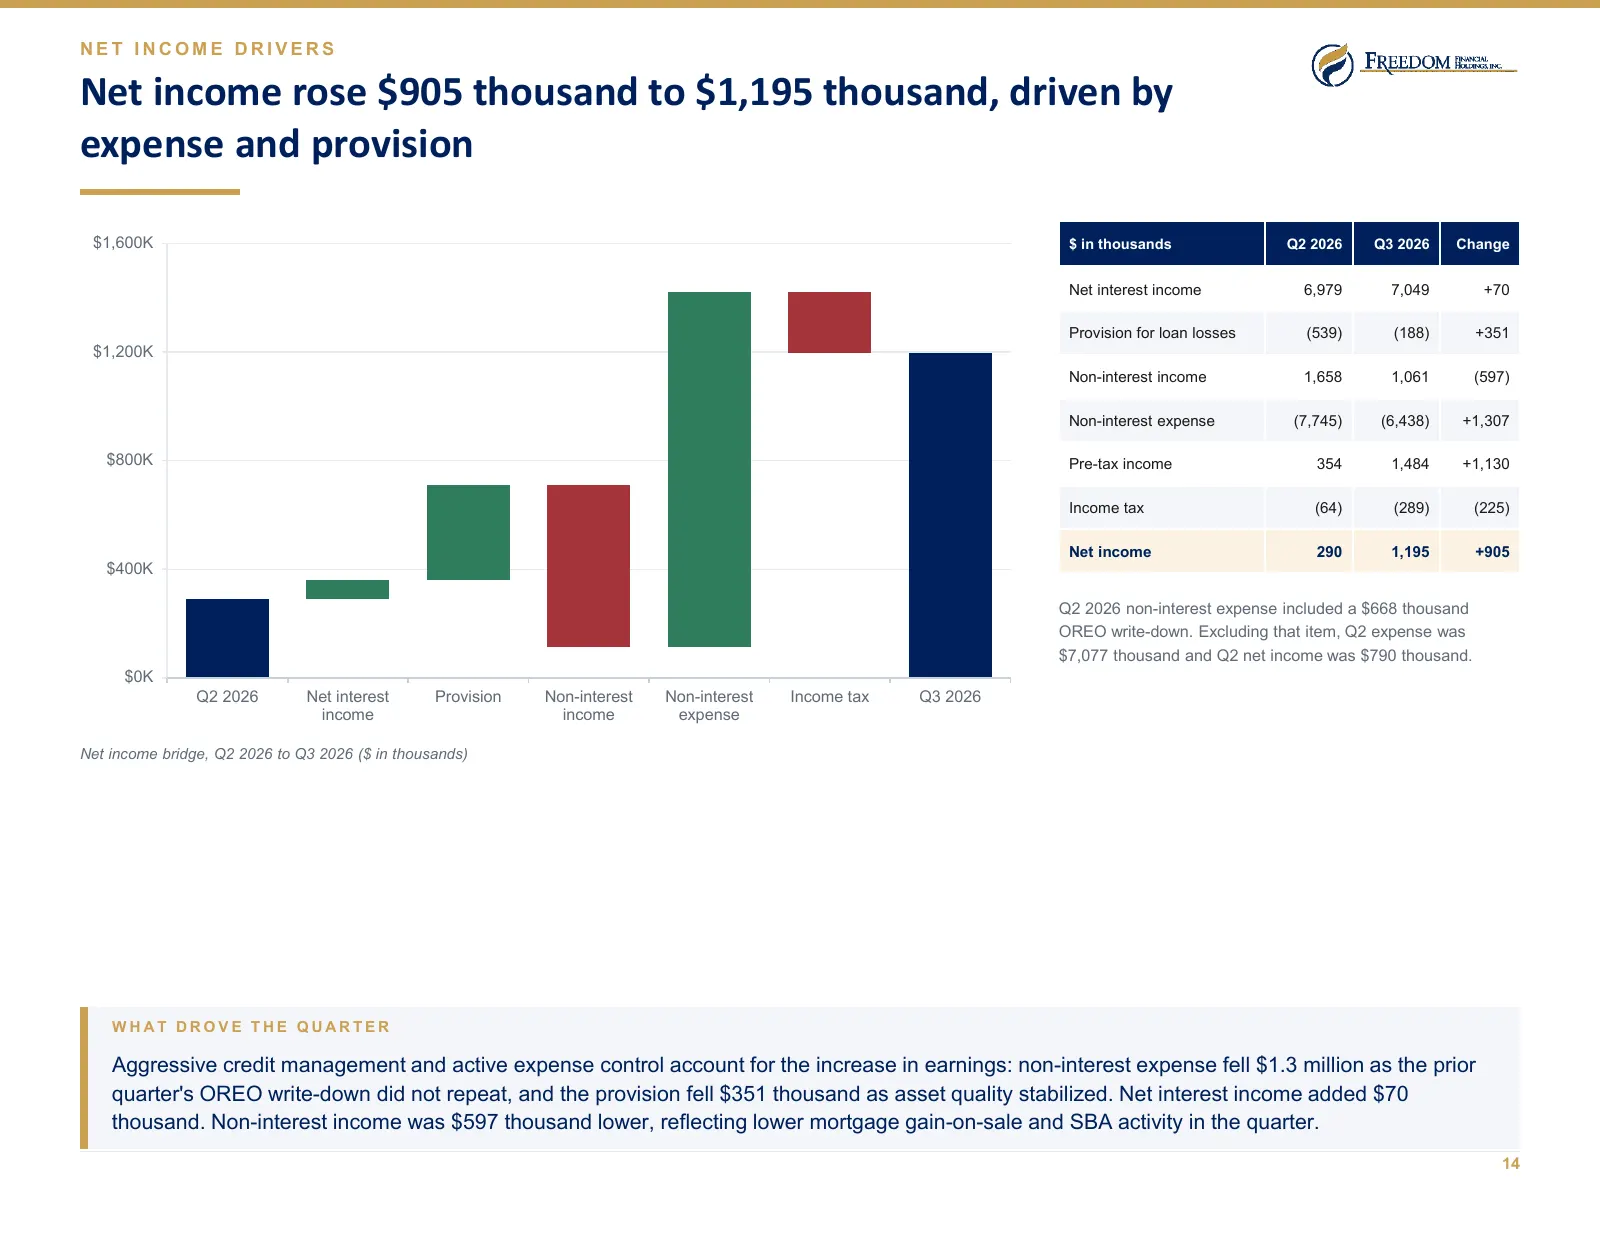
Slide 14: Net income rose $905 thousand to $1,195 thousand, driven by expense and provision
NET INCOME DRIVERS Net income rose $905 thousand to $1,195 thousand, driven by expense and provision $1,600K $ in thousands Q2 2026 Q3 2026 Change Net interest income 6,979 7,049 +70 Provision for loan losses (539) (188) +351 $1,200K Non-interest income 1,658 1,061 (597) Non-interest expense (7,745)
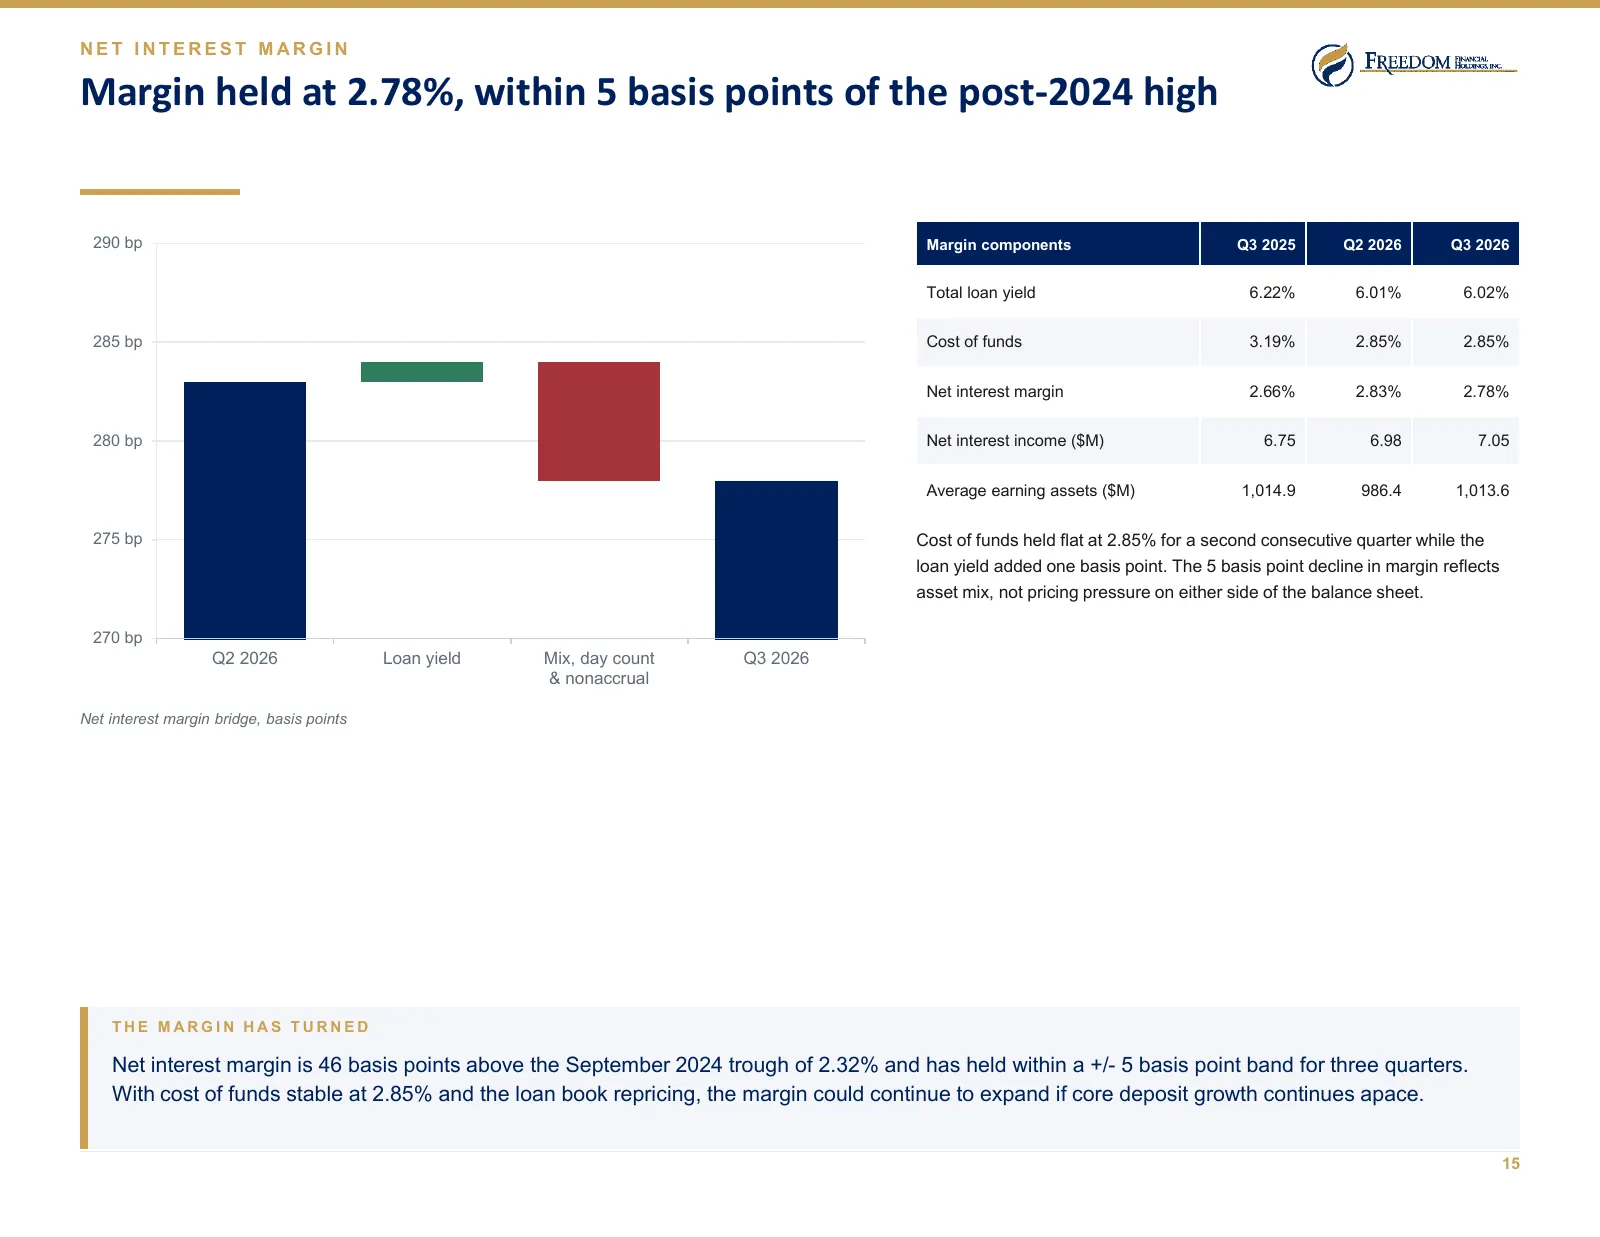
Slide 15: Margin held at 2.78%, within 5 basis points of the post-2024 high
NET INTEREST MARGIN Margin held at 2.78%, within 5 basis points of the post-2024 high 290 bp Margin components Q3 2025 Q2 2026 Q3 2026 Total loan yield 6.22% 6.01% 6.02% 285 bp Cost of funds 3.19% 2.85% 2.85% Net interest margin 2.66% 2.83% 2.78% 280 bp Net interest income ($M) 6.75 6.98 7.05 Averag
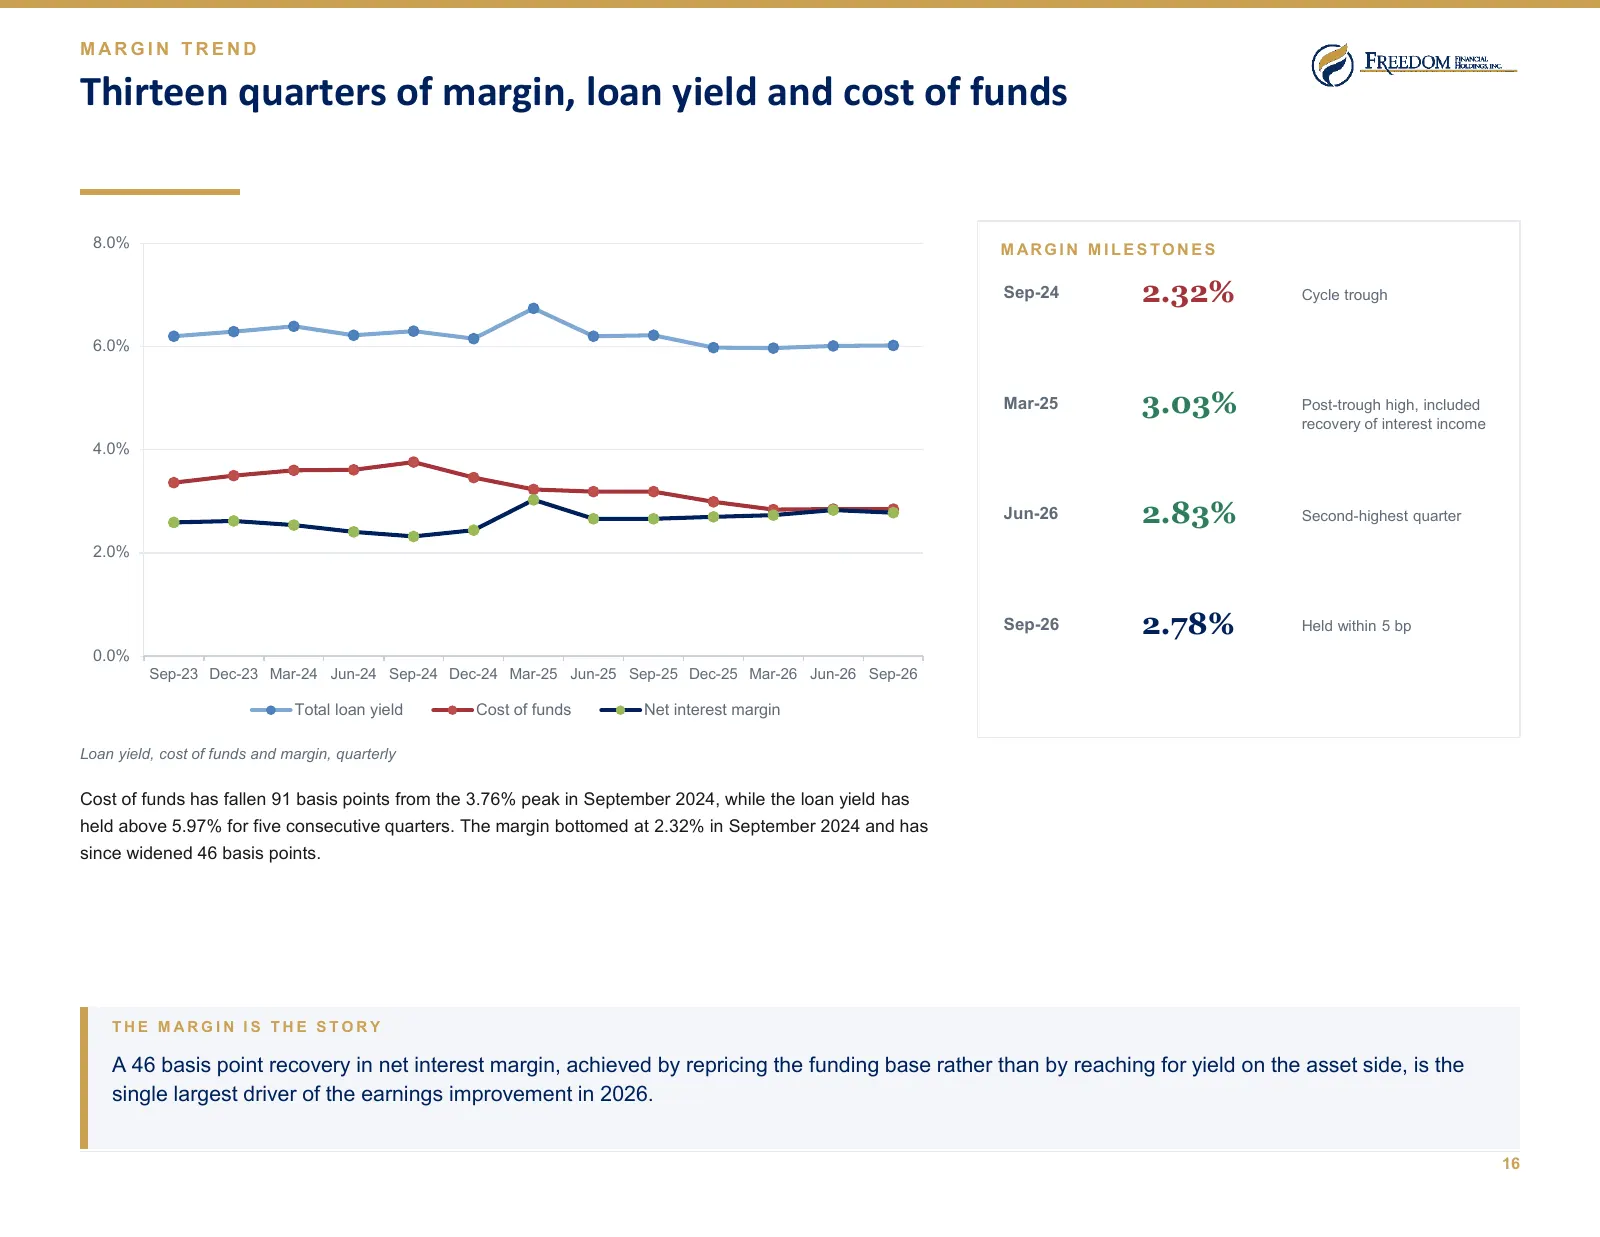
Slide 16: Thirteen quarters of margin, loan yield and cost of funds
MARGIN TREND Thirteen quarters of margin, loan yield and cost of funds 8.0% M AR G I N M I L E S T O N E S Sep-24 2.32% Cycle trough 6.0% Mar-25 3.03% Post-trough high, included recovery of interest income 4.0% Jun-26 2.83% Second-highest quarter 2.0% Sep-26 2.78% Held within 5 bp 0.0% Sep-23 Dec-23
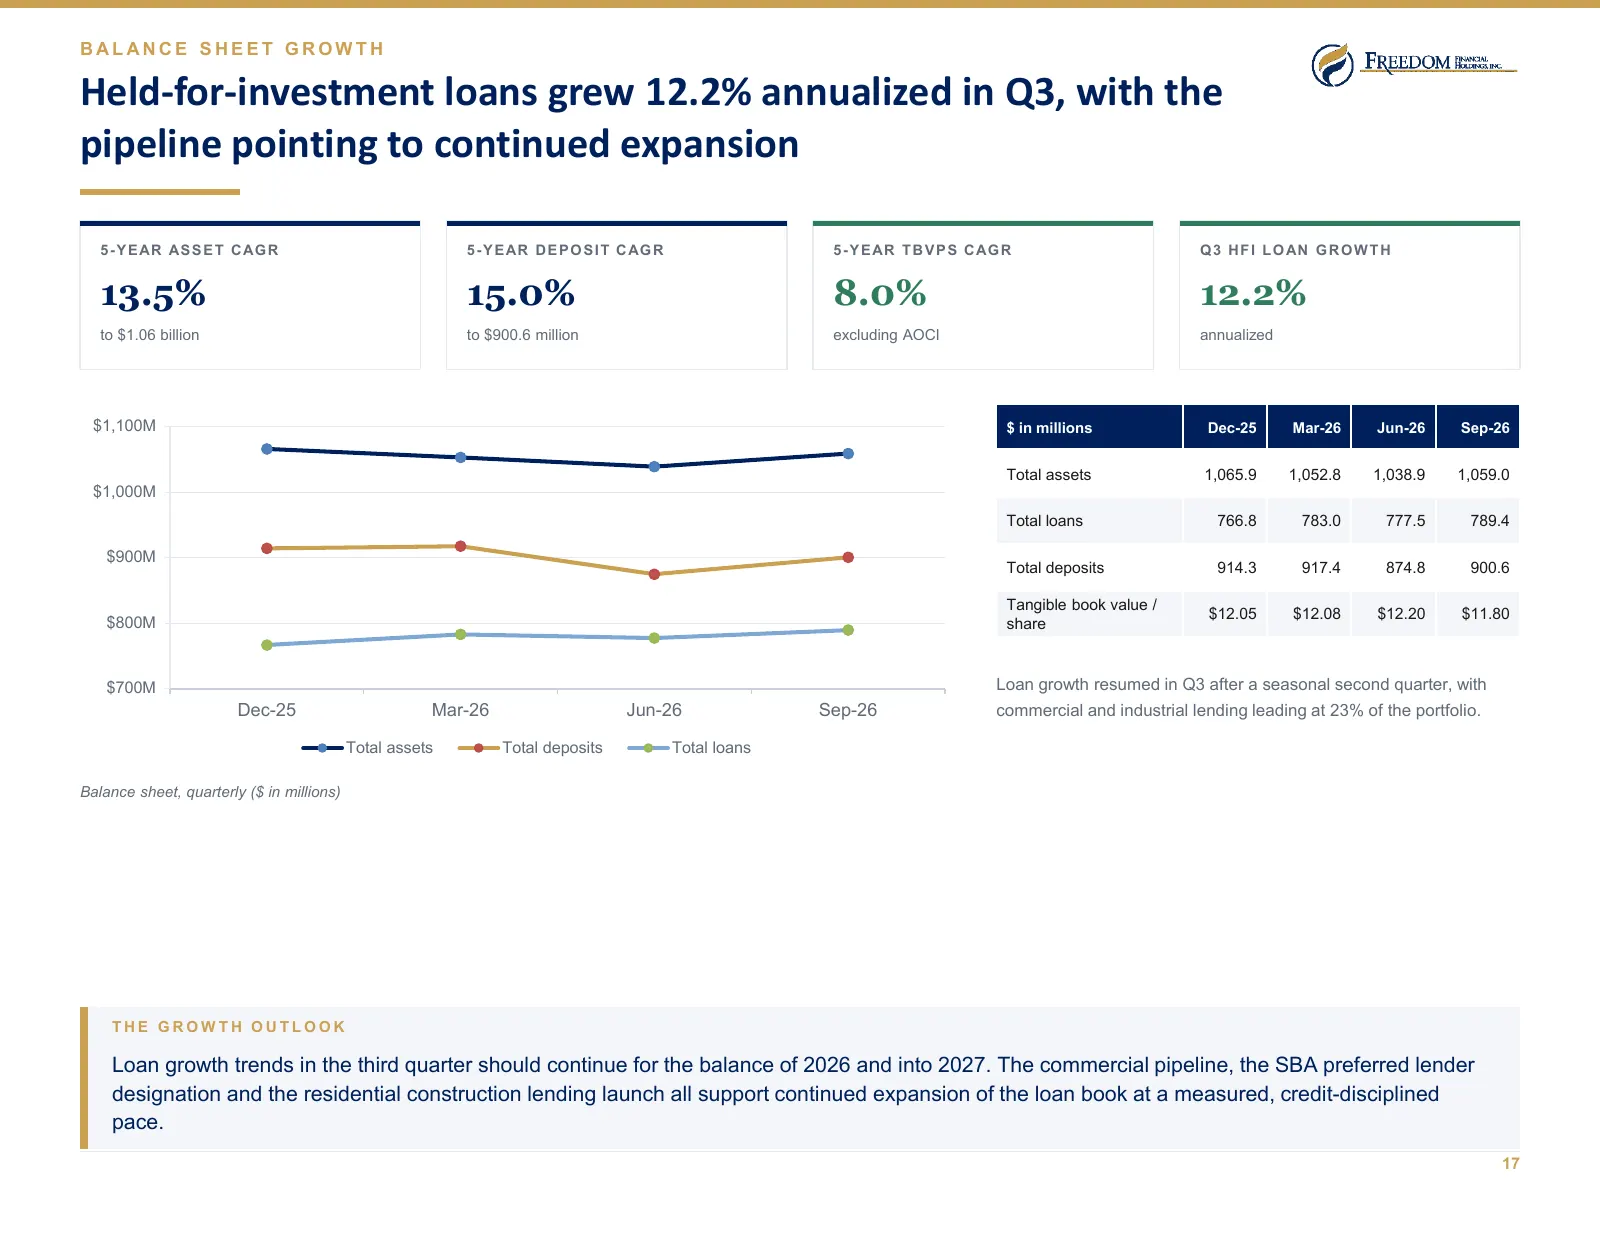
Slide 17: Held-for-investment loans grew 12.2% annualized in Q3, with the pipeline pointing to continued expansion
BALANCE SHEET GROWTH Held-for-investment loans grew 12.2% annualized in Q3, with the pipeline pointing to continued expansion 5 - Y E AR AS S E T C AG R 5 - Y E AR D E P O S I T C AG R 5 - Y E AR T B V P S C AG R Q 3 H F I L O AN G R O W T H 13.5% 15.0% 8.0% 12.2% to $1.06 billion to $900.6 million
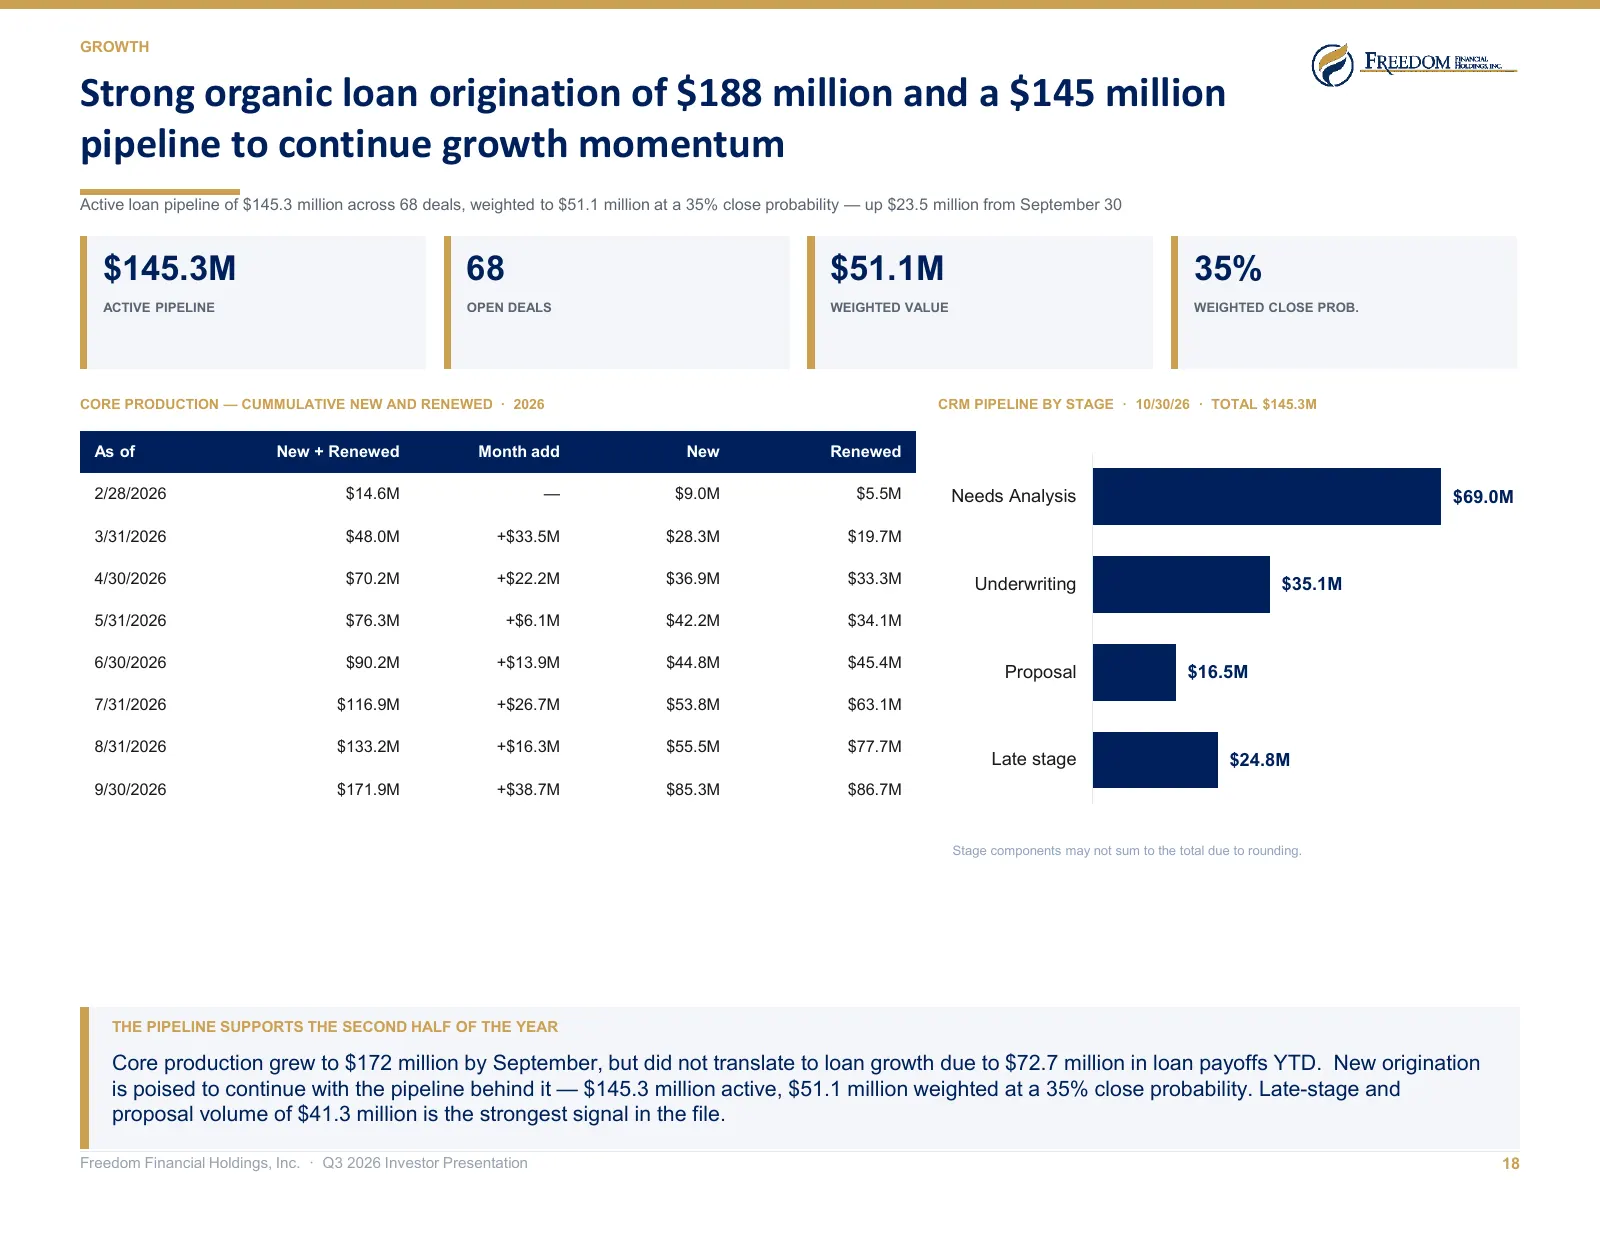
Slide 18: Strong organic loan origination of $188 million and a $145 million pipeline to continue growth momentum
GROWTH Strong organic loan origination of $188 million and a $145 million pipeline to continue growth momentum Active loan pipeline of $145.3 million across 68 deals, weighted to $51.1 million at a 35% close probability — up $23.5 million from September 30 $145.3M 68 $51.1M 35% ACTIVE PIPELINE OPEN
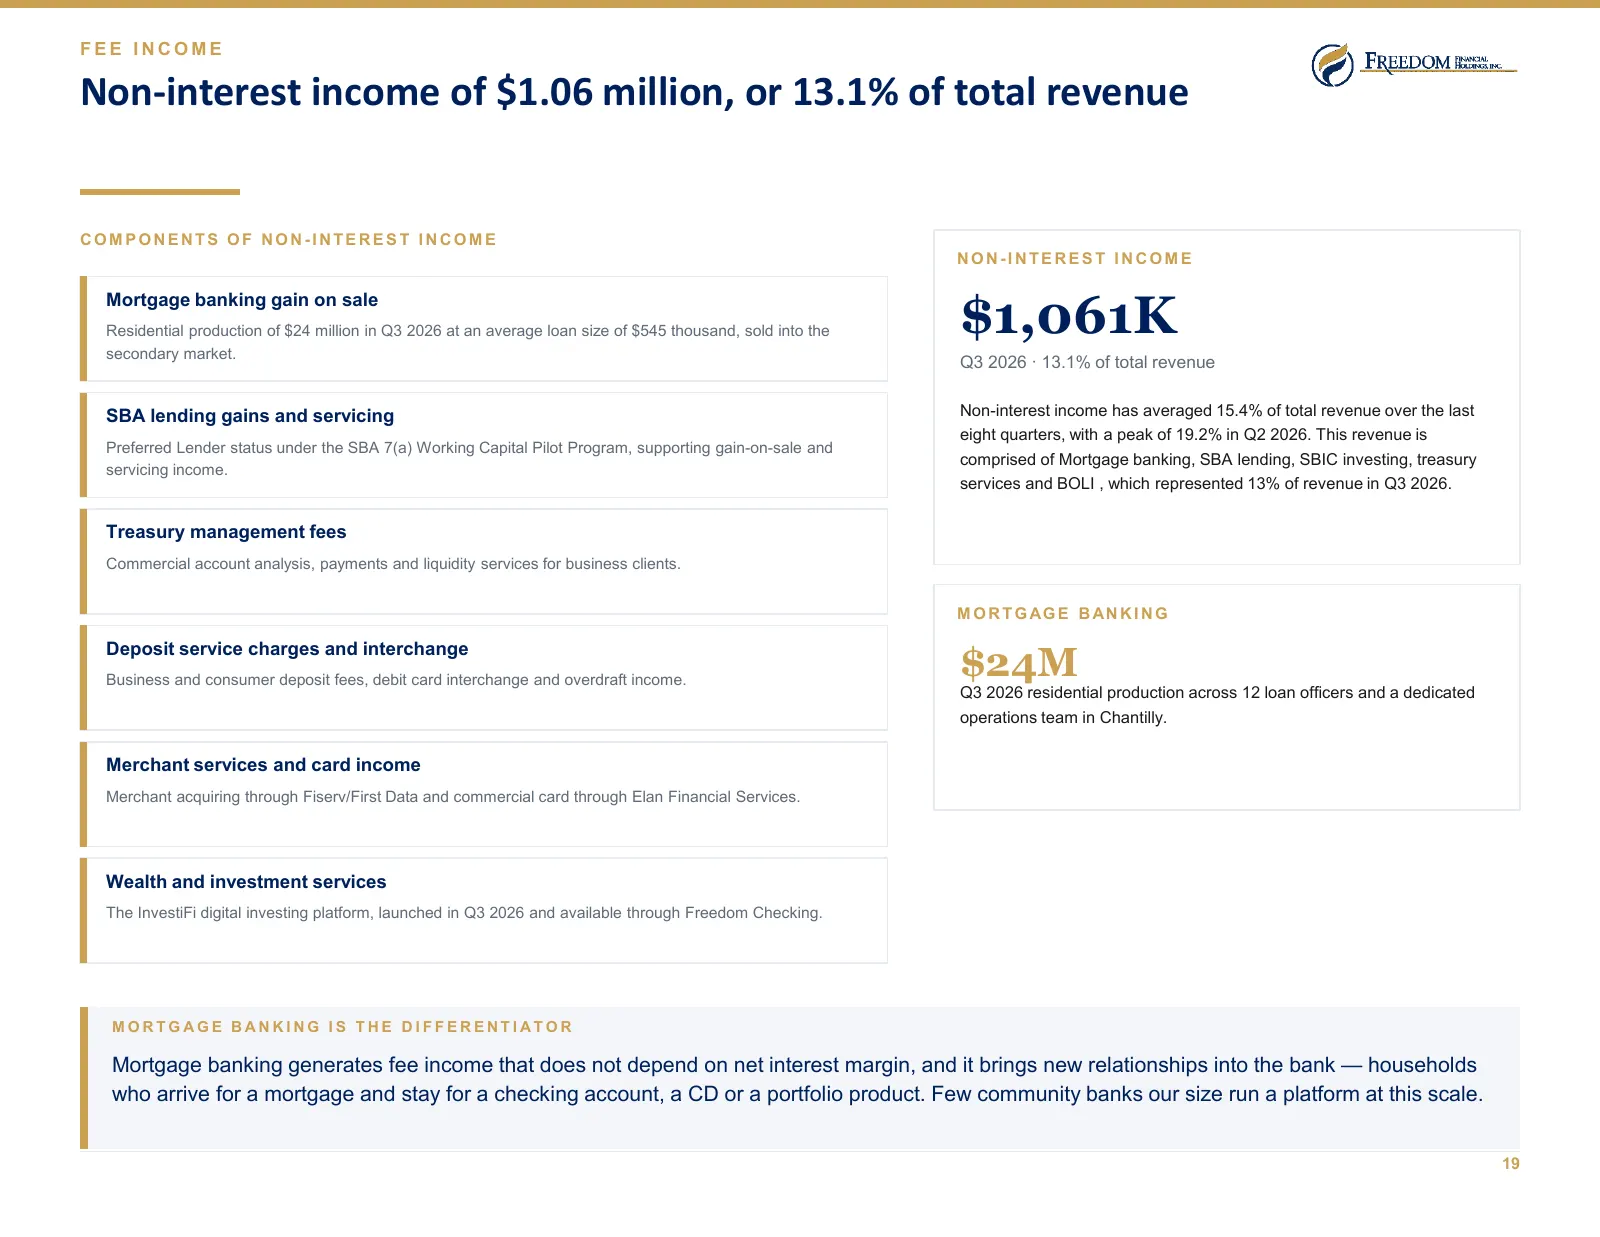
Slide 19: Non-interest income of $1.06 million, or 13.1% of total revenue
FEE INCOME Non-interest income of $1.06 million, or 13.1% of total revenue COMPONENTS OF NON-INTEREST INCOME NON-INTEREST INCOME $1,061K Mortgage banking gain on sale Residential production of $24 million in Q3 2026 at an average loan size of $545 thousand, sold into the secondary market. Q3 2026 ·
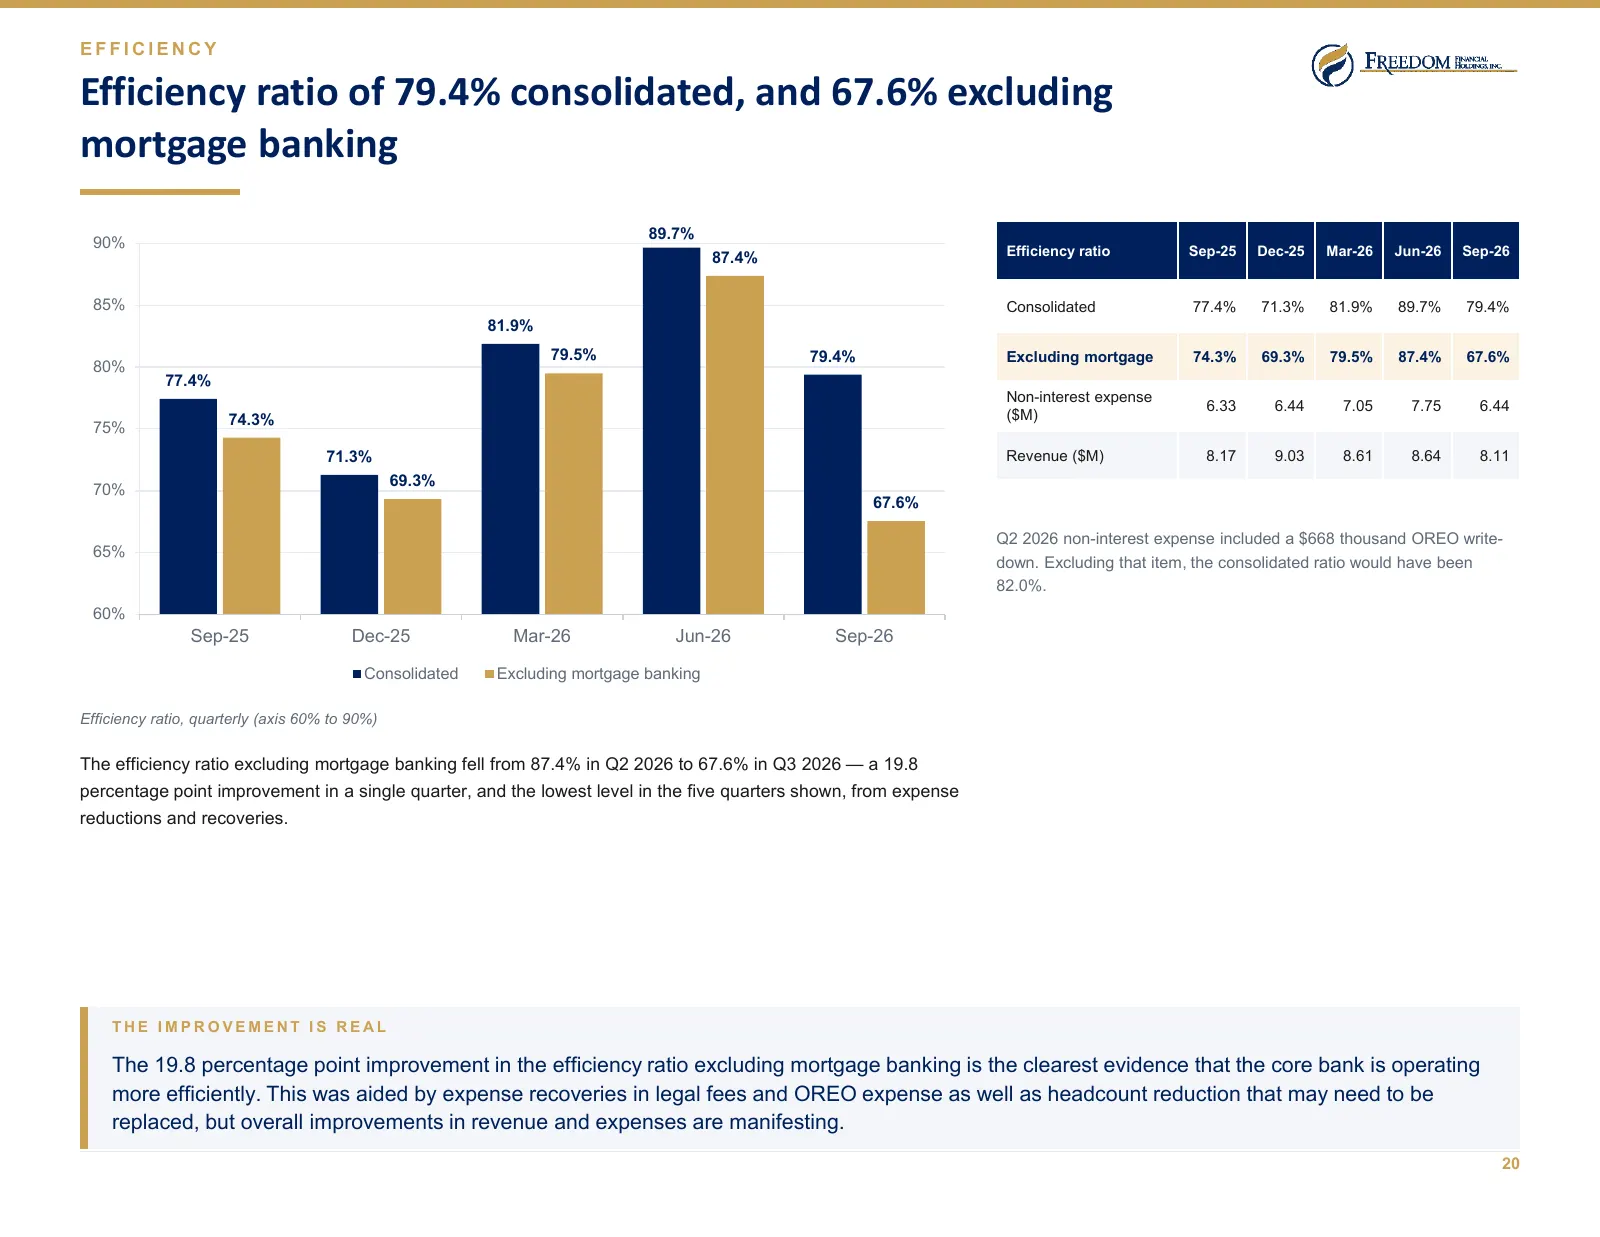
Slide 20: Efficiency ratio of 79.4% consolidated, and 67.6% excluding mortgage banking
EFFICIENCY Efficiency ratio of 79.4% consolidated, and 67.6% excluding mortgage banking 89.7% 90% 87.4% Efficiency ratio Sep-25 Dec-25 Mar-26 Jun-26 Sep-26 85% Consolidated 77.4% 71.3% 81.9% 89.7% 79.4% 81.9% 79.5% 79.4% Excluding mortgage 74.3% 69.3% 79.5% 87.4% 67.6% 80% 77.4% Non-interest expense
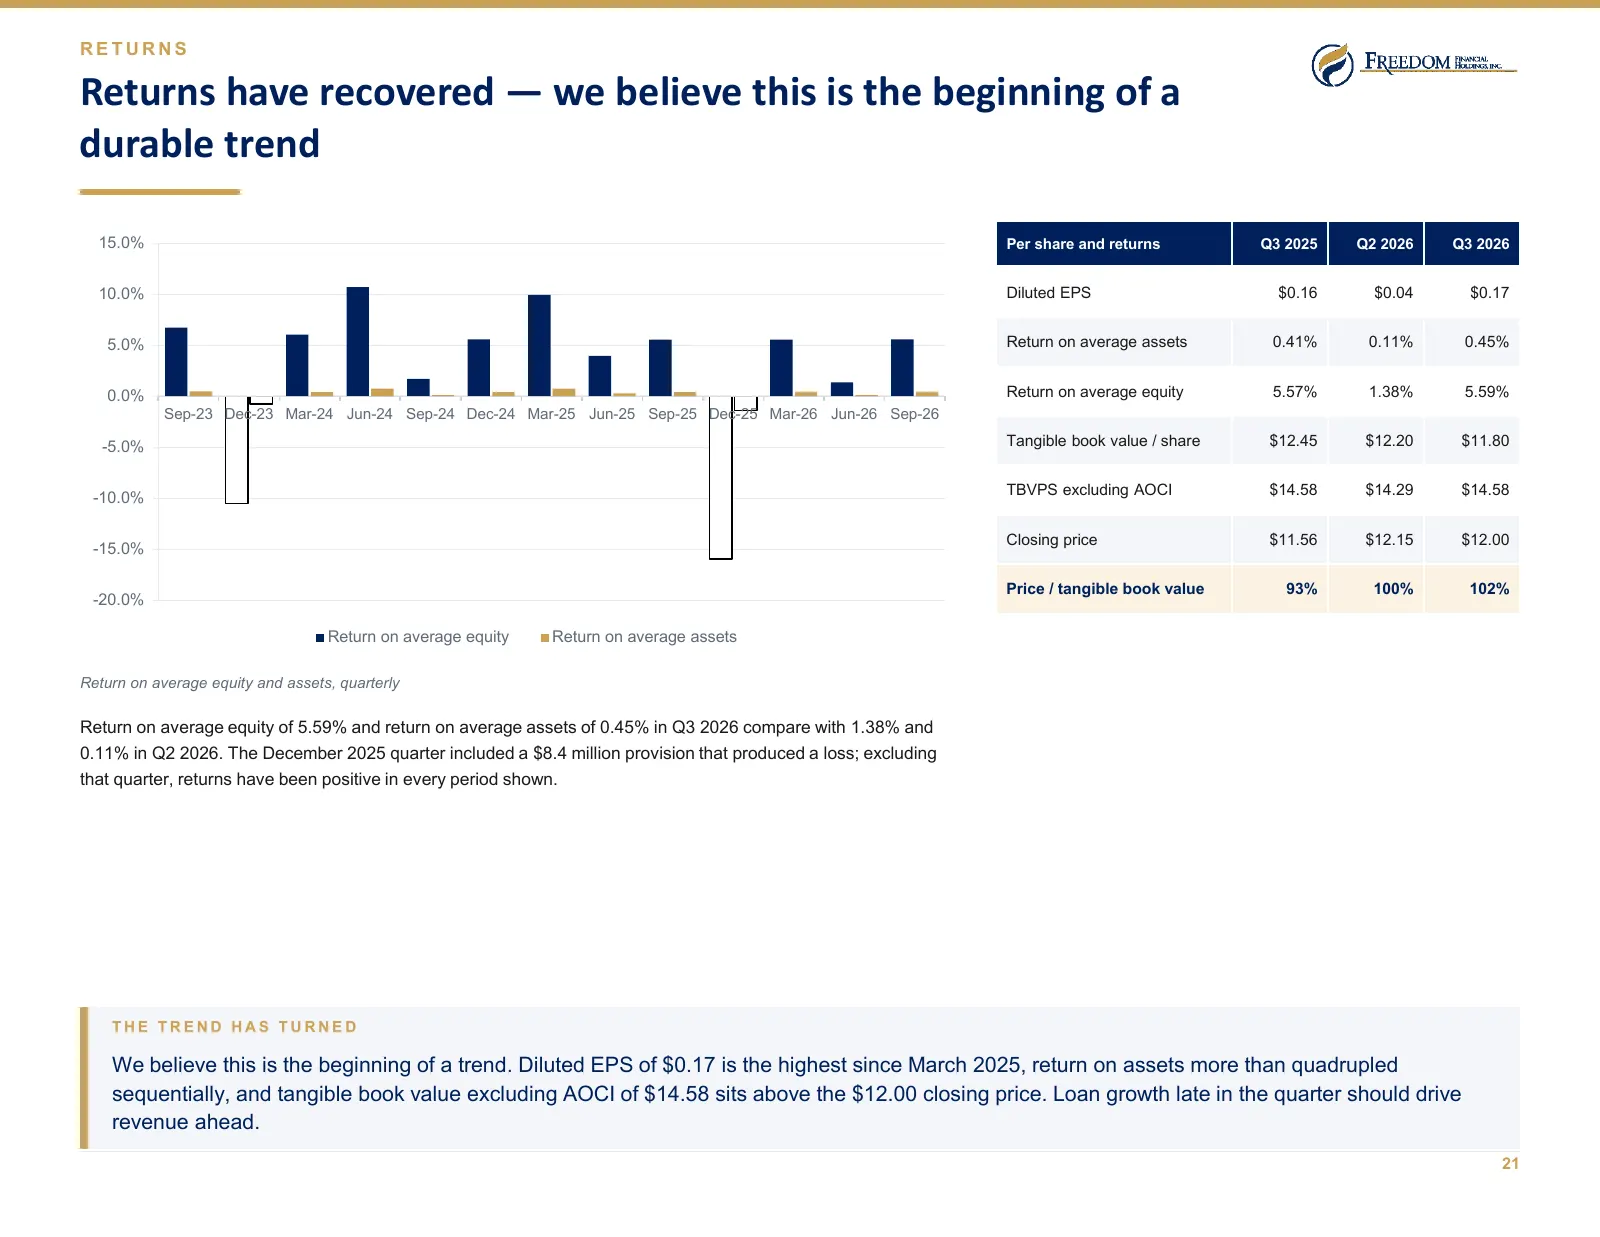
Slide 21: Returns have recovered — we believe this is the beginning of a durable trend
RETURNS Returns have recovered — we believe this is the beginning of a durable trend 15.0% Per share and returns Q3 2025 Q2 2026 Q3 2026 10.0% Diluted EPS $0.16 $0.04 $0.17 5.0% Return on average assets 0.41% 0.11% 0.45% 0.0% Return on average equity 5.57% 1.38% 5.59% Sep-23 Dec-23 Mar-24 Jun-24 Sep
Slide 22: Credit Quality
03 Credit Quality Transparent disclosure, disciplined underwriting and a portfolio that is migrating in the right direction Freedom Financial Holdings, Inc. · Q3 2026 Investor Presentation 22
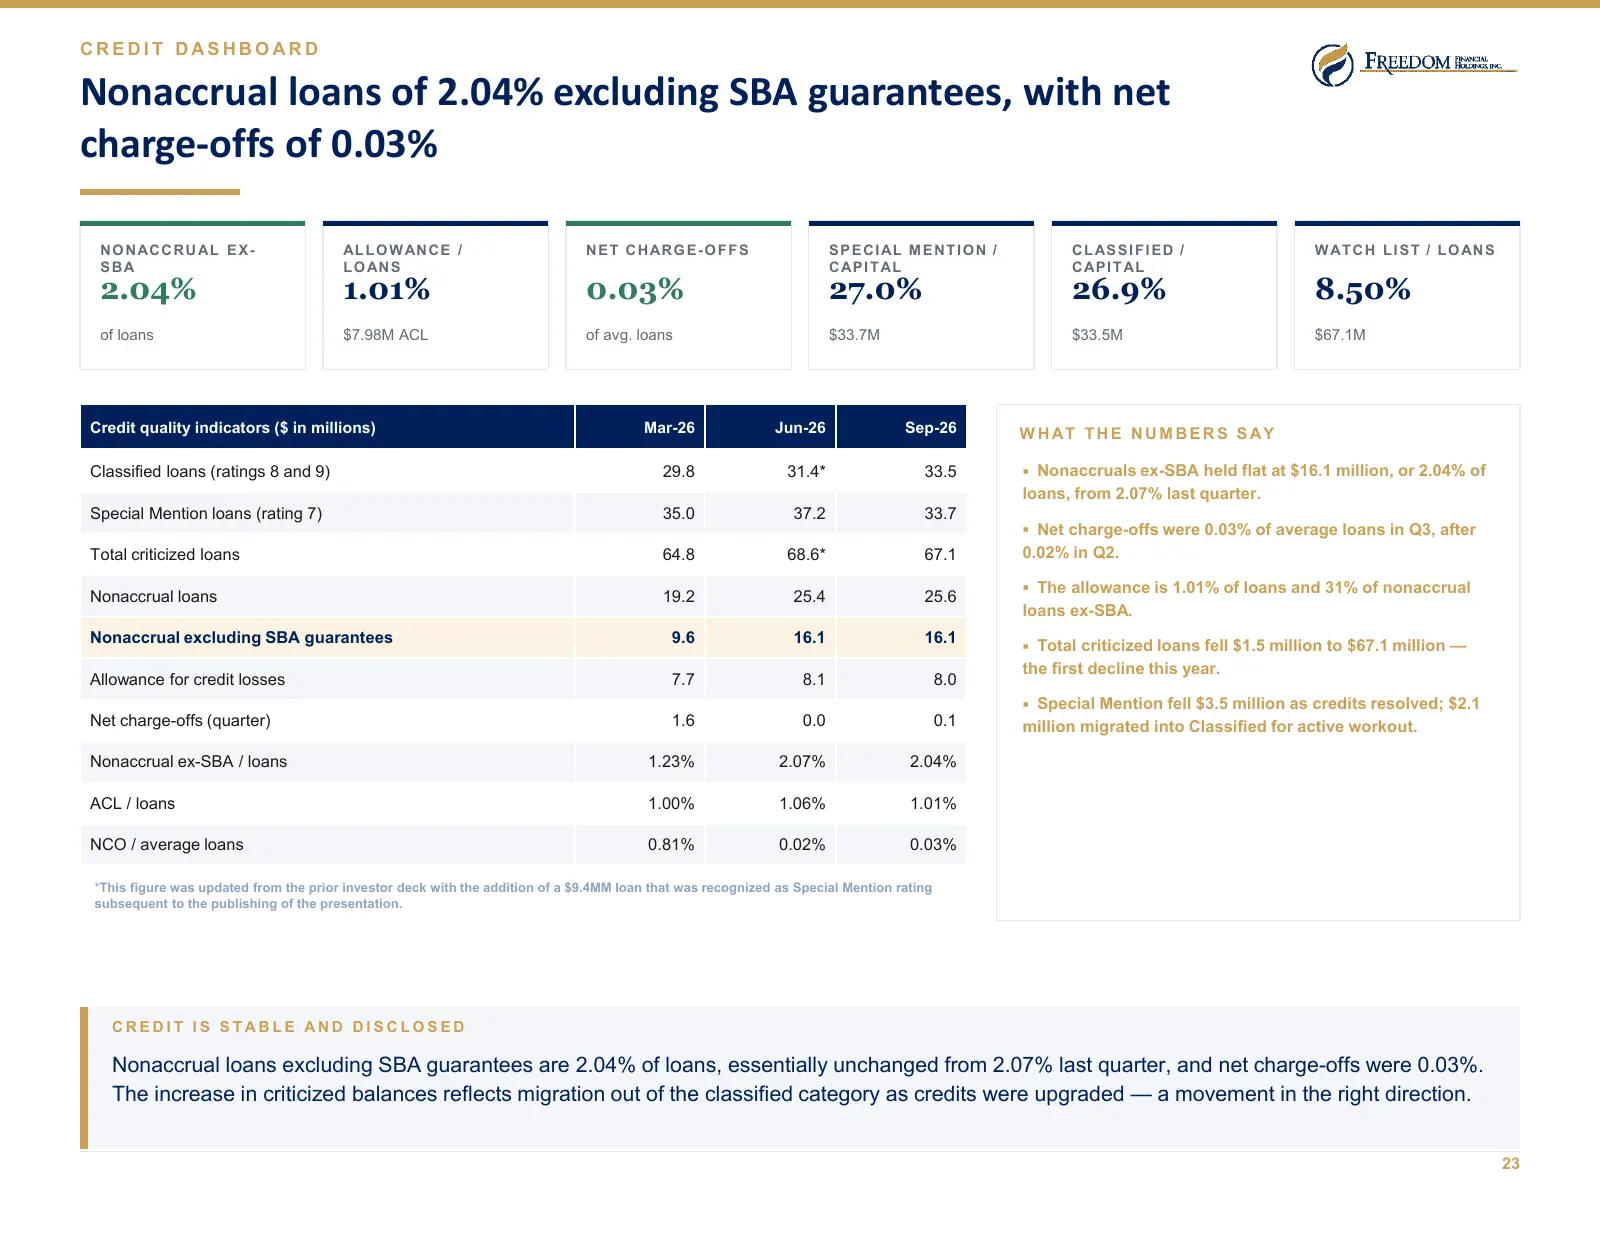
Slide 23: Nonaccrual loans of 2.04% excluding SBA guarantees, with net charge-offs of 0.03%
CREDIT DASHBOARD Nonaccrual loans of 2.04% excluding SBA guarantees, with net charge-offs of 0.03% N O N AC C R U AL E X - AL L O W AN C E / N E T C H AR G E - O F F S S P E C I AL M E N T I O N / C L AS S I F I E D / W AT C H L I S T / L O AN S SBA L O AN S C AP I T AL C AP I T AL 2.04% 1.01% 0.03%
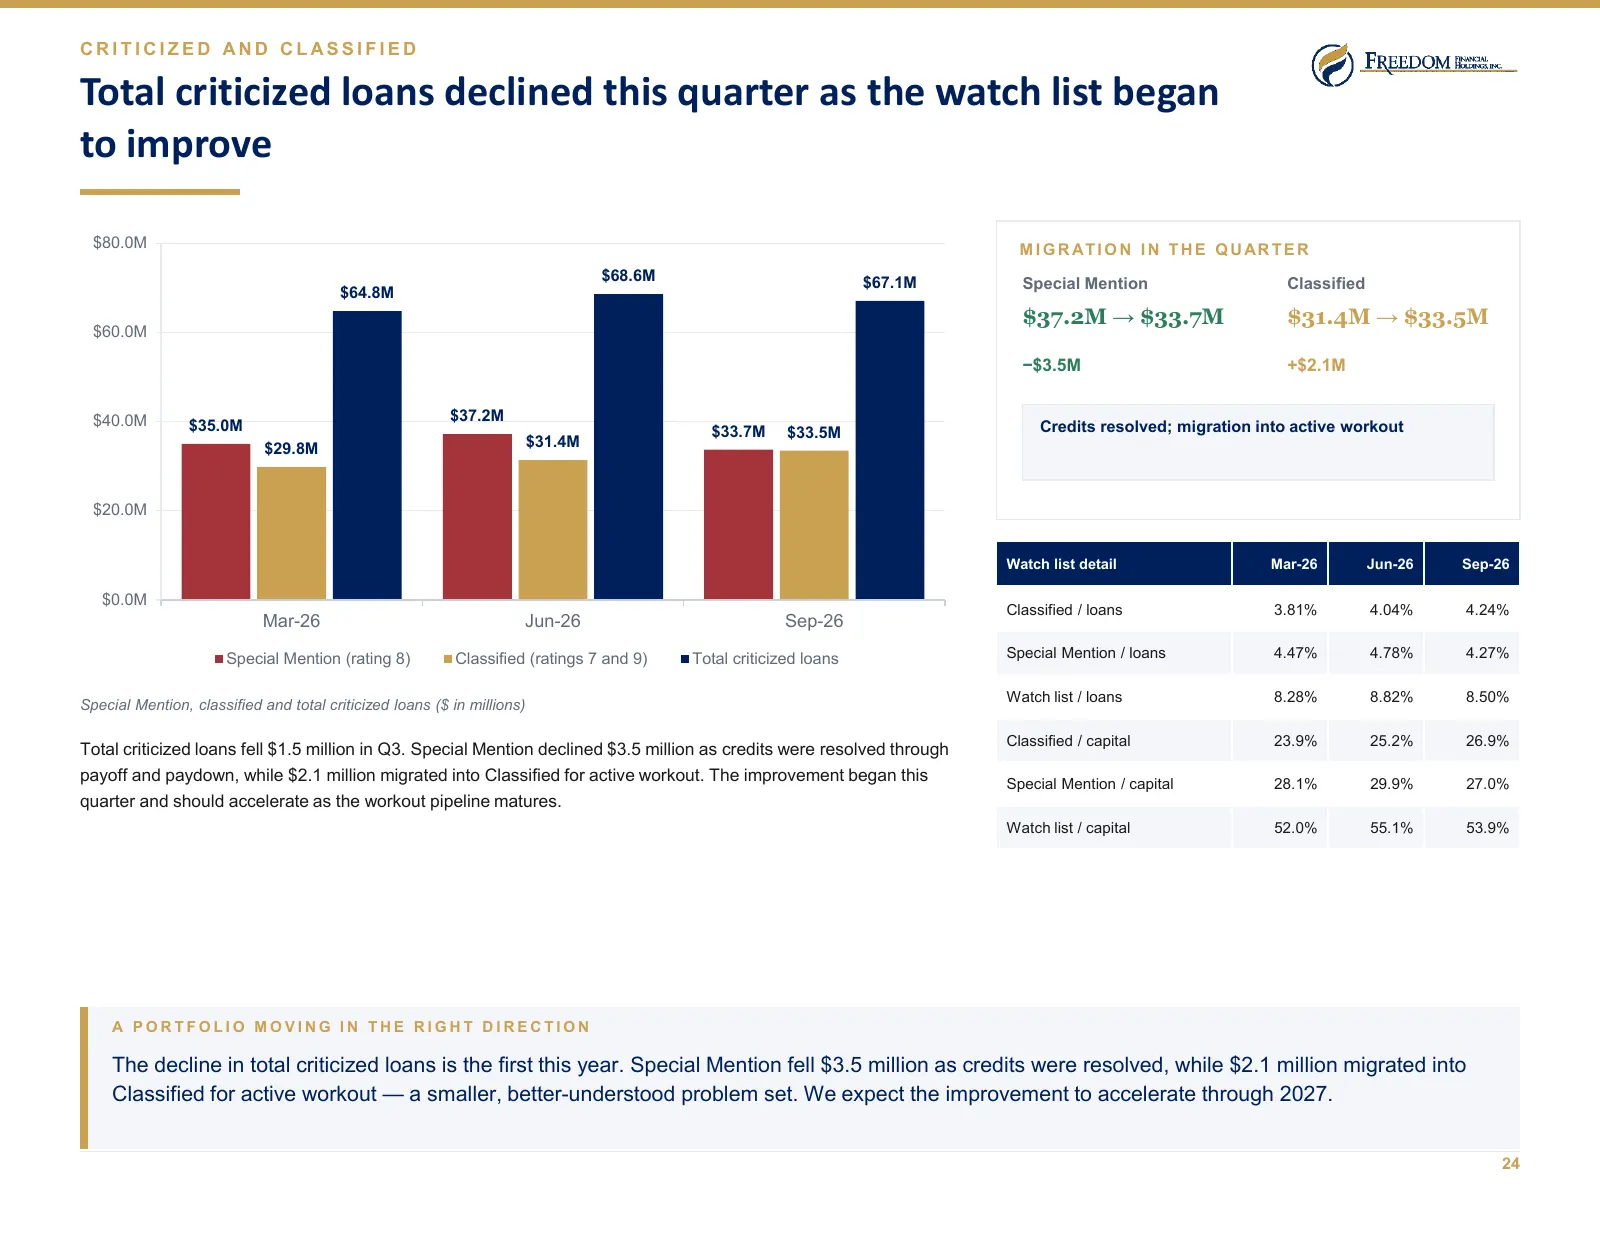
Slide 24: Total criticized loans declined this quarter as the watch list began to improve
CRITICIZED AND CLASSIFIED Total criticized loans declined this quarter as the watch list began to improve $80.0M M I G R AT I O N I N T H E Q U AR T E R $68.6M $67.1M Special Mention Classified $64.8M $37.2M → $33.7M $31.4M → $33.5M $60.0M −$3.5M +$2.1M $40.0M $37.2M $35.0M $33.7M $33.5M Credits res
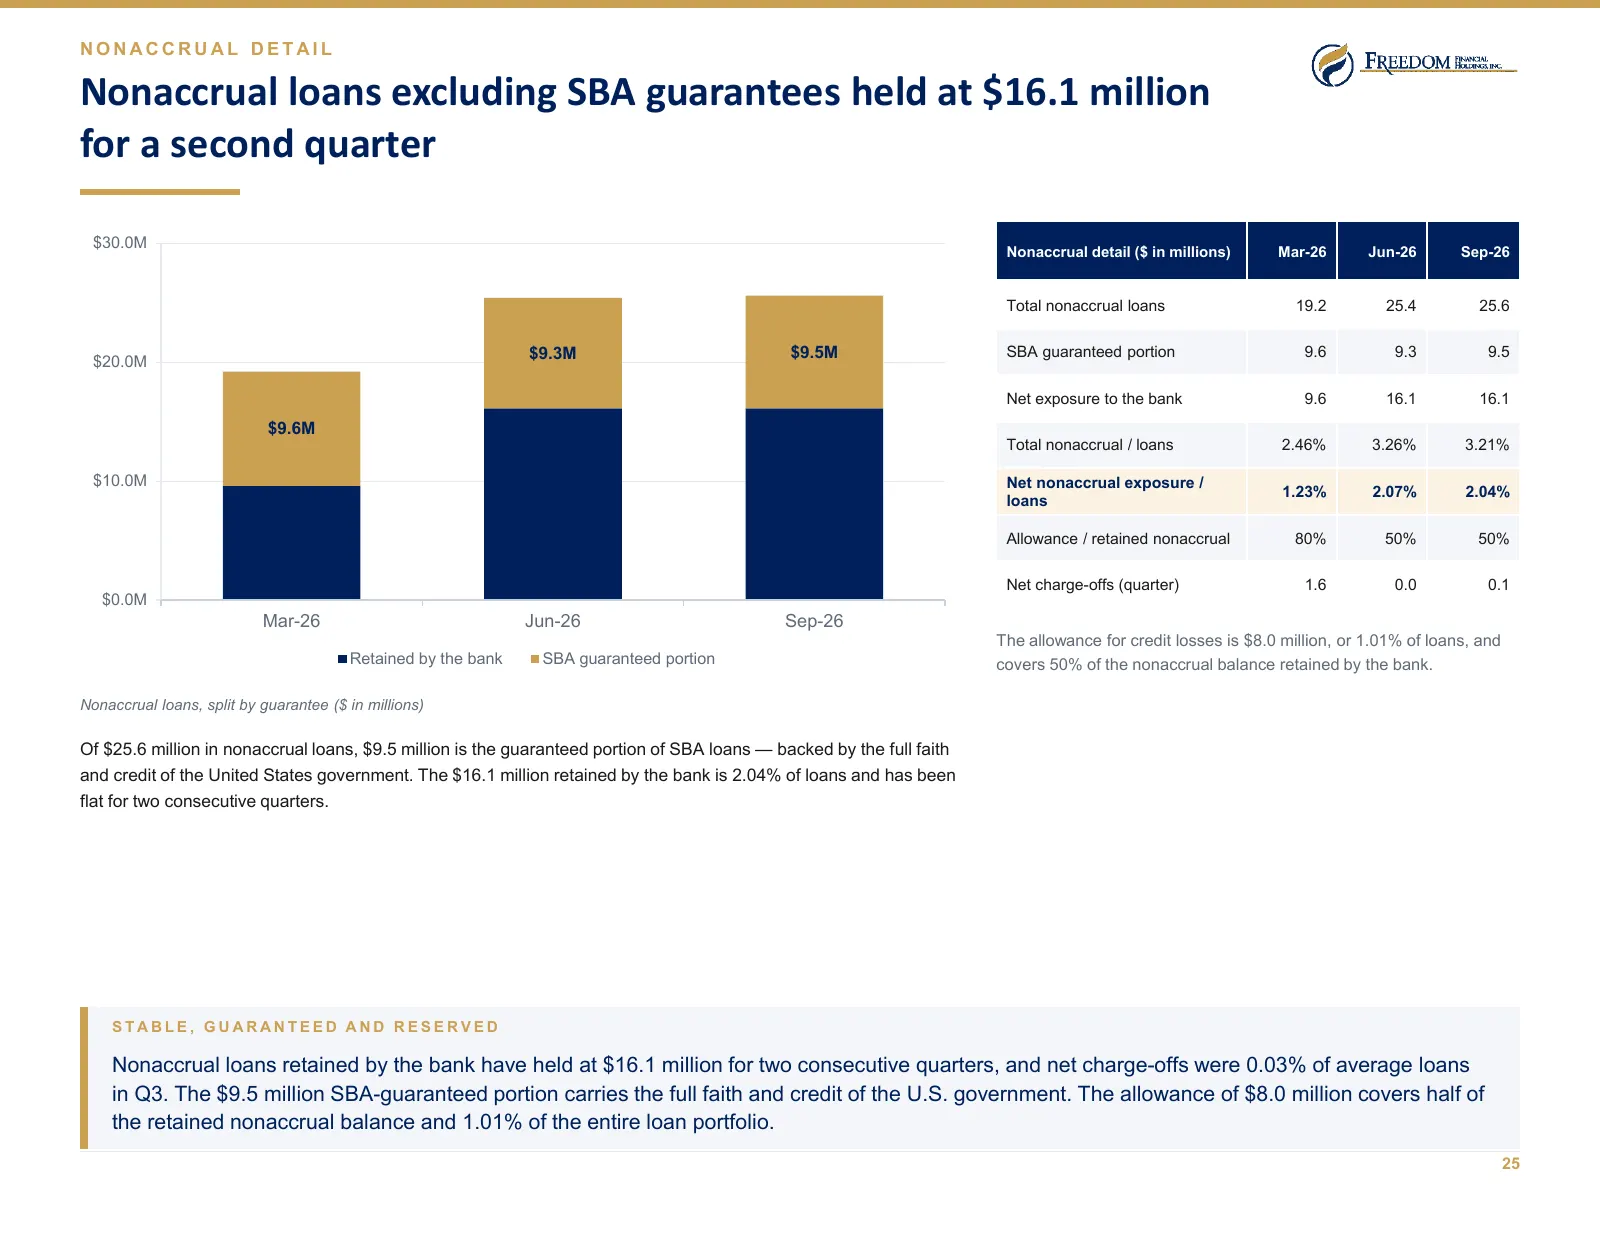
Slide 25: Nonaccrual loans excluding SBA guarantees held at $16.1 million for a second quarter
NONACCRUAL DETAIL Nonaccrual loans excluding SBA guarantees held at $16.1 million for a second quarter $30.0M Nonaccrual detail ($ in millions) Mar-26 Jun-26 Sep-26 Total nonaccrual loans 19.2 25.4 25.6 $9.3M $9.5M SBA guaranteed portion 9.6 9.3 9.5 $20.0M Net exposure to the bank 9.6 16.1 16.1 $9.6
Slide 26: Capital and Liquidity
04 Capital and Liquidity A well-capitalized balance sheet with room to grow the loan book Freedom Financial Holdings, Inc. · Q3 2026 Investor Presentation 26
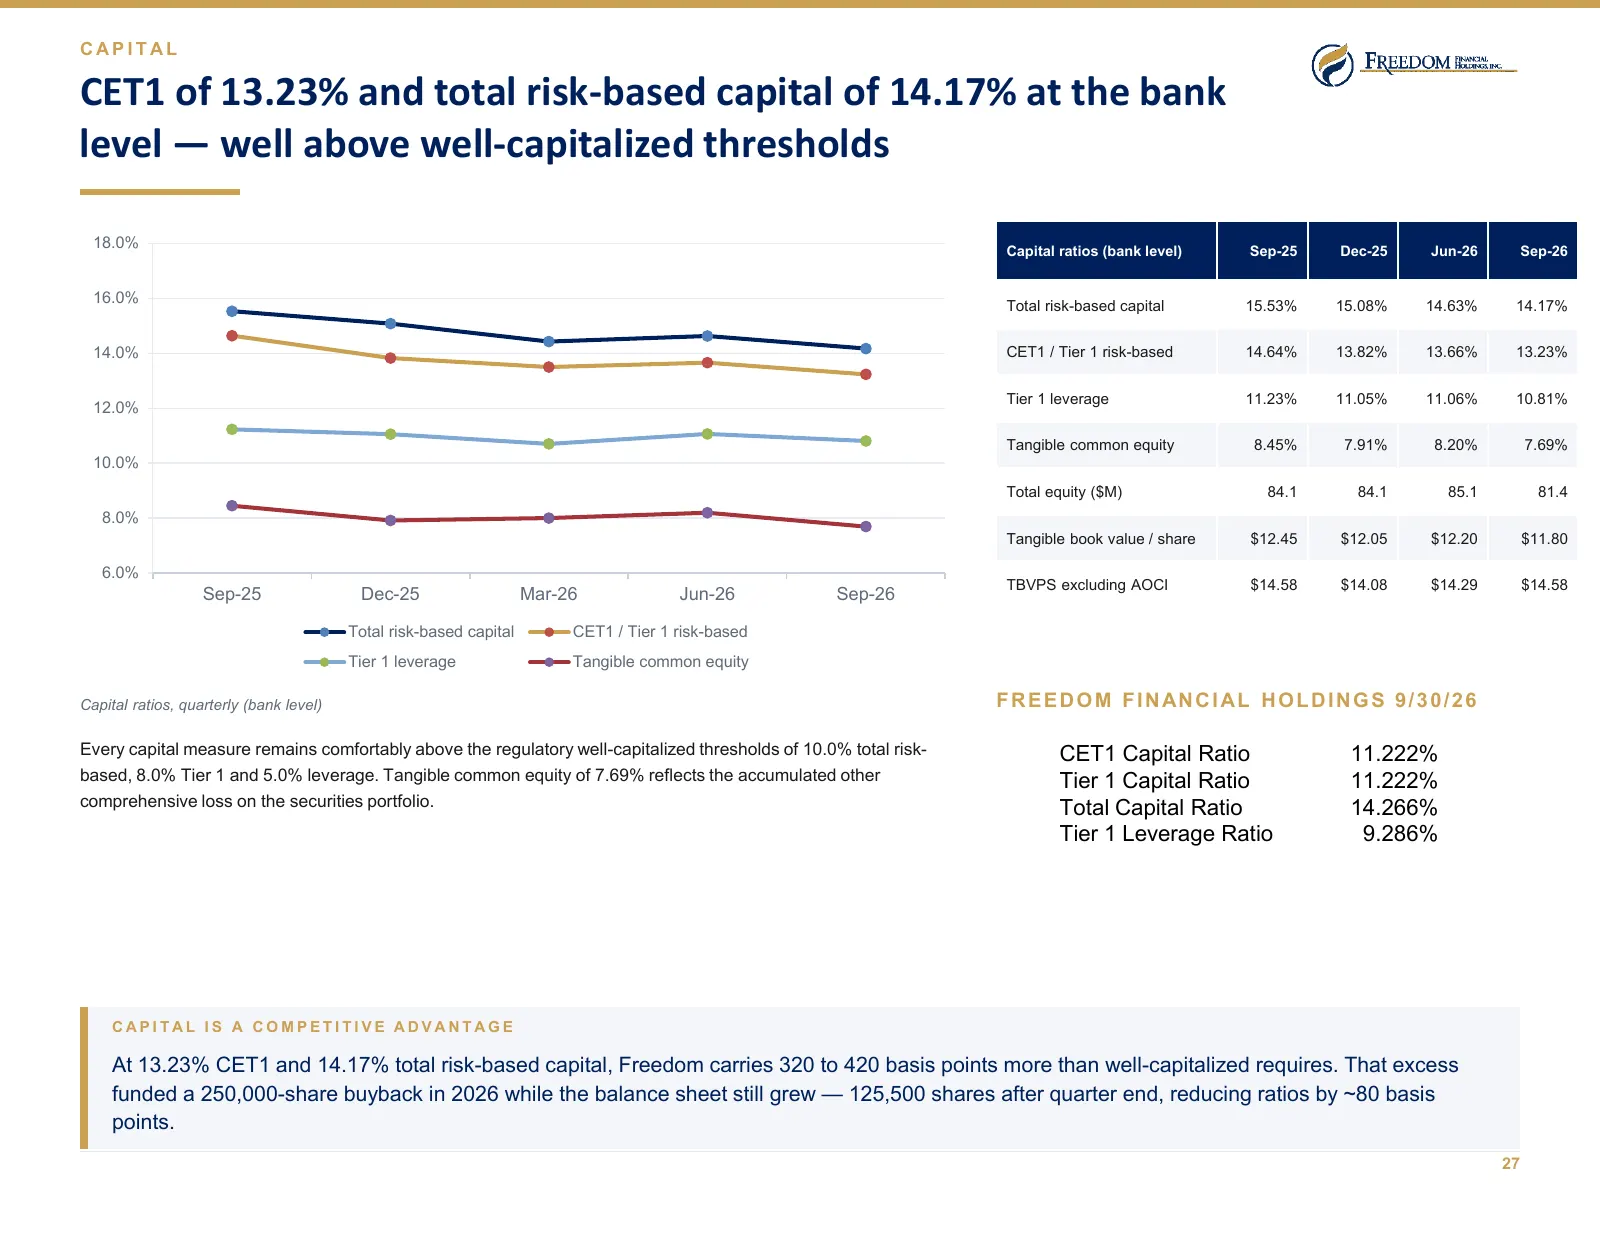
Slide 27: CET1 of 13.23% and total risk-based capital of 14.17% at the bank level
CAPITAL CET1 of 13.23% and total risk-based capital of 14.17% at the bank level — well above well-capitalized thresholds 18.0% Capital ratios (bank level) Sep-25 Dec-25 Jun-26 Sep-26 16.0% Total risk-based capital 15.53% 15.08% 14.63% 14.17% 14.0% CET1 / Tier 1 risk-based 14.64% 13.82% 13.66% 13.23%
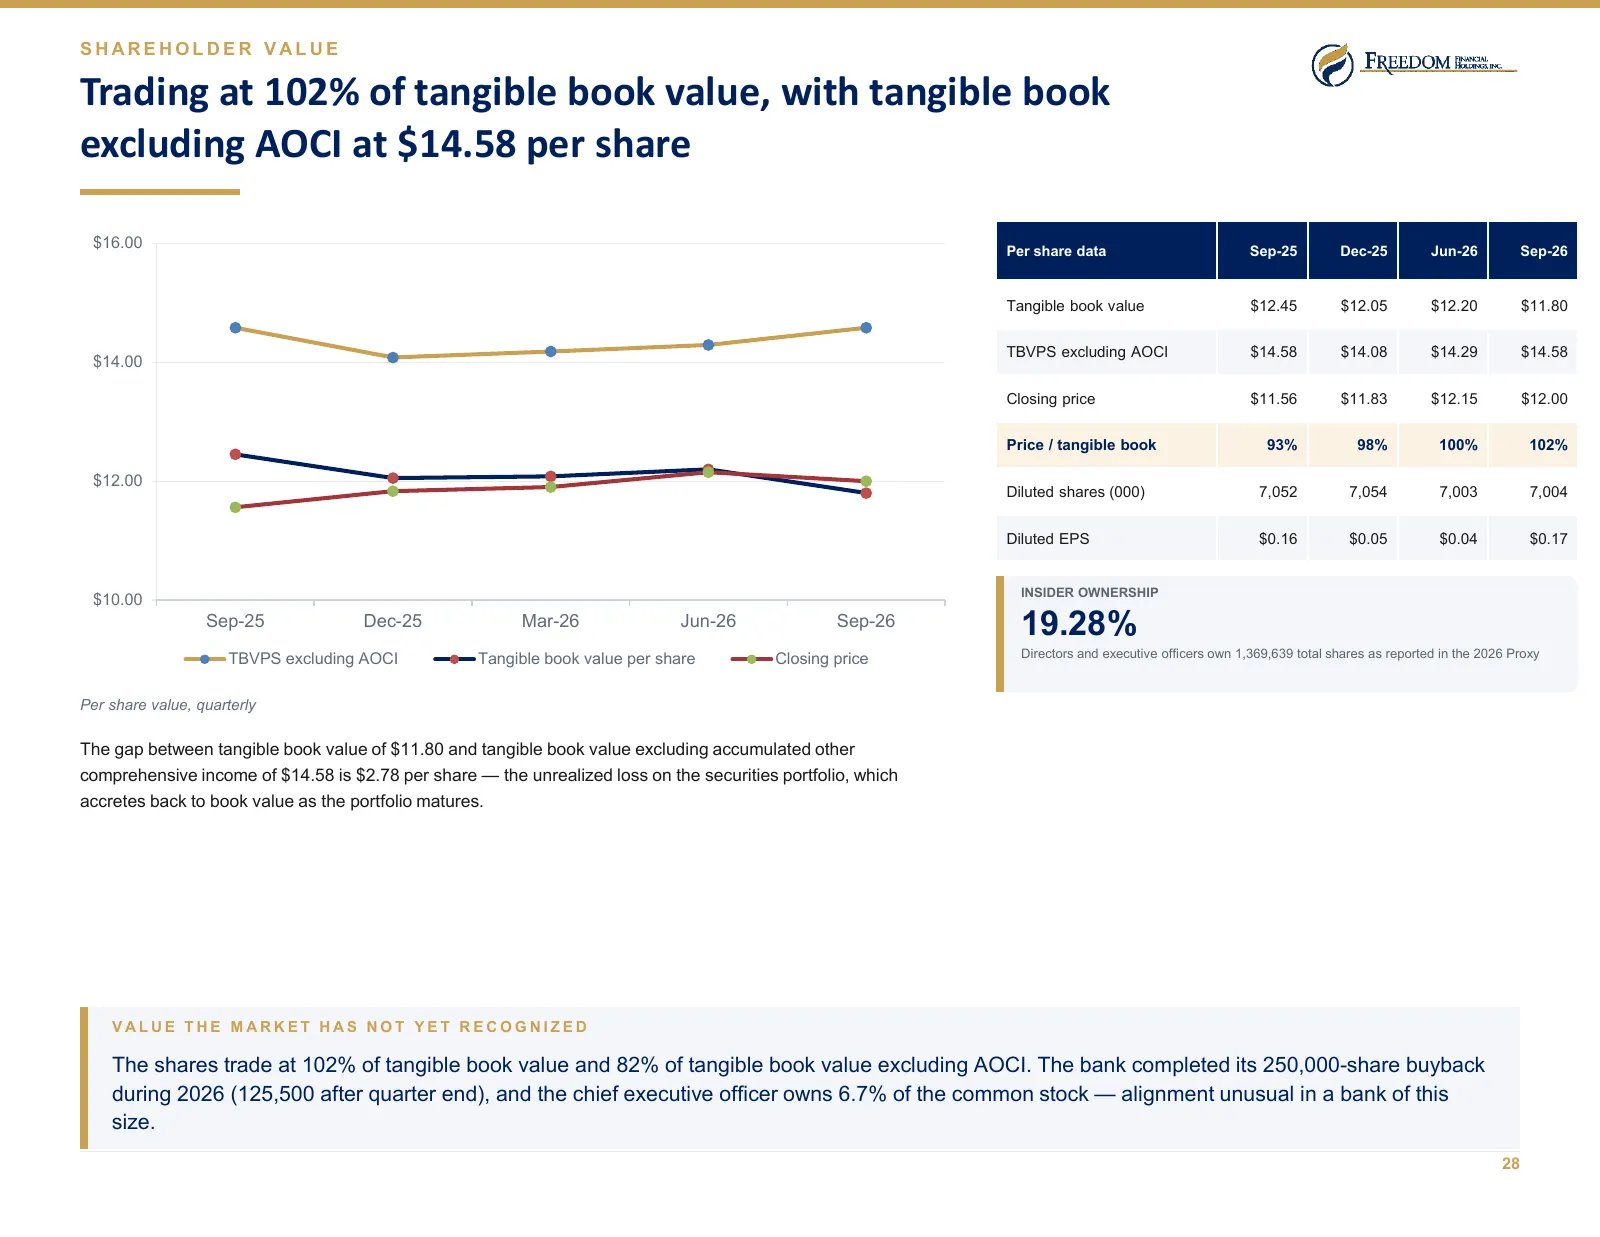
Slide 28: Trading at 102% of tangible book value, with tangible book excluding AOCI at $14.58 per share
SHAREHOLDER VALUE Trading at 102% of tangible book value, with tangible book excluding AOCI at $14.58 per share $16.00 Per share data Sep-25 Dec-25 Jun-26 Sep-26 Tangible book value $12.45 $12.05 $12.20 $11.80 TBVPS excluding AOCI $14.58 $14.08 $14.29 $14.58 $14.00 Closing price $11.56 $11.83 $12.15
Slide 29: Valuation and Outlook
05 Valuation and Outlook How Freedom compares, and where the plan takes the franchise Freedom Financial Holdings, Inc. · Q3 2026 Investor Presentation 29
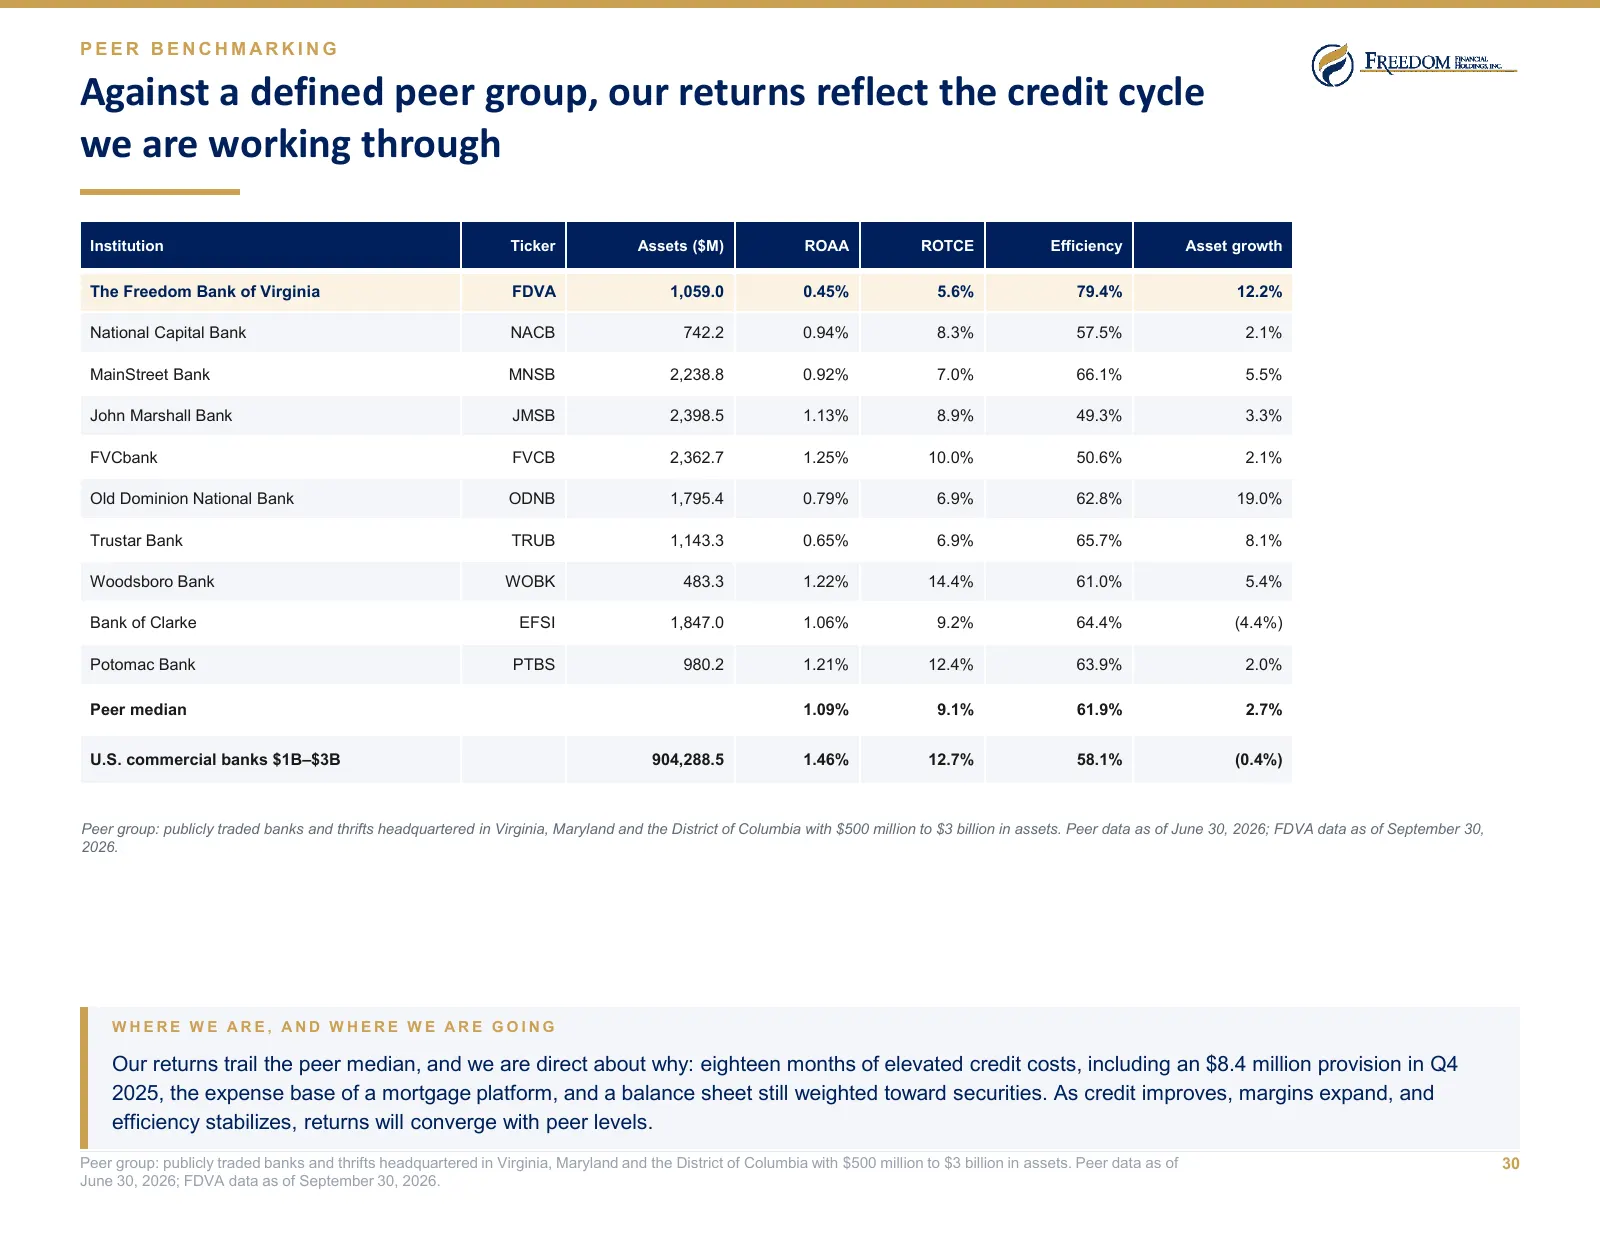
Slide 30: Against a defined peer group, our returns reflect the credit cycle we are working through
PEER BENCHMARKING Against a defined peer group, our returns reflect the credit cycle we are working through Institution Ticker Assets ($M) ROAA ROTCE Efficiency Asset growth The Freedom Bank of Virginia FDVA 1,059.0 0.45% 5.6% 79.4% 12.2% National Capital Bank NACB 742.2 0.94% 8.3% 57.5% 2.1% MainSt
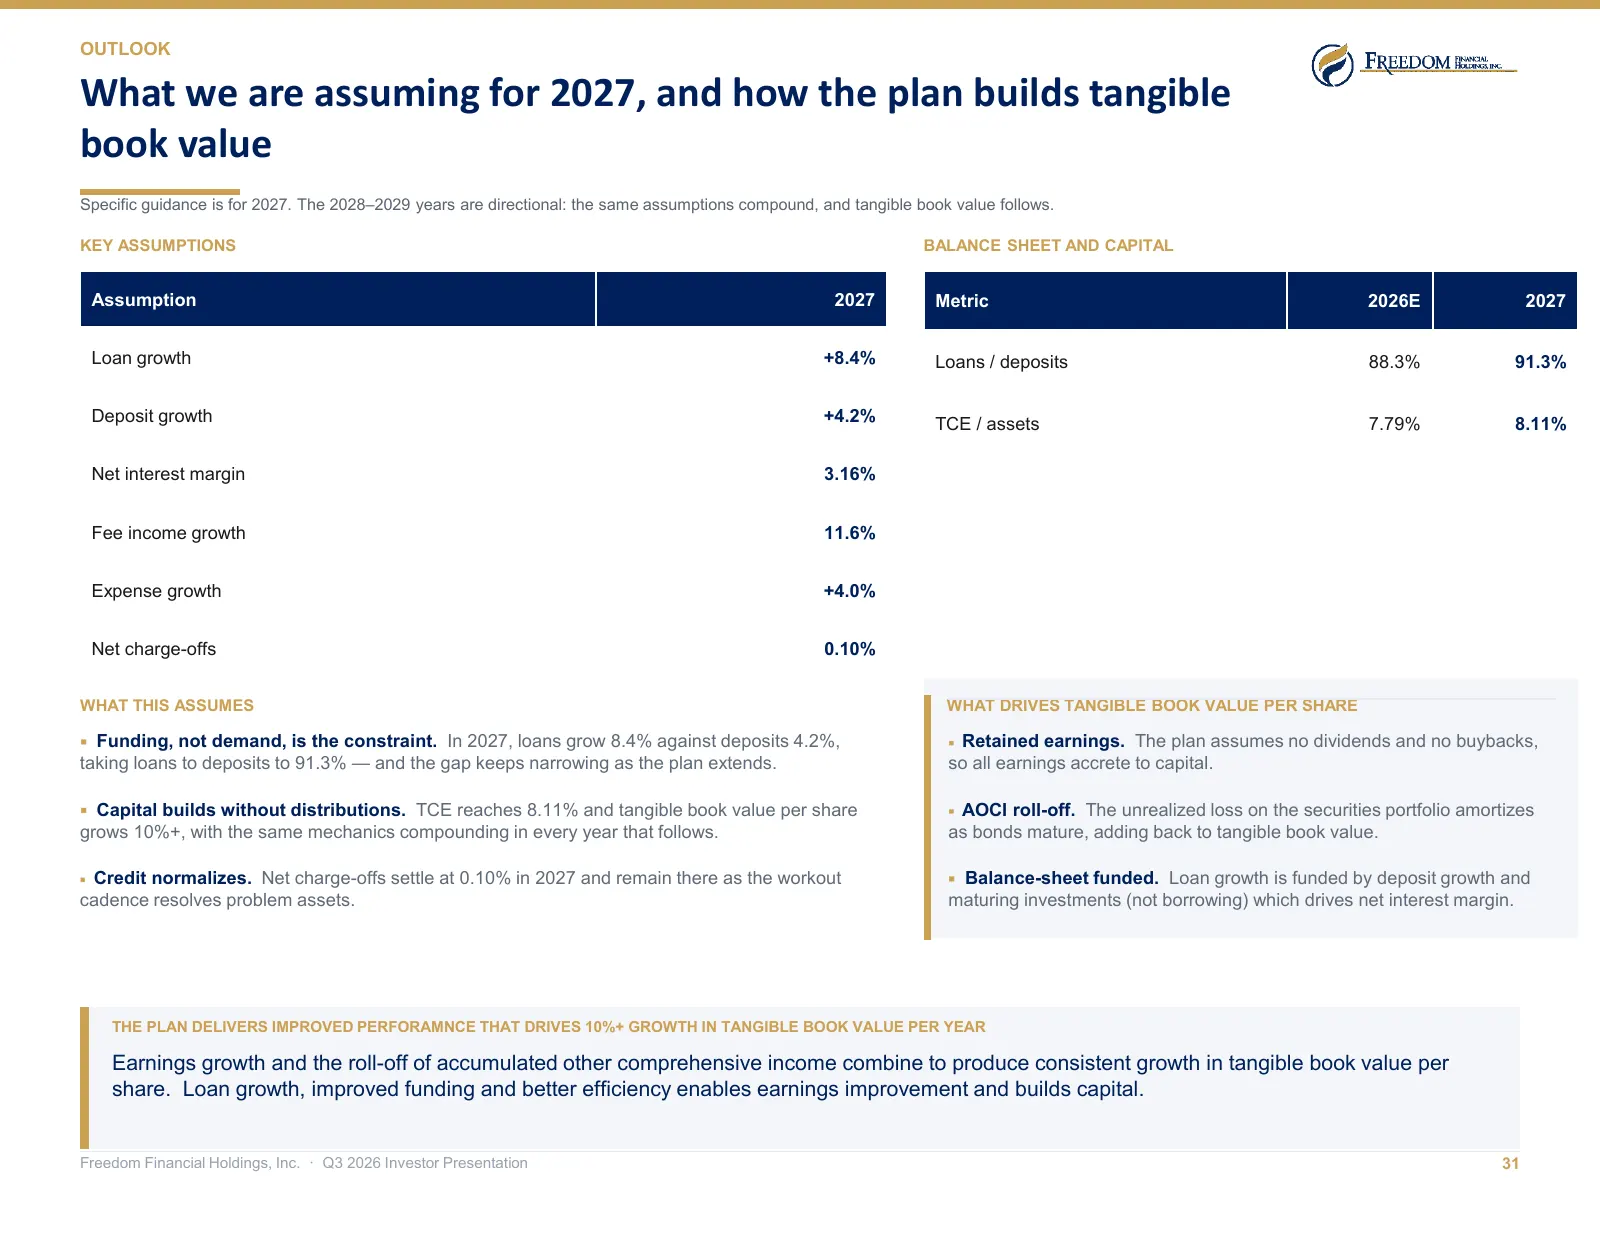
Slide 31: What we are assuming for 2027, and how the plan builds tangible book value
OUTLOOK What we are assuming for 2027, and how the plan builds tangible book value Specific guidance is for 2027. The 2028–2029 years are directional: the same assumptions compound, and tangible book value follows. KEY ASSUMPTIONS BALANCE SHEET AND CAPITAL Assumption 2027 Metric 2026E 2027 Loan grow
Slide 32: Questions and discussion
THANK YOU Questions and discussion Joseph J. Thomas Scott B. Clark President & Chief Executive Officer SEVP & Chief Financial Officer OTCQX: FDVA 1750 Tysons Blvd, Suite 240 McLean, VA 22102 Freedom Financial Holdings, Inc.
Source: company website
More decks from Freedom Financial Holdings Inc
 Q2 2026 Earnings Presentation31 slides · Aug 3, 2026
 Shareholder Meeting (April 2026)41 slides · Apr 30, 2026
 Q4 2025 Earnings Presentation39 slides · Jan 30, 2026
 Q3 2025 Earnings Presentation39 slides · Oct 31, 2025
 Q2 2025 Earnings Presentation38 slides · Aug 4, 2025
 Shareholder Meeting (May 2025)39 slides · May 6, 2025