AssetMark Financial Holdings Inc
AssetMark Financial — Investor Presentation (December 2021)
37 slides from AssetMark Financial's investor presentation, Dec 3, 2021
Slide 1: Investor Presentation December 2021
Investor Presentation December 2021 Exhibit 99.1
Slide 2: Forward looking statements and non-GAAP financial measures
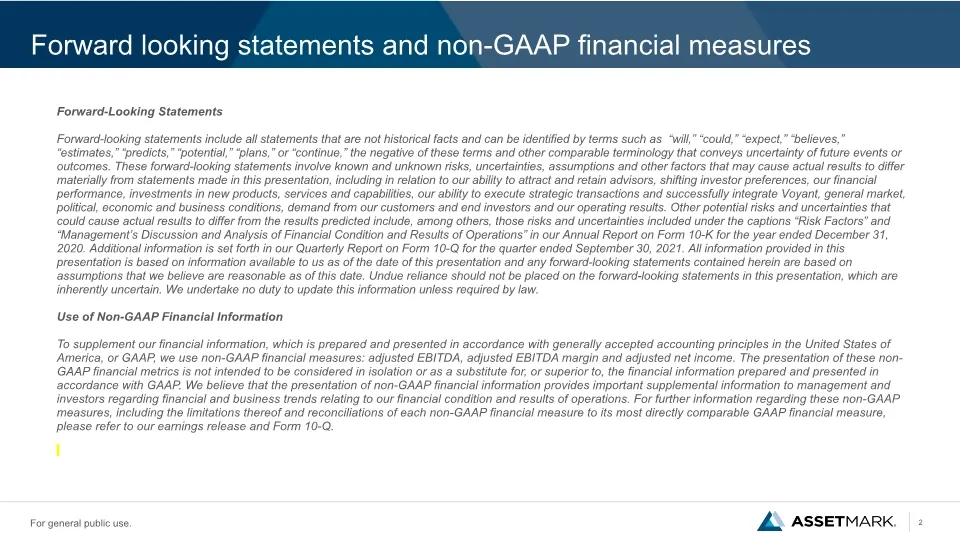
Forward looking statements and non-GAAP financial measures Forward-Looking Statements Forward-looking statements include all statements that are not historical facts and can be identified by terms such as “will,” “could,” “expect,” “believes,” “estimates,” “predicts,” “potential,” “plans,” or “conti
Slide 3: Contents
Contents Opportunity Highlights Market Overview Company Overview Financial Overview Appendix
Slide 4: AssetMark is a leading provider of comprehensive wealth management solutions focused on helping advisors grow
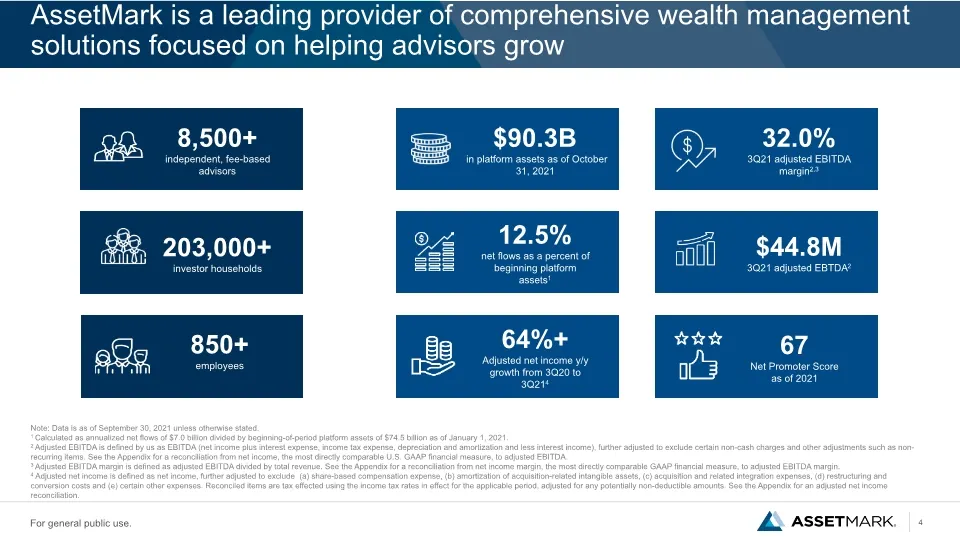
AssetMark is a leading provider of comprehensive wealth management solutions focused on helping advisors grow Note: Data is as of September 30, 2021 unless otherwise stated. 1 Calculated as annualized net flows of $7.0 billion divided by beginning-of-period platform assets of $74.5 billion as of Jan
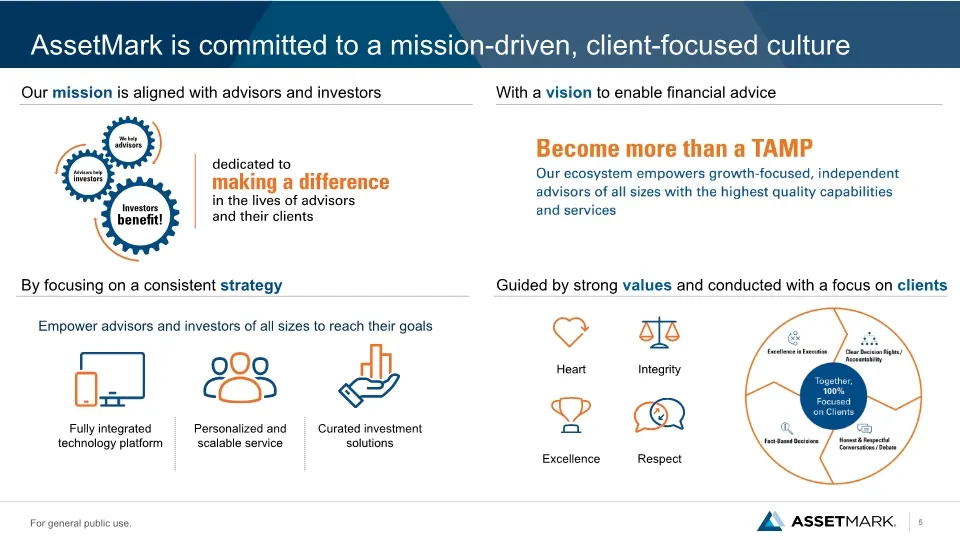
Slide 5: AssetMark is committed to a mission-driven, client-focused culture
AssetMark is committed to a mission-driven, client-focused culture Our mission is aligned with advisors and investors With a vision to enable financial advice By focusing on a consistent strategy Guided by strong values and conducted with a focus on clients Empower advisors and investors of all size
Slide 6: Contents
Contents Opportunity Highlights Market Overview Company Overview Financial Overview Appendix
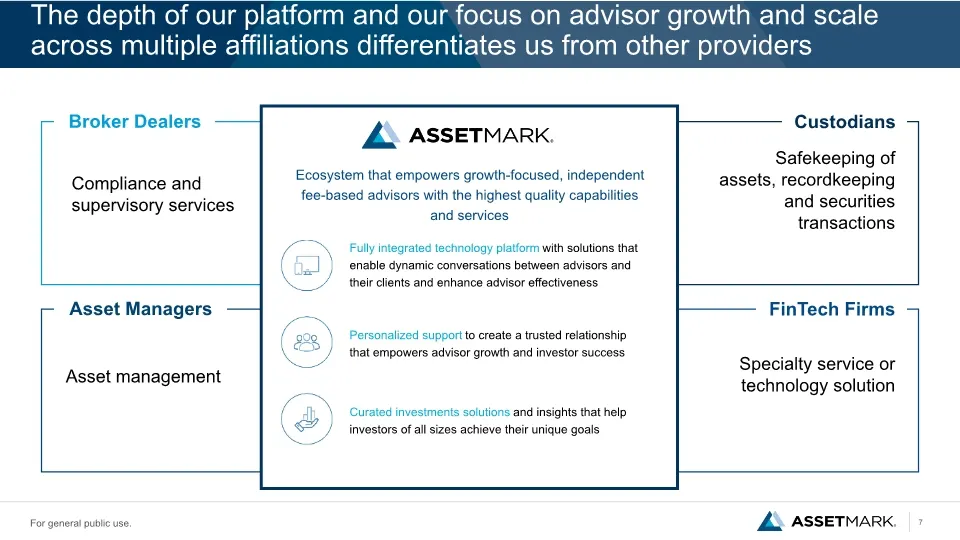
Slide 7: Depth of our platform and focus on advisor growth differentiates us from other providers
The depth of our platform and our focus on advisor growth and scale across multiple affiliations differentiates us from other providers Broker Dealers Asset Managers Custodians FinTech Firms Ecosystem that empowers growth-focused, independent fee-based advisors with the highest quality capabilities
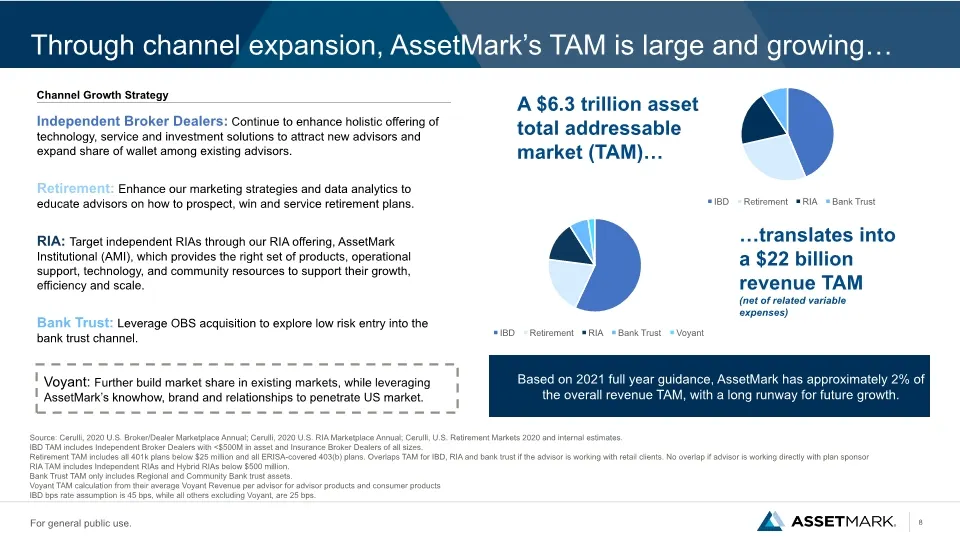
Slide 8: Through channel expansion, AssetMark's TAM is large and growing
Through channel expansion, AssetMark’s TAM is large and growing… Source: Cerulli, 2020 U.S. Broker/Dealer Marketplace Annual; Cerulli, 2020 U.S. RIA Marketplace Annual; Cerulli, U.S. Retirement Markets 2020 and internal estimates. IBD TAM includes Independent Broker Dealers with <$500M in asset and
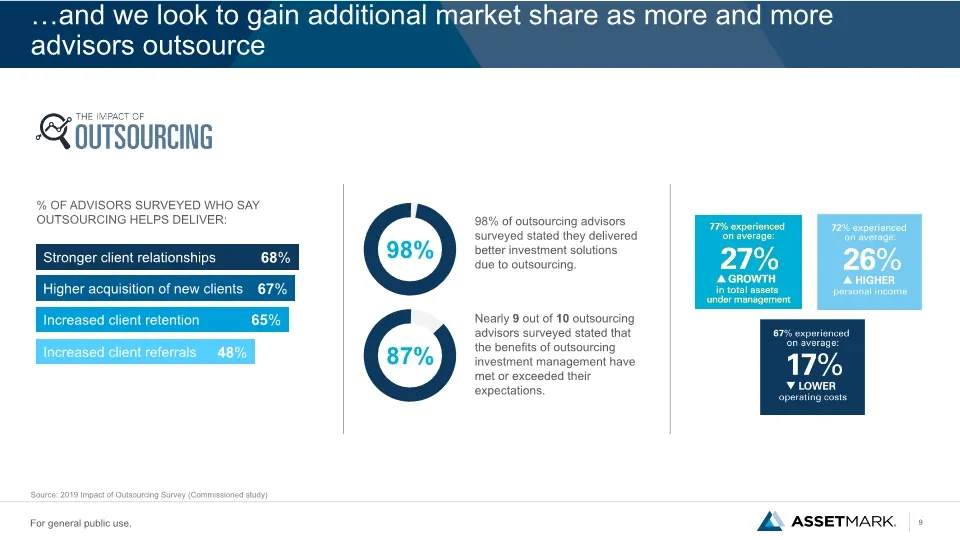
Slide 9: We look to gain additional market share as more advisors outsource
…and we look to gain additional market share as more and more advisors outsource Stronger client relationships Higher acquisition of new clients Increased client retention Increased client referrals 48% 65% 67% 68% 98% of outsourcing advisors surveyed stated they delivered better investment solution
Slide 10: Contents
Contents Opportunity Highlights Market Overview Company Overview Financial Overview Appendix
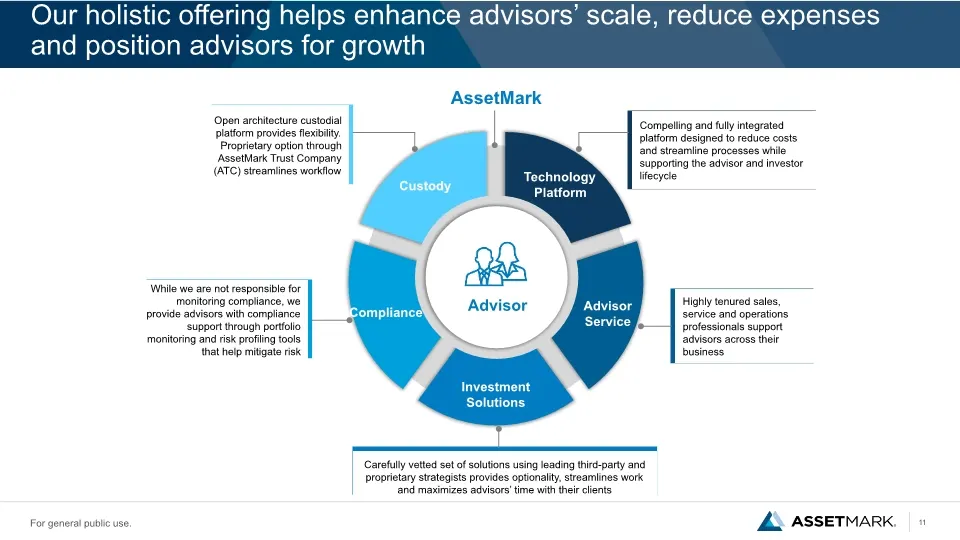
Slide 11: Our holistic offering helps enhance advisors' scale, reduce expenses and position for growth
Our holistic offering helps enhance advisors’ scale, reduce expenses and position advisors for growth AssetMark Compelling and fully integrated platform designed to reduce costs and streamline processes while supporting the advisor and investor lifecycle Technology Platform Advisor Service Investmen
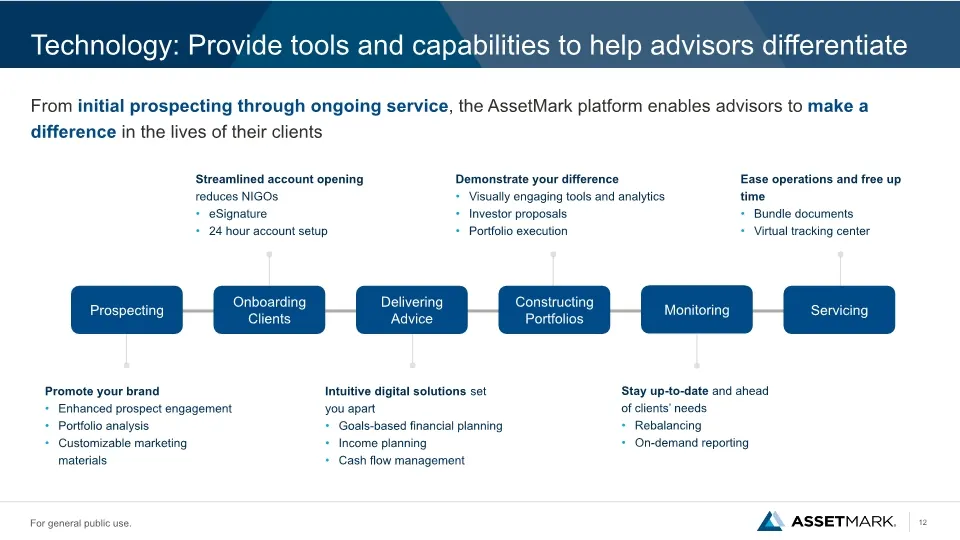
Slide 12: Technology: Provide tools and capabilities to help advisors differentiate
Technology: Provide tools and capabilities to help advisors differentiate Promote your brand Enhanced prospect engagement Portfolio analysis Customizable marketing materials From initial prospecting through ongoing service, the AssetMark platform enables advisors to make a difference in the lives of
Slide 13: Service: Multi-faceted support structure fosters deep and lasting relationships with advisors
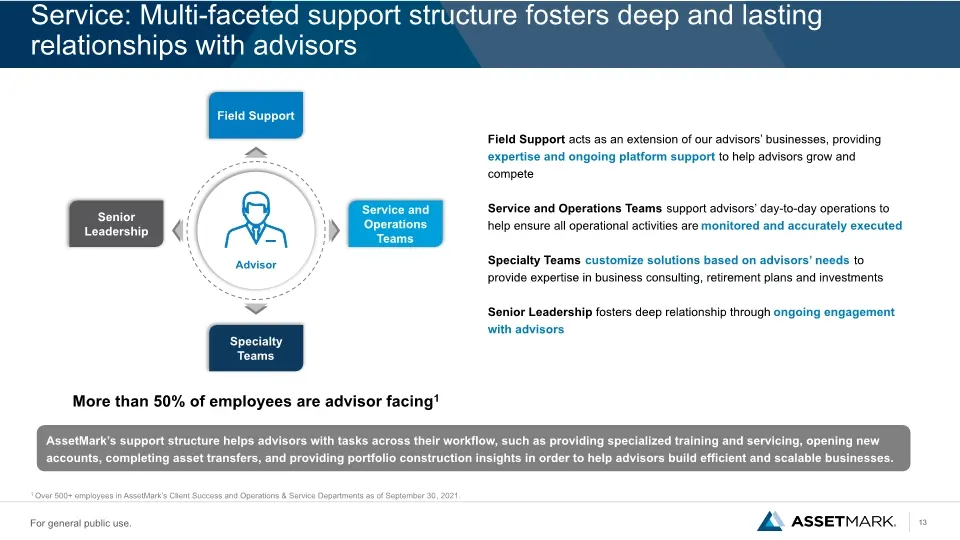
Service: Multi-faceted support structure fosters deep and lasting relationships with advisors Field Support acts as an extension of our advisors’ businesses, providing expertise and ongoing platform support to help advisors grow and compete Service and Operations Teams support advisors’ day-to-day o
Slide 14: Investments: Curated investment platform helps enhance advisors' capabilities
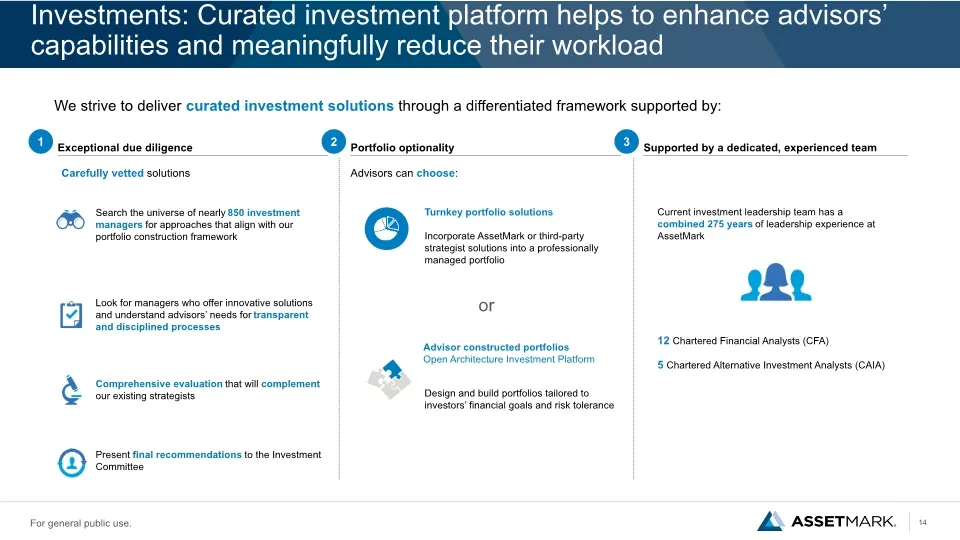
Investments: Curated investment platform helps to enhance advisors’ capabilities and meaningfully reduce their workload Exceptional due diligence Portfolio optionality Supported by a dedicated, experienced team Carefully vetted solutions Current investment leadership team has a combined 275 years of
Slide 15: Dedicated management team with extensive industry experience
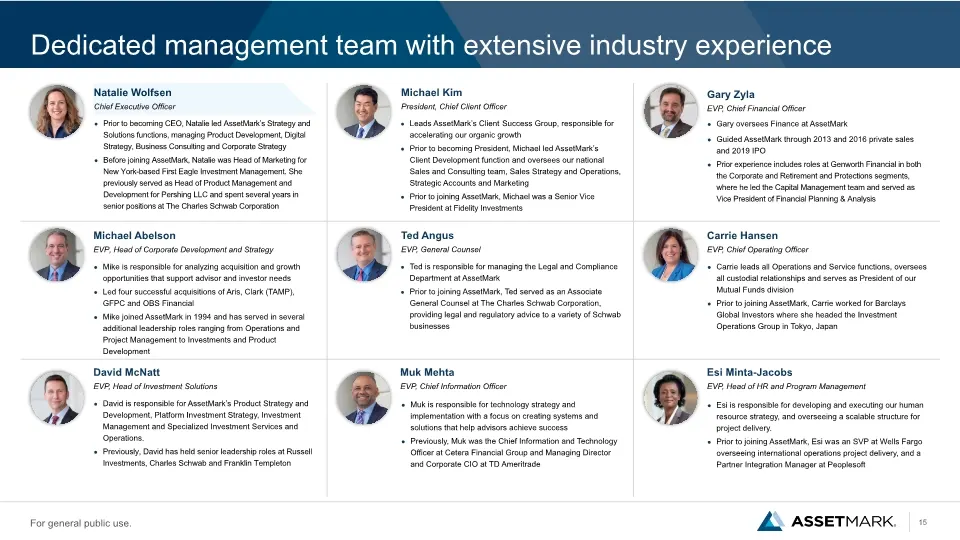
Dedicated management team with extensive industry experience Prior to becoming CEO, Natalie led AssetMark’s Strategy and Solutions functions, managing Product Development, Digital Strategy, Business Consulting and Corporate Strategy Before joining AssetMark, Natalie was Head of Marketing for New Yor
Slide 16: Our strategy is working: record results, satisfied advisors
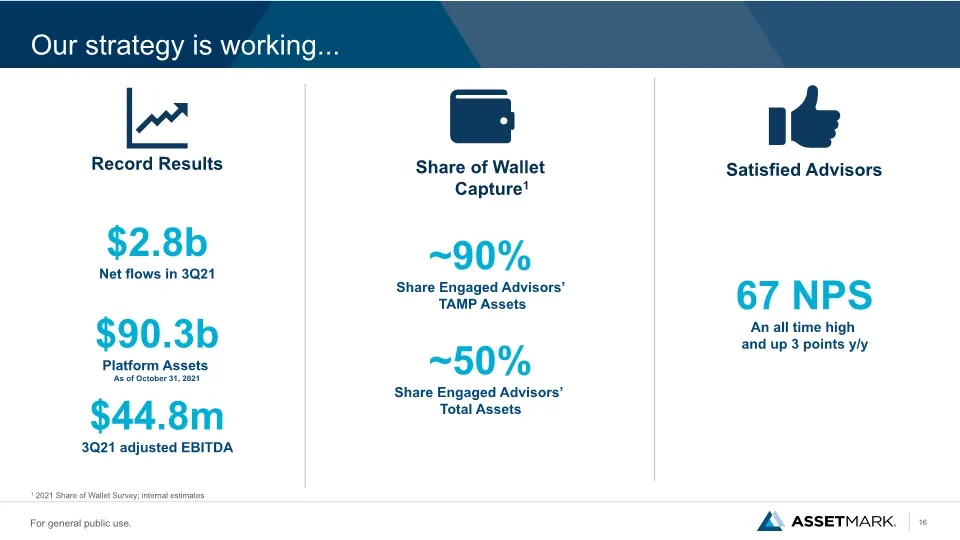
Record Results Satisfied Advisors Our strategy is working... 67 NPS An all time high and up 3 points y/y $2.8b Net flows in 3Q21 $90.3b Platform Assets As of October 31, 2021 $44.8m 3Q21 adjusted EBITDA 1 2021 Share of Wallet Survey; internal estimates
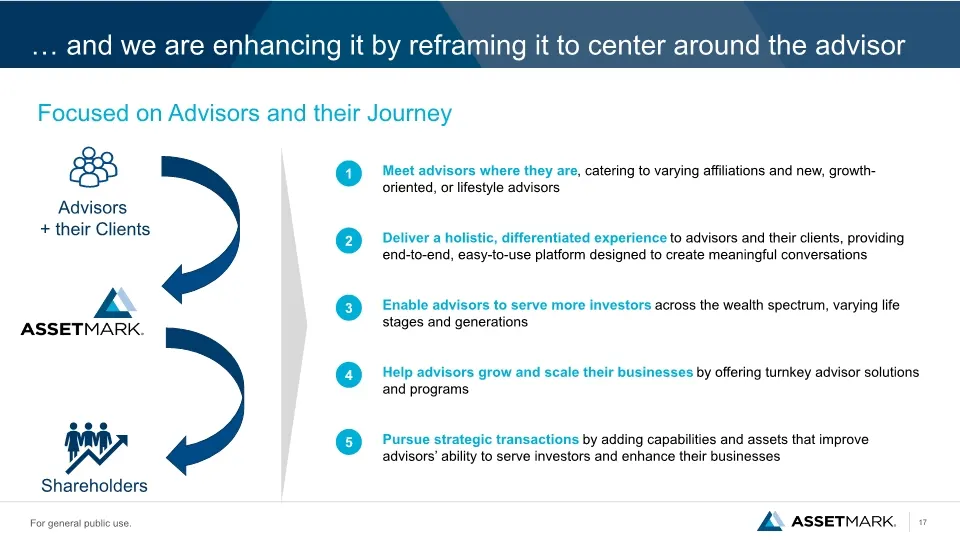
Slide 17: Enhancing our strategy by reframing it to center around the advisor
… and we are enhancing it by reframing it to center around the advisor Meet advisors where they are, catering to varying affiliations and new, growth-oriented, or lifestyle advisors Deliver a holistic, differentiated experience to advisors and their clients, providing end-to-end, easy-to-use platfor
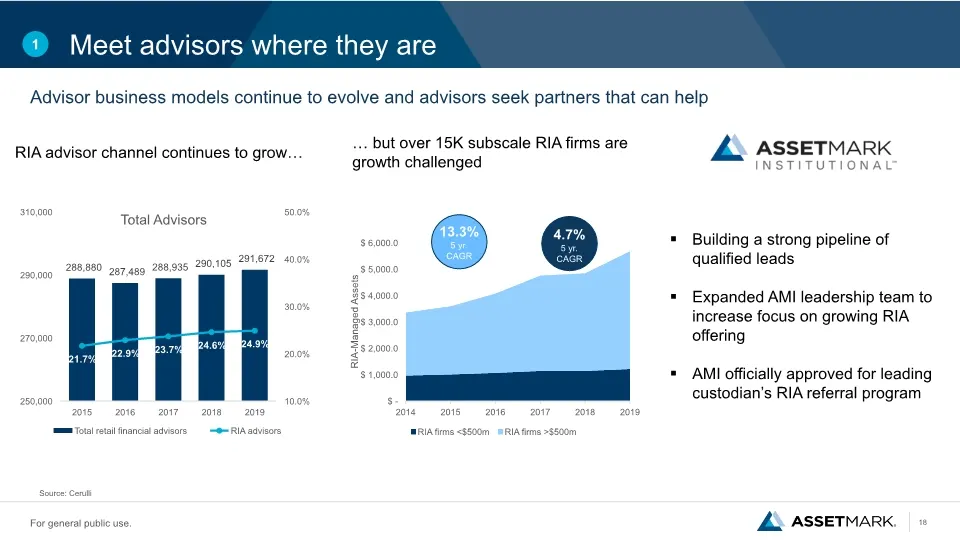
Slide 18: Meet advisors where they are
Meet advisors where they are 1 Advisor business models continue to evolve and advisors seek partners that can help RIA advisor channel continues to grow… Source: Cerulli Building a strong pipeline of qualified leads Expanded AMI leadership team to increase focus on growing RIA offering AMI officiall
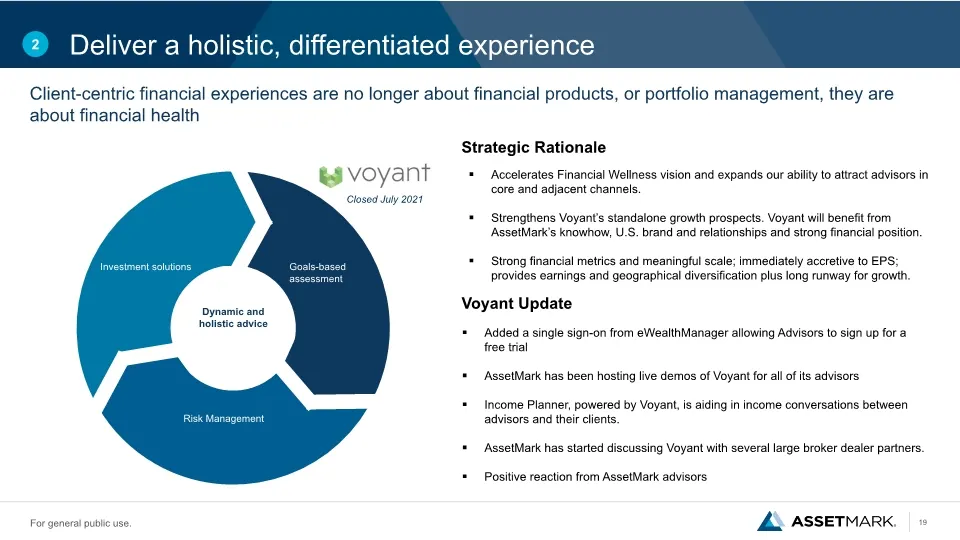
Slide 19: Deliver a holistic, differentiated experience
Deliver a holistic, differentiated experience 2 Strategic Rationale Voyant Update Accelerates Financial Wellness vision and expands our ability to attract advisors in core and adjacent channels. Strengthens Voyant’s standalone growth prospects. Voyant will benefit from AssetMark’s knowhow, U.S. bran
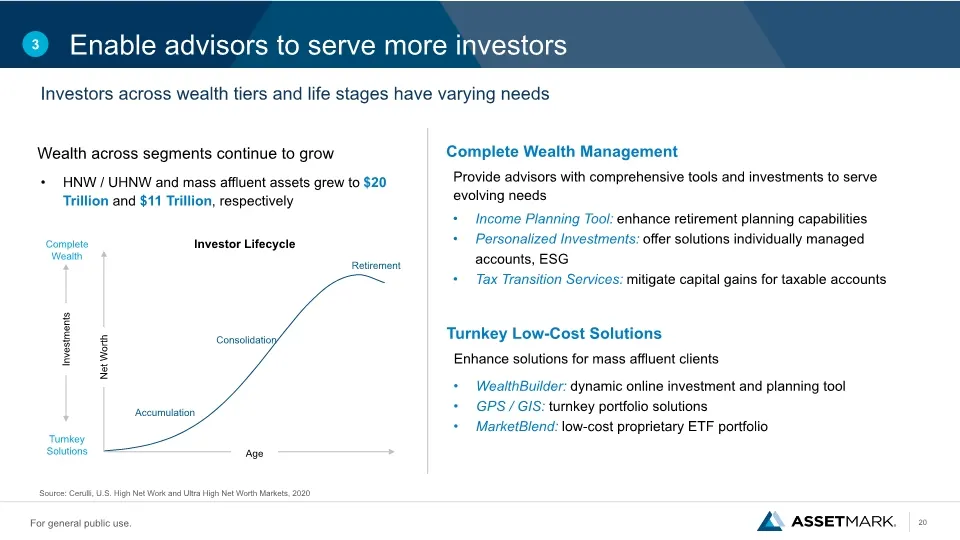
Slide 20: Enable advisors to serve more investors
Enable advisors to serve more investors 3 Investors across wealth tiers and life stages have varying needs Income Planning Tool: enhance retirement planning capabilities Personalized Investments: offer solutions individually managed accounts, ESG Tax Transition Services: mitigate capital gains for t
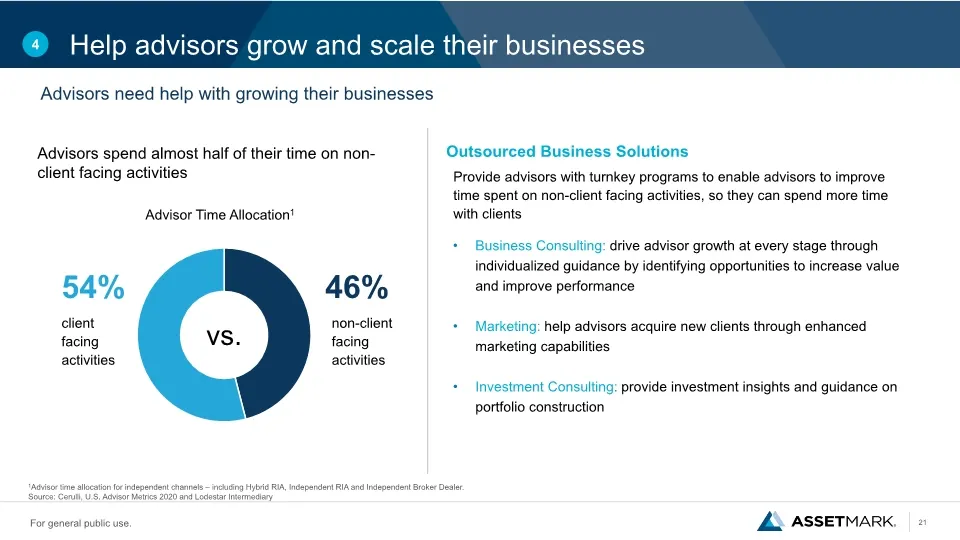
Slide 21: Help advisors grow and scale their businesses
Help advisors grow and scale their businesses 4 54% 46% client facing activities non-client facing activities 1Advisor time allocation for independent channels – including Hybrid RIA, Independent RIA and Independent Broker Dealer. Source: Cerulli, U.S. Advisor Metrics 2020 and Lodestar Intermediary
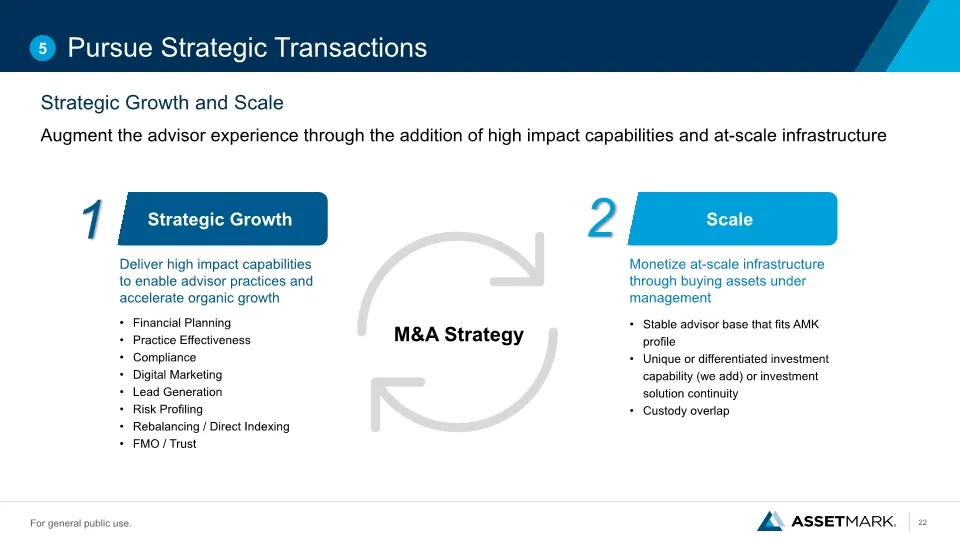
Slide 22: Pursue Strategic Transactions
Pursue Strategic Transactions Scale M&A Strategy Strategic Growth 1 2 Financial Planning Practice Effectiveness Compliance Digital Marketing Lead Generation Risk Profiling Rebalancing / Direct Indexing FMO / Trust Deliver high impact capabilities to enable advisor practices and accelerate organic gr
Slide 23: Contents
Contents Opportunity Highlights Market Overview Company Overview Financial Overview Appendix
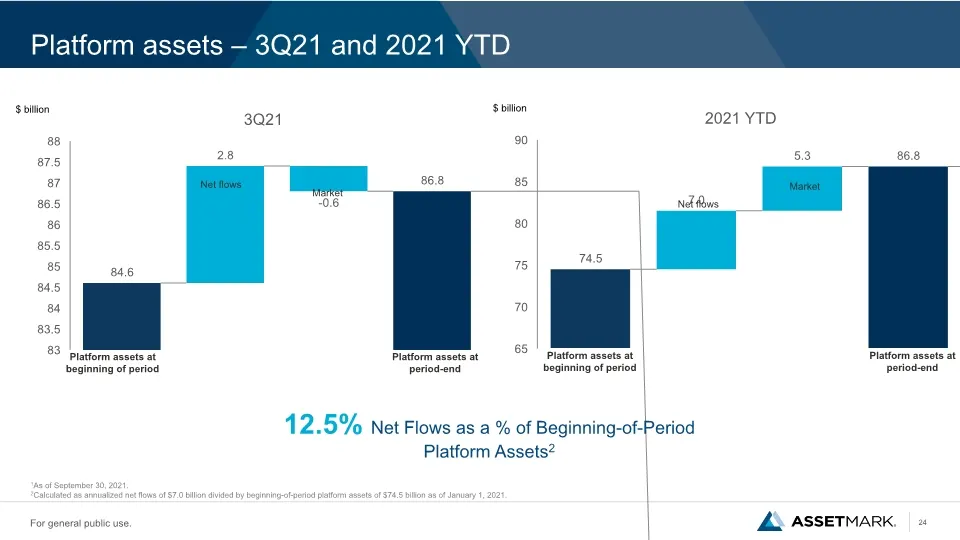
Slide 24: Platform assets – 3Q21 and 2021 YTD
Platform assets – 3Q21 and 2021 YTD $ billion 12.5% Net Flows as a % of Beginning-of-Period Platform Assets2 Platform assets at beginning of period Net flows Market Platform assets at period-end 1As of September 30, 2021. 2Calculated as annualized net flows of $7.0 billion divided by beginning-of-pe
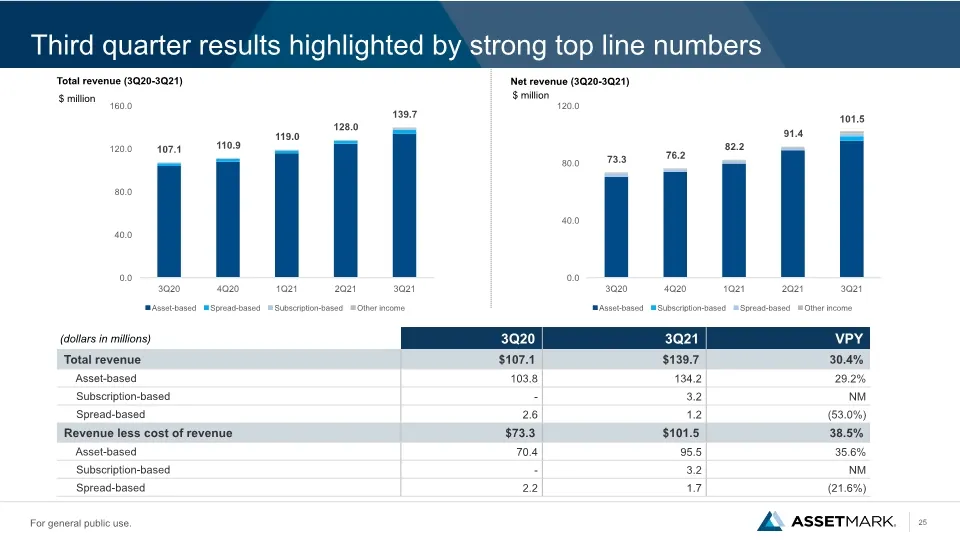
Slide 25: Third quarter results highlighted by strong top line numbers
Third quarter results highlighted by strong top line numbers Total revenue (3Q20-3Q21) $ million Net revenue (3Q20-3Q21) $ million
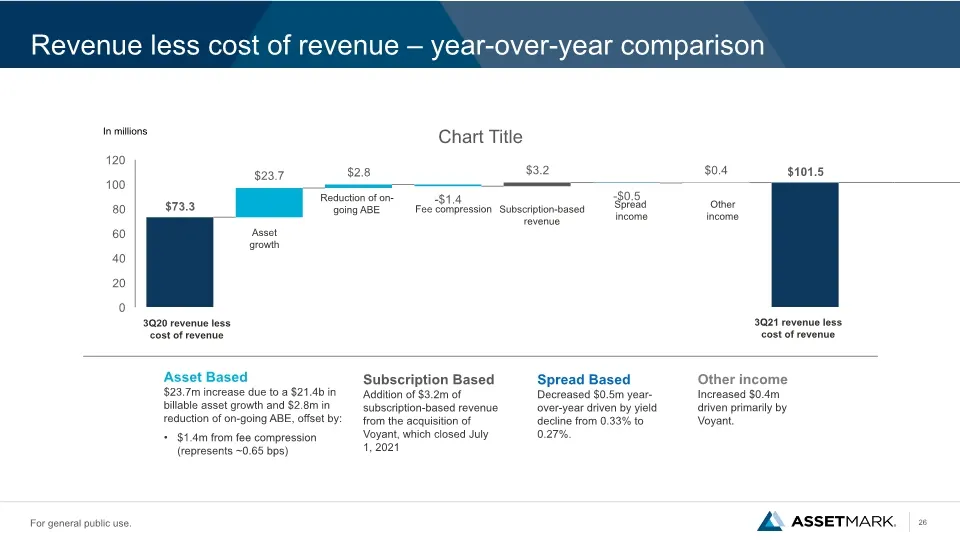
Slide 26: Revenue less cost of revenue – year-over-year comparison
Revenue less cost of revenue – year-over-year comparison Asset Based $23.7m increase due to a $21.4b in billable asset growth and $2.8m in reduction of on-going ABE, offset by: $1.4m from fee compression (represents ~0.65 bps) Spread Based Decreased $0.5m year-over-year driven by yield decline from
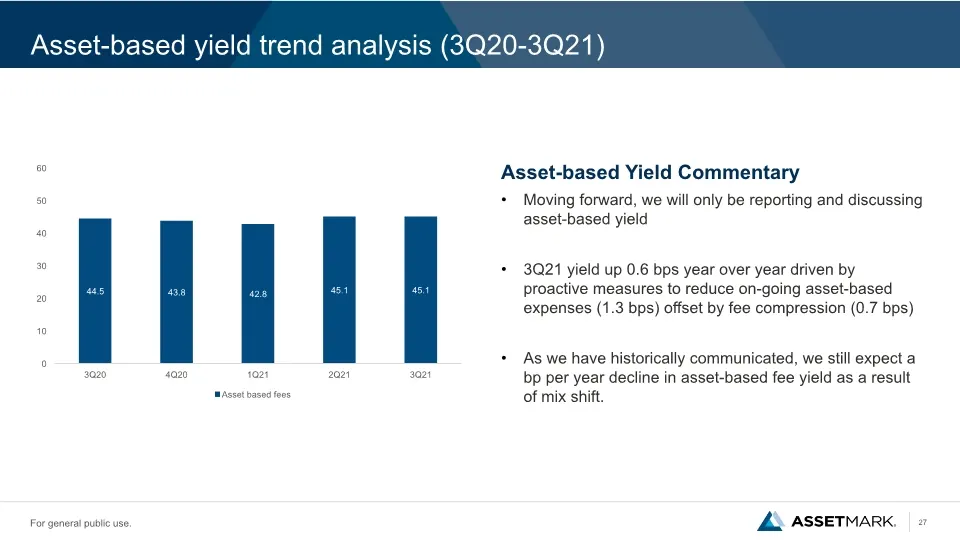
Slide 27: Asset-based yield trend analysis (3Q20-3Q21)
Asset-based yield trend analysis (3Q20-3Q21) Asset-based Yield Commentary Moving forward, we will only be reporting and discussing asset-based yield 3Q21 yield up 0.6 bps year over year driven by proactive measures to reduce on-going asset-based expenses (1.3 bps) offset by fee compression (0.7 bps)
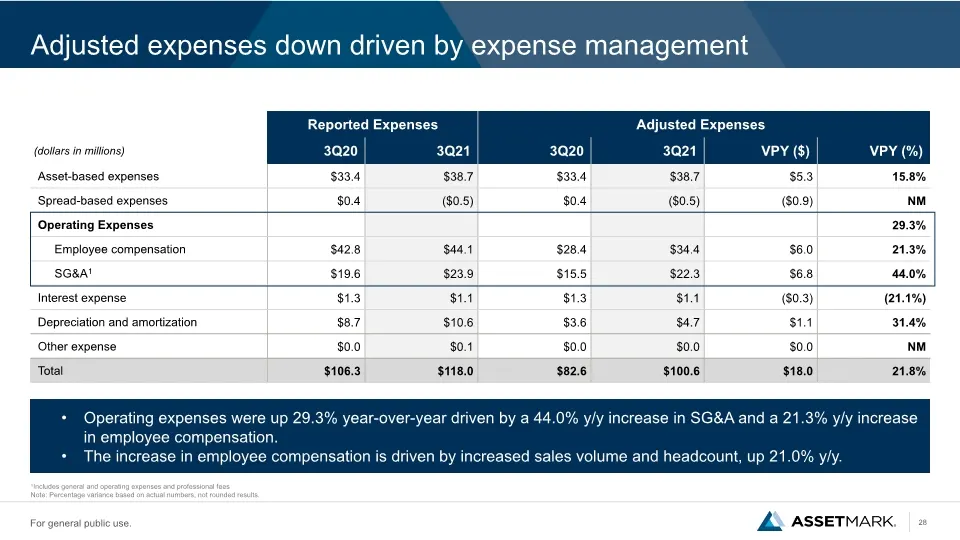
Slide 28: Adjusted expenses down driven by expense management
Adjusted expenses down driven by expense management 1Includes general and operating expenses and professional fees Note: Percentage variance based on actual numbers, not rounded results. Operating expenses were up 29.3% year-over-year driven by a 44.0% y/y increase in SG&A and a 21.3% y/y increase i
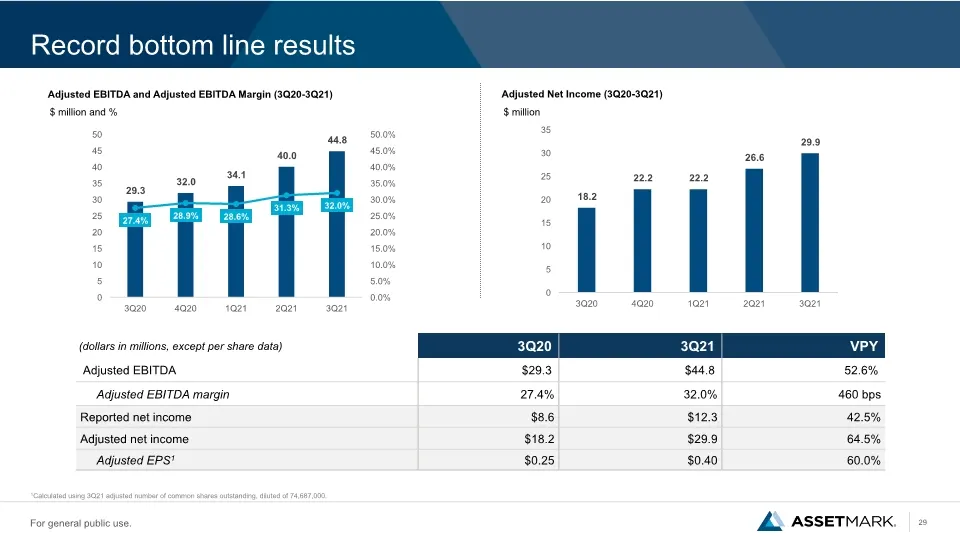
Slide 29: Record bottom line results
Record bottom line results 1Calculated using 3Q21 adjusted number of common shares outstanding, diluted of 74,687,000. Adjusted EBITDA and Adjusted EBITDA Margin (3Q20-3Q21) Adjusted Net Income (3Q20-3Q21) $ million and % $ million
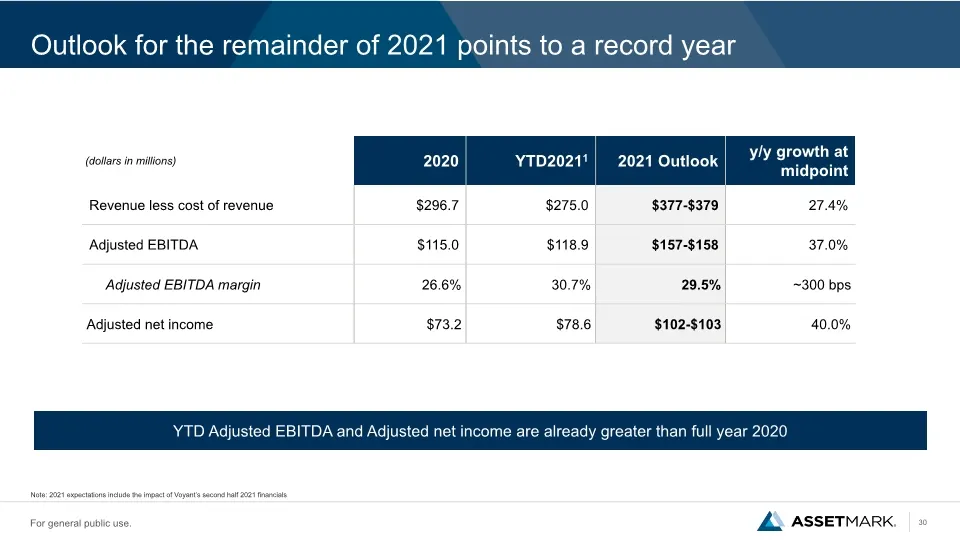
Slide 30: Outlook for the remainder of 2021 points to a record year
Outlook for the remainder of 2021 points to a record year Note: 2021 expectations include the impact of Voyant’s second half 2021 financials YTD Adjusted EBITDA and Adjusted net income are already greater than full year 2020
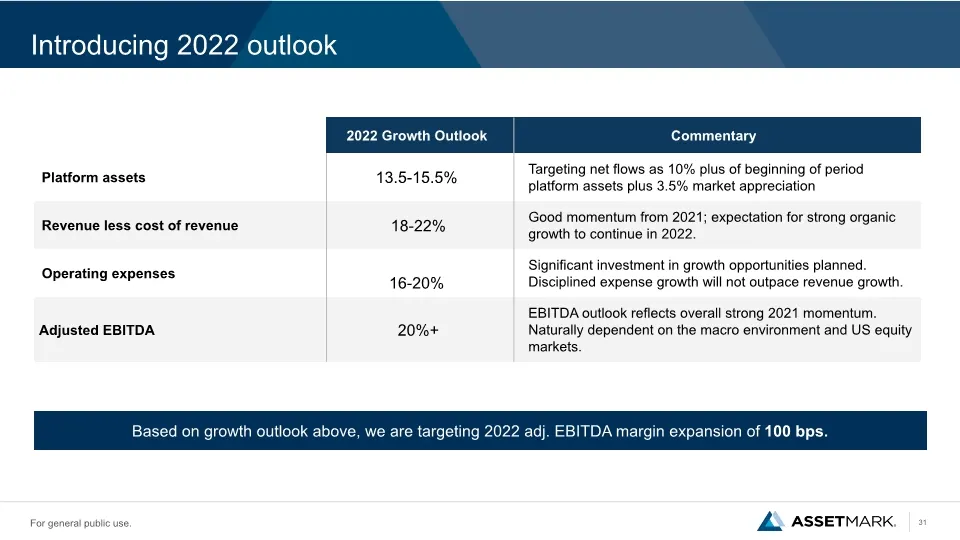
Slide 31: Introducing 2022 outlook
Introducing 2022 outlook Based on growth outlook above, we are targeting 2022 adj. EBITDA margin expansion of 100 bps.
Slide 32: Contents
Contents Opportunity Highlights Market Overview Company Overview Financial Overview Appendix
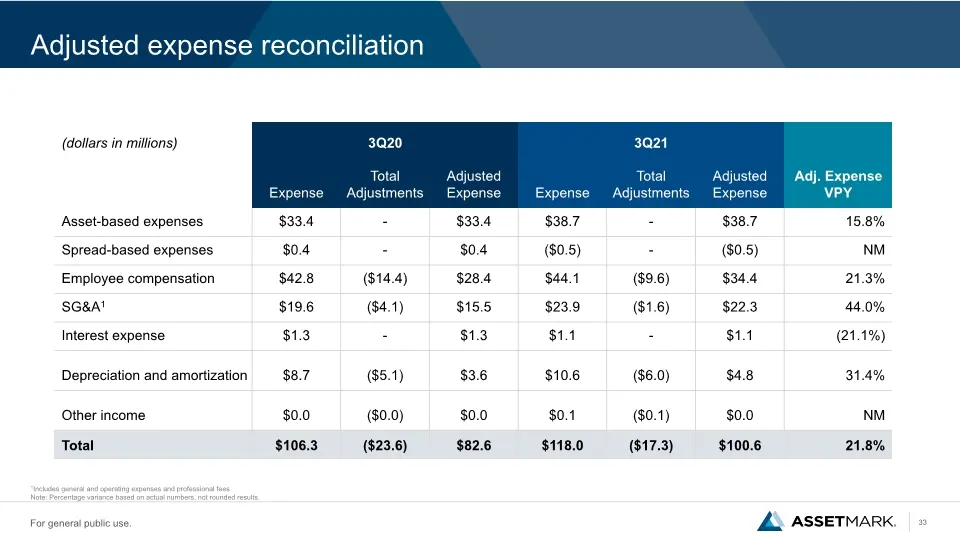
Slide 33: Adjusted expense reconciliation
Adjusted expense reconciliation 1Includes general and operating expenses and professional fees Note: Percentage variance based on actual numbers, not rounded results.
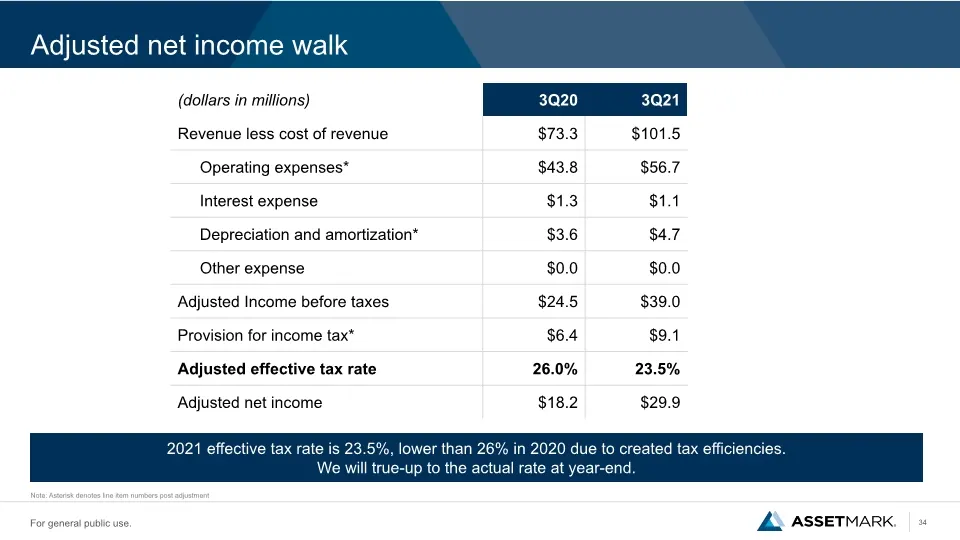
Slide 34: Adjusted net income walk
Adjusted net income walk 2021 effective tax rate is 23.5%, lower than 26% in 2020 due to created tax efficiencies. We will true-up to the actual rate at year-end. Note: Asterisk denotes line item numbers post adjustment
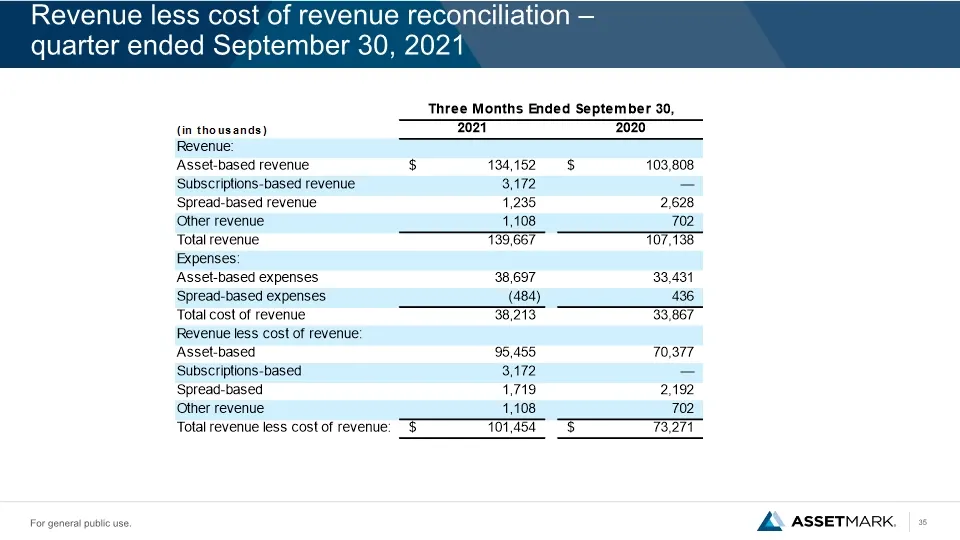
Slide 35: Revenue less cost of revenue reconciliation – quarter ended September 30, 2021
Revenue less cost of revenue reconciliation – quarter ended September 30, 2021
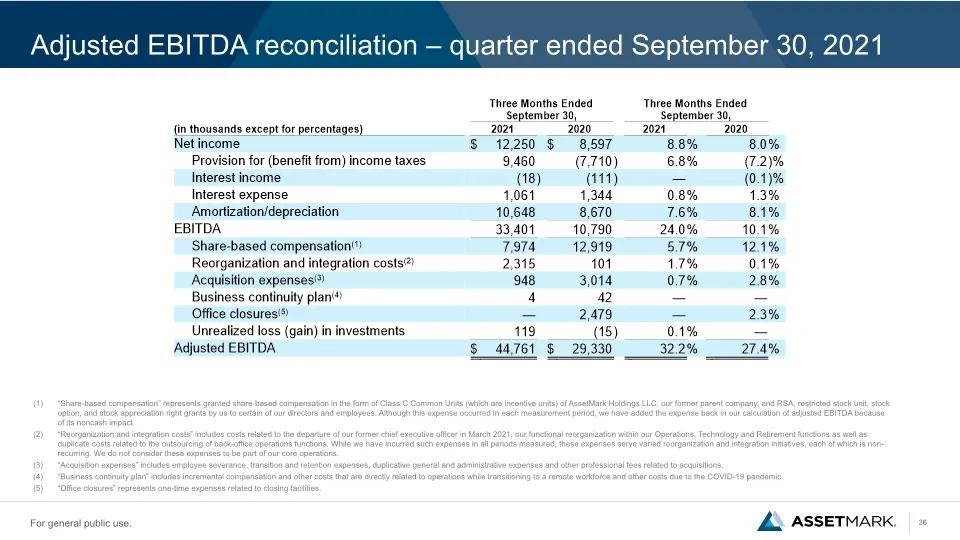
Slide 36: Adjusted EBITDA reconciliation – quarter ended September 30, 2021
Adjusted EBITDA reconciliation – quarter ended September 30, 2021 (1) “Share-based compensation” represents granted share-based compensation in the form of Class C Common Units (which are incentive units) of AssetMark Holdings LLC, our former parent company, and RSA, restricted stock unit, stock opt
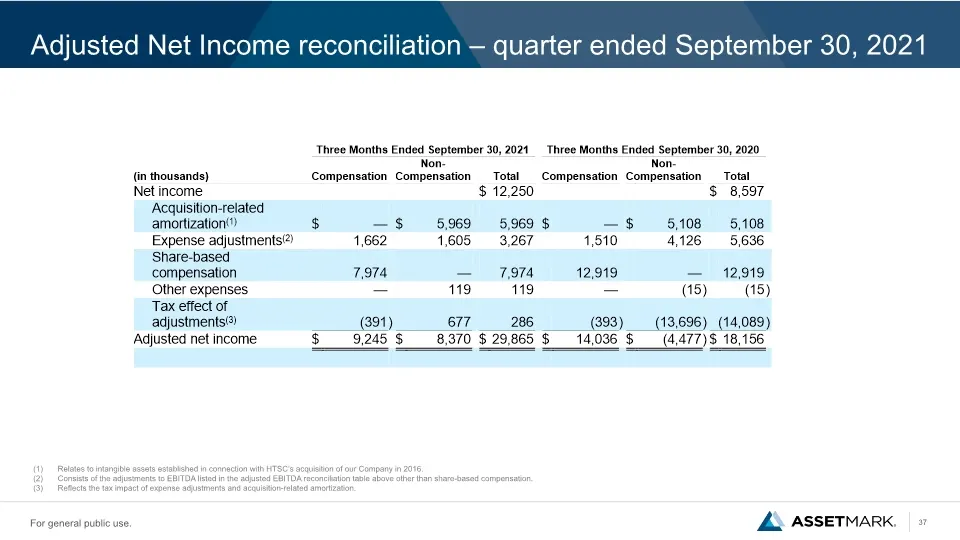
Slide 37: Adjusted Net Income reconciliation – quarter ended September 30, 2021
Adjusted Net Income reconciliation – quarter ended September 30, 2021 (1) Relates to intangible assets established in connection with HTSC’s acquisition of our Company in 2016. (2) Consists of the adjustments to EBITDA listed in the adjusted EBITDA reconciliation table above other than share-based c
Source: SEC EDGAR · 8-K filed Dec 3, 2021
More decks from AssetMark Financial Holdings Inc
 Conference Presentation (April 2026)18 slides · April 2026
 EA Webinar (April 2026)15 slides · April 2026
 AssetMark GOLDFORUM 202626 slides · March 2026
 Investor Presentation (March 2026)26 slides · March 2026
 AssetMark Platinum Summit 20247 slides · 2024
 Investor Presentation (December 2023)31 slides · Dec 1, 2023