AssetMark Financial Holdings Inc
AssetMark Financial — Investor Presentation (December 2023)
31 slides from AssetMark Financial's investor presentation, Dec 1, 2023

Slide 1: Fourth Quarter 2023 Investor Presentation
For general public use. Fourth Quarter 2023 Investor Presentation Exhibit 99.1
Slide 2: Forward looking statements and non-GAAP financial measures
For general public use. 2 Forward looking statements and non-GAAP financial measures Forward-Looking Statements Forward-looking statements include all statements that are not historical facts and can be identified by terms such as “will,” “may,” “could,” “should,” “believe,” “expect,” “estimate,” “p
Slide 3: Contents
For general public use. 3 Contents What We Do Who We Serve How We Differentiate Financial Results Appendix
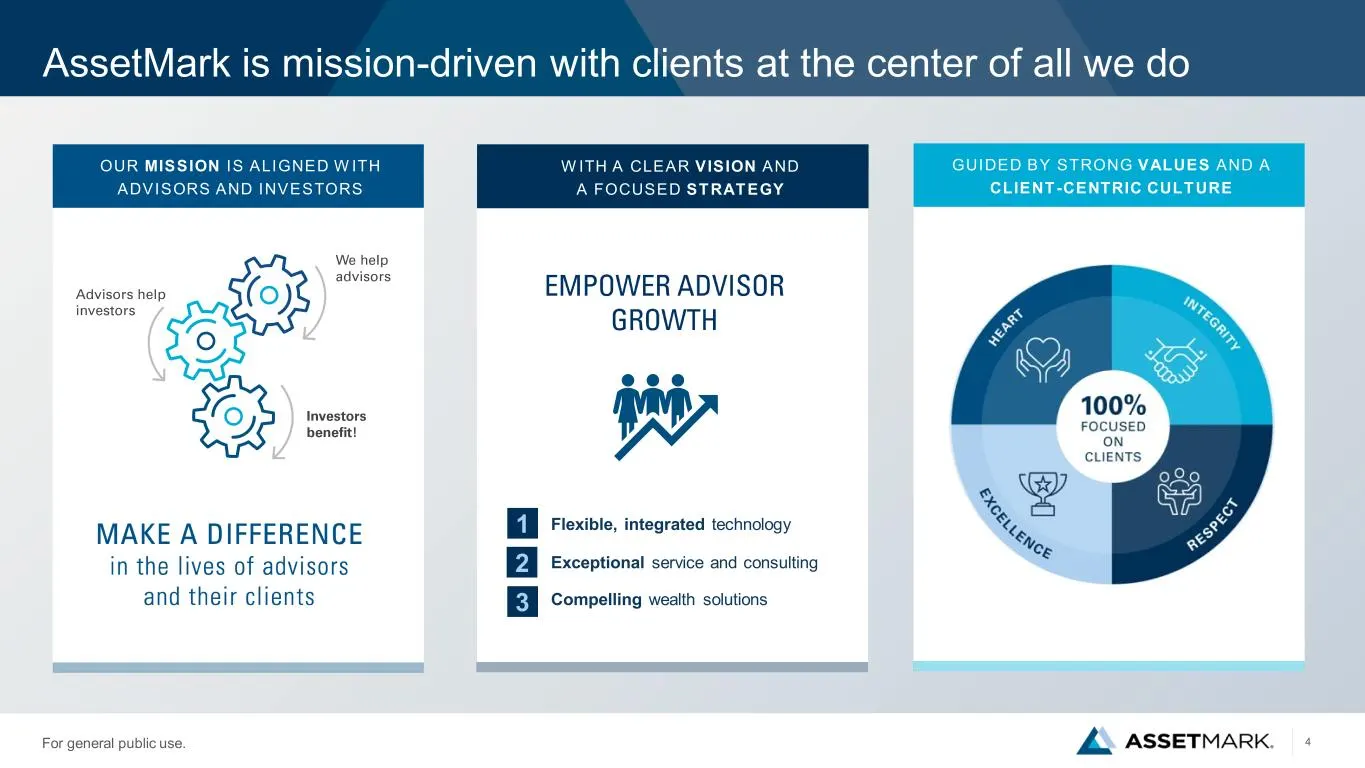
Slide 4: AssetMark is mission-driven with clients at the center of all we do
For general public use. 4 AssetMark is mission-driven with clients at the center of all we do OUR MISSION IS ALIGNED W ITH ADVISORS AND INVESTORS GUIDED BY STRONG VALUES AND A CLIENT-CENTRIC CULTURE 1 2 3 Compelling wealth solutions Exceptional service and consulting Flexible, integrated technology
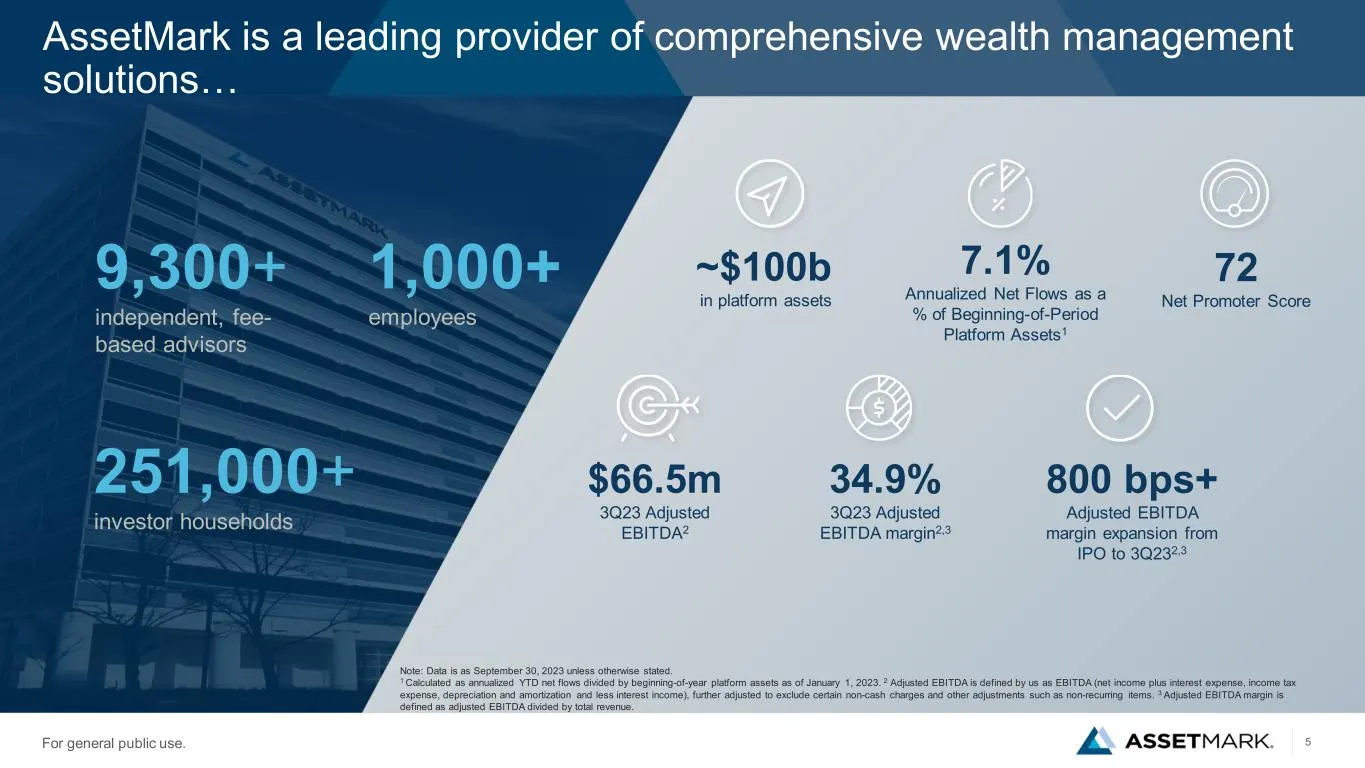
Slide 5: AssetMark is a leading provider of comprehensive wealth management solutions
For general public use. 5 AssetMark is a leading provider of comprehensive wealth management solutions… 7.1% Annualized Net Flows as a % of Beginning-of-Period Platform Assets1 ~$100b in platform assets $66.5m 3Q23 Adjusted EBITDA2 72 Net Promoter Score 800 bps+ Adjusted EBITDA margin expansion from
Slide 6: That power independent financial advisors
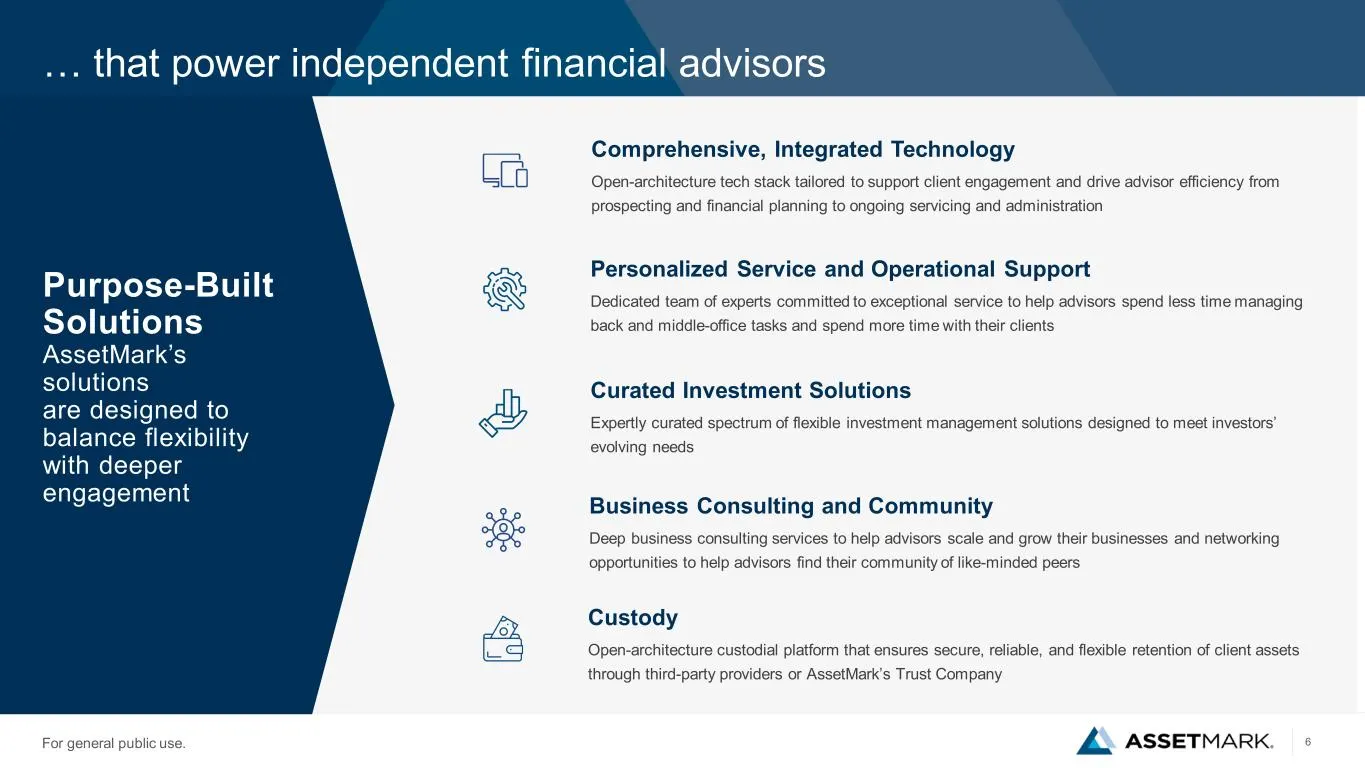
For general public use. 6 … that power independent financial advisors Purpose-Built Solutions AssetMark’s solutions are designed to balance flexibility with deeper engagement Comprehensive, Integrated Technology Open-architecture tech stack tailored to support client engagement and drive advisor eff
Slide 7: We have a long history of growth and innovation
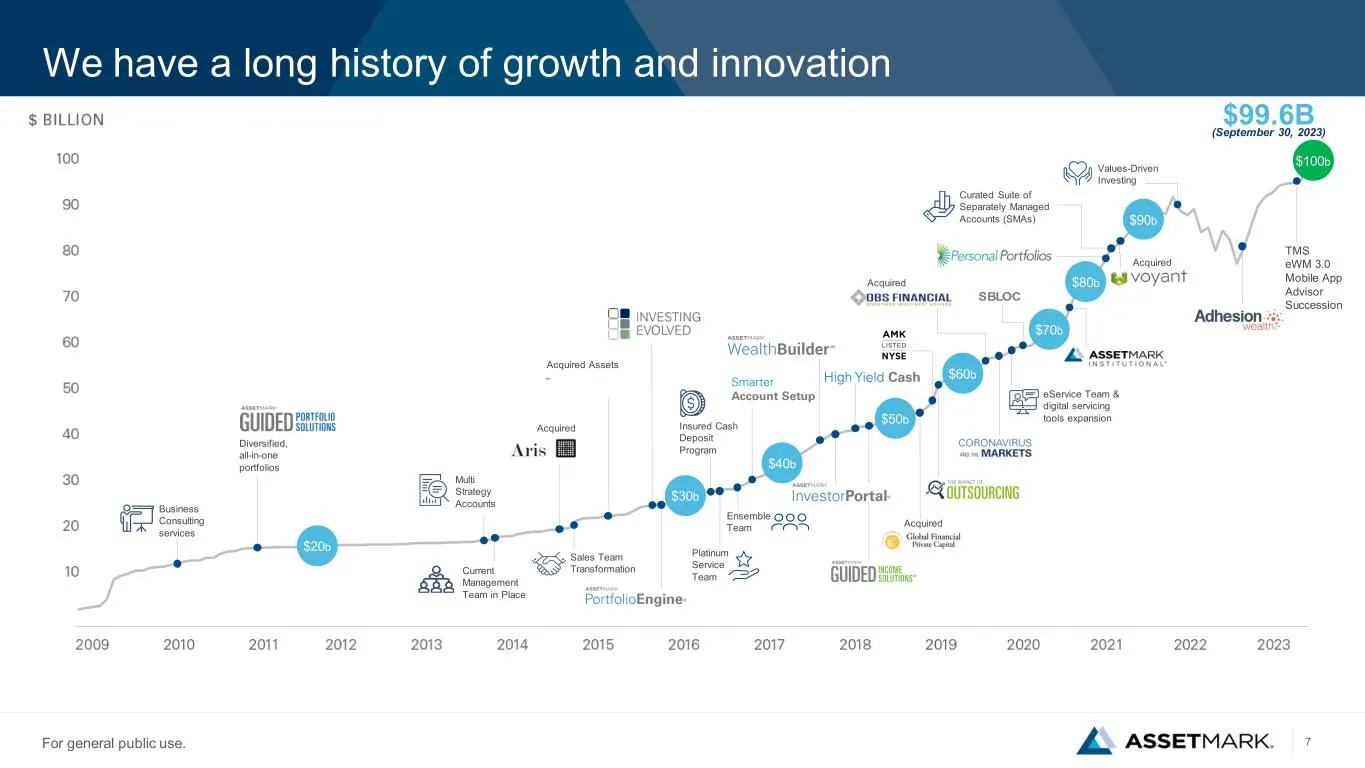
For general public use. 7 We have a long history of growth and innovation Diversified, all-in-one portfolios SBLOC Business Consulting services Current Management Team in Place Multi Strategy Accounts Sales Team Transformation Insured Cash Deposit Program Platinum Service Team Ensemble Team $60b $70
Slide 8: Our strategic pillars are focused on the advisor
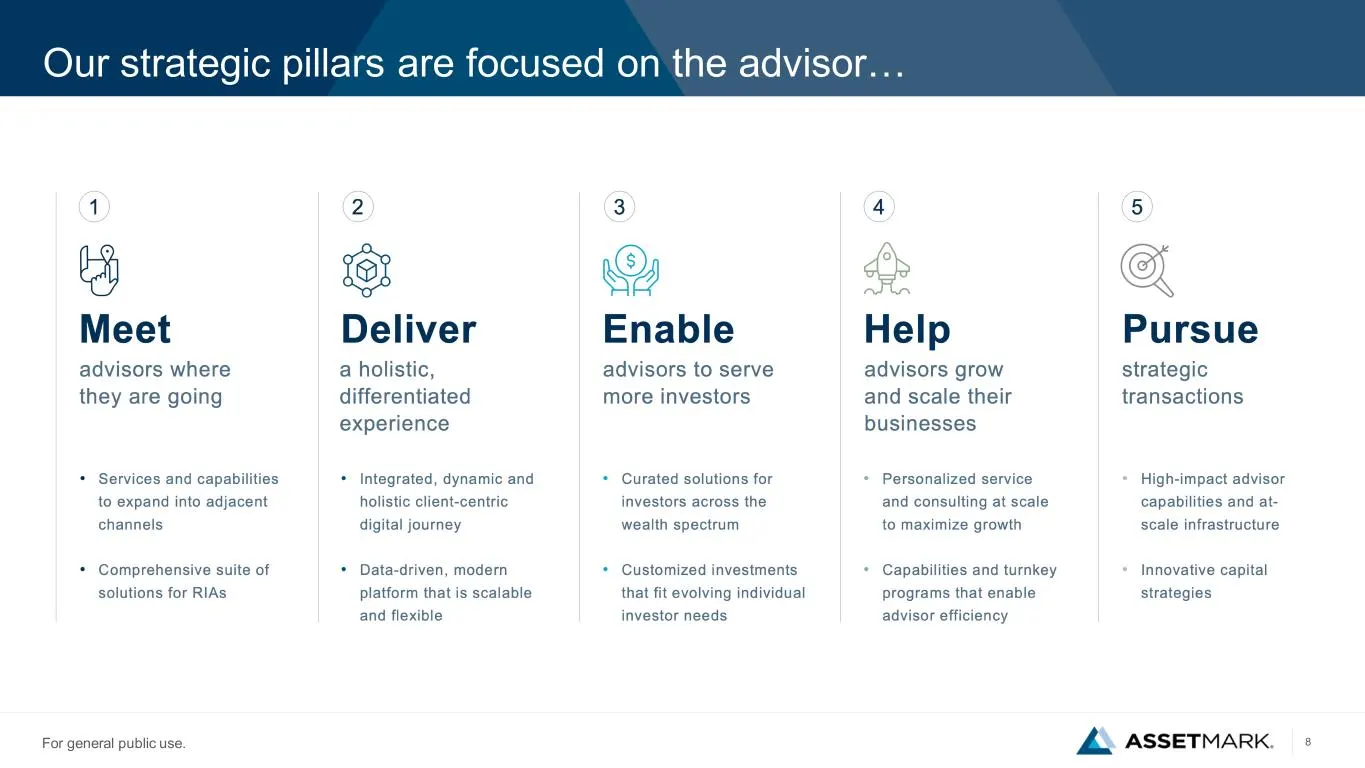
For general public use. 8 Our strategic pillars are focused on the advisor…
Slide 9: Hyper Growth and enhancing shareholder value
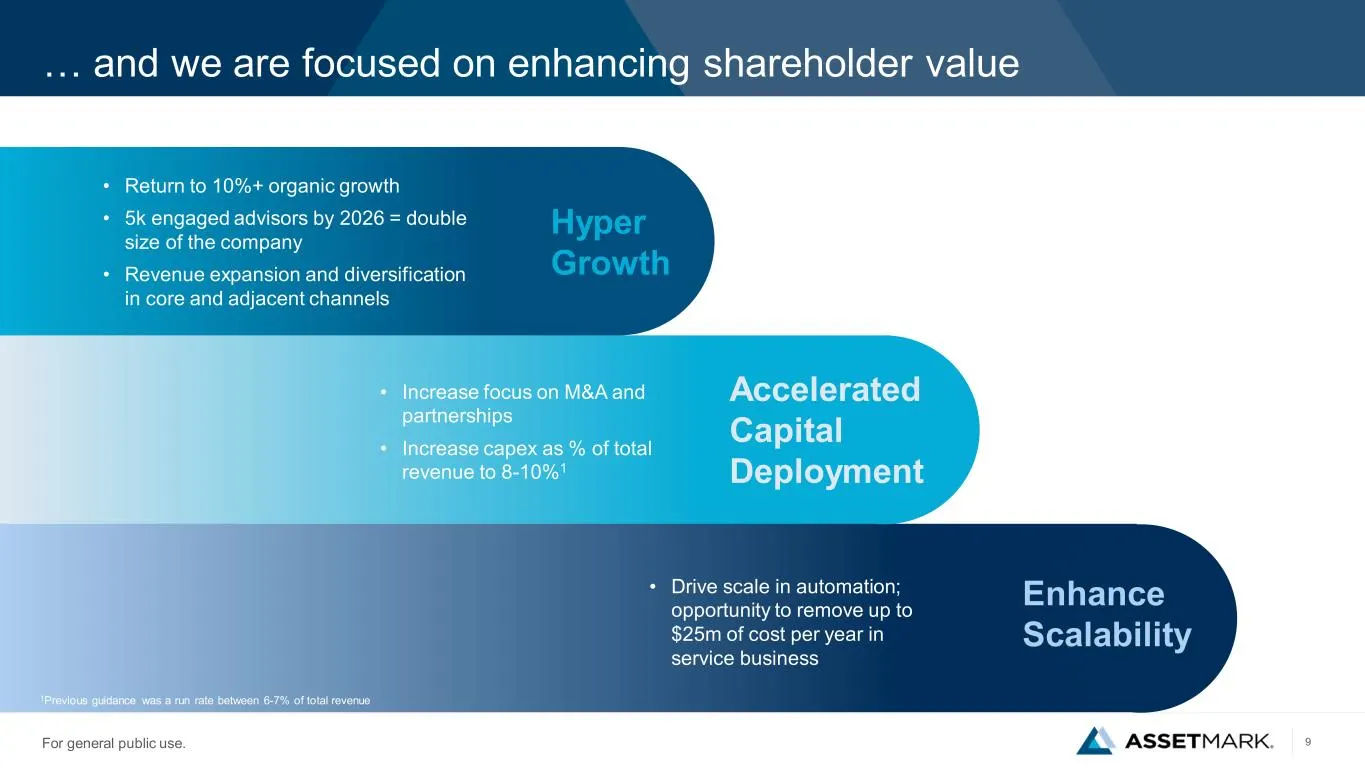
For general public use. 9 Hyper Growth … and we are focused on enhancing shareholder value 1Previous guidance was a run rate between 6-7% of total revenue • Return to 10%+ organic growth • 5k engaged advisors by 2026 = double size of the company • Revenue expansion and diversification in core and ad
Slide 10: Contents
For general public use. 10 Contents What We Do Who We Serve How We Differentiate Financial Results Appendix
Slide 11: Independent advisors need greater support to serve their clients
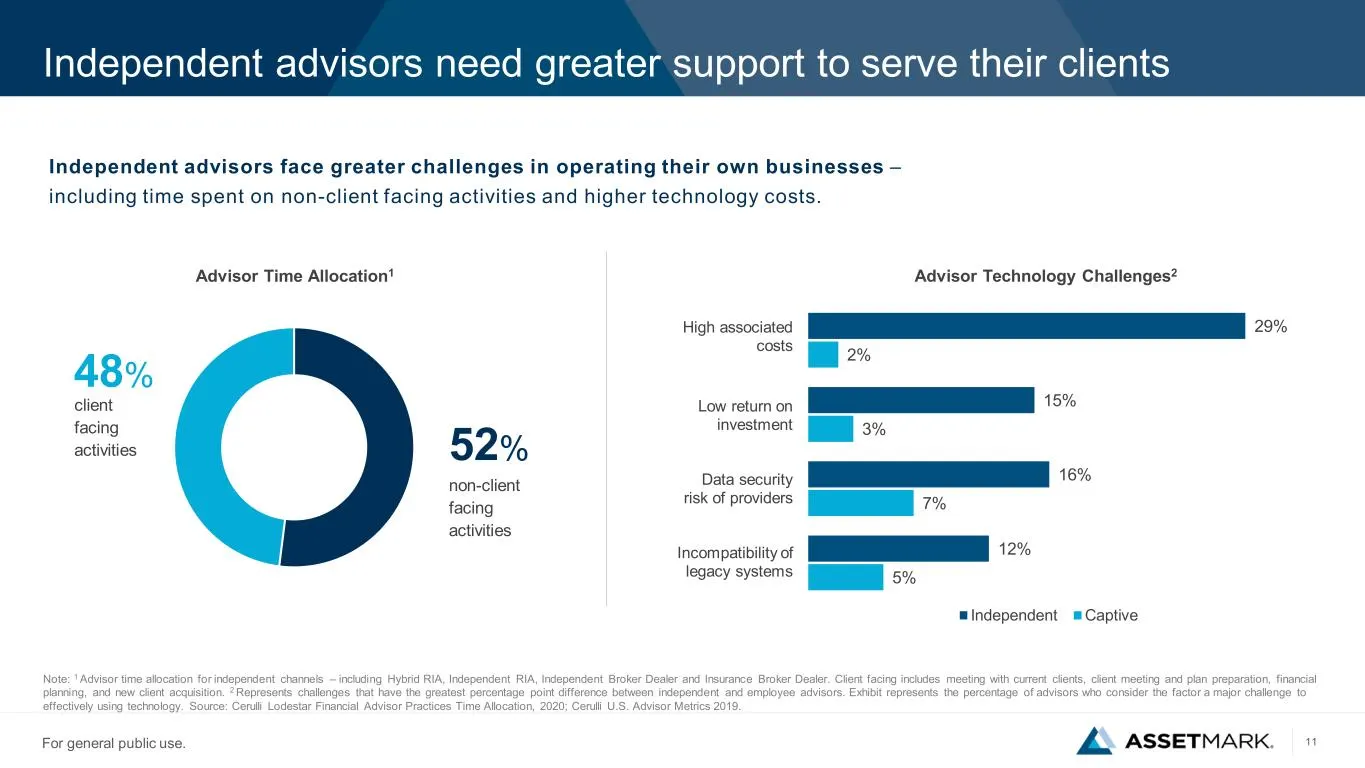
For general public use. 11 Independent advisors need greater support to serve their clients Advisor Time Allocation1 Note: 1 Advisor time allocation for independent channels – including Hybrid RIA, Independent RIA, Independent Broker Dealer and Insurance Broker Dealer. Client facing includes meeting
Slide 12: Advisors are increasingly recognizing the benefits of outsourcing
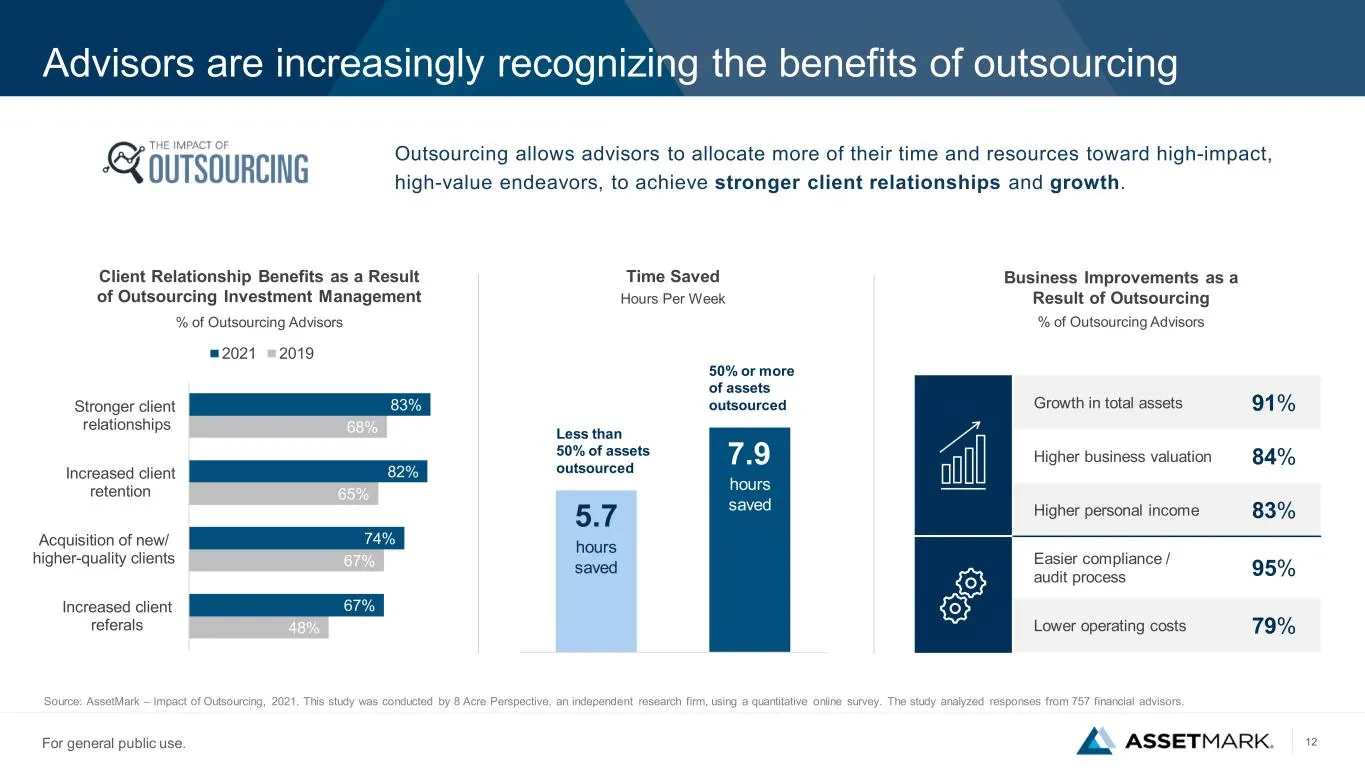
For general public use. 12 Advisors are increasingly recognizing the benefits of outsourcing Growth in total assets 91% Higher business valuation 84% Higher personal income 83% Easier compliance / audit process 95% Lower operating costs 79%48% 67% 65% 68% 67% 74% 82% 83% Increased client referals Ac
Slide 13: We estimate ~$380B in opportunity with our existing advisors
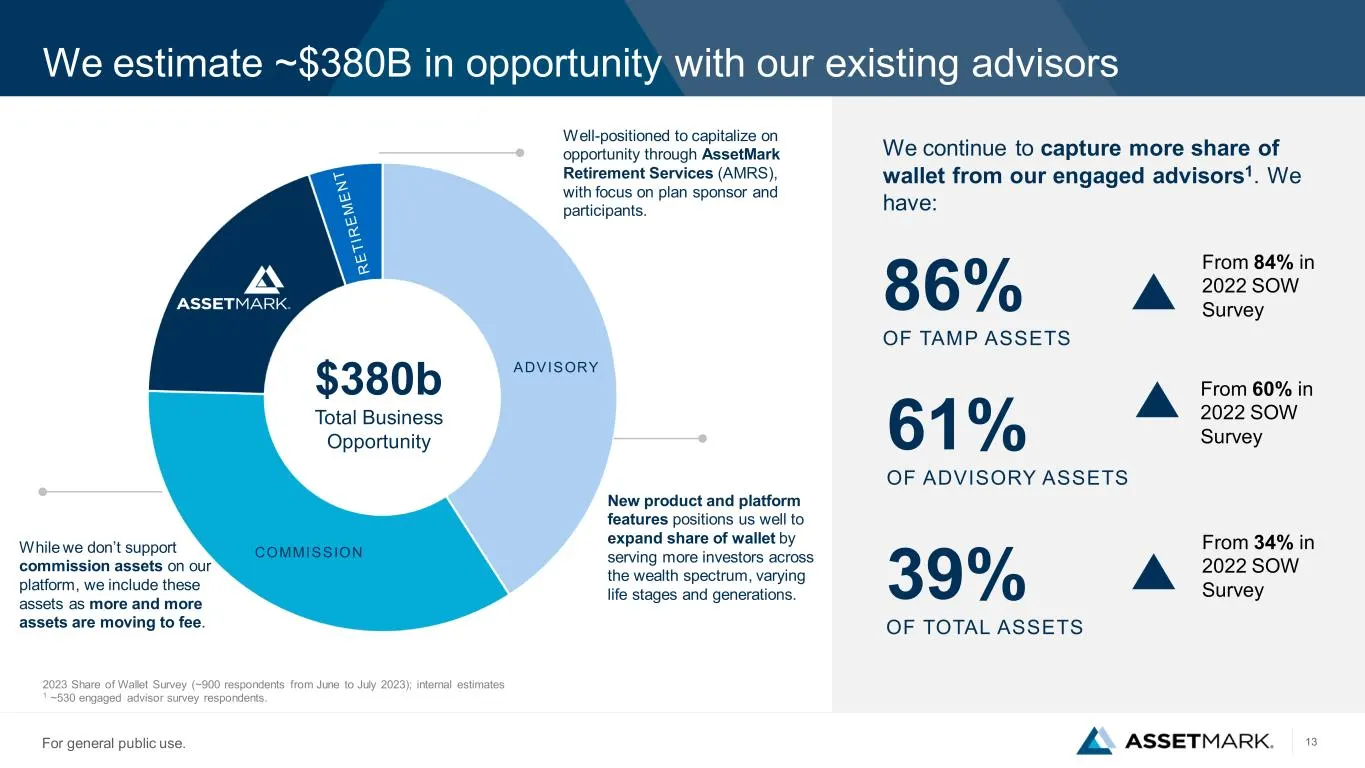
For general public use. 13 We estimate ~$380B in opportunity with our existing advisors 2023 Share of Wallet Survey (~900 respondents from June to July 2023); internal estimates 1 ~530 engaged advisor survey respondents. $380b Total Business Opportunity Well-positioned to capitalize on opportunity t
Slide 14: Contents
For general public use. 14 Contents What We Do Who We Serve How We Differentiate Financial Results Appendix
Slide 15: AssetMark is uniquely positioned among key growth segments
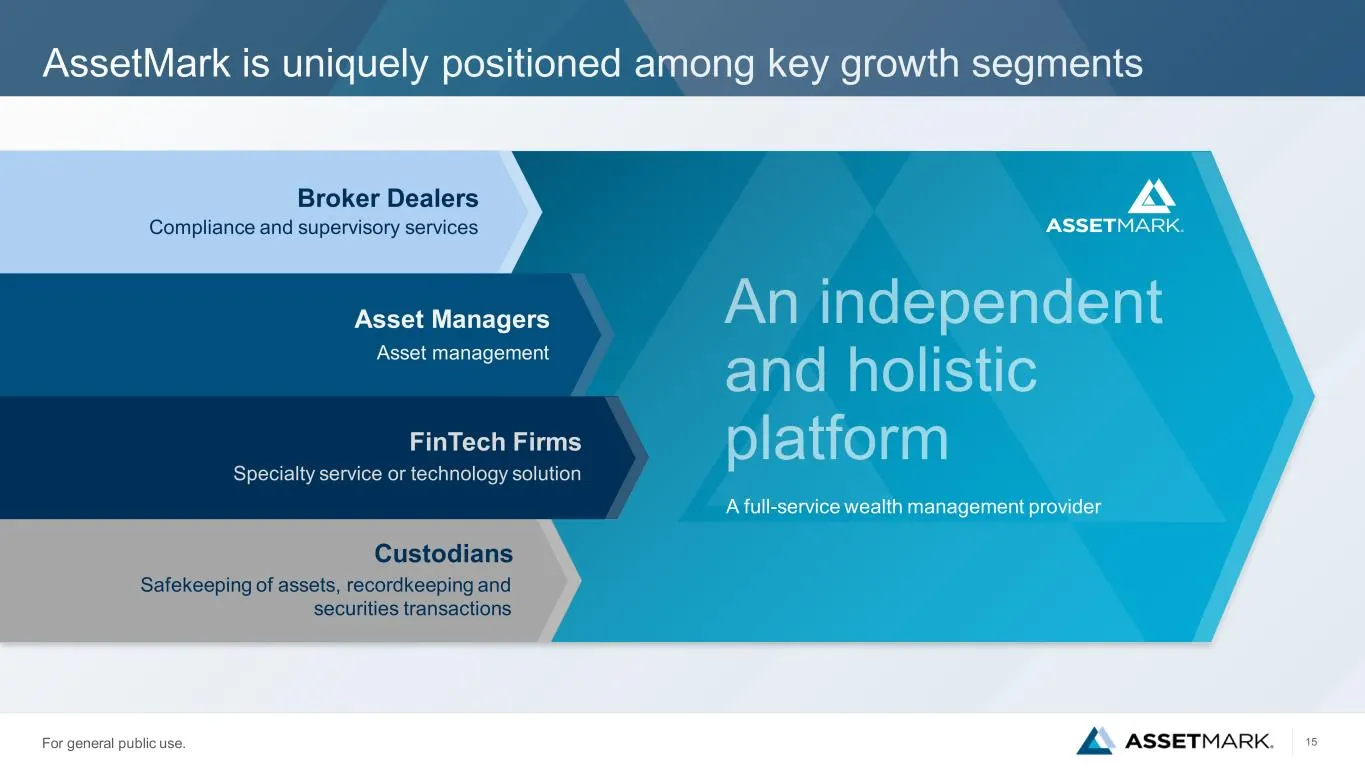
For general public use. 15 AssetMark is uniquely positioned among key growth segments Broker Dealers Asset Managers Custodians FinTech Firms Safekeeping of assets, recordkeeping and securities transactions Specialty service or technology solution Asset management Compliance and supervisory services
Slide 16: High client engagement and satisfaction
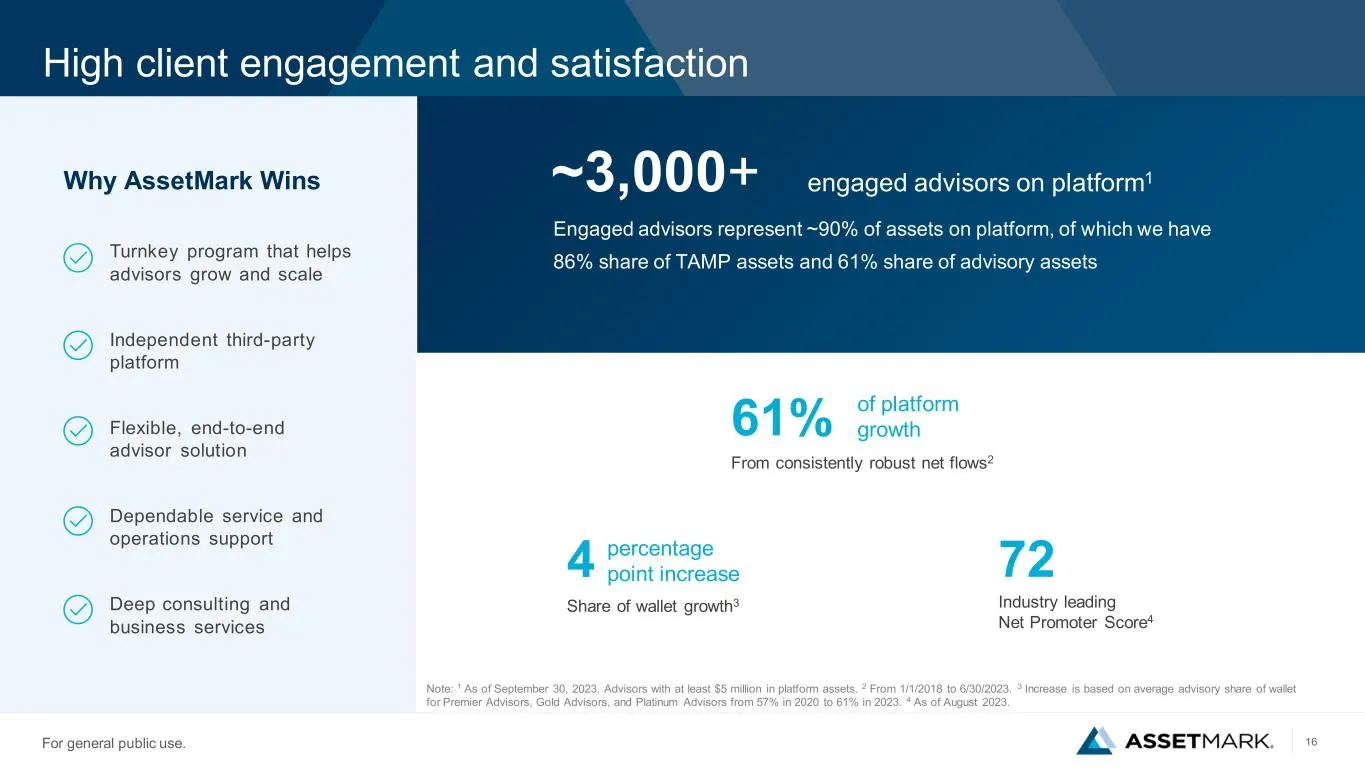
For general public use. 16 High client engagement and satisfaction ~3,000+ engaged advisors on platform1 Engaged advisors represent ~90% of assets on platform, of which we have 86% share of TAMP assets and 61% share of advisory assets Note: 1 As of September 30, 2023. Advisors with at least $5 milli
Slide 17: Contents
For general public use. 17 Contents What We Do Who We Serve How We Differentiate Financial Results Appendix
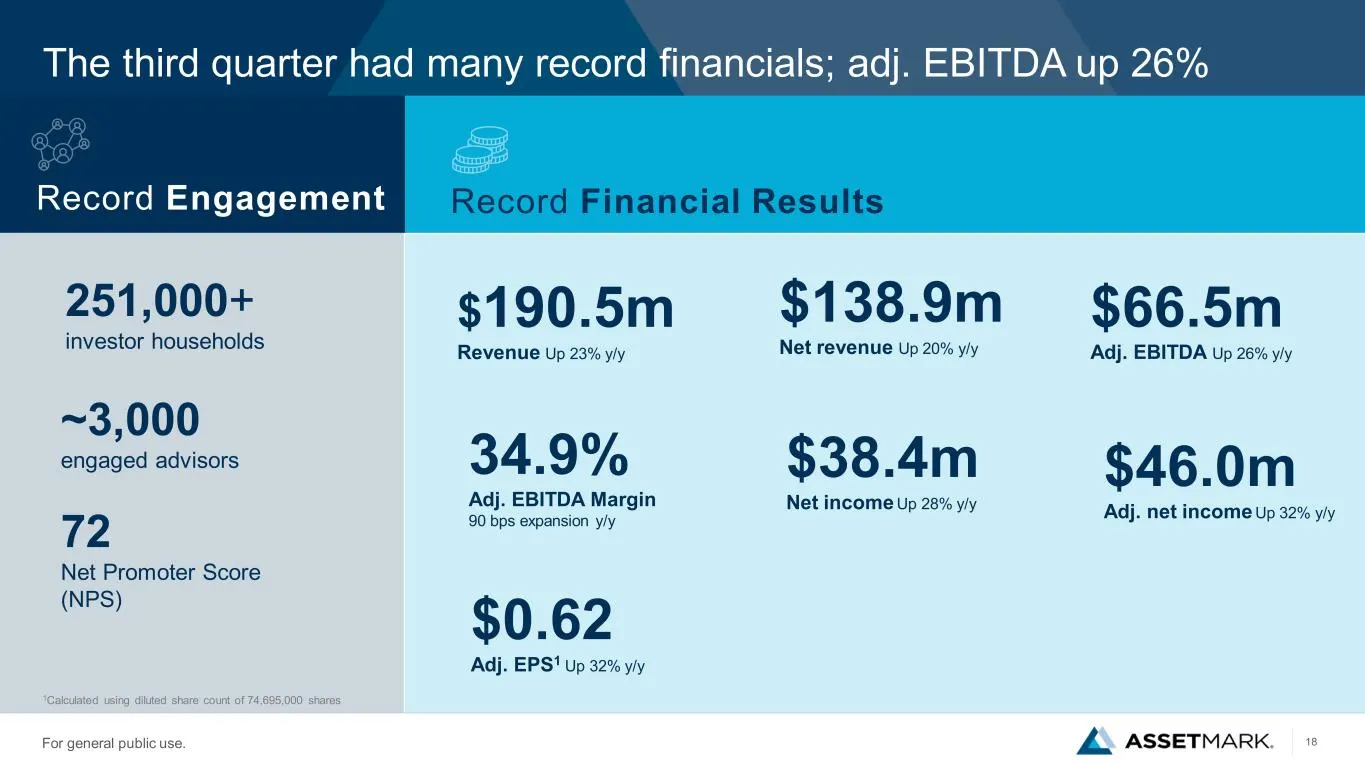
Slide 18: The third quarter had many record financials; adj. EBITDA up 26%
For general public use. 18 The third quarter had many record financials; adj. EBITDA up 26% $190.5m Revenue Up 23% y/y $138.9m Net revenue Up 20% y/y $66.5m Adj. EBITDA Up 26% y/y $38.4m Net income Up 28% y/y $0.62 Adj. EPS1 Up 32% y/y $46.0m Adj. net income Up 32% y/y 251,000+ investor households ~
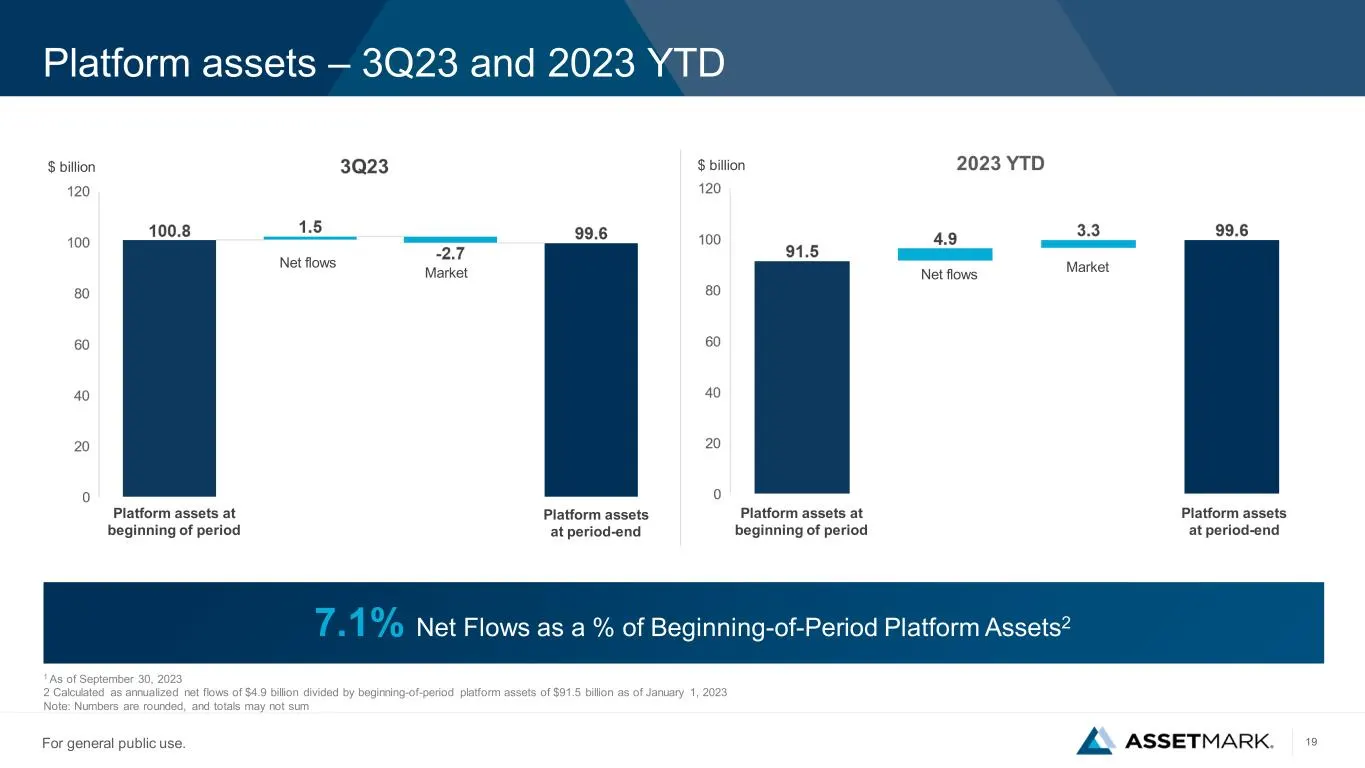
Slide 19: Platform assets – 3Q23 and 2023 YTD
For general public use. 19 Platform assets – 3Q23 and 2023 YTD 7.1% Net Flows as a % of Beginning-of-Period Platform Assets2 1 As of September 30, 2023 2 Calculated as annualized net flows of $4.9 billion divided by beginning-of-period platform assets of $91.5 billion as of January 1, 2023 Note: Num
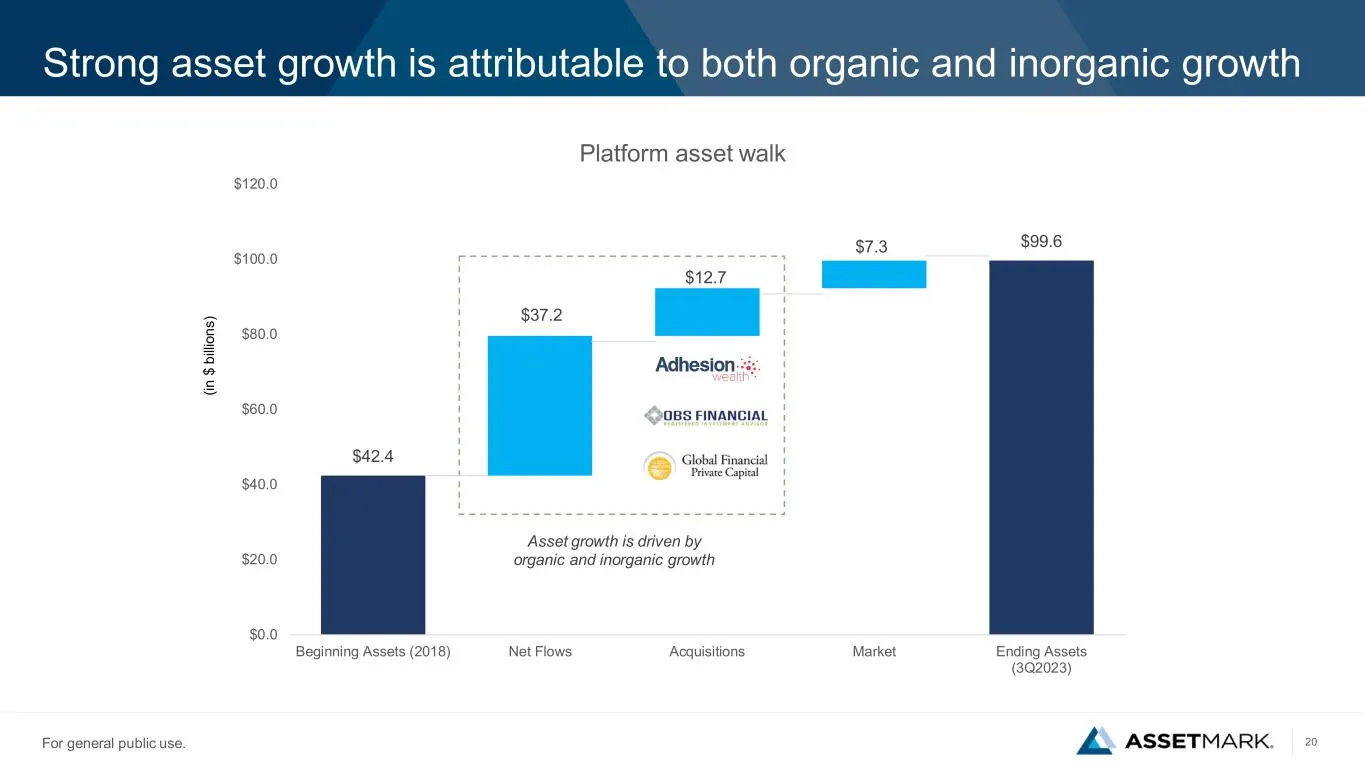
Slide 20: Platform asset walk
For general public use. 20 $42.4 $37.2 $12.7 $7.3 $99.6 $0.0 $20.0 $40.0 $60.0 $80.0 $100.0 $120.0 Beginning Assets (2018) Net Flows Acquisitions Market Ending Assets (3Q2023) Platform asset walk Strong asset growth is attributable to both organic and inorganic growth Asset growth is driven by organ
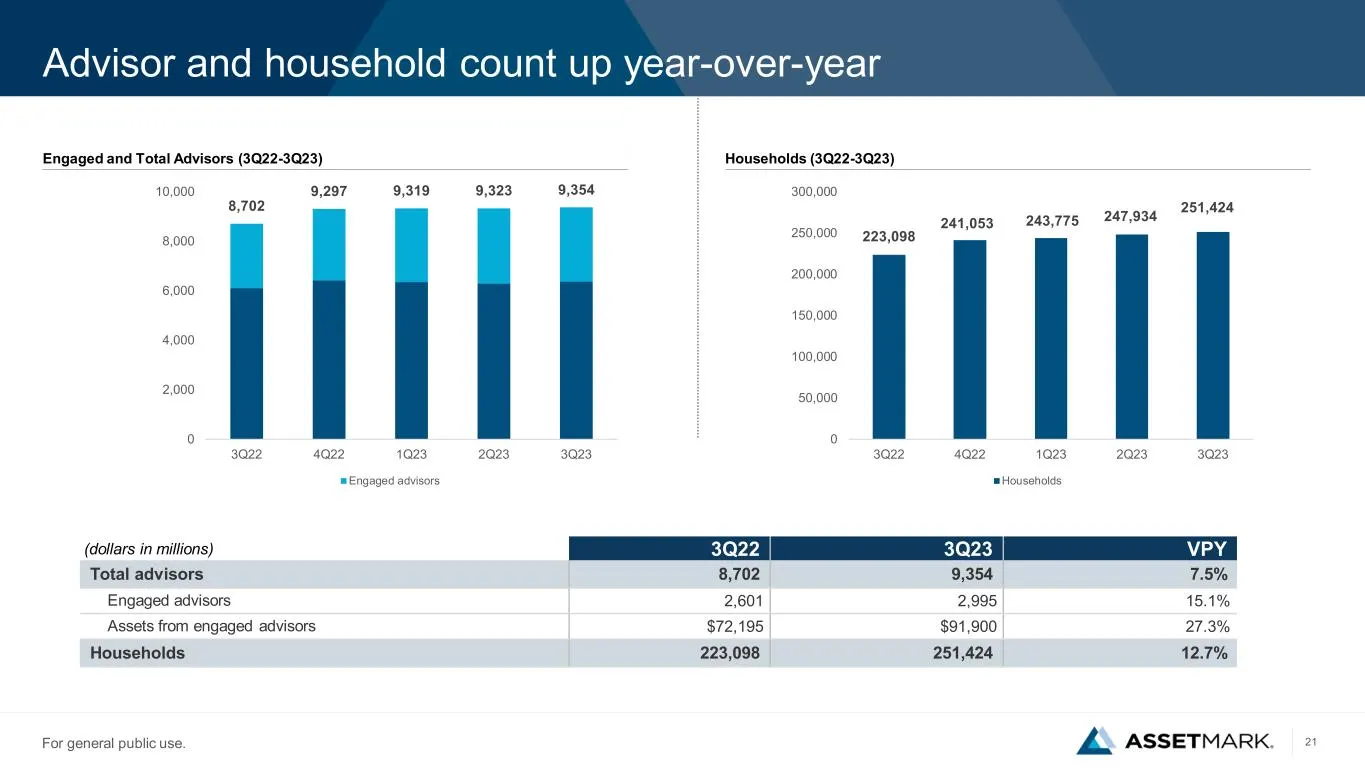
Slide 21: Advisor and household count up year-over-year
For general public use. 21 Advisor and household count up year-over-year (dollars in millions) 3Q22 3Q23 VPY Total advisors 8,702 9,354 7.5% Engaged advisors 2,601 2,995 15.1% Assets from engaged advisors $72,195 $91,900 27.3% Households 223,098 251,424 12.7% Engaged and Total Advisors (3Q22-3Q23) H
Slide 22: Third quarter results highlighted by record quarterly revenue
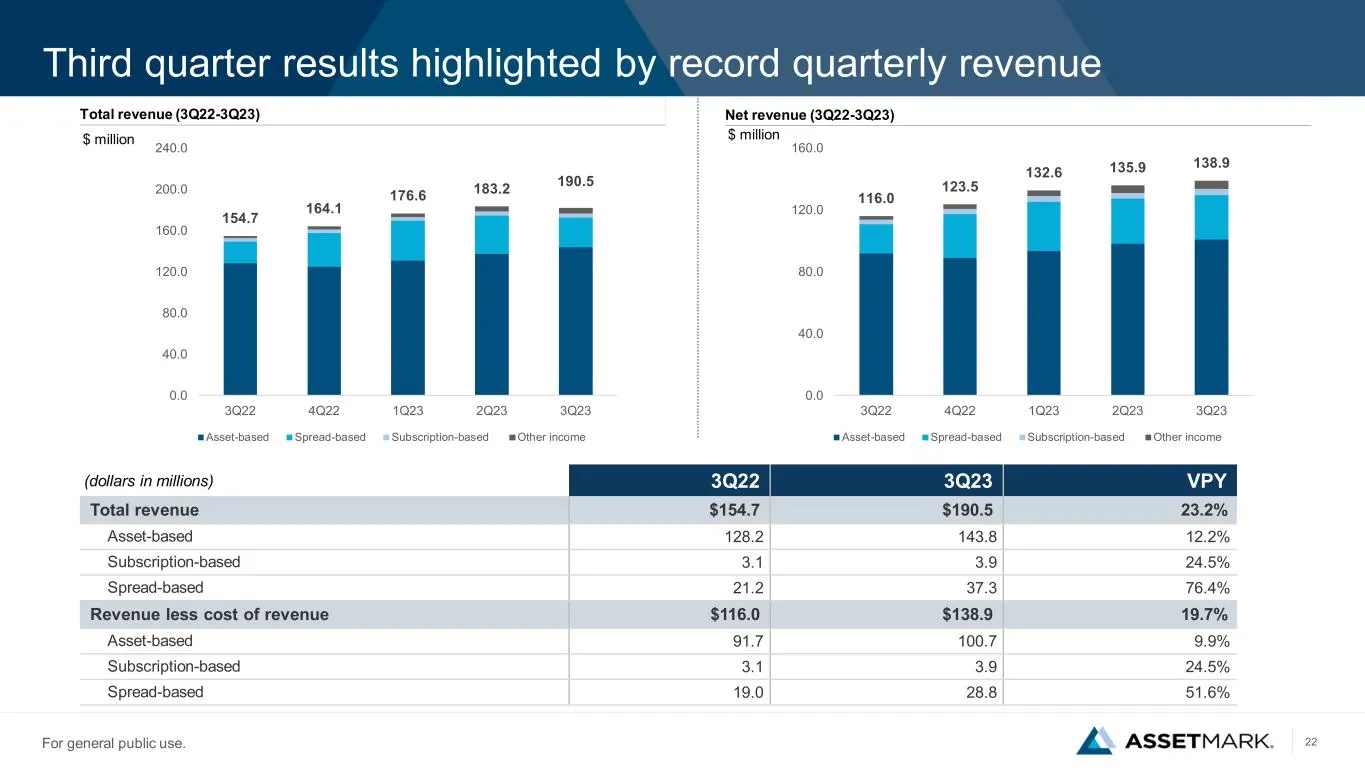
For general public use. 22 Third quarter results highlighted by record quarterly revenue (dollars in millions) 3Q22 3Q23 VPY Total revenue $154.7 $190.5 23.2% Asset-based 128.2 143.8 12.2% Subscription-based 3.1 3.9 24.5% Spread-based 21.2 37.3 76.4% Revenue less cost of revenue $116.0 $138.9 19.7%
Slide 23: Revenue less cost of revenue – year-over-year comparison
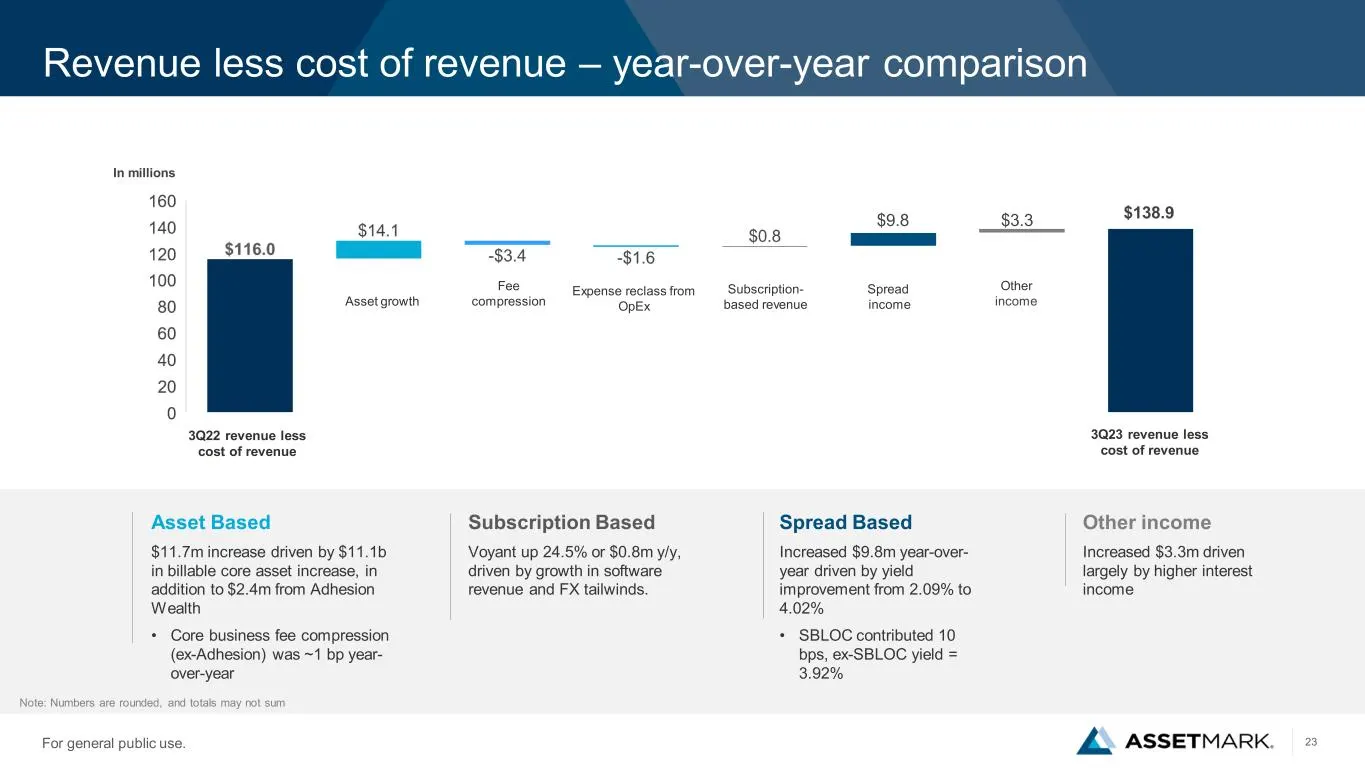
For general public use. 23 Revenue less cost of revenue – year-over-year comparison 3Q22 revenue less cost of revenue Spread income Expense reclass from OpEx Other incomeAsset growth 3Q23 revenue less cost of revenue In millions Asset Based $11.7m increase driven by $11.1b in billable core asset inc
Slide 24: Reported and adjusted expenses
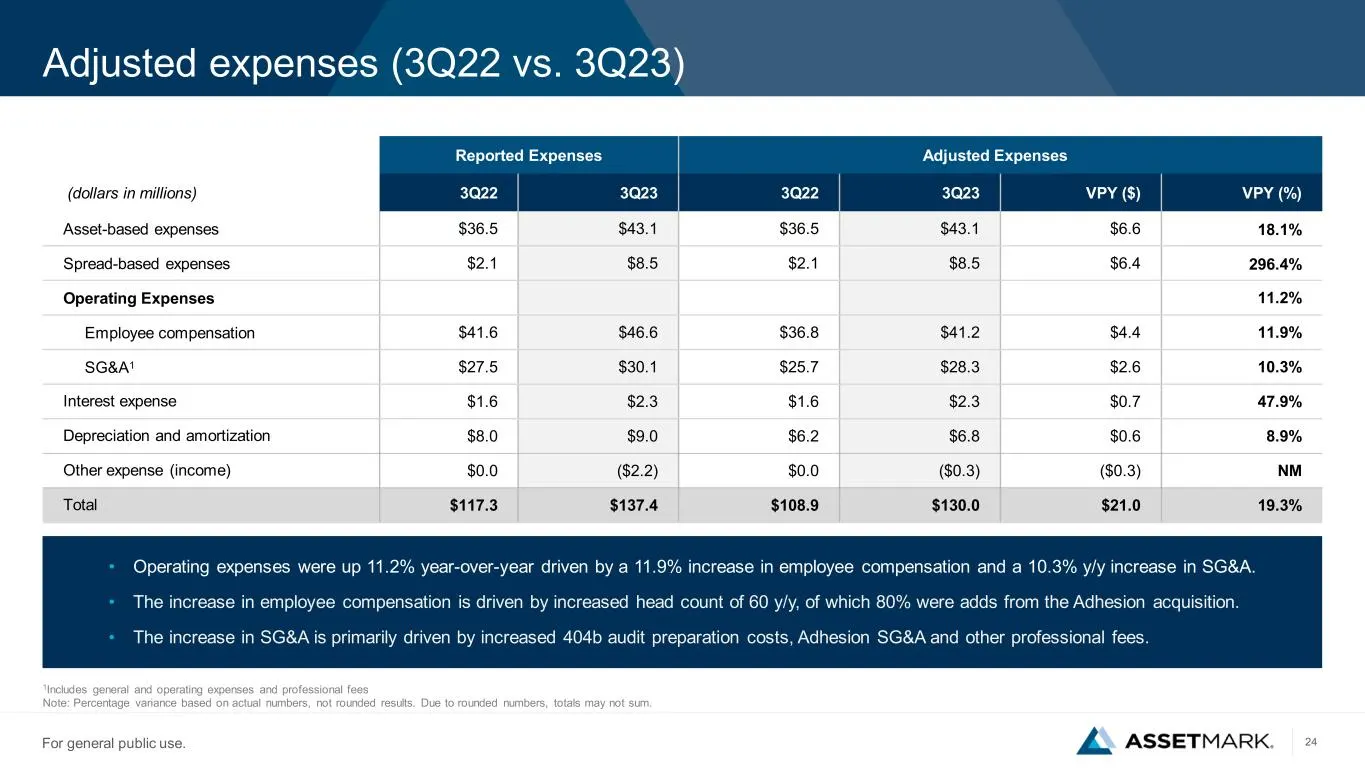
For general public use. 24 Reported Expenses Adjusted Expenses (dollars in millions) 3Q22 3Q23 3Q22 3Q23 VPY ($) VPY (%) Asset-based expenses $36.5 $43.1 $36.5 $43.1 $6.6 18.1% Spread-based expenses $2.1 $8.5 $2.1 $8.5 $6.4 296.4% Operating Expenses 11.2% Employee compensation $41.6 $46.6 $36.8 $41.
Slide 25: Bottom line results highlighted by record adj. EBITDA and adj. net income
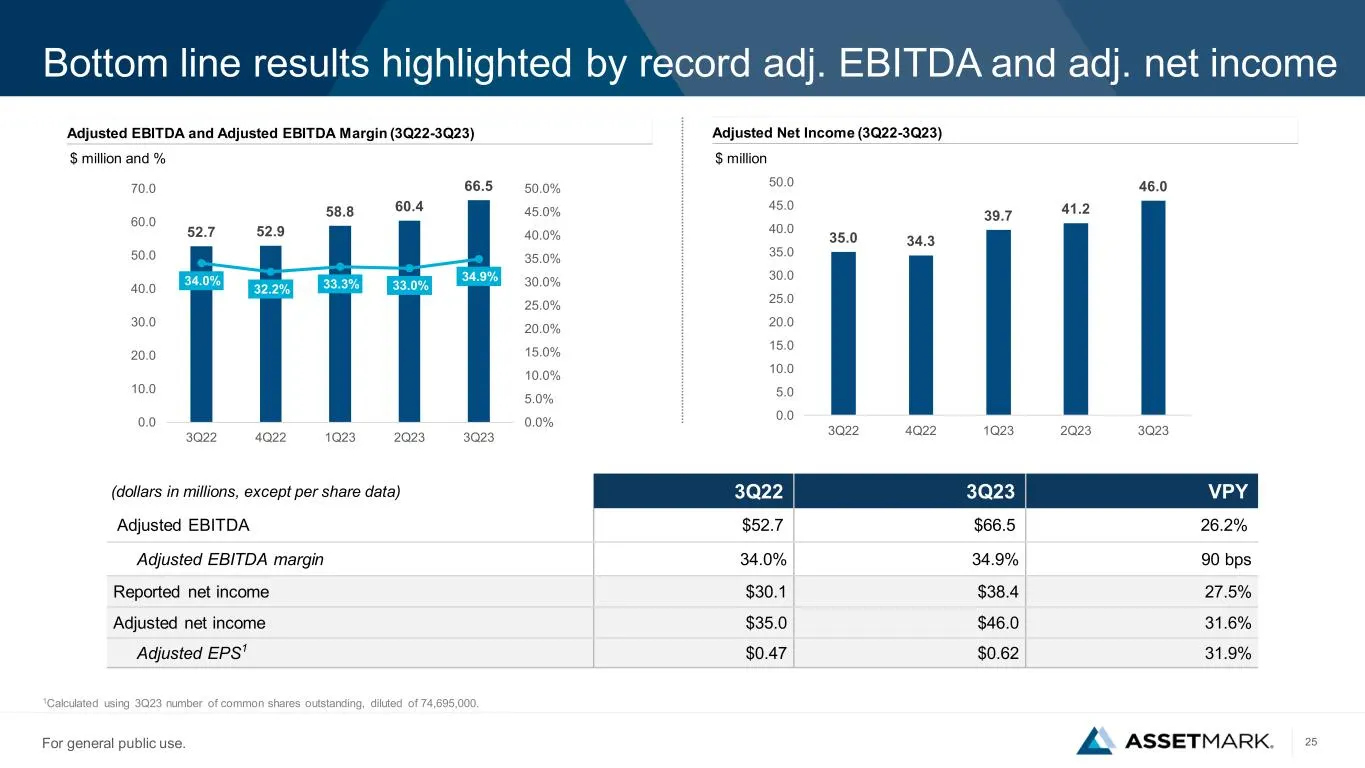
For general public use. 25 (dollars in millions, except per share data) 3Q22 3Q23 VPY Adjusted EBITDA $52.7 $66.5 26.2% Adjusted EBITDA margin 34.0% 34.9% 90 bps Reported net income $30.1 $38.4 27.5% Adjusted net income $35.0 $46.0 31.6% Adjusted EPS1 $0.47 $0.62 31.9% 1Calculated using 3Q23 number
Slide 26: Spread revenue is meaningful; we remain well hedged
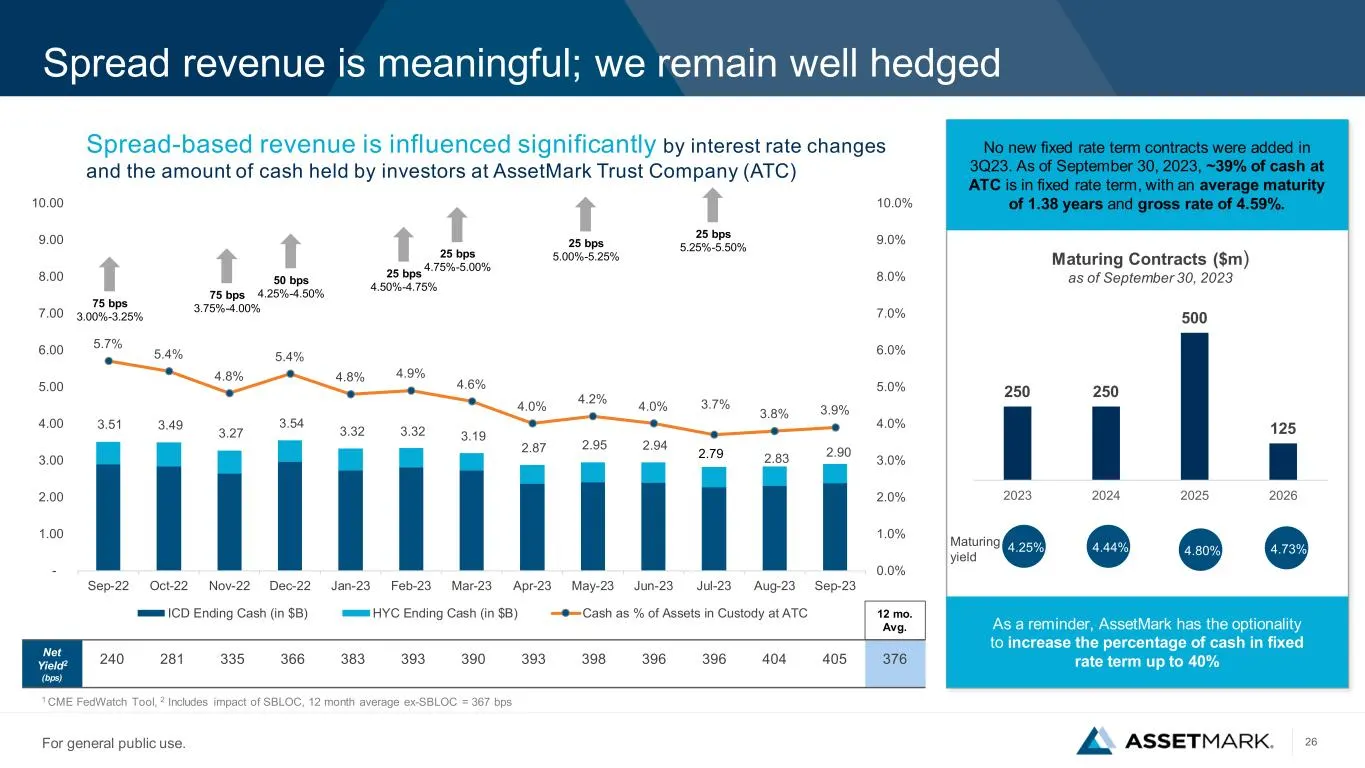
For general public use. 26 3.51 3.49 3.27 3.54 3.32 3.32 3.19 2.87 2.95 2.94 2.79 2.83 2.90 5.7% 5.4% 4.8% 5.4% 4.8% 4.9% 4.6% 4.0% 4.2% 4.0% 3.7% 3.8% 3.9% 0.0% 1.0% 2.0% 3.0% 4.0% 5.0% 6.0% 7.0% 8.0% 9.0% 10.0% - 1.00 2.00 3.00 4.00 5.00 6.00 7.00 8.00 9.00 10.00 Sep-22 Oct-22 Nov-22 Dec-22 Jan-23
Slide 27: 2023 outlook
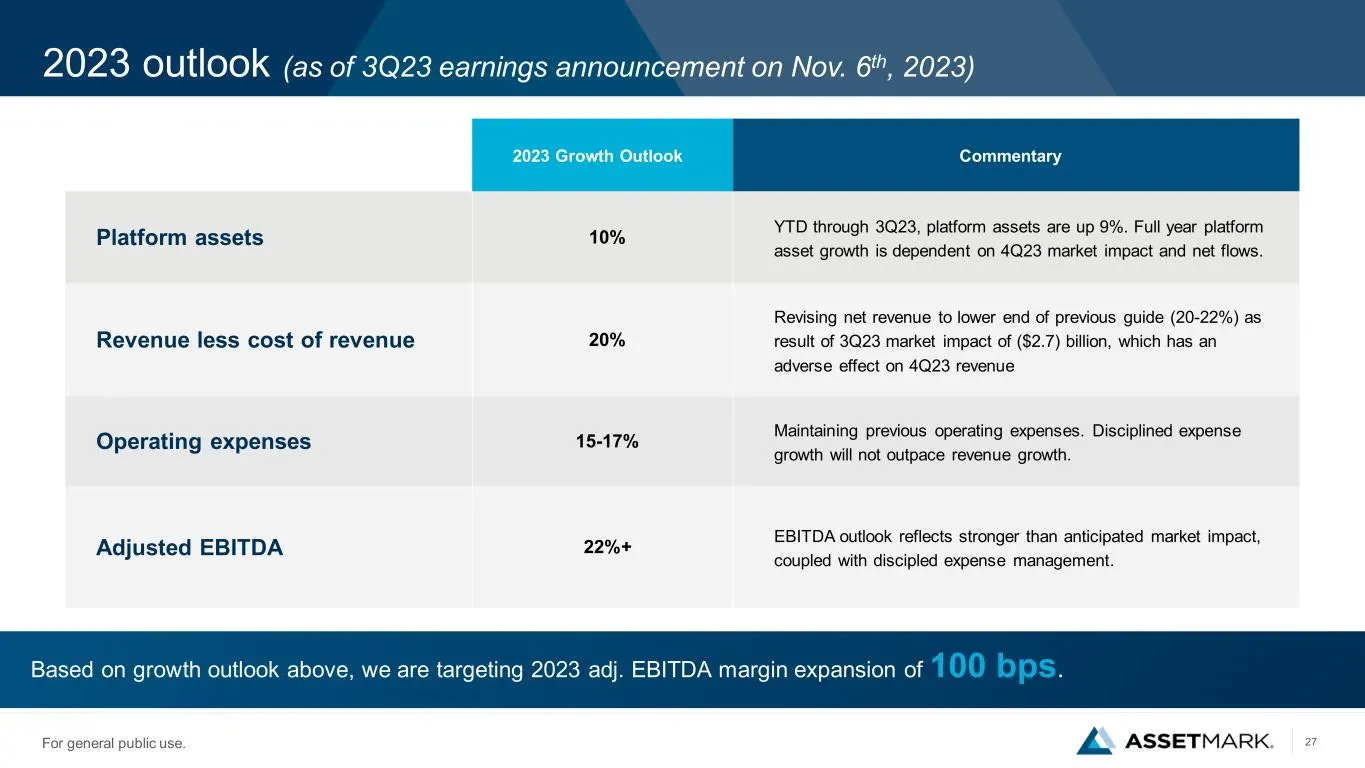
For general public use. 27 2023 outlook (as of 3Q23 earnings announcement on Nov. 6th, 2023) 2023 Growth Outlook Commentary Platform assets 10% YTD through 3Q23, platform assets are up 9%. Full year platform asset growth is dependent on 4Q23 market impact and net flows. Revenue less cost of revenue
Slide 28: Contents
For general public use. 28 Contents What We Do Who We Serve How We Differentiate Financial Results Appendix
Slide 29: Revenue less cost of revenue reconciliation
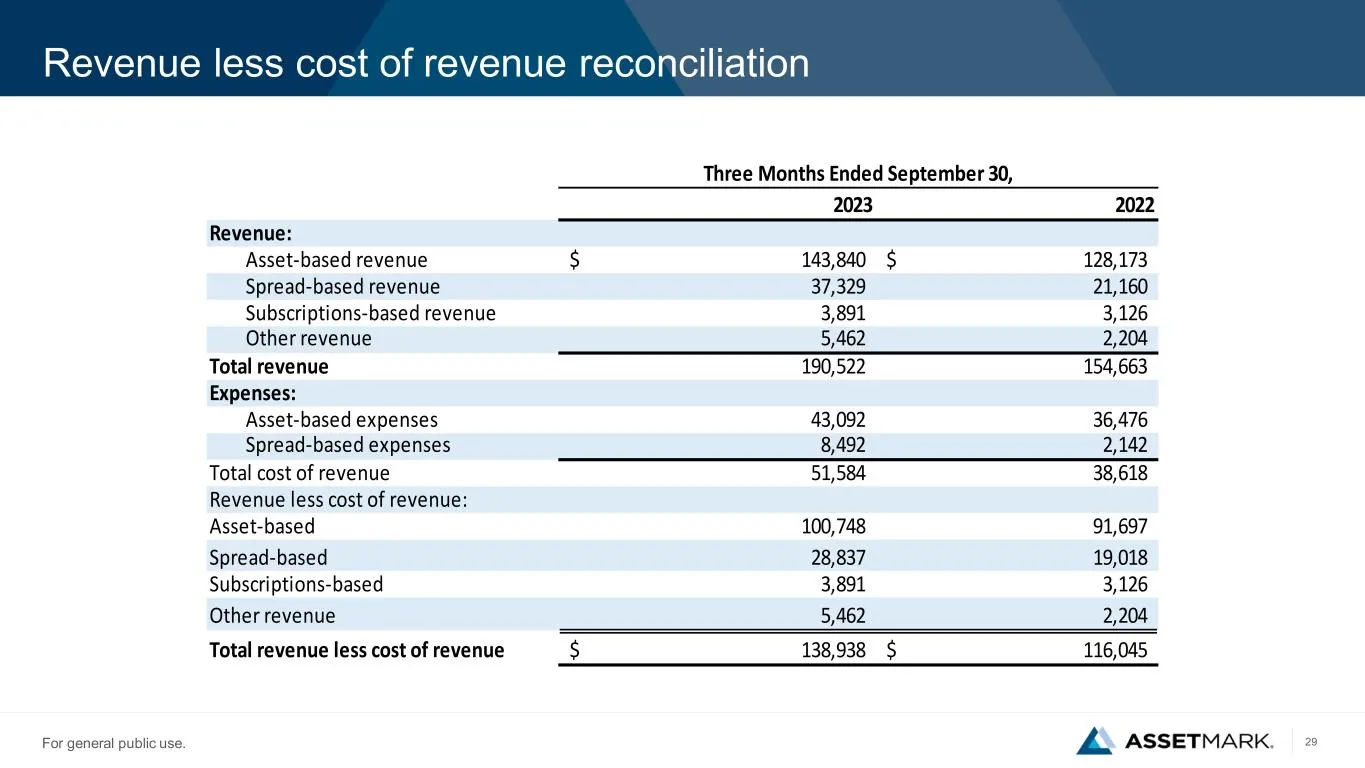
For general public use. 29 Revenue less cost of revenue reconciliation 2023 2022 Revenue: Asset-based revenue 143,840$ 128,173$ Spread-based revenue 37,329 21,160 Subscriptions-based revenue 3,891 3,126 Other revenue 5,462 2,204 Total revenue 190,522 154,663 Expenses: Asset-based expenses 43,092 36,
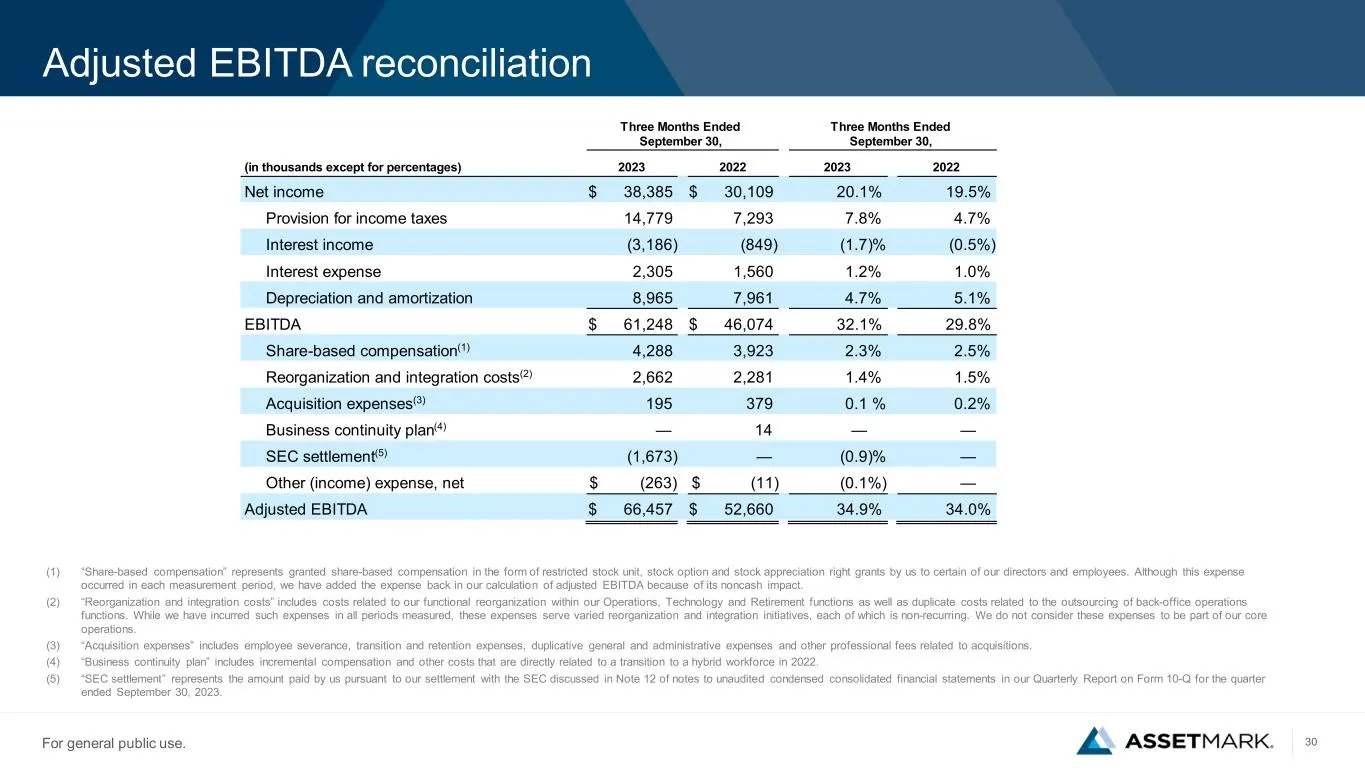
Slide 30: Adjusted EBITDA reconciliation
For general public use. 30 Adjusted EBITDA reconciliation (1) “Share-based compensation” represents granted share-based compensation in the form of restricted stock unit, stock option and stock appreciation right grants by us to certain of our directors and employees. Although this expense occurred
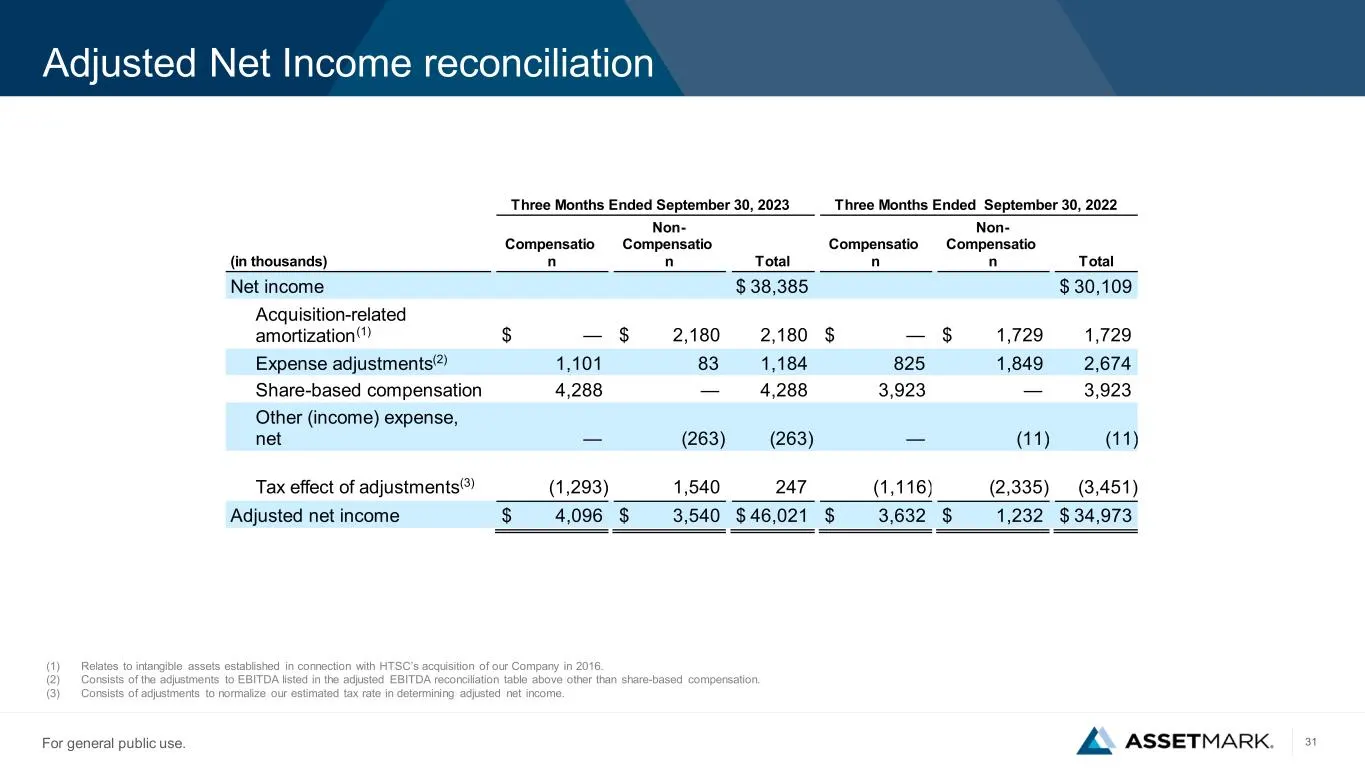
Slide 31: Adjusted Net Income reconciliation
For general public use. 31 Adjusted Net Income reconciliation (1) Relates to intangible assets established in connection with HTSC’s acquisition of our Company in 2016. (2) Consists of the adjustments to EBITDA listed in the adjusted EBITDA reconciliation table above other than share-based compensat
Source: SEC EDGAR · 8-K filed Dec 1, 2023
More decks from AssetMark Financial Holdings Inc
 Conference Presentation (April 2026)18 slides · April 2026
 EA Webinar (April 2026)15 slides · April 2026
 AssetMark GOLDFORUM 202626 slides · March 2026
 Investor Presentation (March 2026)26 slides · March 2026
 AssetMark Platinum Summit 20247 slides · 2024
 1Q23 Gold Forum (February 2023)27 slides · February 2023