Santander Holdings USA Inc · NYSE:SNUS/PH
Santander Holdings USA — Debt Investor Presentation (November 2020)
40 slides from Santander Holdings USA's debt investor presentation, Nov 9, 2020
Slide 1: Fixed Income Investor Presentation Third Quarter 2020
SANTANDER HOLDINGS USA, INC. Fixed Income Investor Presentation Third Quarter 2020 November 9, 2020
Slide 2: Disclaimer
DISCLAIMER This presentation of Santander Holdings USA, Inc. (“SHUSA”) contains “forward-looking statements” within the meaning of the Private Securities Litigation Reform Act of 1995 regarding the financial condition, results of operations, business plans and future performance of SHUSA. Words such
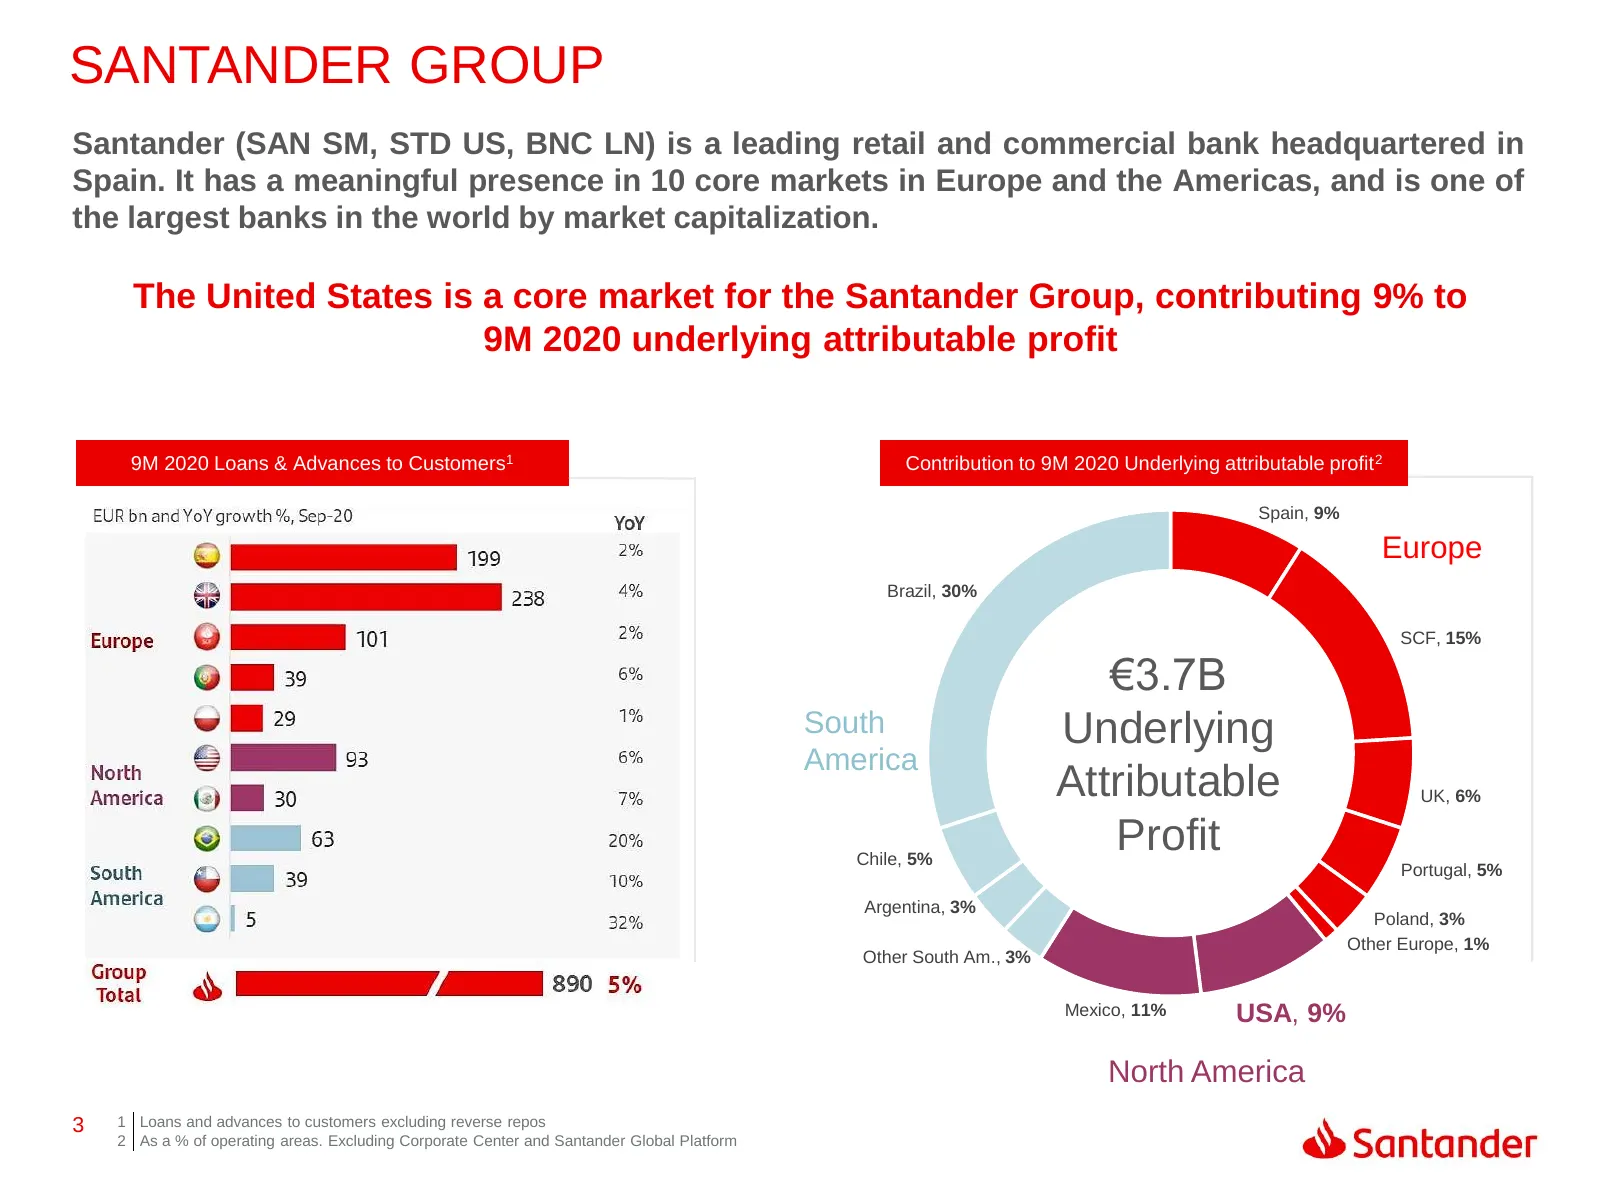
Slide 3: Santander Group
SANTANDER GROUP Santander (SAN SM, STD US, BNC LN) is a leading retail and commercial bank headquartered in Spain. It has a meaningful presence in 10 core markets in Europe and the Americas, and is one of the largest banks in the world by market capitalization. The United States is a core market for
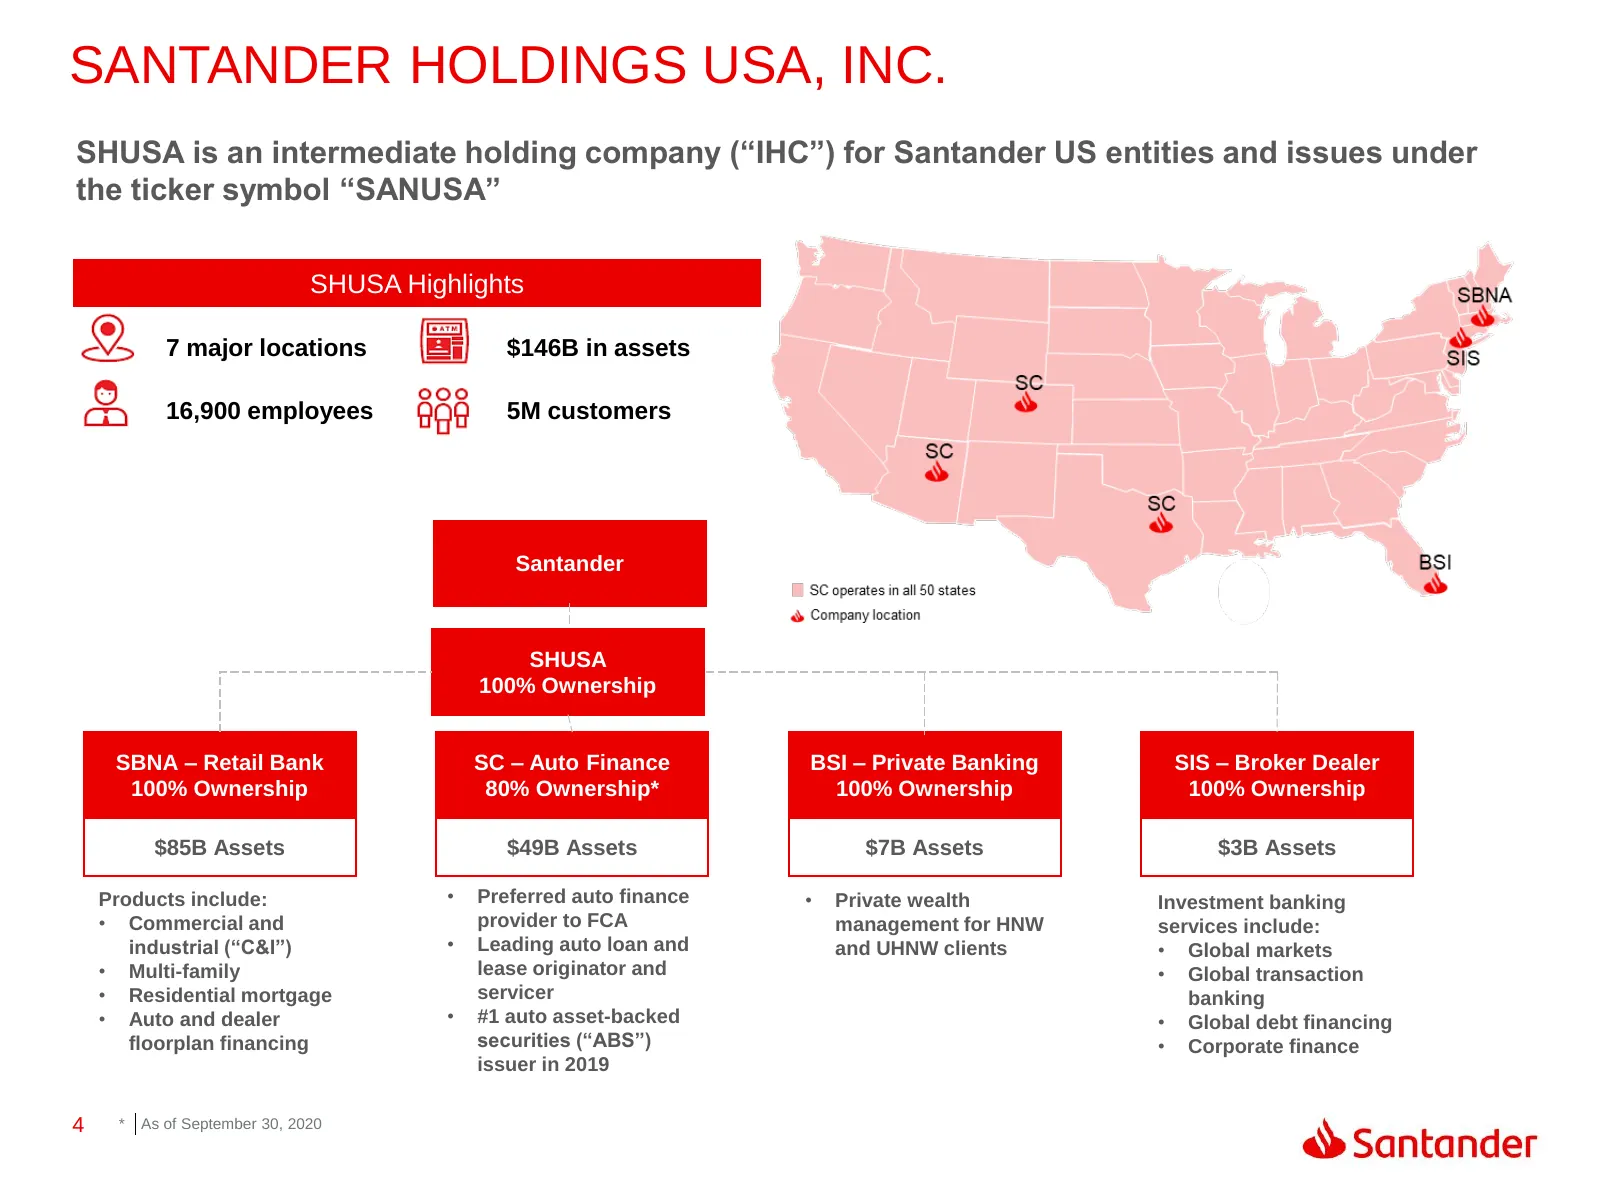
Slide 4: Santander Holdings USA, Inc.
SANTANDER HOLDINGS USA, INC. SHUSA is an intermediate holding company (“IHC”) for Santander US entities and issues under the ticker symbol “SANUSA” SHUSA Highlights 7 major locations $146B in assets 16,900 employees 5M customers Santander SHUSA 100% Ownership SBNA – Retail Bank SC – Auto Finance BSI
Slide 5: Santander Bank
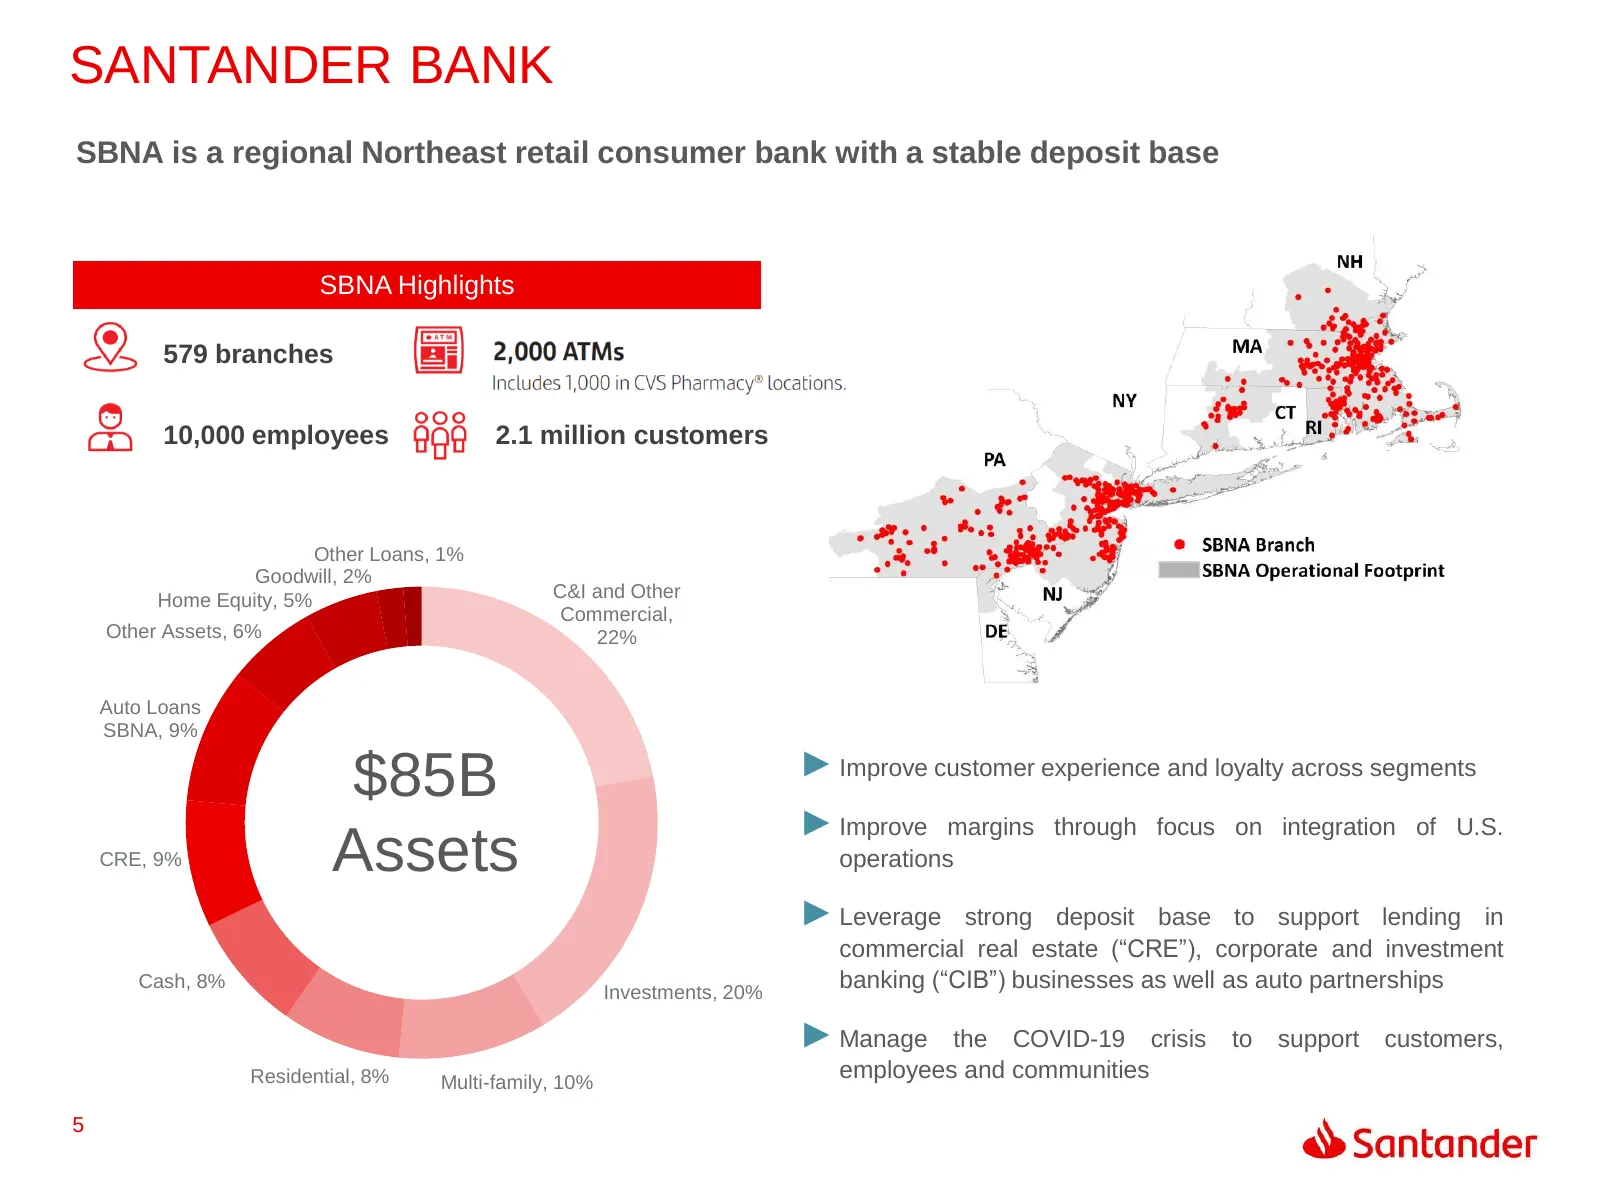
SANTANDER BANK SBNA is a regional Northeast retail consumer bank with a stable deposit base SBNA Highlights 579 branches 10,000 employees 2.1 million customers Other Loans, 1% Goodwill, 2% Home Equity, 5% C&I and Other Commercial, Other Assets, 6% 22% Auto Loans SBNA, 9% ► Improve customer experienc
Slide 6: Santander Consumer USA
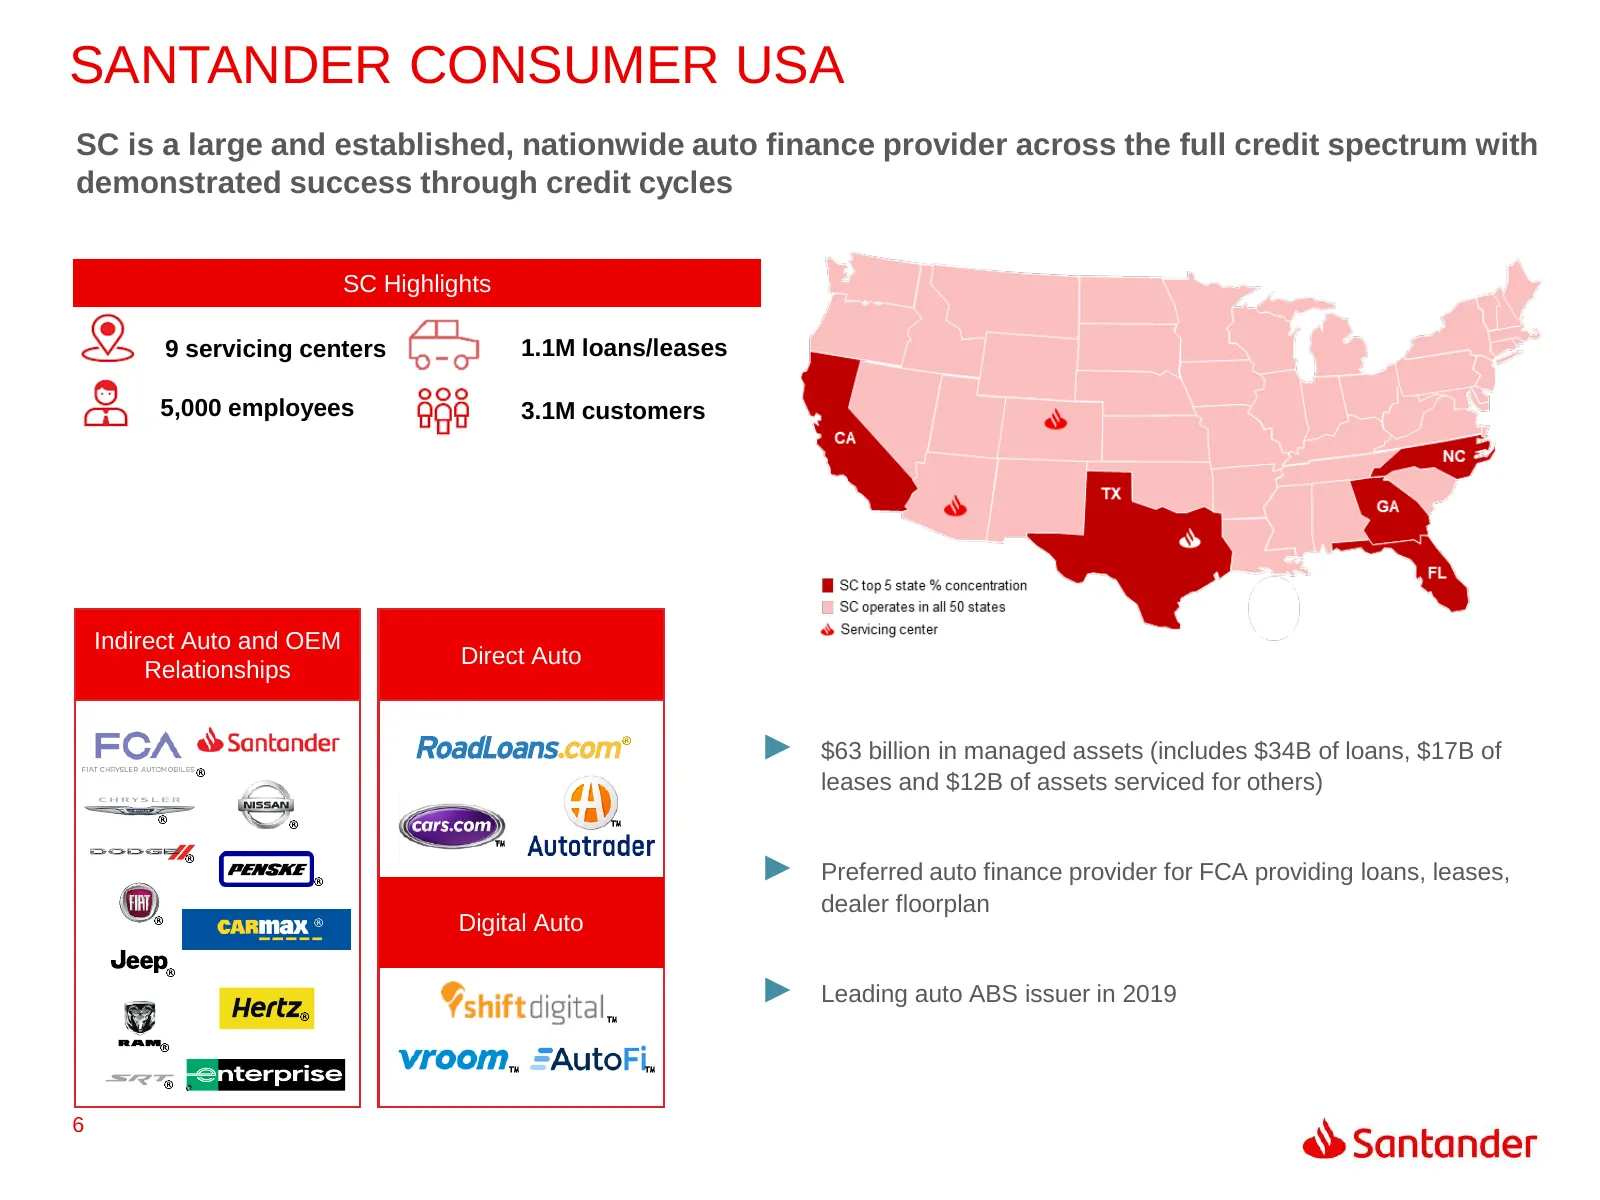
SANTANDER CONSUMER USA SC is a large and established, nationwide auto finance provider across the full credit spectrum with demonstrated success through credit cycles SC Highlights 9 servicing centers 1.1M loans/leases 5,000 employees 3.1M customers Indirect Auto and OEM Direct Auto Relationships ►
Slide 7: Earnings Highlights
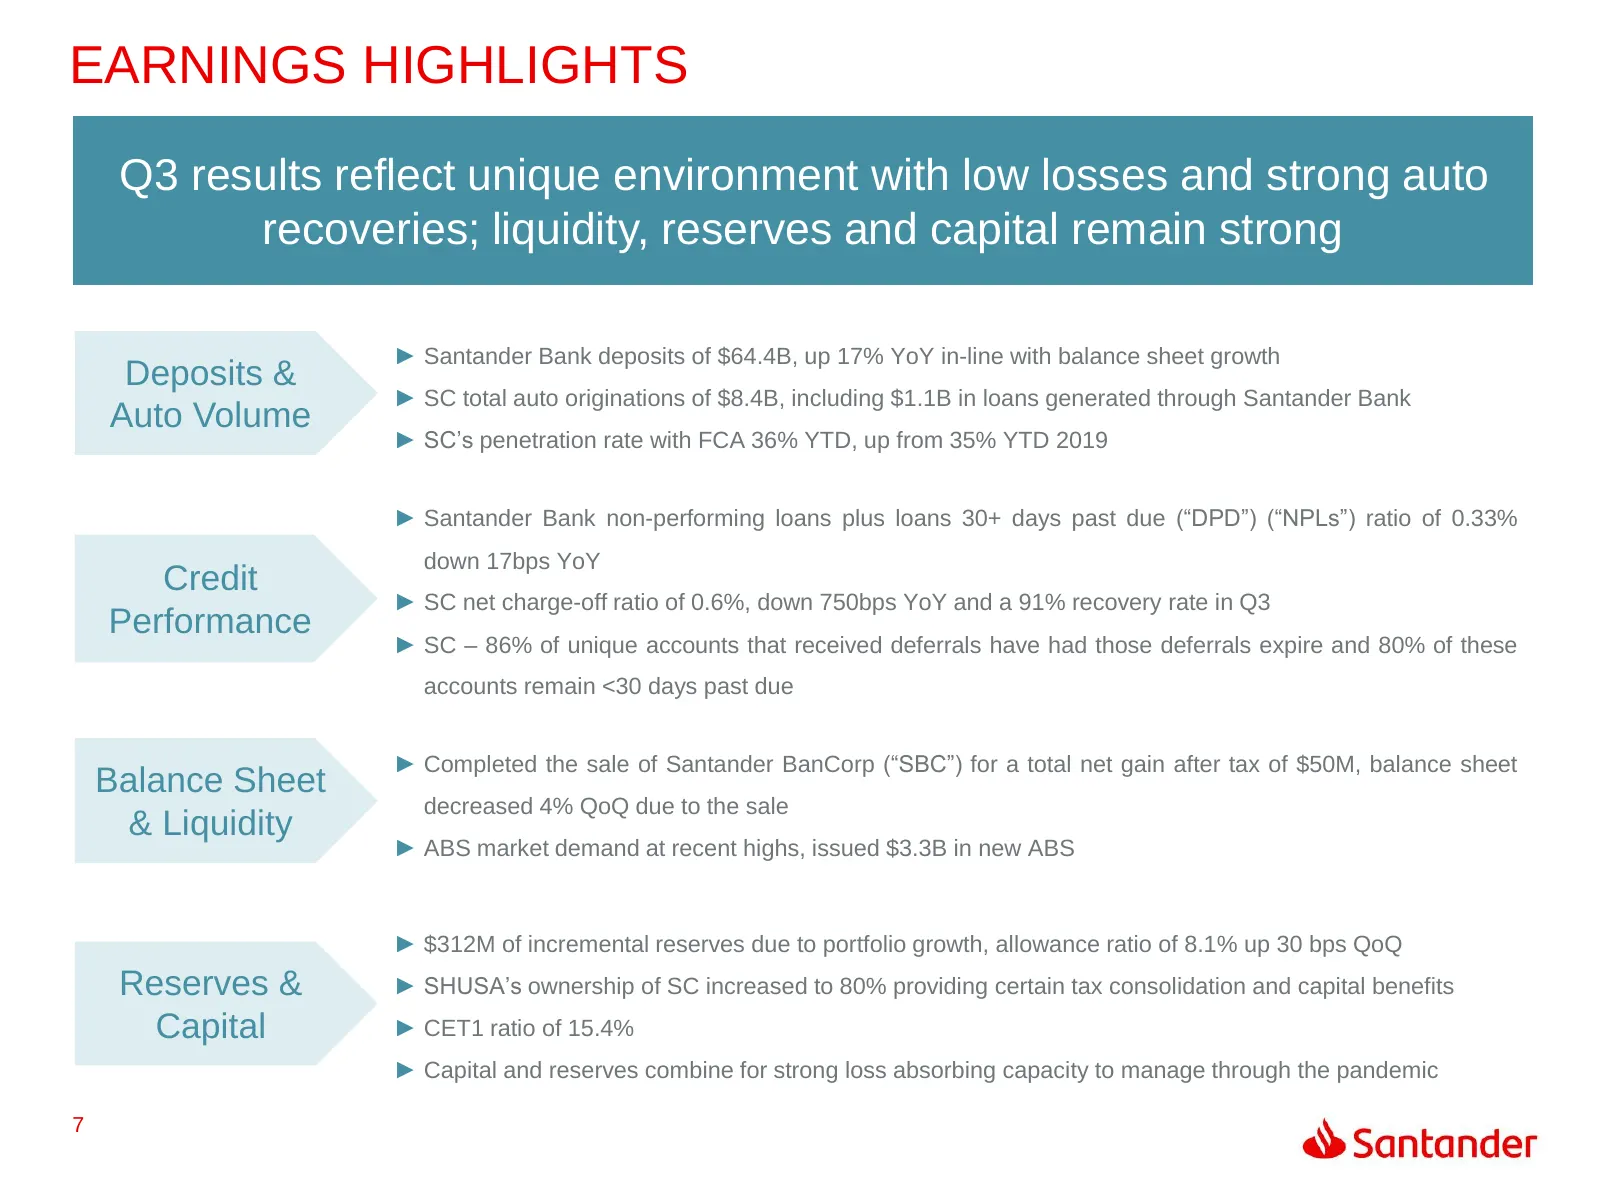
EARNINGS HIGHLIGHTS Q3 results reflect unique environment with low losses and strong auto recoveries; liquidity, reserves and capital remain strong ► Santander Bank deposits of $64.4B, up 17% YoY in-line with balance sheet growth Deposits & ► SC total auto originations of $8.4B, including $1.1B in l
Slide 8: Capital Plan Update
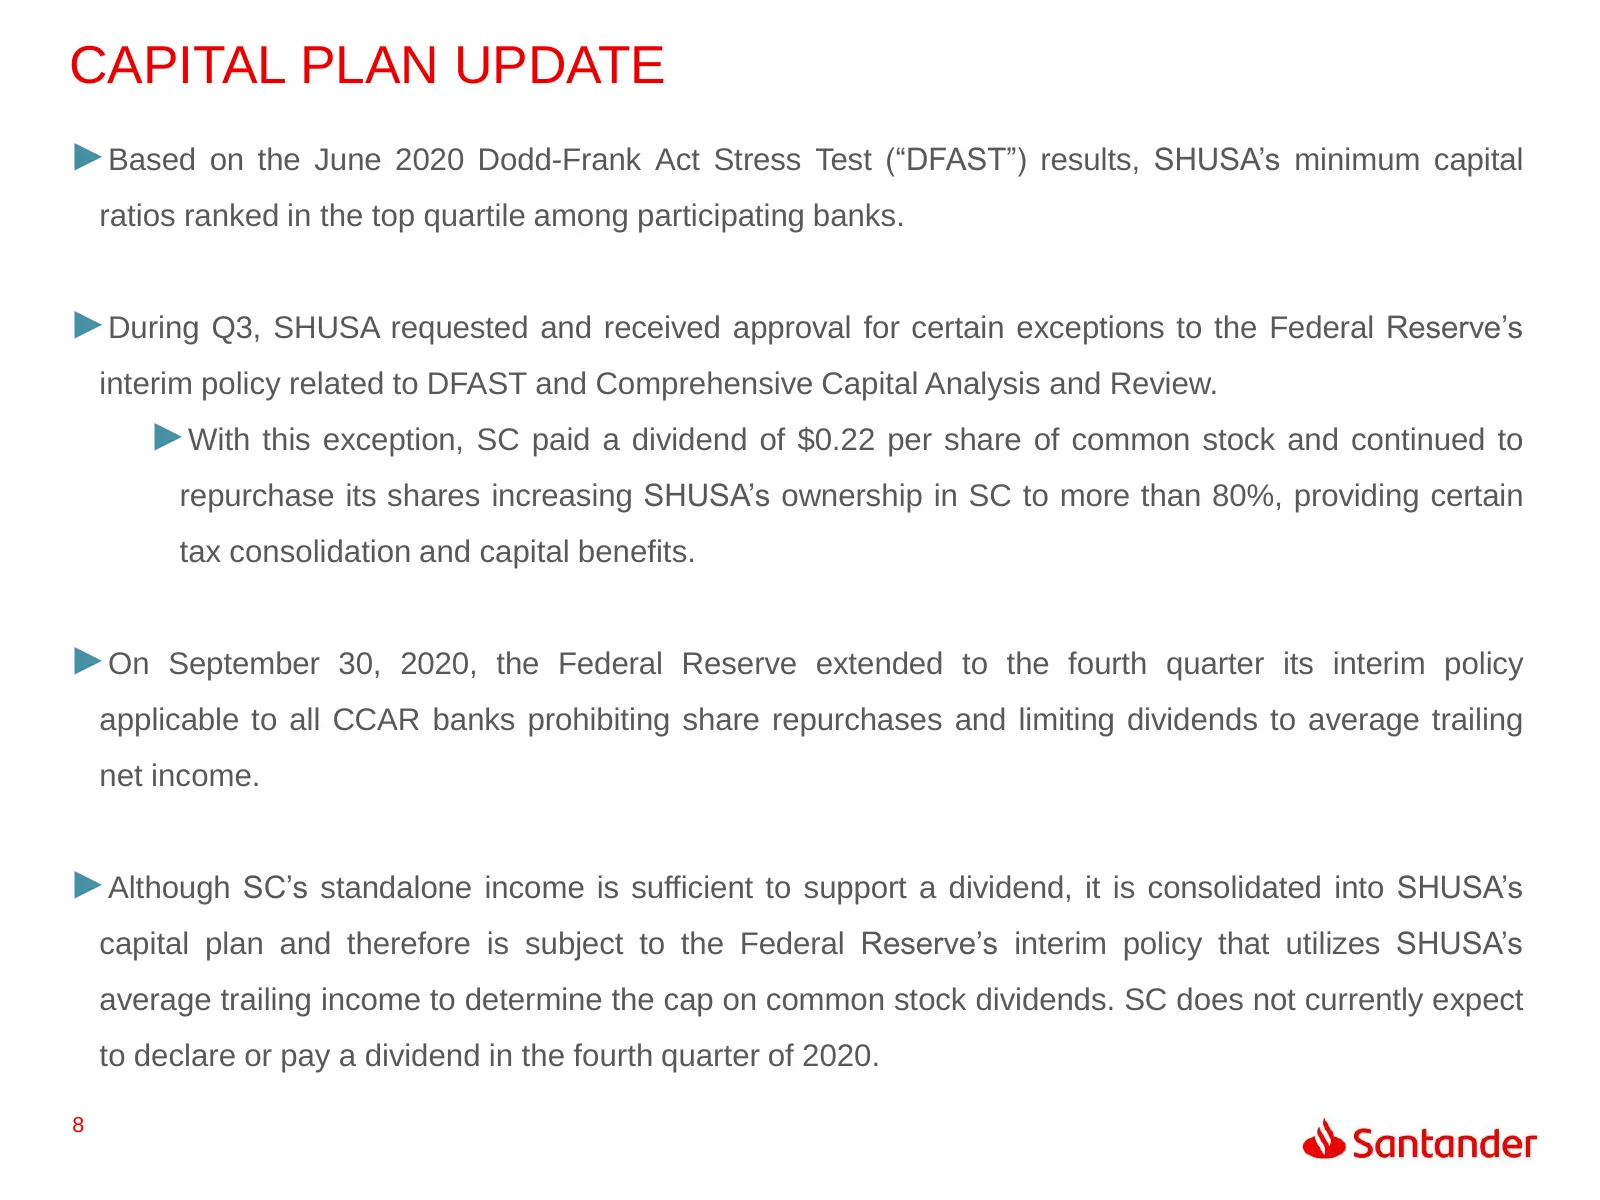
CAPITAL PLAN UPDATE ►Based on the June 2020 Dodd-Frank Act Stress Test (“DFAST”) results, SHUSA’s minimum capital ratios ranked in the top quartile among participating banks. ►During Q3, SHUSA requested and received approval for certain exceptions to the Federal Reserve’s interim policy related to D
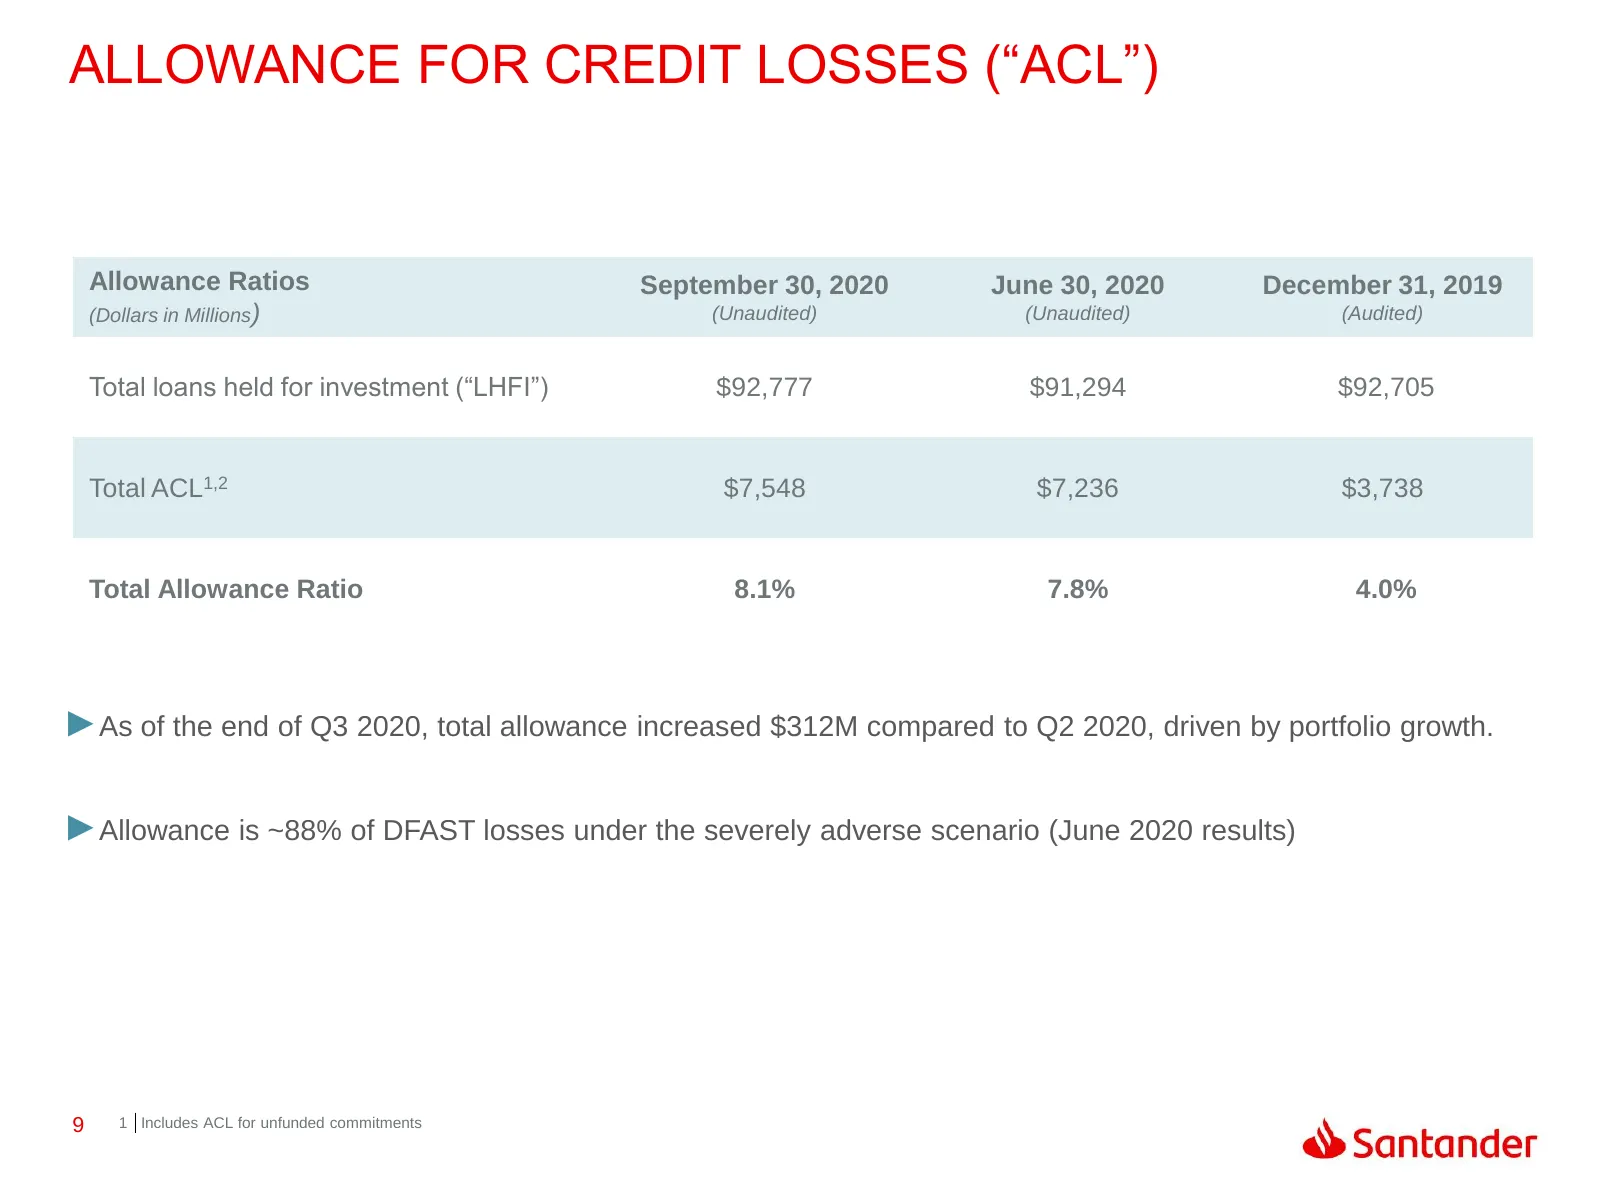
Slide 9: Allowance for Credit Losses ("ACL")
ALLOWANCE FOR CREDIT LOSSES (“ACL”) Allowance Ratios September 30, 2020 June 30, 2020 December 31, 2019 (Dollars in Millions) (Unaudited) (Unaudited) (Audited) Total loans held for investment (“LHFI”) $92,777 $91,294 $92,705 Total ACL1,2 $7,548 $7,236 $3,738 Total Allowance Ratio 8.1% 7.8% 4.0% ►As
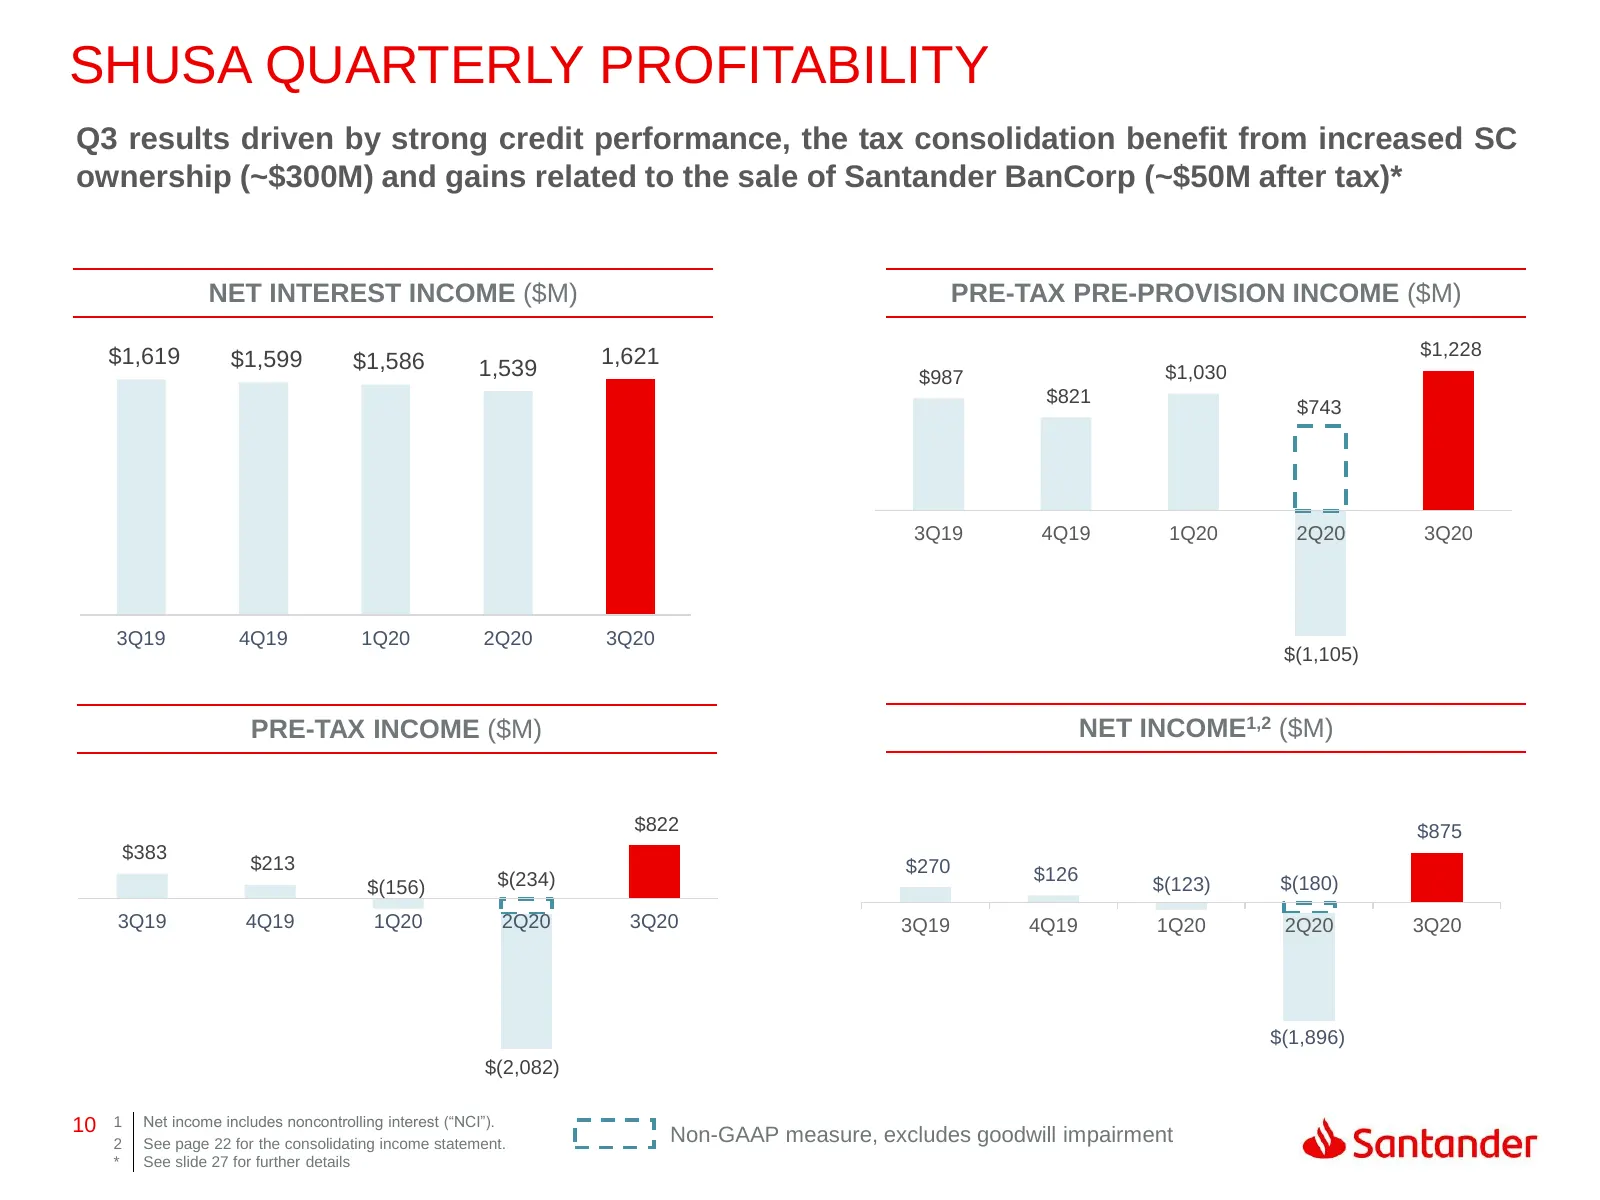
Slide 10: SHUSA Quarterly Profitability
SHUSA QUARTERLY PROFITABILITY Q3 results driven by strong credit performance, the tax consolidation benefit from increased SC ownership (~$300M) and gains related to the sale of Santander BanCorp (~$50M after tax)* NET INTEREST INCOME ($M) PRE-TAX PRE-PROVISION INCOME ($M) $1,619 1,621 $1,228 $1,599
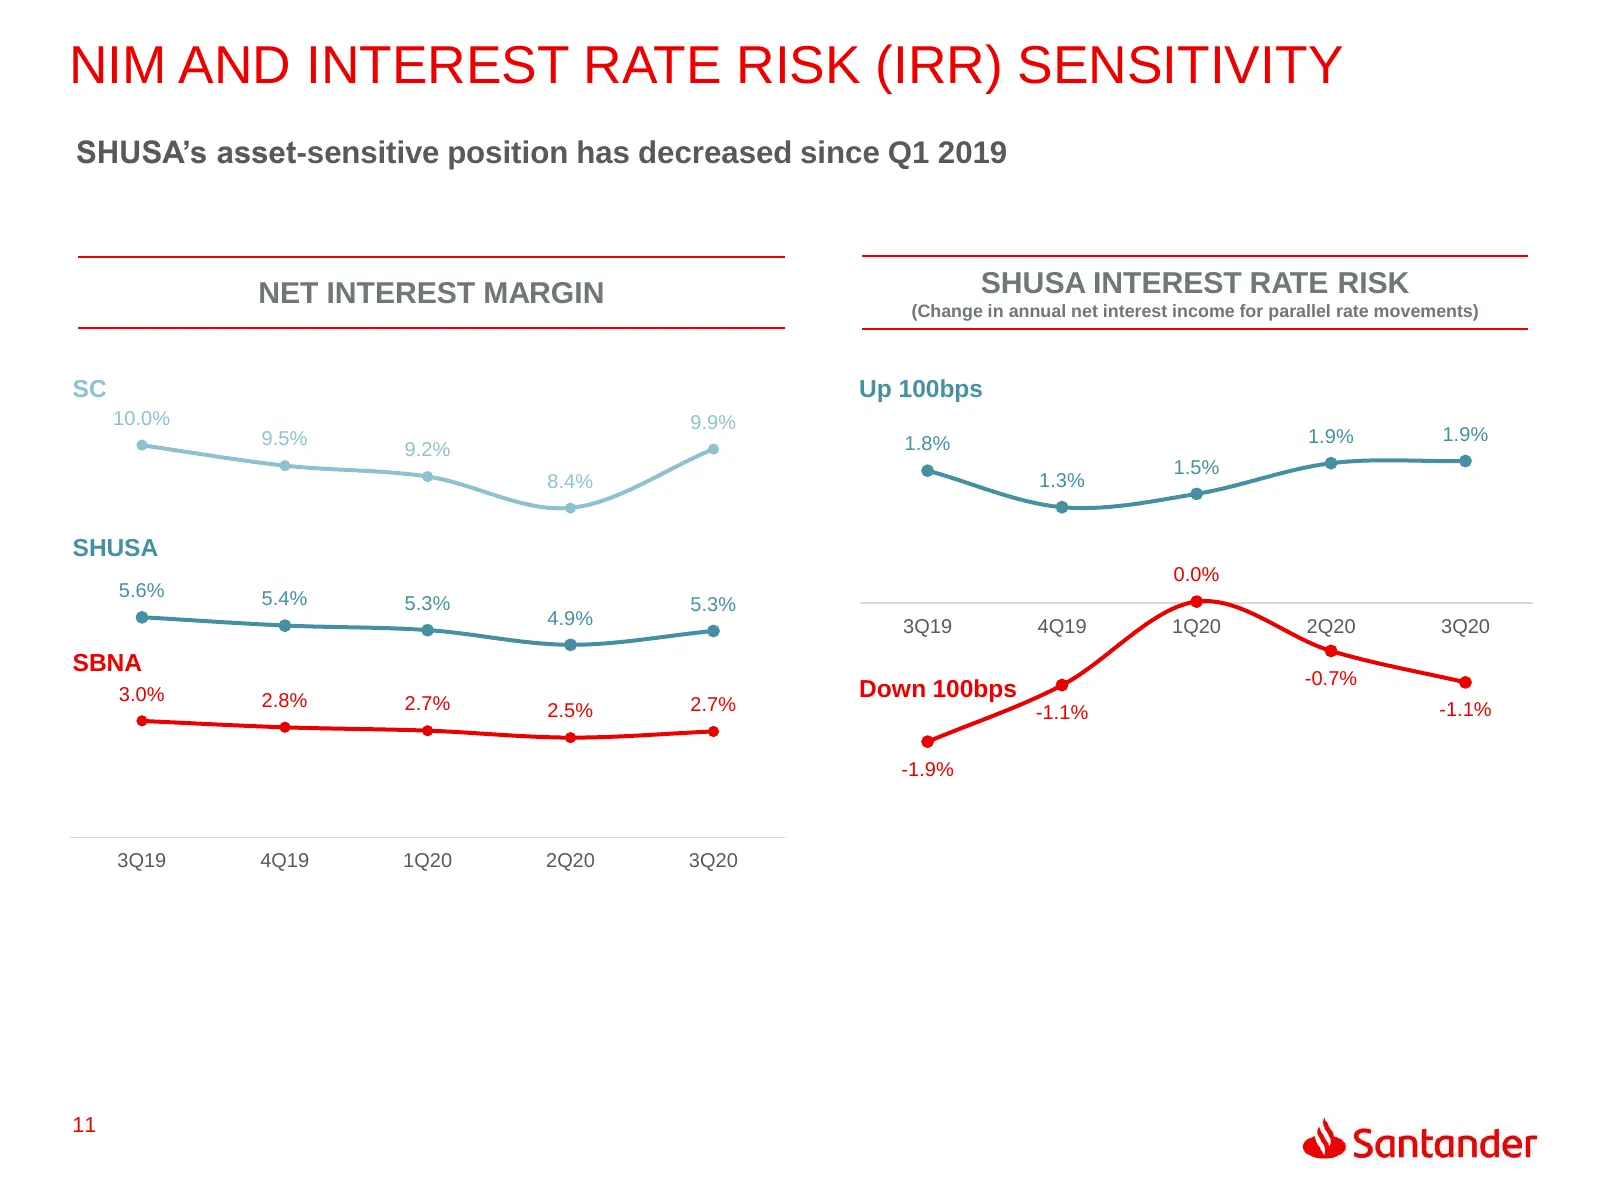
Slide 11: NIM and Interest Rate Risk (IRR) Sensitivity
NIM AND INTEREST RATE RISK (IRR) SENSITIVITY SHUSA’s asset-sensitive position has decreased since Q1 2019 NET INTEREST MARGIN SHUSA INTEREST RATE RISK (Change in annual net interest income for parallel rate movements) SC Up 100bps 10.0% 9.9% 9.5% 1.8% 1.9% 1.9% 9.2% 1.5% 8.4% 1.3% SHUSA 0.0% 5.6% 5.
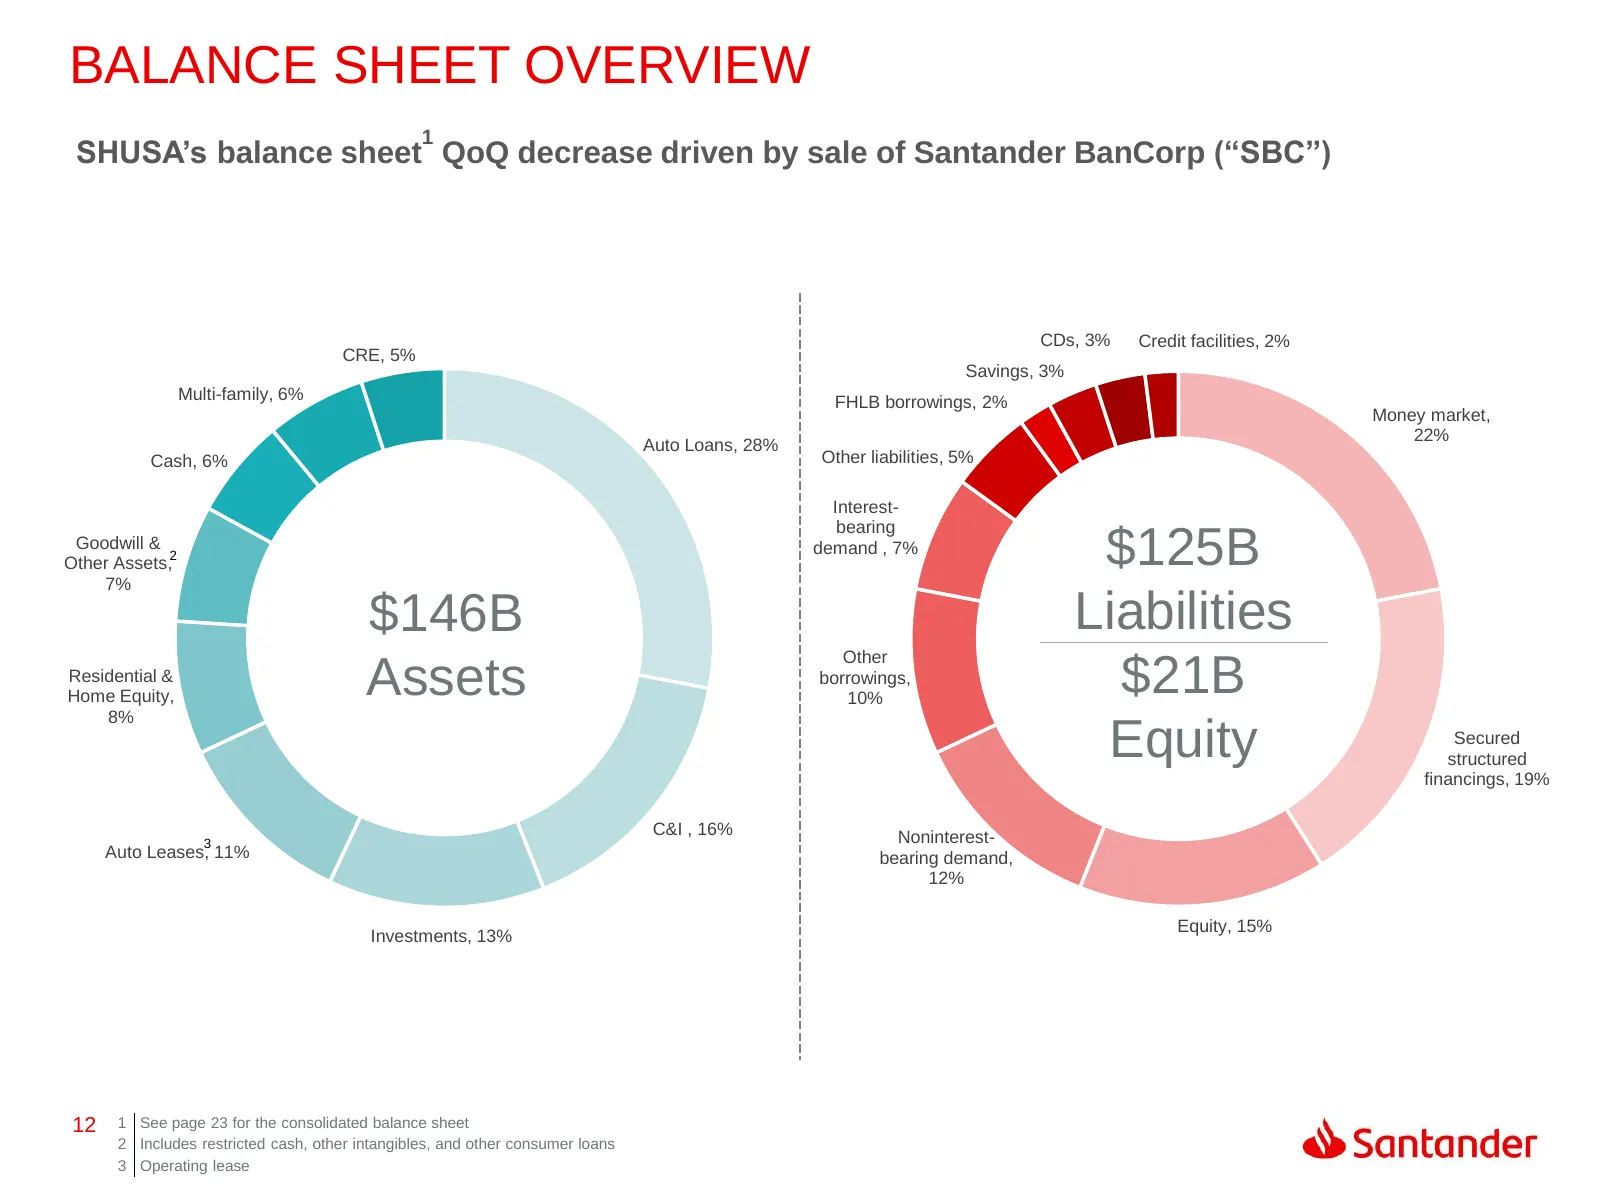
Slide 12: Balance Sheet Overview
BALANCE SHEET OVERVIEW 1 SHUSA’s balance sheet QoQ decrease driven by sale of Santander BanCorp (“SBC”) CDs, 3% Credit facilities, 2% CRE, 5% Savings, 3% Multi-family, 6% FHLB borrowings, 2% Money market, 22% Auto Loans, 28% Cash, 6% Other liabilities, 5% Interest- bearing Goodwill & Other Assets,2
Slide 13: Balance Sheet Trends
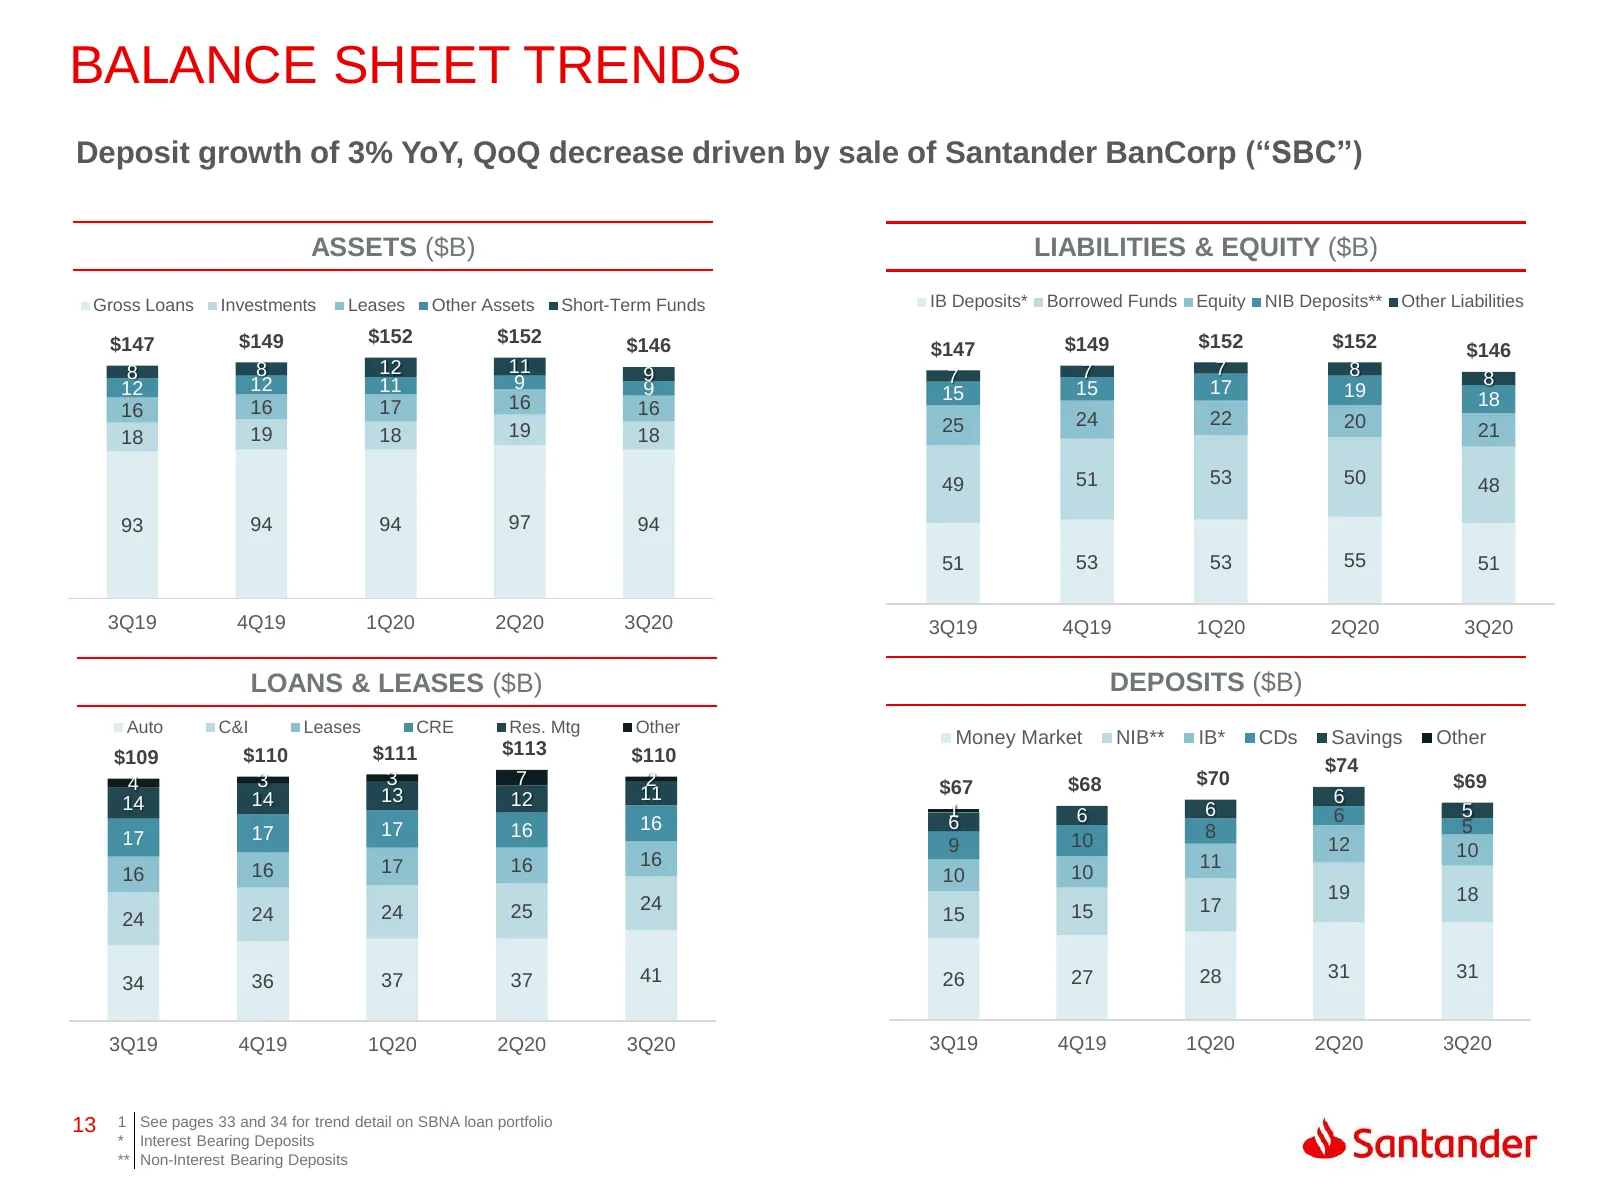
BALANCE SHEET TRENDS Deposit growth of 3% YoY, QoQ decrease driven by sale of Santander BanCorp (“SBC”) ASSETS ($B) LIABILITIES & EQUITY ($B) Gross Loans Investments Leases Other Assets Short-Term Funds IB Deposits* Borrowed Funds Equity NIB Deposits** Other Liabilities $147 $149 $152 $152 $146 $149
Slide 14: Borrowed Funds Profile
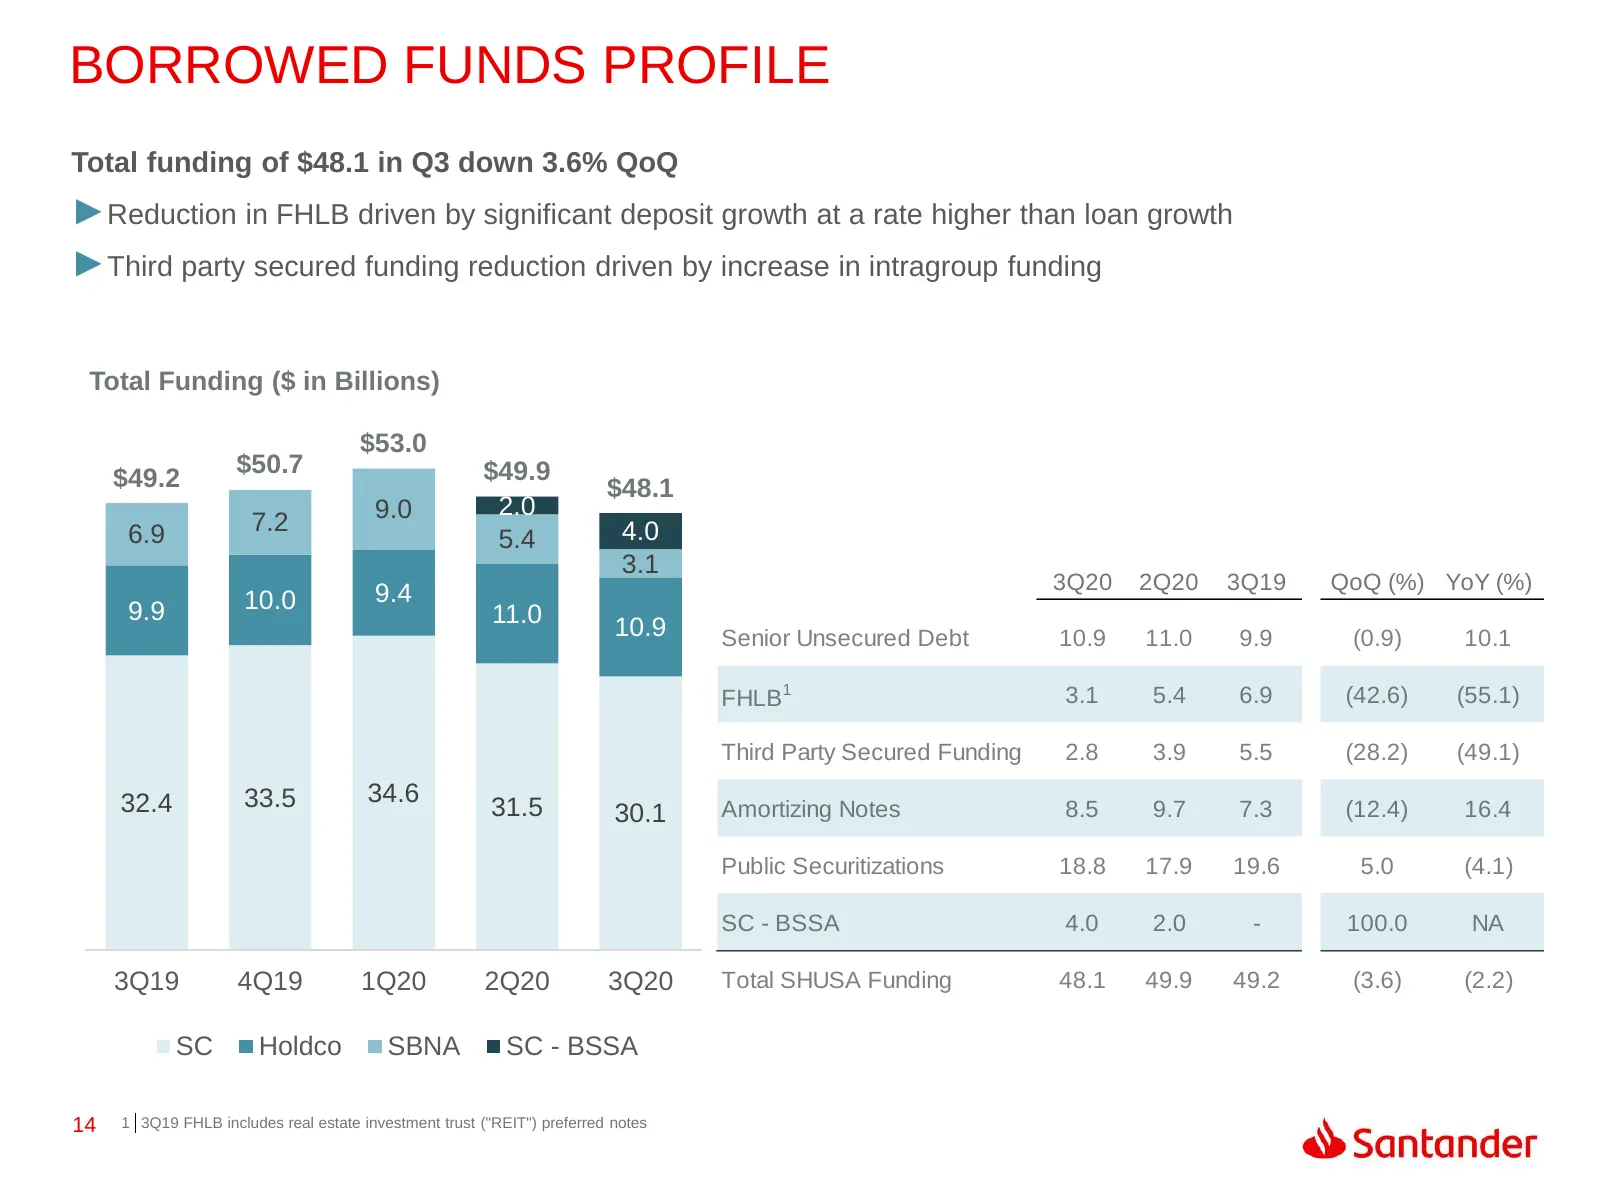
BORROWED FUNDS PROFILE Total funding of $48.1 in Q3 down 3.6% QoQ ►Reduction in FHLB driven by significant deposit growth at a rate higher than loan growth ►Third party secured funding reduction driven by increase in intragroup funding Total Funding ($ in Billions) $53.0 $49.2 $50.7 $49.9 $48.1 9.0
Slide 15: SHUSA Debt & TLAC
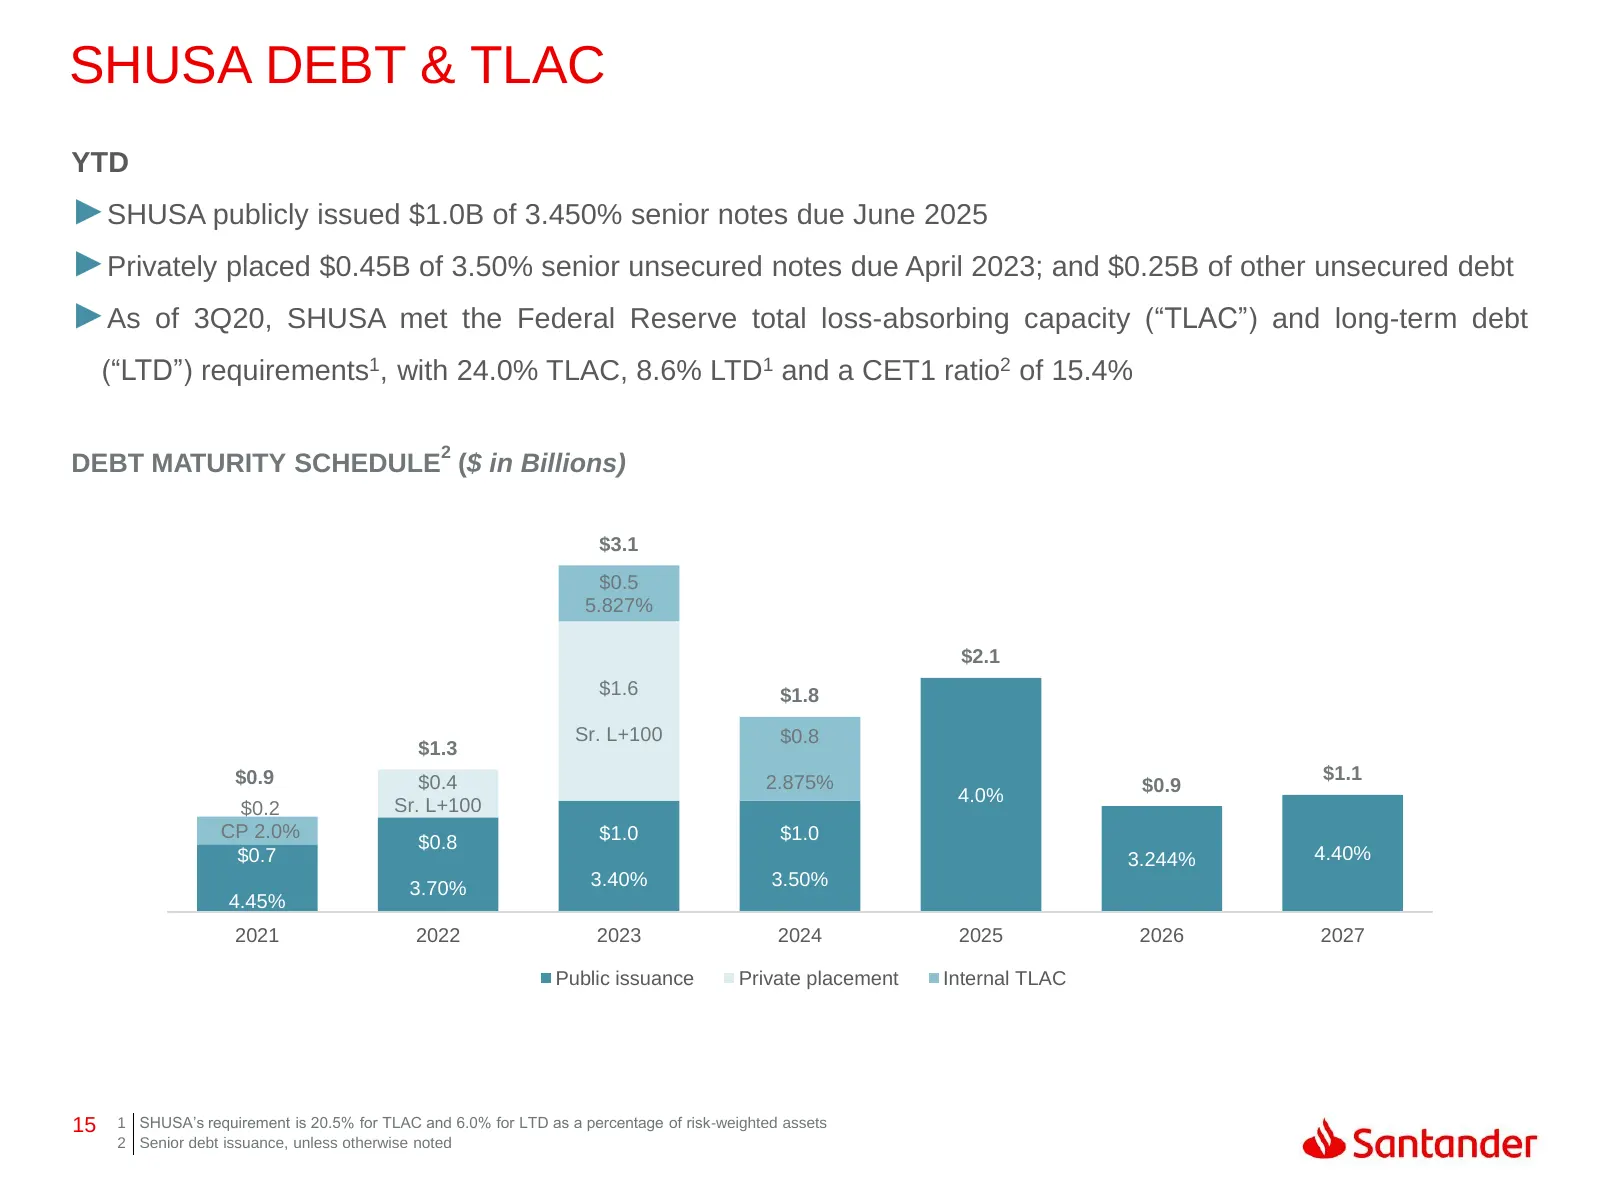
SHUSA DEBT & TLAC YTD ►SHUSA publicly issued $1.0B of 3.450% senior notes due June 2025 ►Privately placed $0.45B of 3.50% senior unsecured notes due April 2023; and $0.25B of other unsecured debt ►As of 3Q20, SHUSA met the Federal Reserve total loss-absorbing capacity (“TLAC”) and long-term debt (“L
Slide 16: Capital Ratios
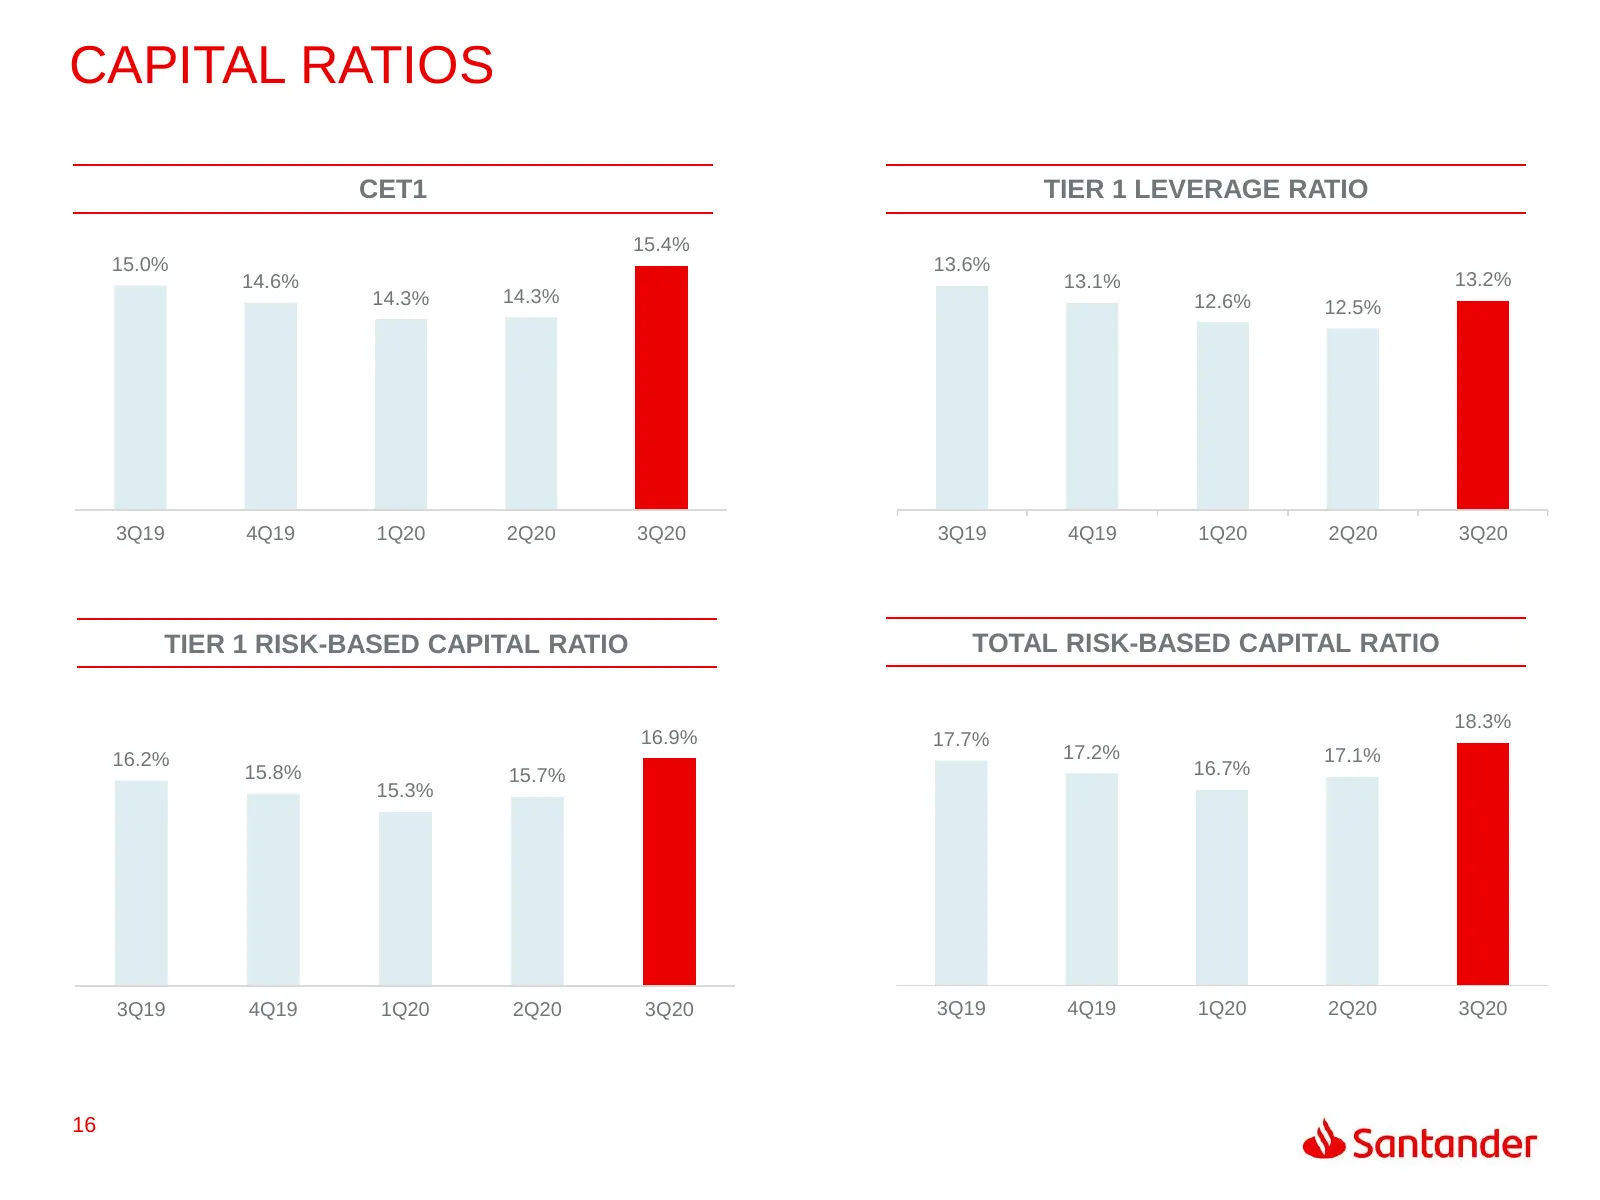
CAPITAL RATIOS CET1 TIER 1 LEVERAGE RATIO 15.4% 15.0% 13.6% 14.6% 13.1% 13.2% 14.3% 14.3% 12.6% 12.5% 3Q19 4Q19 1Q20 2Q20 3Q20 3Q19 4Q19 1Q20 2Q20 3Q20 TIER 1 RISK-BASED CAPITAL RATIO TOTAL RISK-BASED CAPITAL RATIO 18.3% 16.9% 17.7% 16.2% 17.2% 17.1% 15.8% 15.7% 16.7% 15.3% 3Q19 4Q19 1Q20 2Q20 3Q20
Slide 17: SBNA Asset Quality
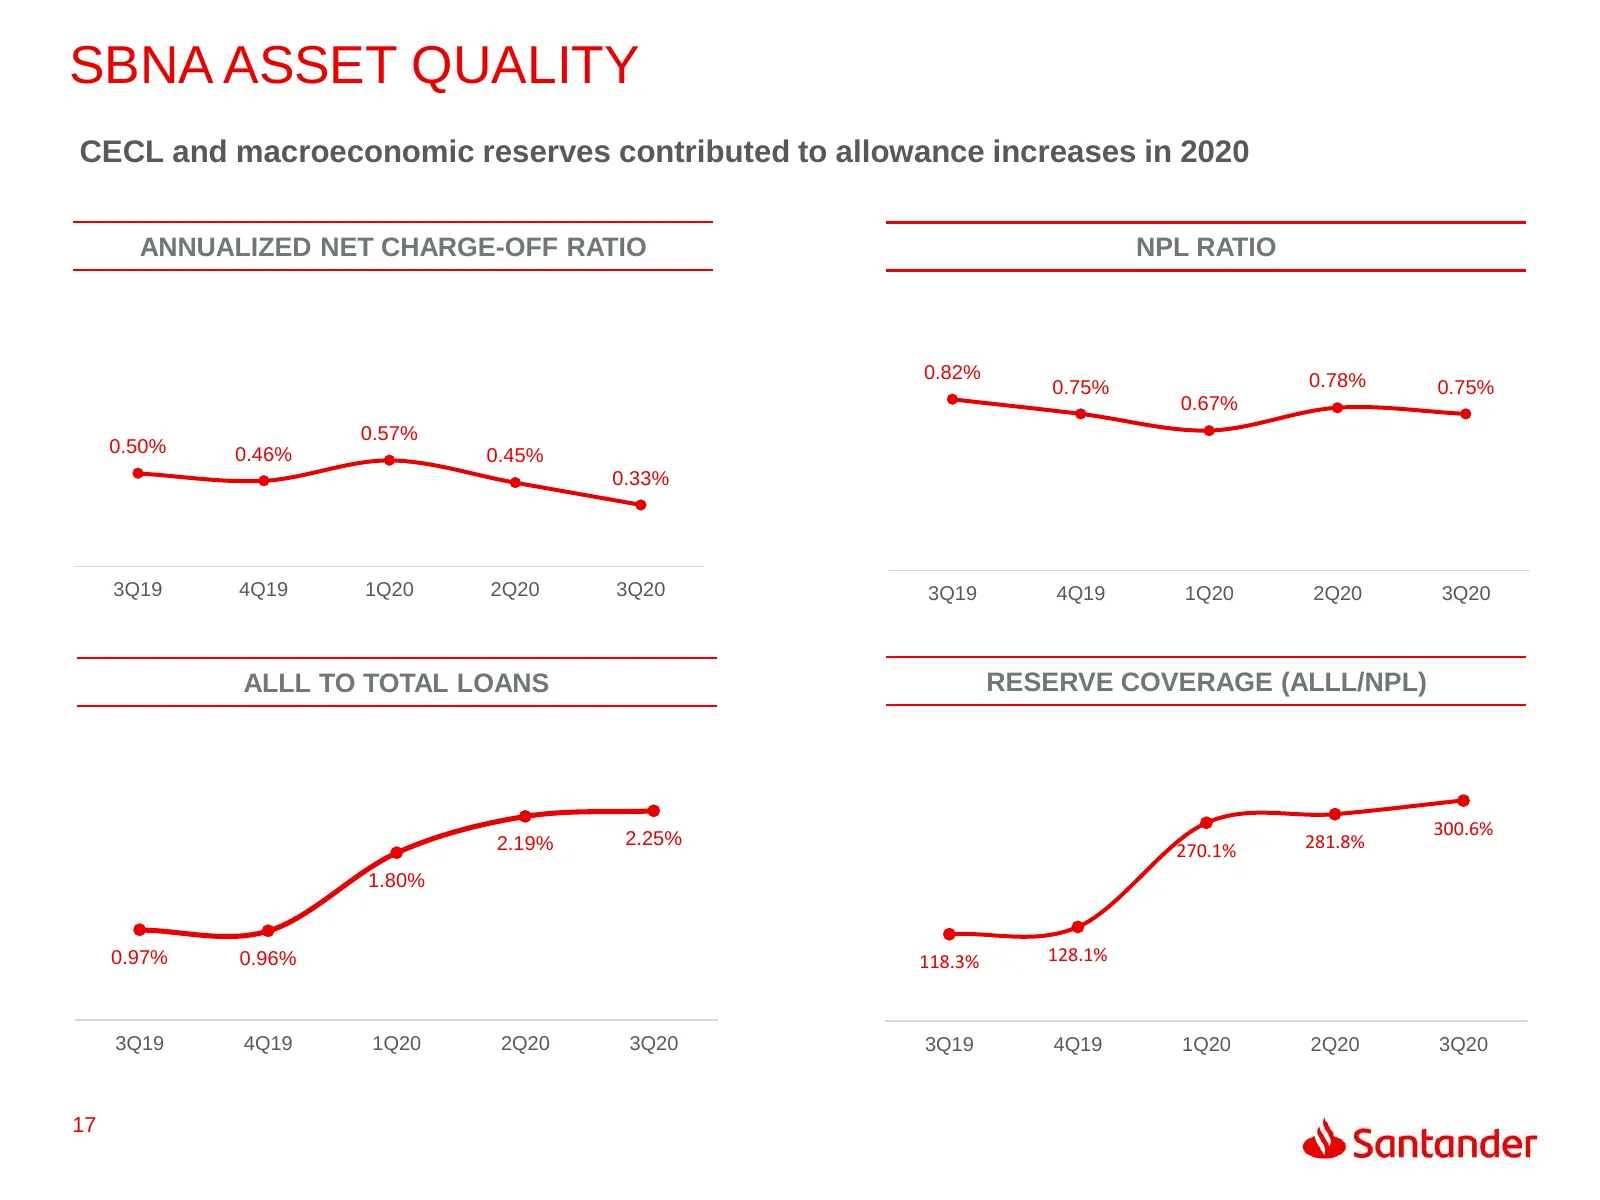
SBNA ASSET QUALITY CECL and macroeconomic reserves contributed to allowance increases in 2020 ANNUALIZED NET CHARGE-OFF RATIO NPL RATIO 0.82% 0.78% 0.75% 0.75% 0.67% 0.57% 0.50% 0.46% 0.45% 0.33% 3Q19 4Q19 1Q20 2Q20 3Q20 3Q19 4Q19 1Q20 2Q20 3Q20 ALLL TO TOTAL LOANS RESERVE COVERAGE (ALLL/NPL) 300.6%
Slide 18: SC Auto Originations (Quarterly)
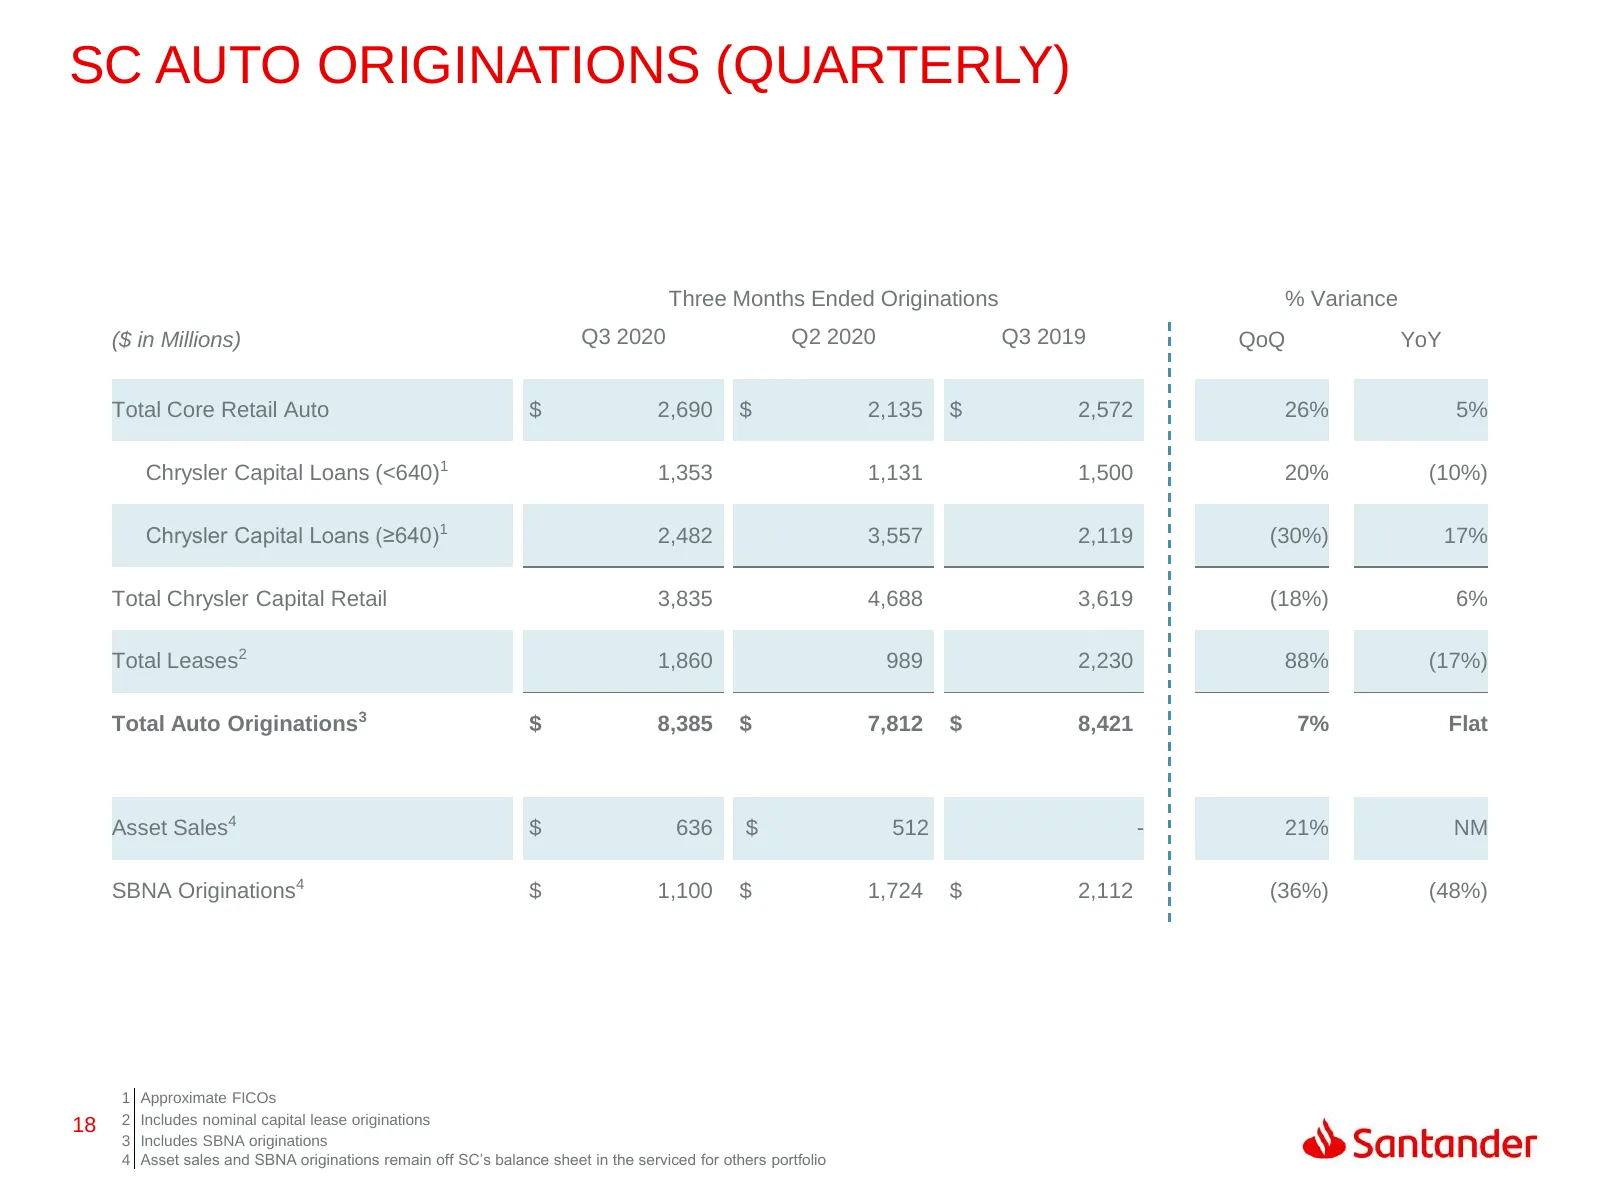
SC AUTO ORIGINATIONS (QUARTERLY) Three Months Ended Originations % Variance ($ in Millions) Q3 2020 Q2 2020 Q3 2019 QoQ YoY Total Core Retail Auto $ 2,690 $ 2,135 $ 2,572 26% 5% Chrysler Capital Loans (<640)1 1,353 1,131 1,500 20% (10%) Chrysler Capital Loans (≥640)1 2,482 3,557 2,119 (30%) 17% Tota
Slide 19: SC Delinquency and Loss (Quarterly)
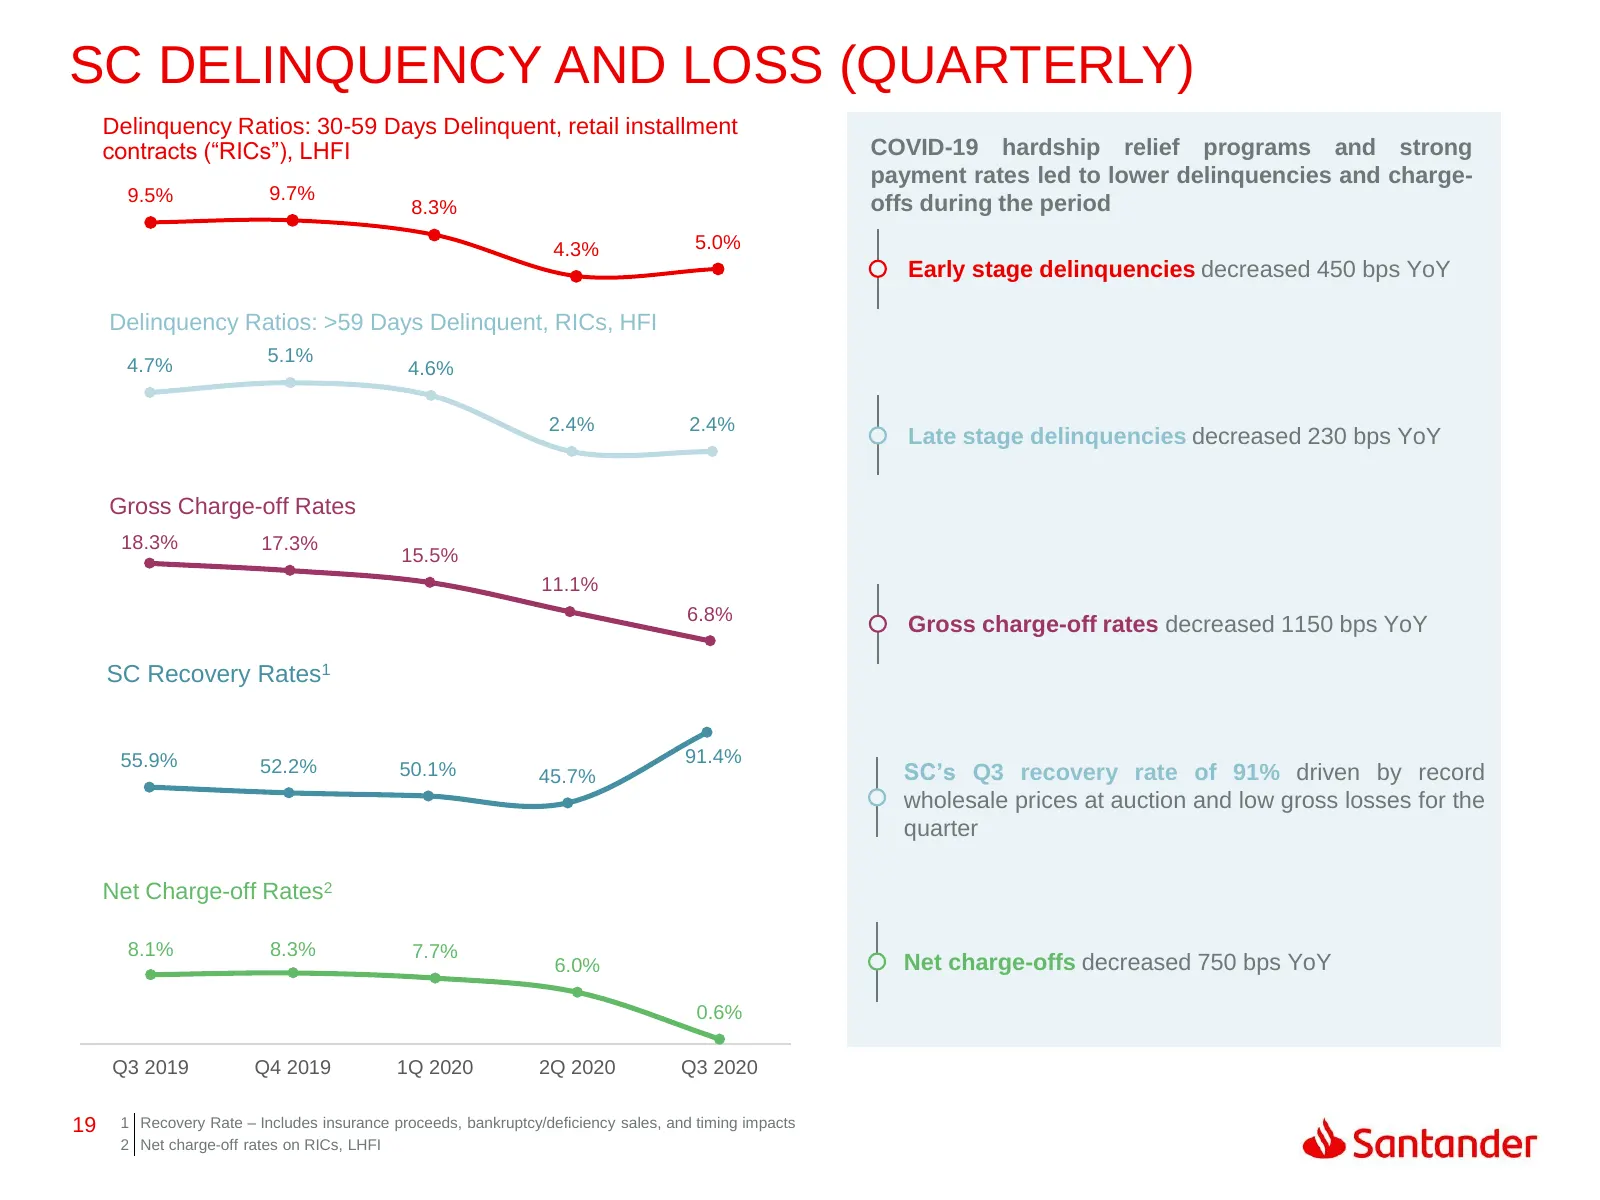
SC DELINQUENCY AND LOSS (QUARTERLY) Delinquency Ratios: 30-59 Days Delinquent, retail installment contracts (“RICs”), LHFI COVID-19 hardship relief programs and strong payment rates led to lower delinquencies and charge- 9.5% 9.7% 8.3% offs during the period 4.3% 5.0% Early stage delinquencies decre
Slide 20: Rating Agencies
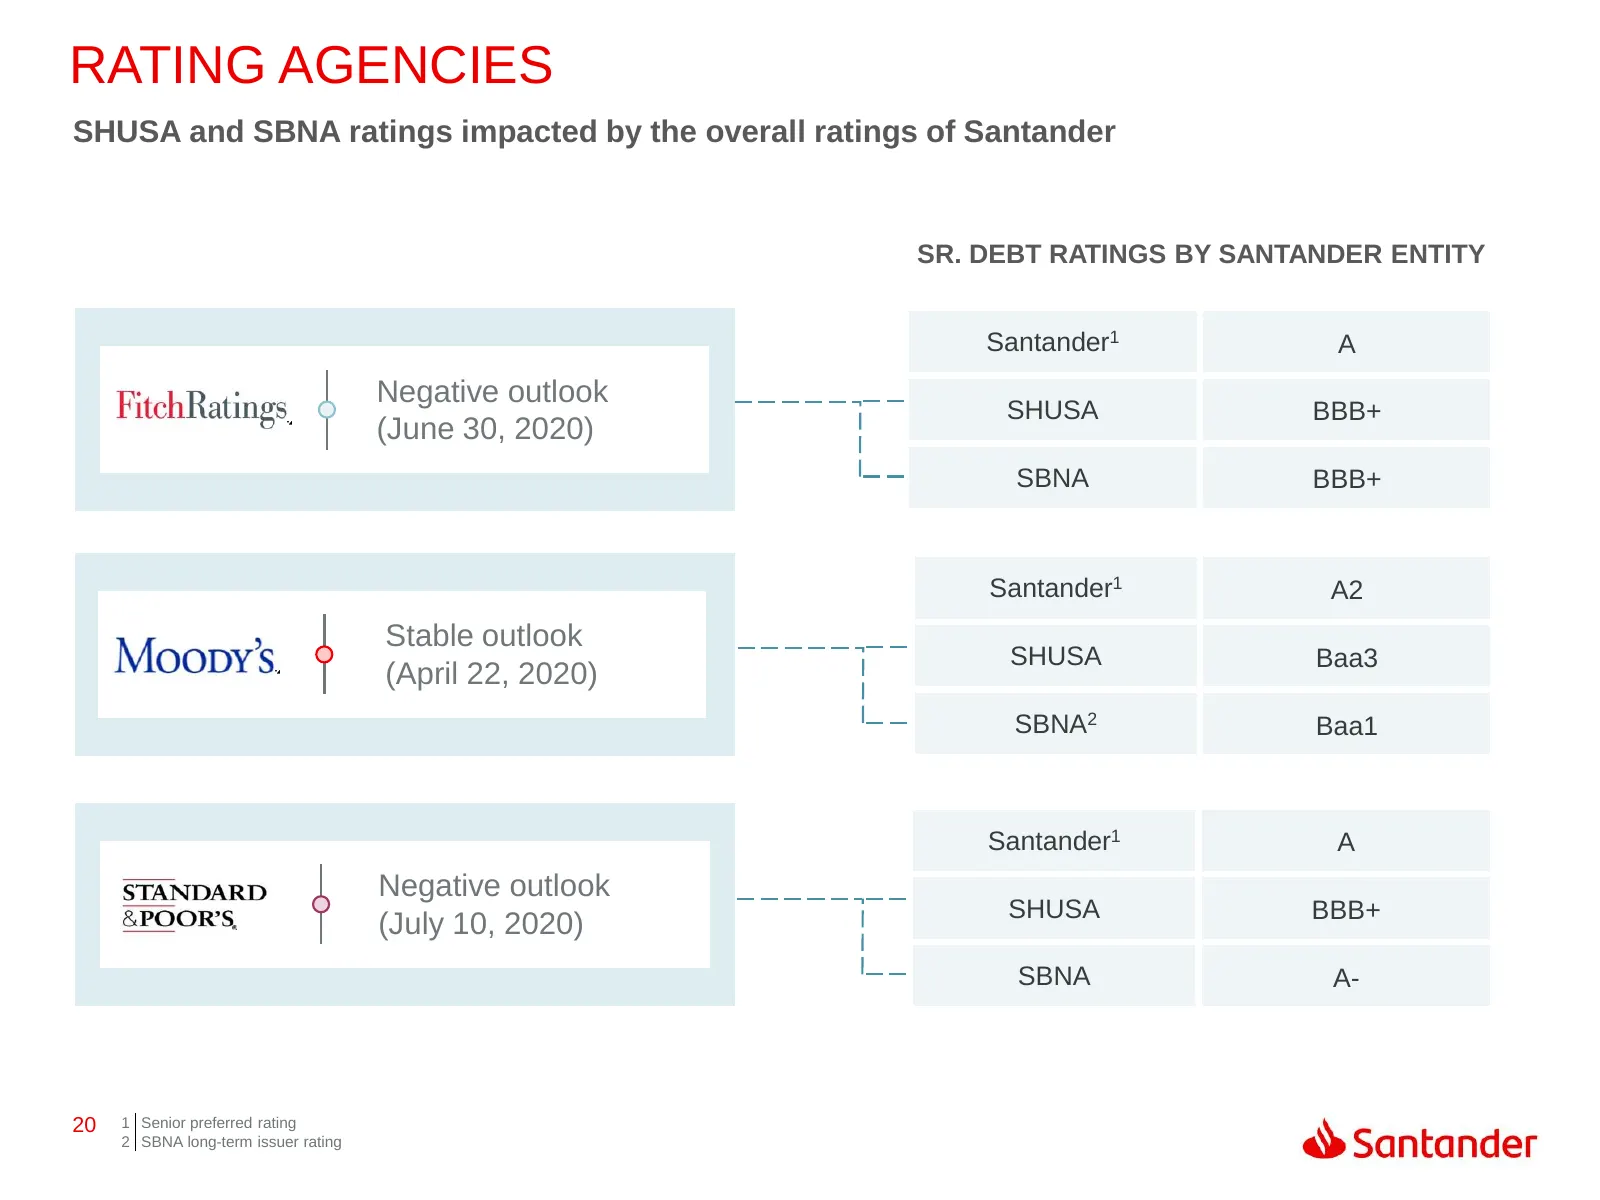
RATING AGENCIES SHUSA and SBNA ratings impacted by the overall ratings of Santander SR. DEBT RATINGS BY SANTANDER ENTITY Santander1 A Negative outlook SHUSA BBB+ (June 30, 2020) SBNA BBB+ Santander1 A2 Stable outlook SHUSA Baa3 (April 22, 2020) SBNA2 Baa1 Santander1 A Negative outlook SHUSA BBB+ (Ju
Slide 21: Appendix
APPENDIX «> Santander
Slide 22: Consolidating Income Statement
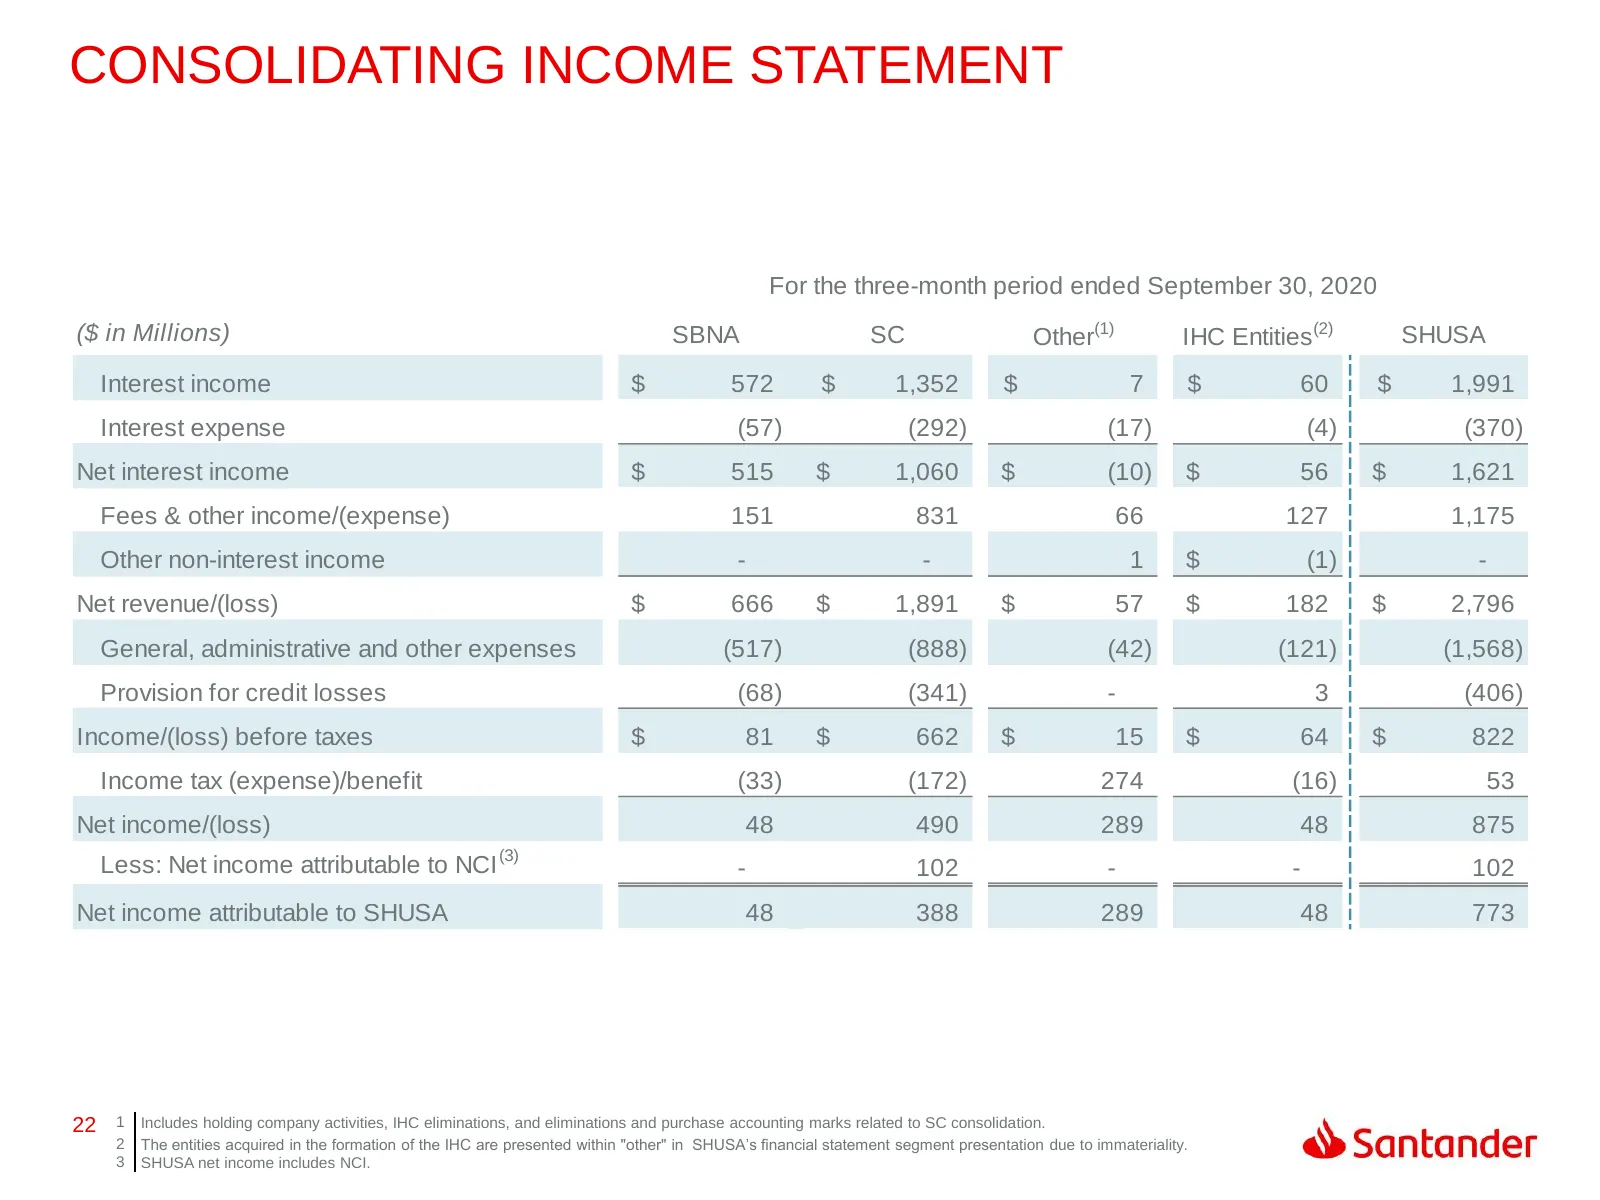
CONSOLIDATING INCOME STATEMENT For the three-month period ended September 30, 2020 ($ in Millions) SBNA SC Other(1) IHC Entities (2) SHUSA Interest income $ 572 $ 1,352 $ 7 $ 60 $ 1,991 Interest expense (57) (292) (17) (4) (370) Net interest income $ 515 $ 1,060 $ (10) $ 56 $ 1,621 Fees & other inco
Slide 23: Consolidating Balance Sheet
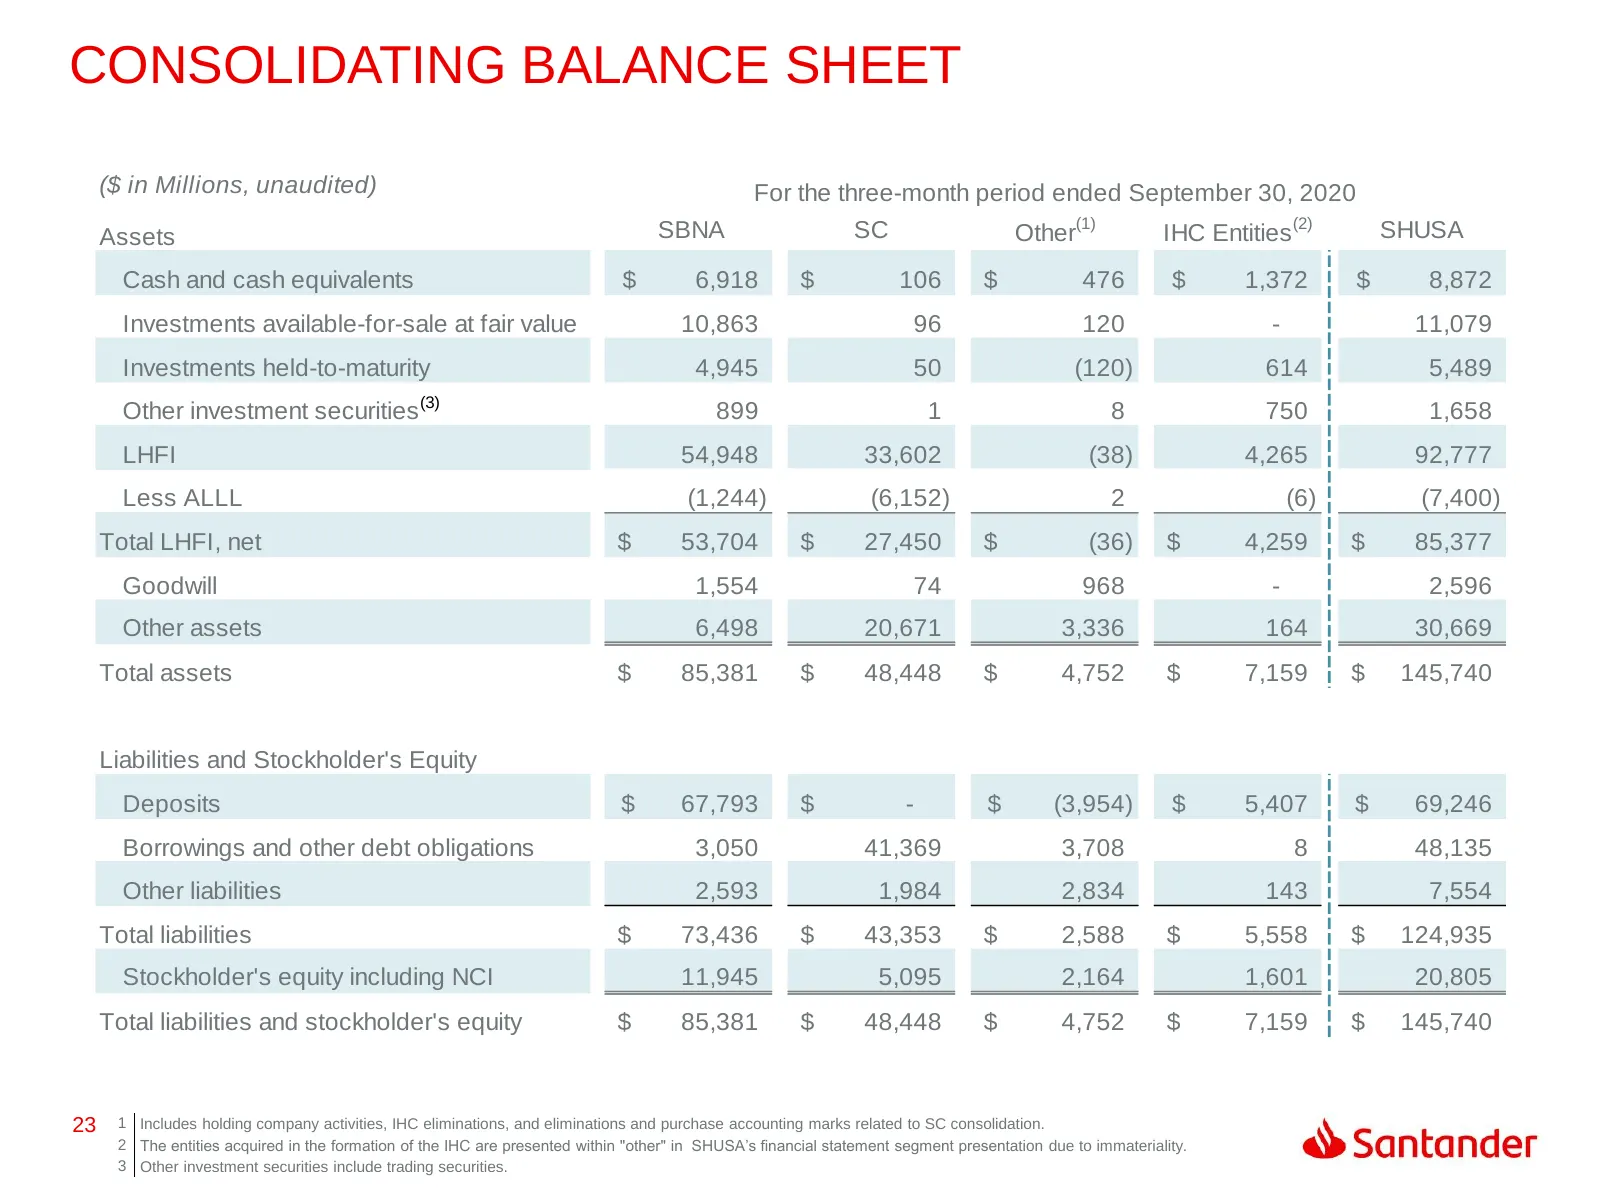
CONSOLIDATING BALANCE SHEET ($ in Millions, unaudited) For the three-month period ended September 30, 2020 Assets SBNA SC Other(1) IHC Entities (2) SHUSA Cash and cash equivalents $ 6,918 $ 106 $ 476 $ 1,372 $ 8,872 Investments available-for-sale at fair value 10,863 96 120 - 11,079 Investments held
Slide 24: SHUSA: Quarterly Trended Statement of Operations
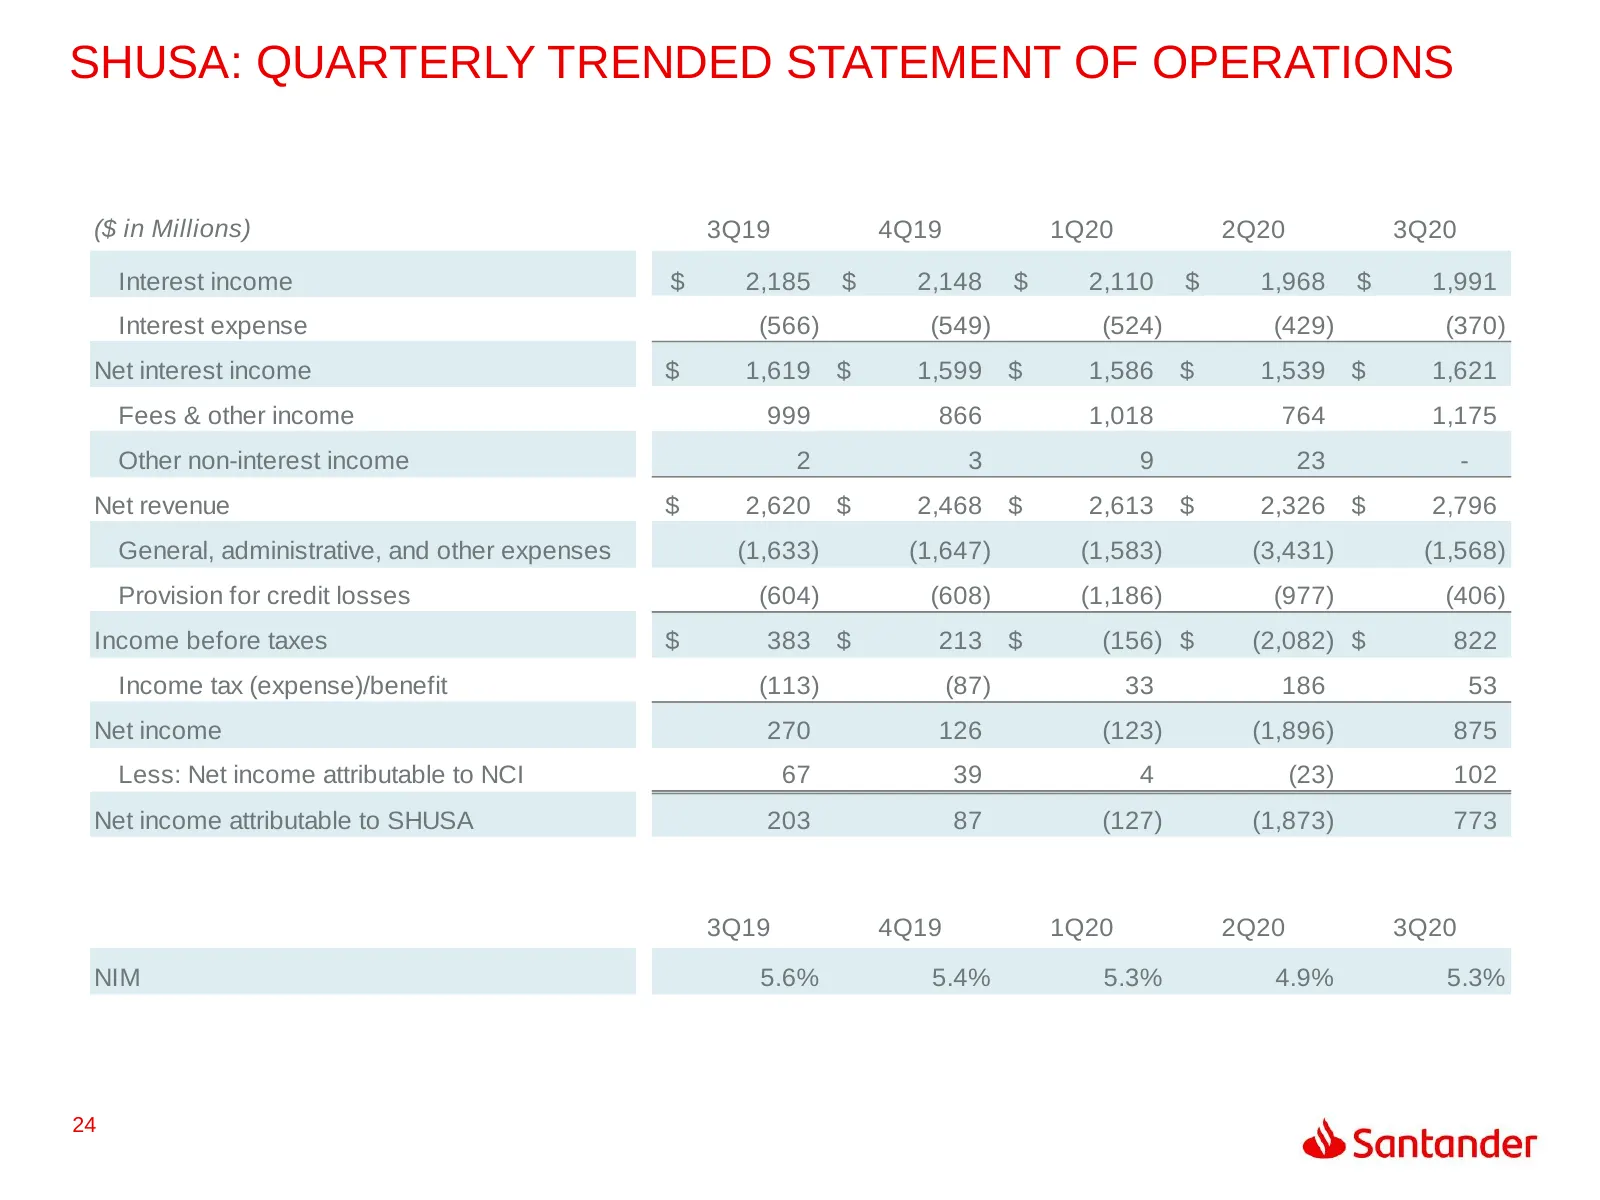
SHUSA: QUARTERLY TRENDED STATEMENT OF OPERATIONS ($ in Millions) 3Q19 4Q19 1Q20 2Q20 3Q20 Interest income $ 2,185 $ 2,148 $ 2,110 $ 1,968 $ 1,991 Interest expense (566) (549) (524) (429) (370) Net interest income $ 1,619 $ 1,599 $ 1,586 $ 1,539 $ 1,621 Fees & other income 999 866 1,018 764 1,175 Oth
Slide 25: Capital Ratio (CET1) Comparison
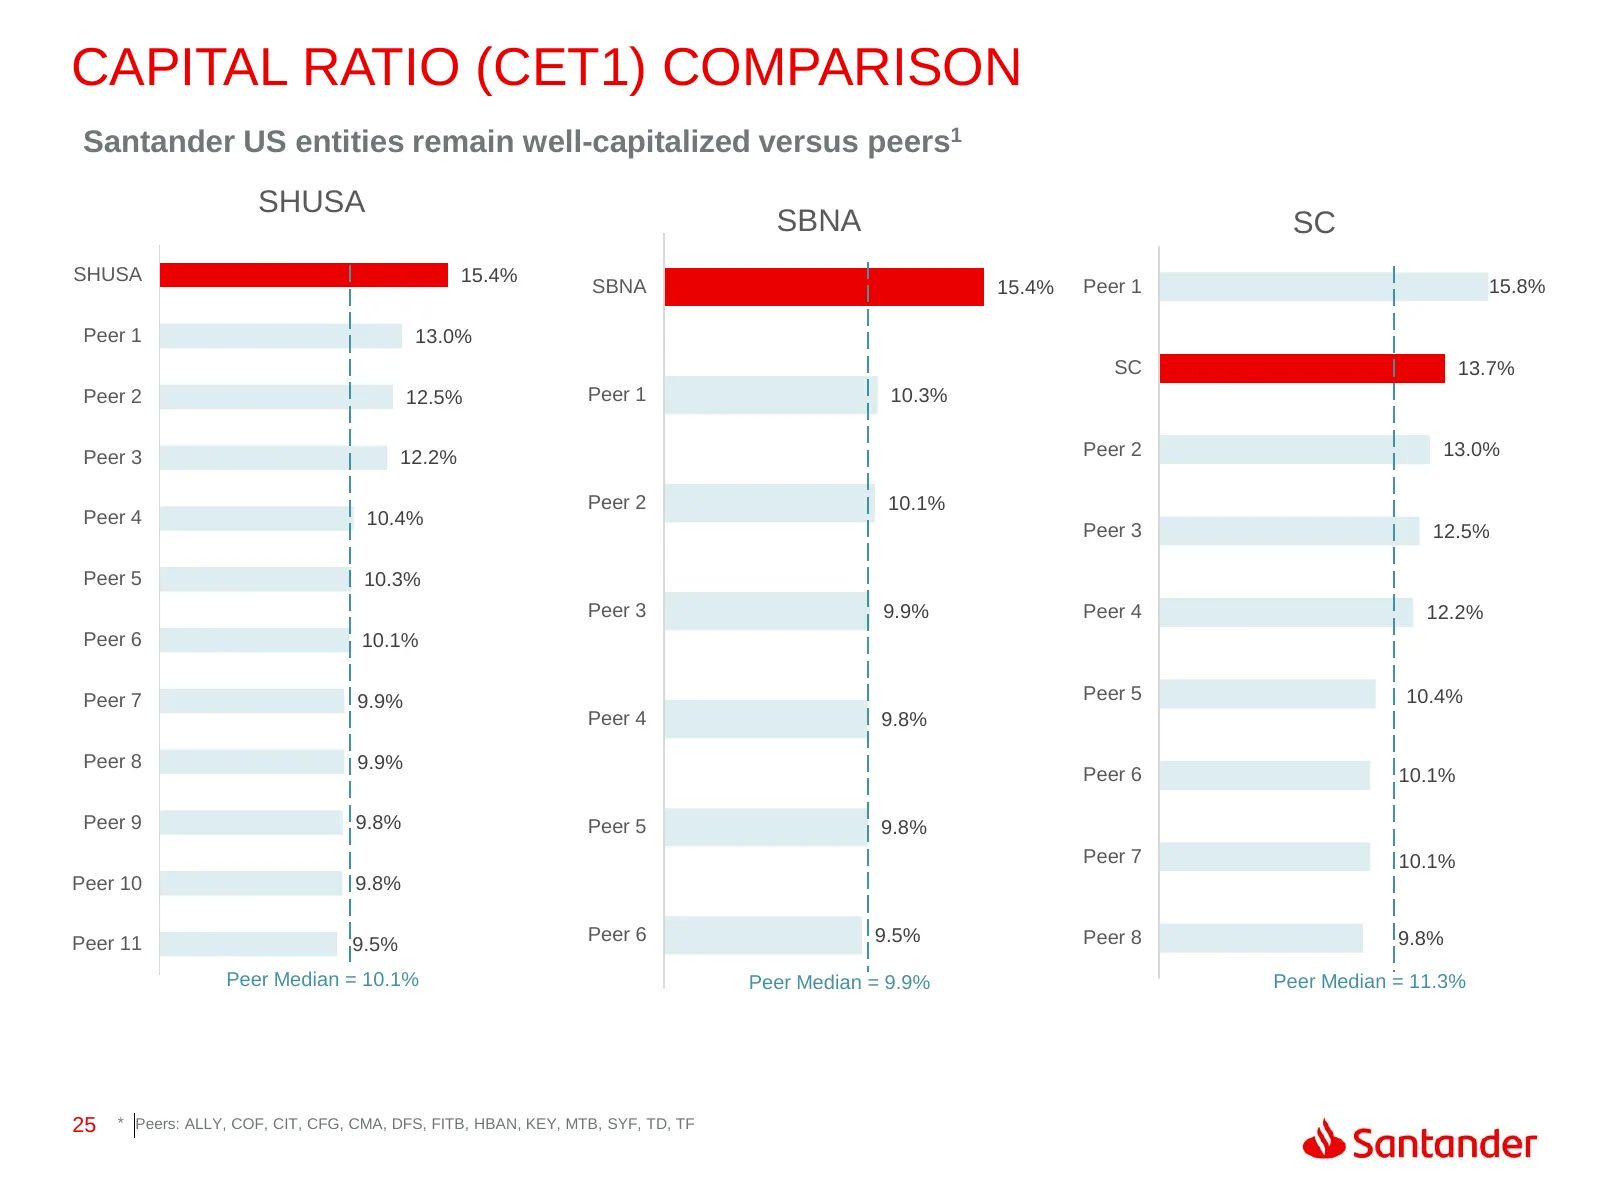
CAPITAL RATIO (CET1) COMPARISON Santander US entities remain well-capitalized versus peers1 SHUSA SBNA SC SHUSA 15.4% SBNA 15.4% Peer 1 15.8% Peer 1 13.0% SC 13.7% Peer 2 12.5% Peer 1 10.3% Peer 3 12.2% Peer 2 13.0% Peer 2 10.1% Peer 4 10.4% Peer 3 12.5% Peer 5 10.3% Peer 3 9.9% Peer 4 12.2% Peer 6
Slide 26: SHUSA: Non-GAAP Reconciliations
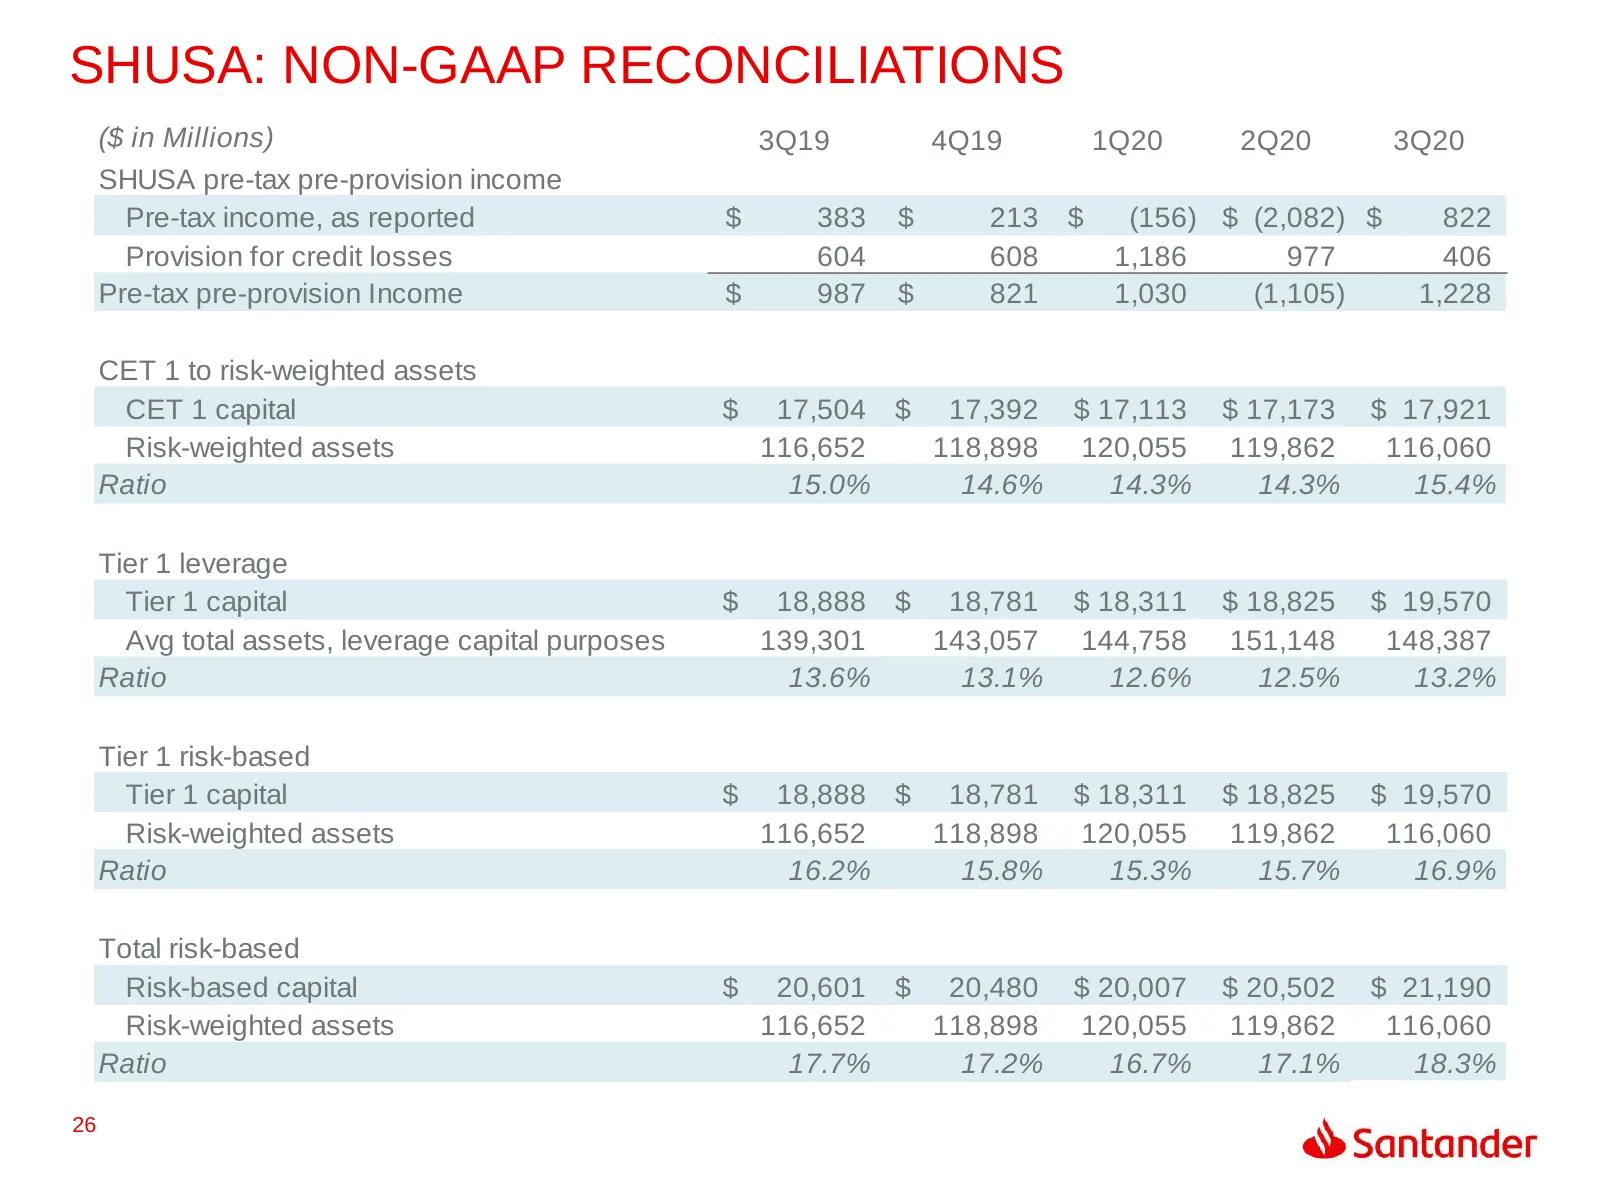
SHUSA: NON-GAAP RECONCILIATIONS ($ in Millions) 3Q19 4Q19 1Q20 2Q20 3Q20 SHUSA pre-tax pre-provision income Pre-tax income, as reported $ 383 $ 213 $ (156) $ (2,082) $ 822 Provision for credit losses 604 608 1,186 977 406 Pre-tax pre-provision Income $ 987 $ 821 1,030 (1,105) 1,228 CET 1 to risk-wei
Slide 27: SHUSA: Q3 Non-GAAP Reconciliation
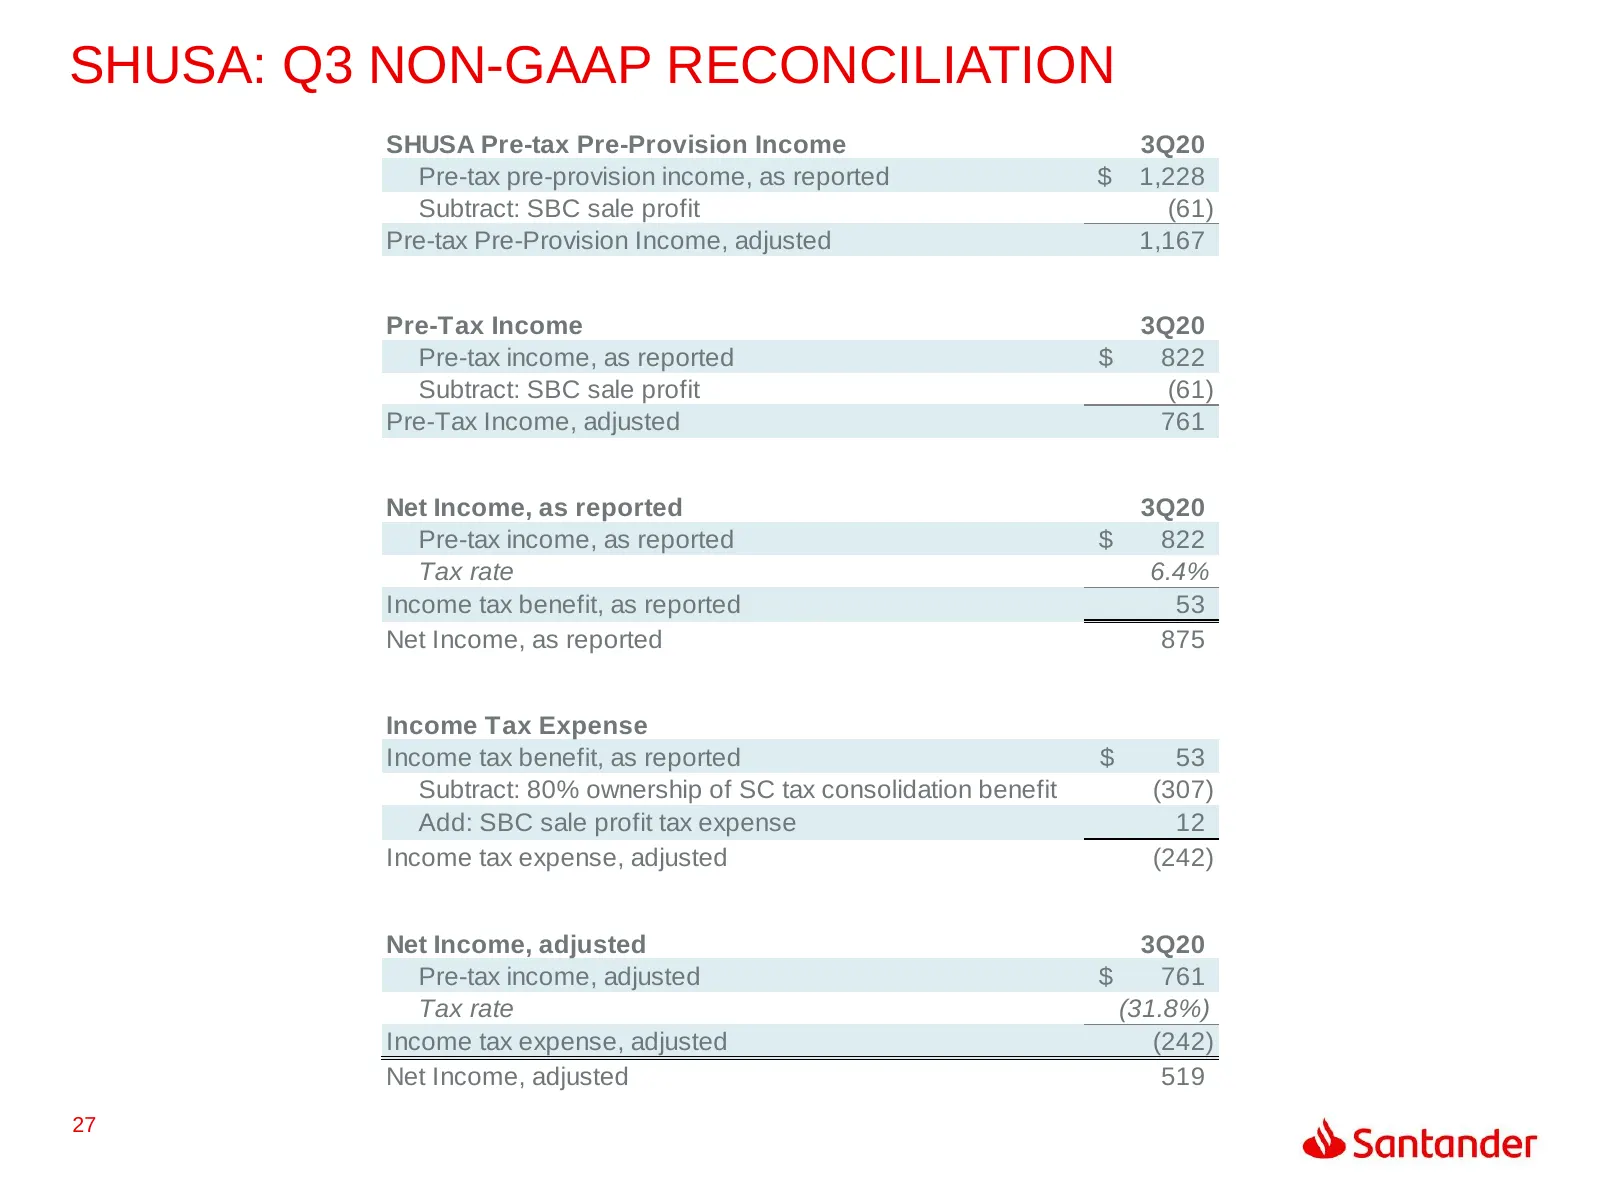
SHUSA: Q3 NON-GAAP RECONCILIATION SHUSA Pre-tax Pre-Provision Income 3Q20 Pre-tax pre-provision income, as reported $ 1,228 Subtract: SBC sale profit (61) Pre-tax Pre-Provision Income, adjusted 1,167 Pre-Tax Income 3Q20 Pre-tax income, as reported $ 822 Subtract: SBC sale profit (61) Pre-Tax Income,
Slide 28: SBNA: Quarterly Profitability
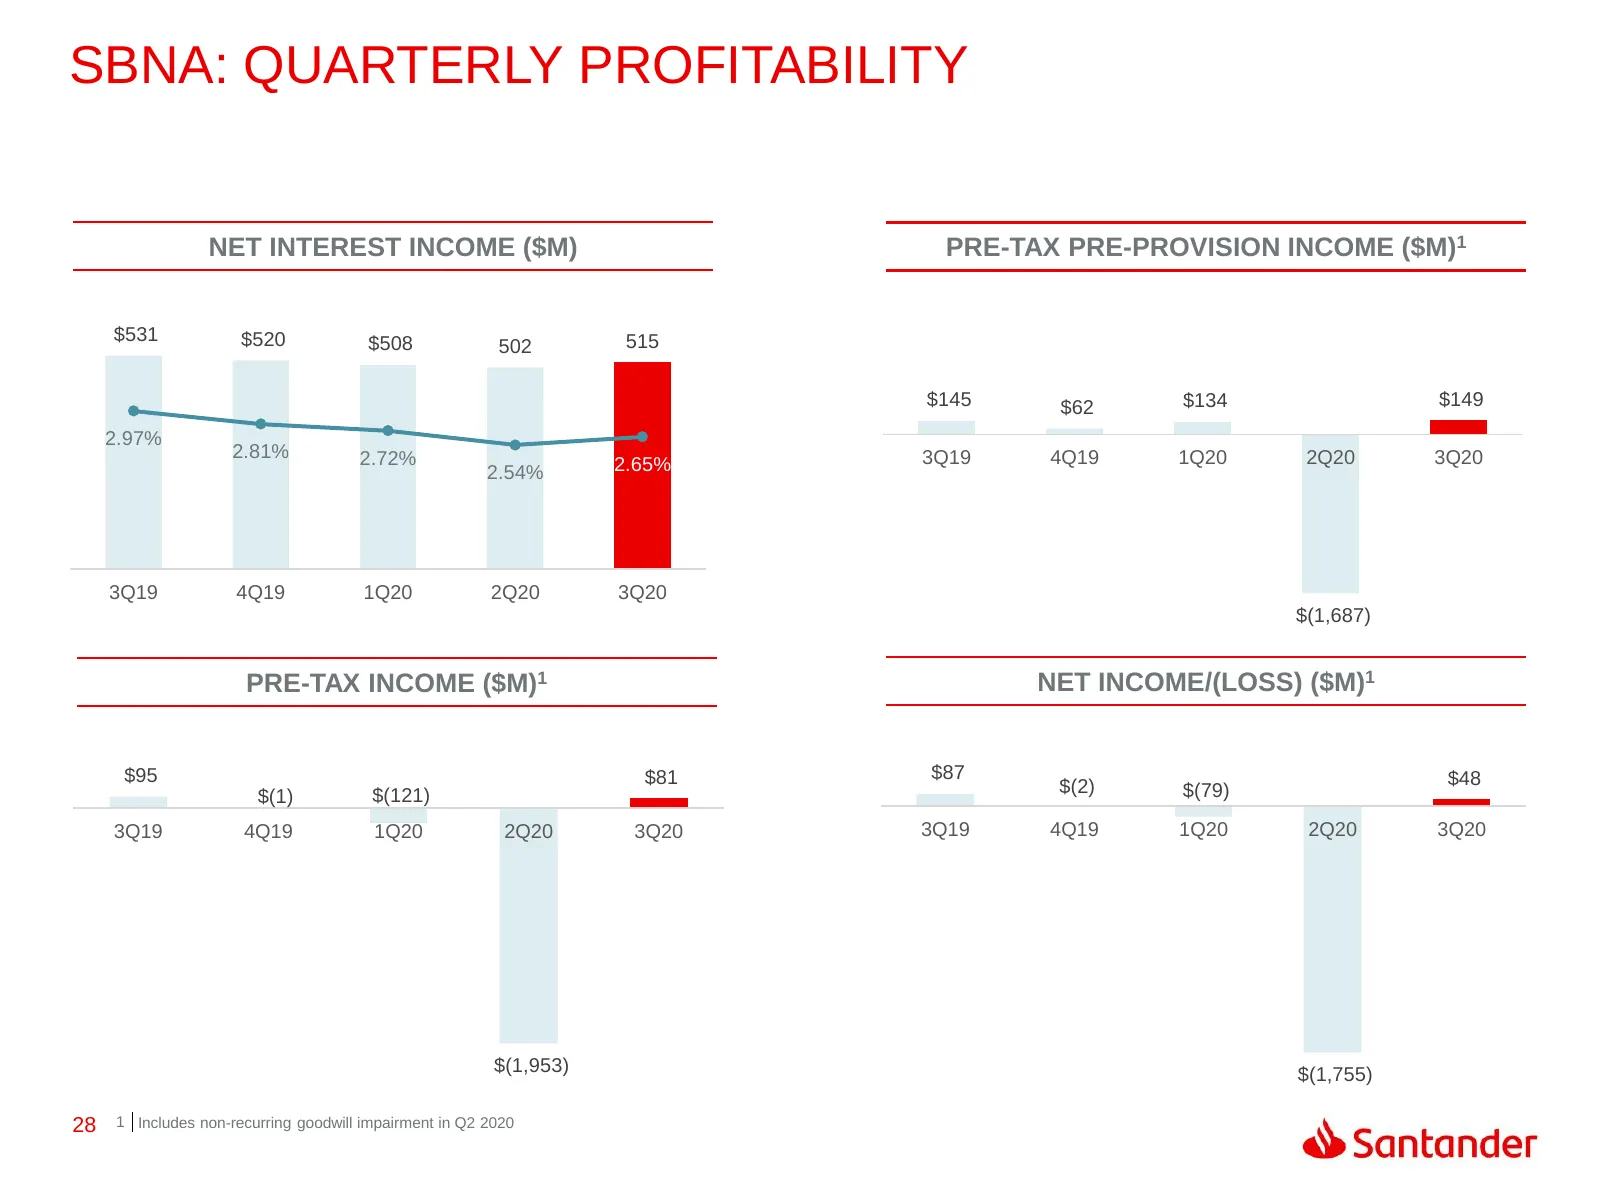
SBNA: QUARTERLY PROFITABILITY NET INTEREST INCOME ($M) PRE-TAX PRE-PROVISION INCOME ($M)1 $531 $600 4.00% $520 $508 502 515 $500 3.50% $400 3.00% $145 $62 $134 $149 2.97% $300 2.81% 2.72% 2.50% 3Q19 4Q19 1Q20 2Q20 3Q20 2.54% 2.65% $200 2.00% $100 1.50% $- 1.00% 3Q19 4Q19 1Q20 2Q20 3Q20 $(1,687) PRE-
Slide 29: SBNA: Quarterly Trended Statement of Operations
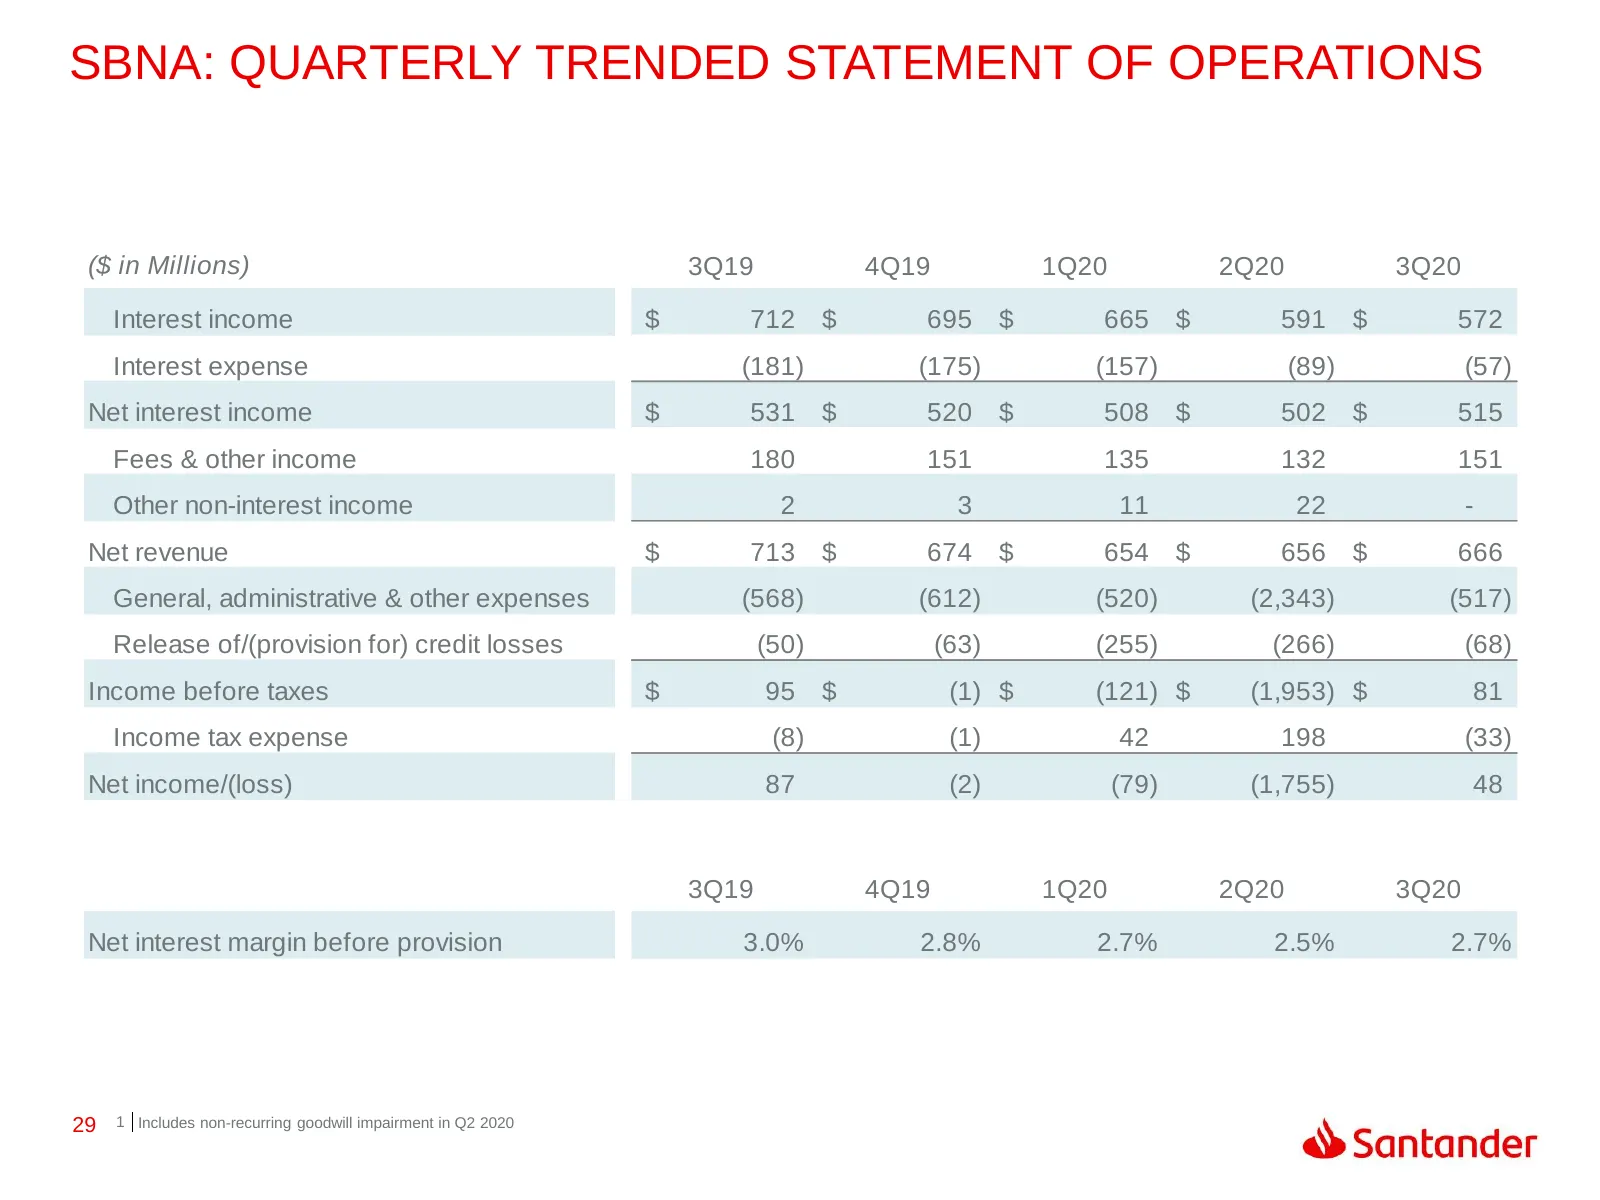
SBNA: QUARTERLY TRENDED STATEMENT OF OPERATIONS OPS ($ in Millions) 3Q19 4Q19 1Q20 2Q20 3Q20 Interest income $ 712 $ 695 $ 665 $ 591 $ 572 Interest expense (181) (175) (157) (89) (57) Net interest income $ 531 $ 520 $ 508 $ 502 $ 515 Fees & other income 180 151 135 132 151 Other non-interest income
Slide 30: SBNA: Quarterly Average Balance Sheet
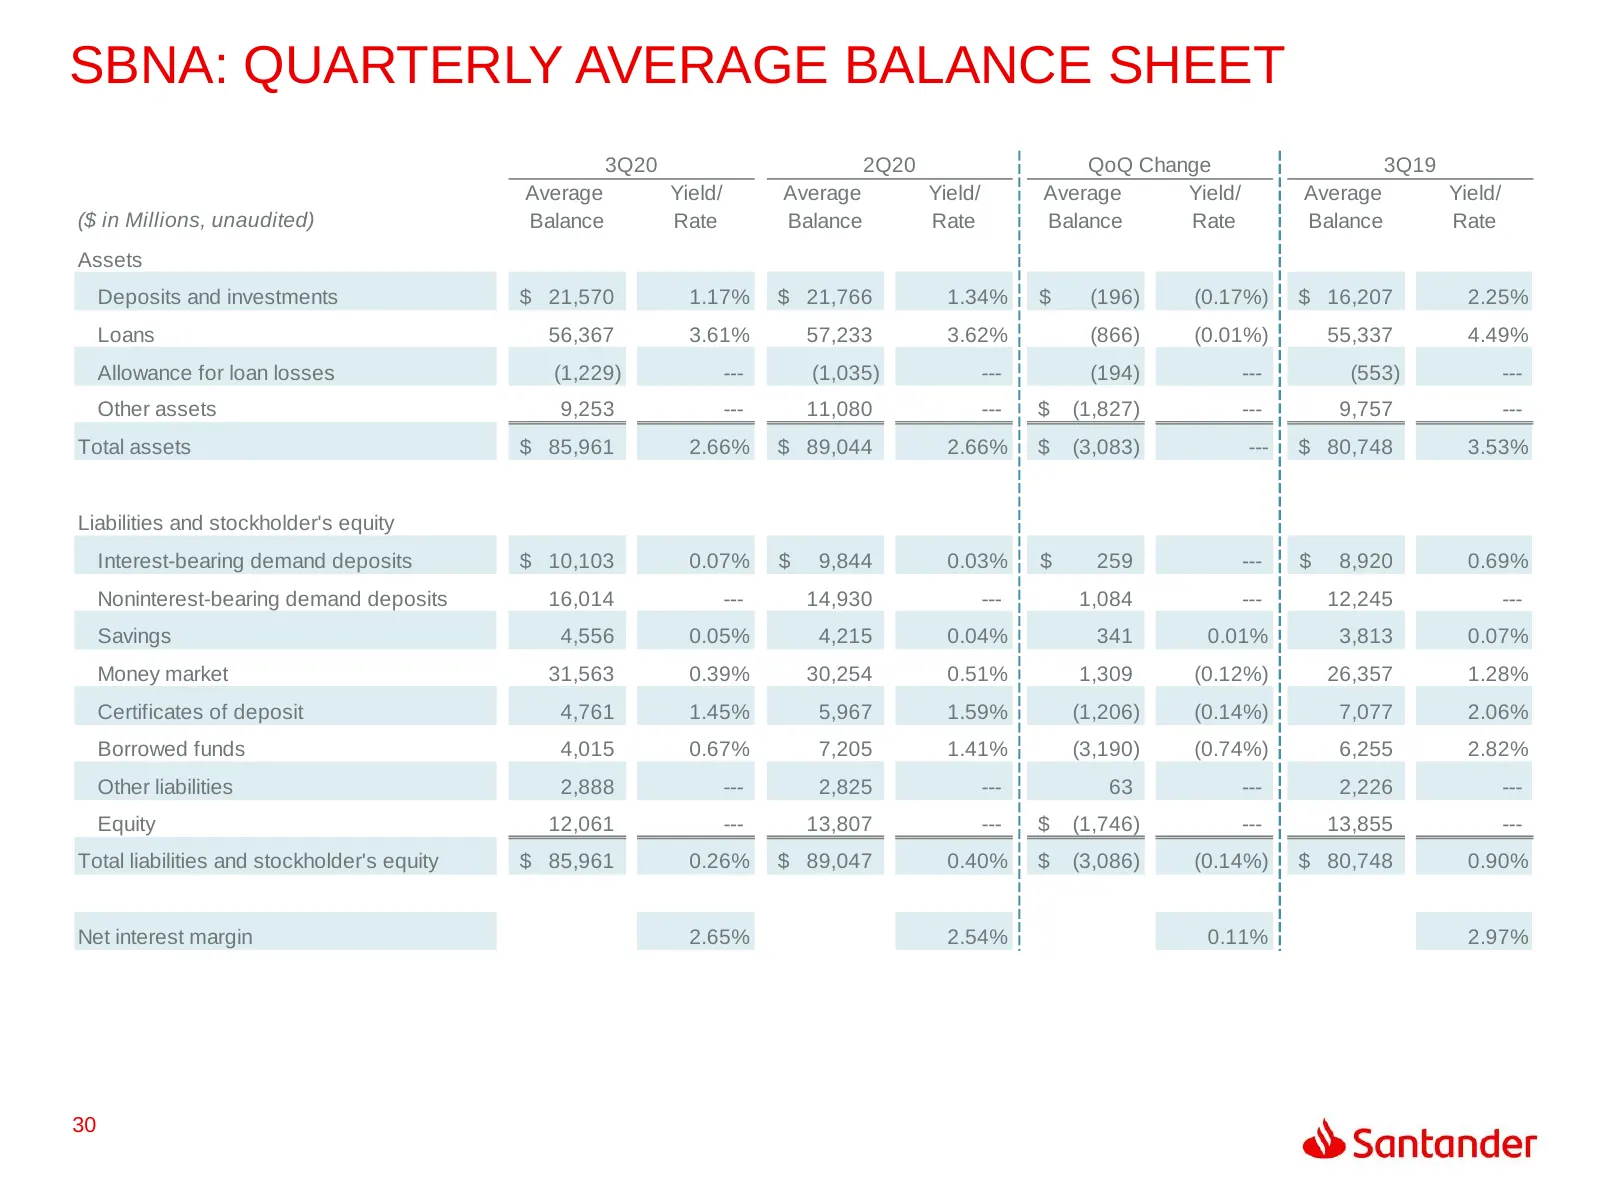
SBNA: QUARTERLY AVERAGE BALANCE SHEET SBNA: QUARTERLY AVERAGE BALANCE SHEET 3Q20 2Q20 QoQ Change 3Q19 Average Yield/ Average Yield/ Average Yield/ Average Yield/ ($ in Millions, unaudited) Balance Rate Balance Rate Balance Rate Balance Rate Assets Deposits and investments $ 21,570 1.17% $ 21,766 1.3
Slide 31: SBNA: Funding – Deposits
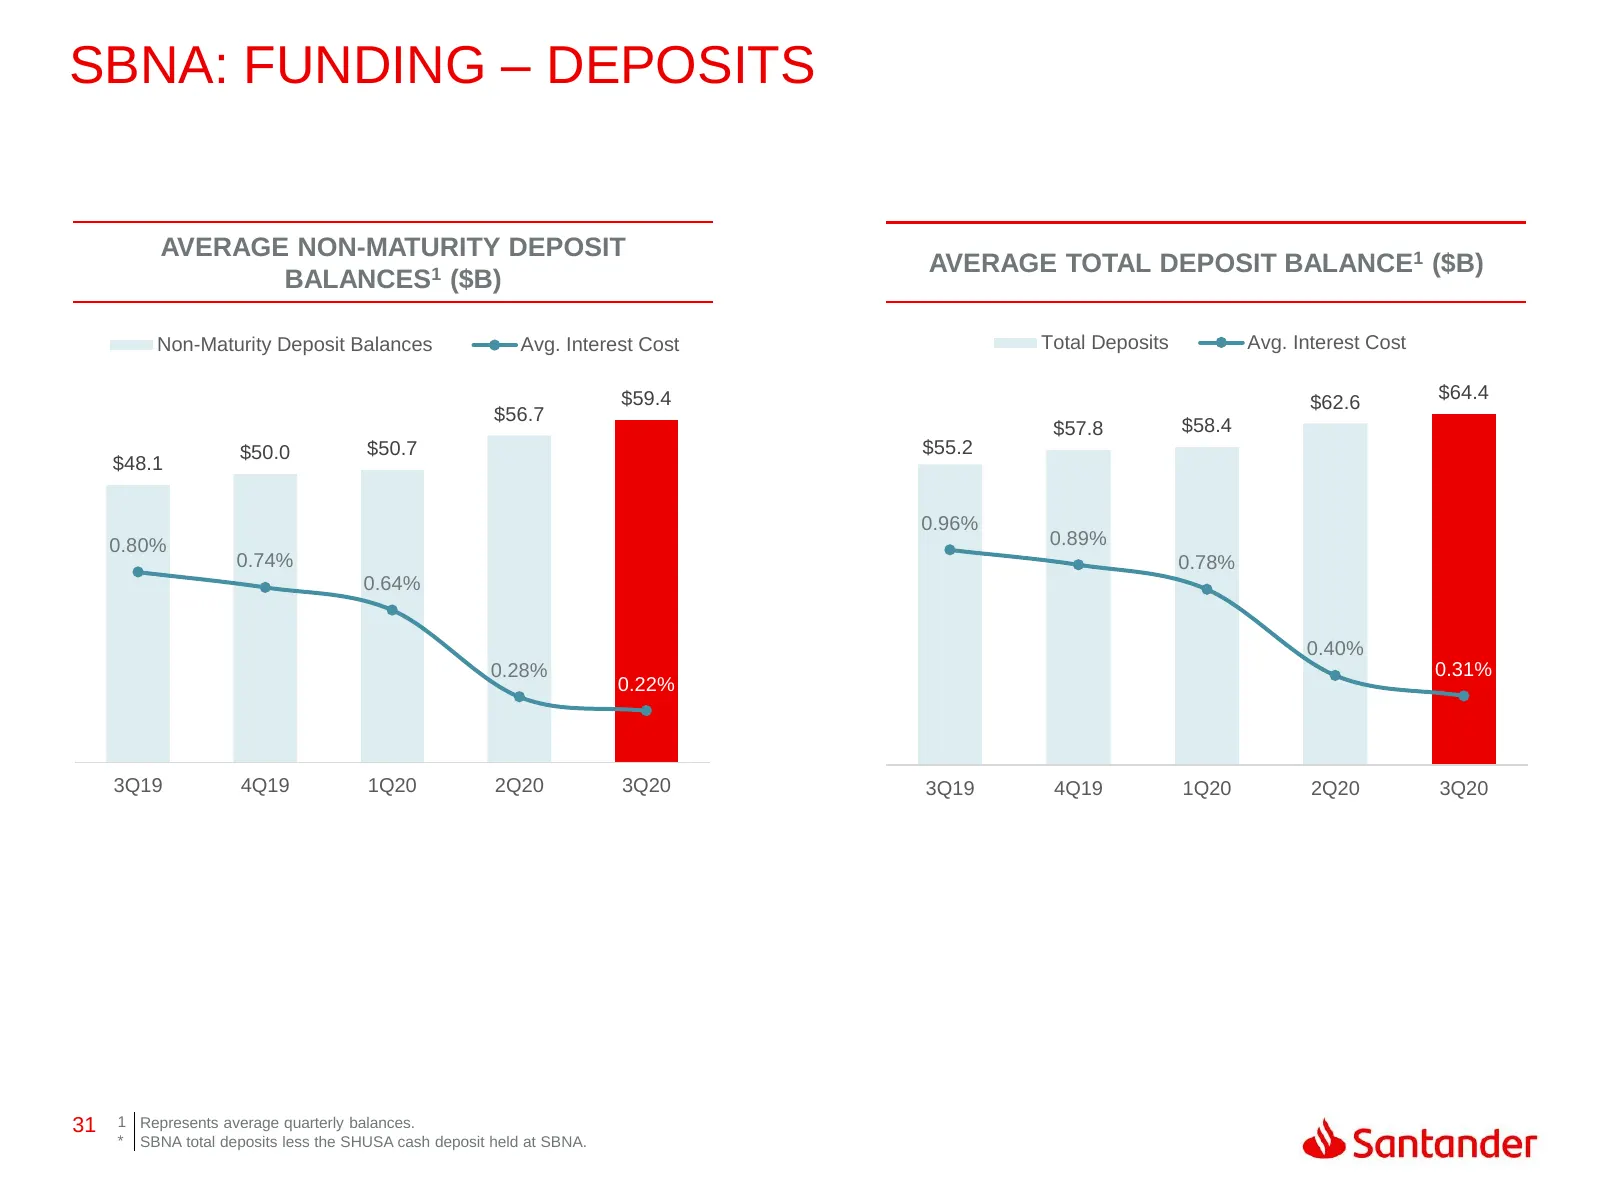
SBNA: FUNDING – DEPOSITS AVERAGE NON-MATURITY DEPOSIT AVERAGE TOTAL DEPOSIT BALANCE1 ($B) BALANCES1 ($B) Non-Maturity Deposit Balances Avg. Interest Cost Total Deposits Avg. Interest Cost 70.0 1.60% 70.0 $59.4 $62.6 $64.4 1.60% 60.0 $56.7 1.40% 60.0 $57.8 $58.4 $50.0 $50.7 $55.2 1.40% $48.1 50.0 1.2
Slide 32: SBNA: Asset Quality
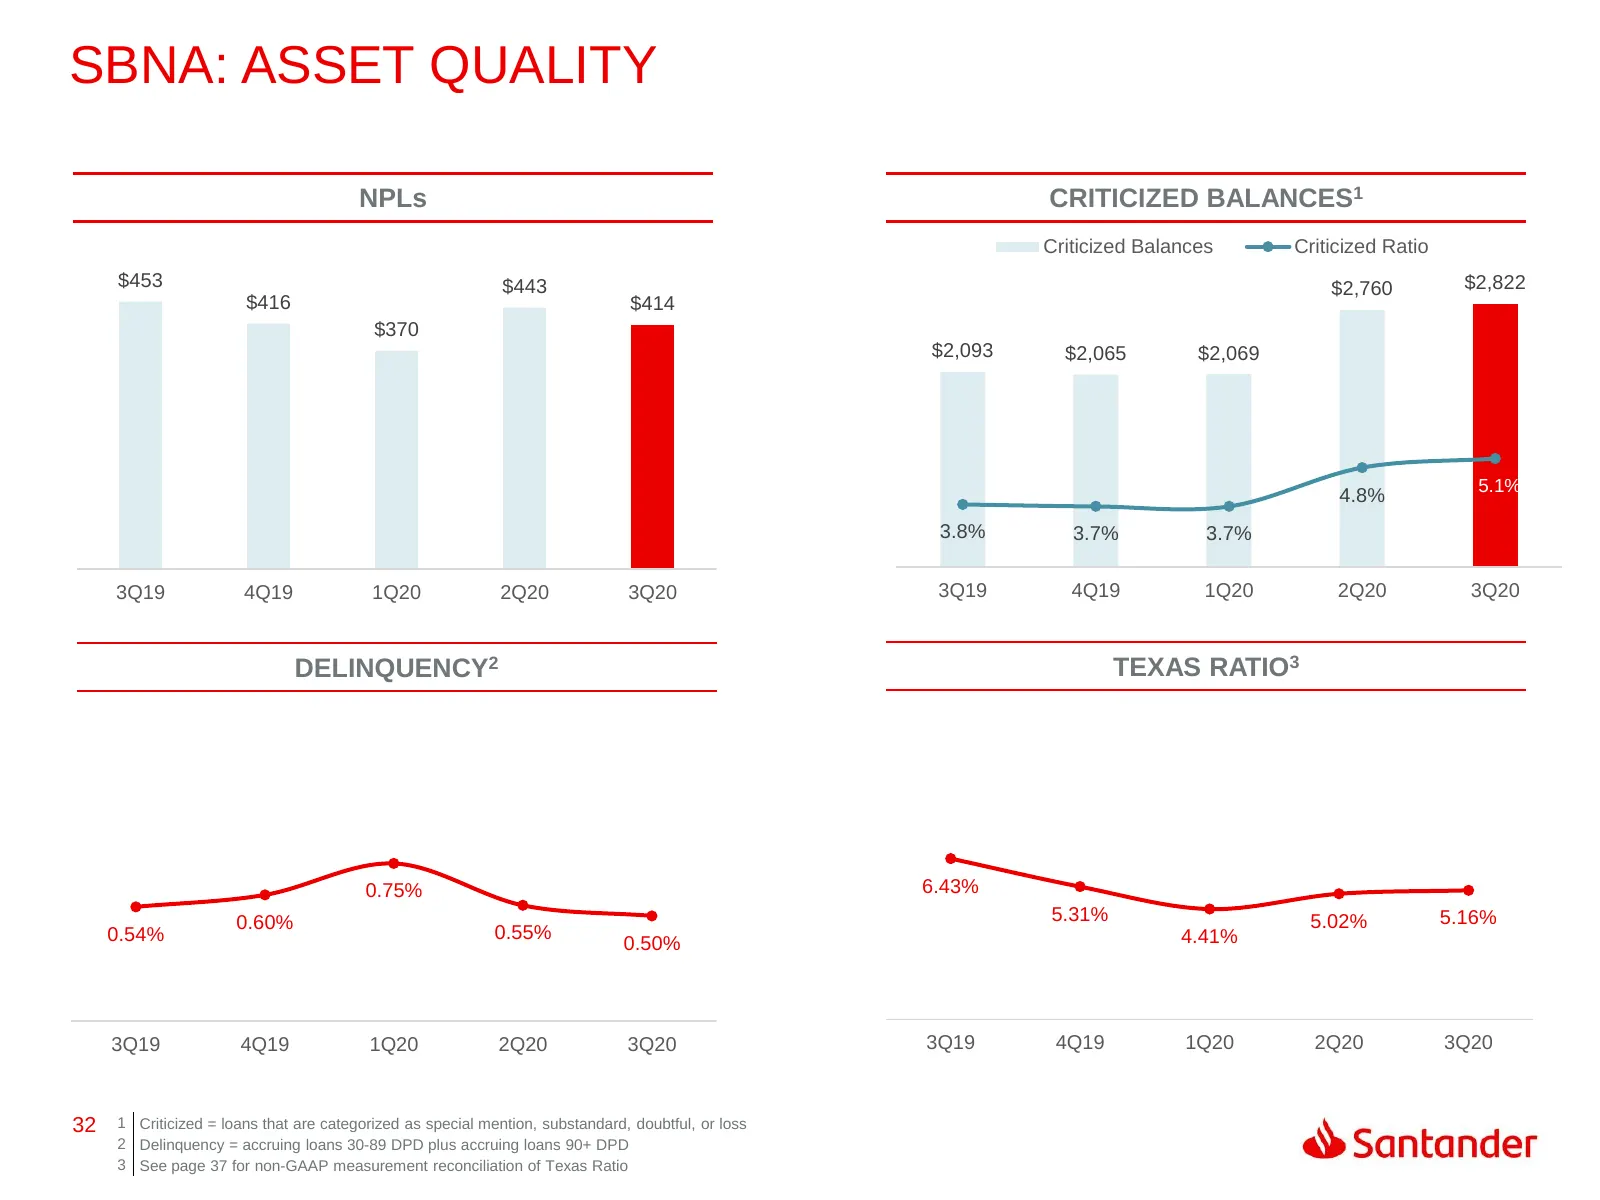
SBNA: ASSET QUALITY NPLs CRITICIZED BALANCES1 Criticized Balances Criticized Ratio $453 $443 $3,000 $2,760 $2,822 10.00% $416 $414 9.00% $370 $2,500 $2,093 $2,065 $2,069 8.00% $2,000 7.00% $1,500 6.00% -13% $1,000 5.00% 5.1% 4.8% 4.00% $500 3.8% 3.7% 3.7% 3.00% $0 2.00% 3Q19 4Q19 1Q20 2Q20 3Q20 3Q19
Slide 33: SBNA: Asset Quality (Continued)
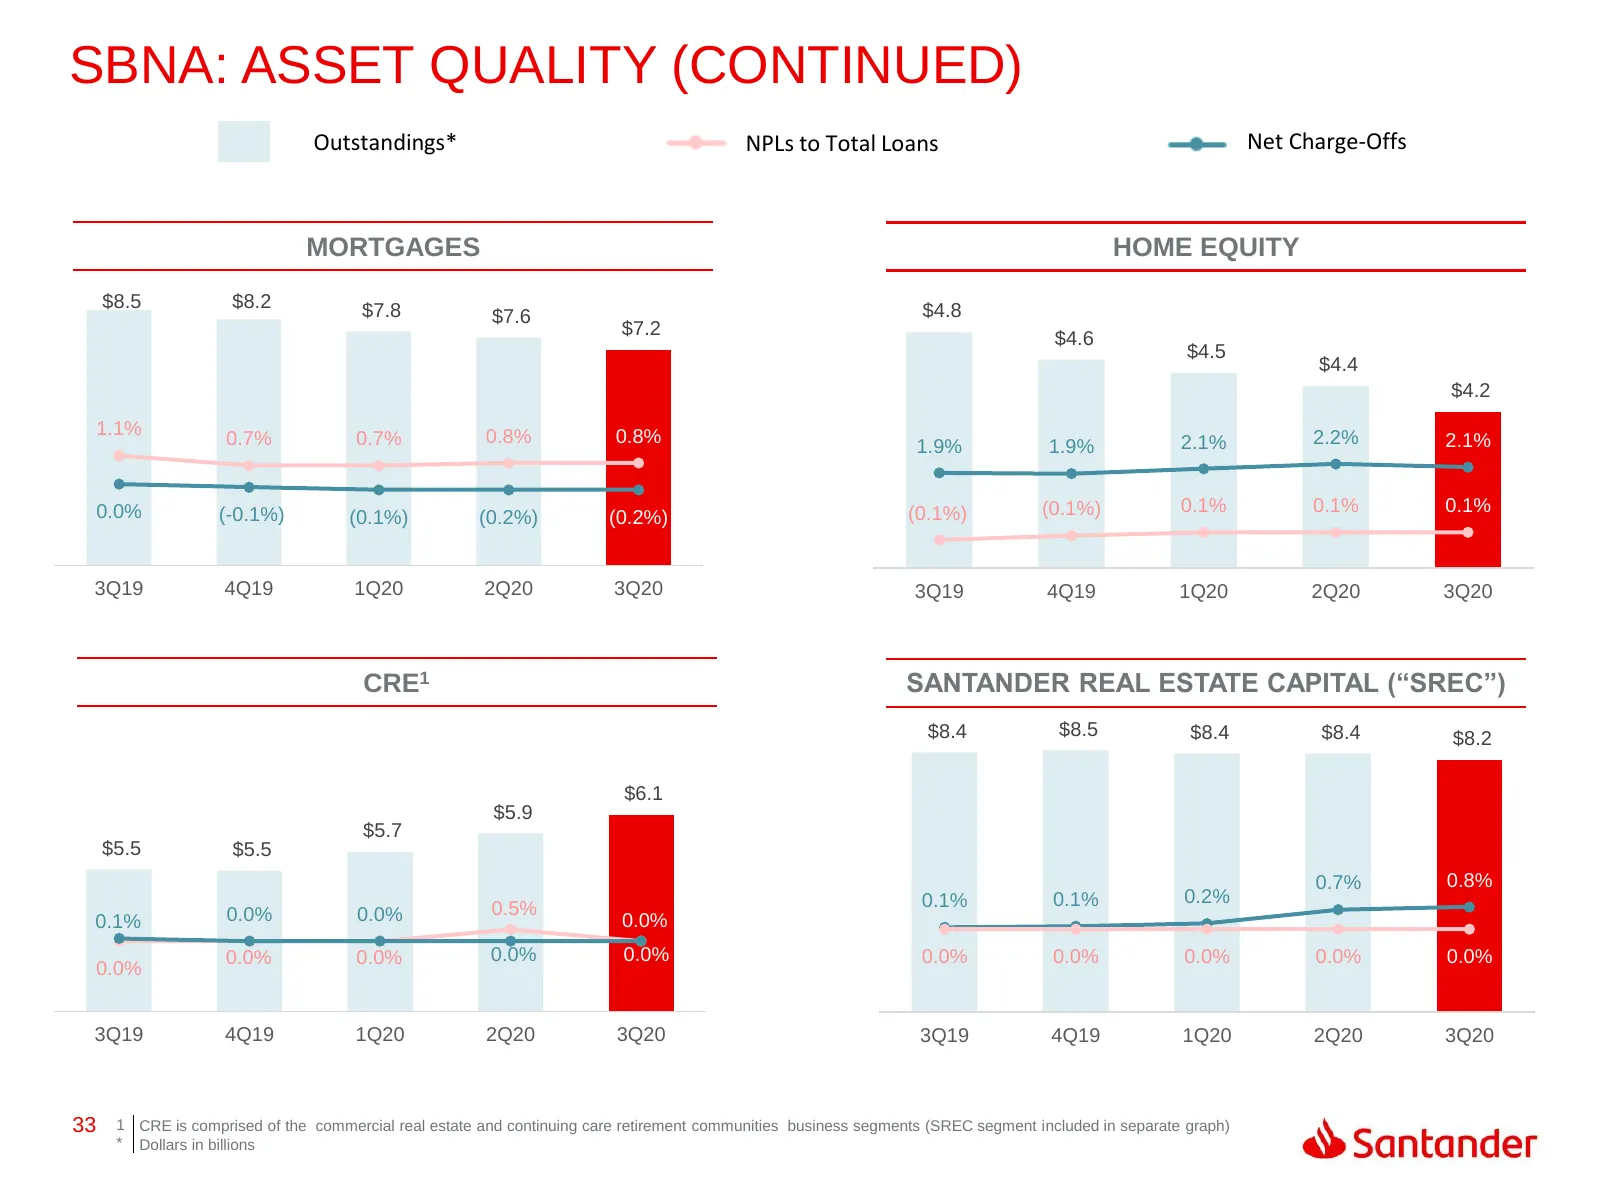
SBNA: ASSET QUALITY (CONTINUED) Outstandings* NPLs to Total Loans Net Charge-Offs MORTGAGES HOME EQUITY $8.5 $8.2 $9.0 7.0% $7.8 $7.6 $5.0 $4.8 7.0% $7.2 6.0% $8.0 $4.6 $4.8 6.0% $7.0 5.0% $4.5 $4.4 $4.6 5.0% 4.0% $4.2 $6.0 $4.4 3.0% 4.0% $4.2 $5.0 1.1% 0.8% 0.8% 2.0% 2.2% $4.0 0.7% 0.7% $4.0 1.9% 1
Slide 34: SBNA: Asset Quality (Continued)
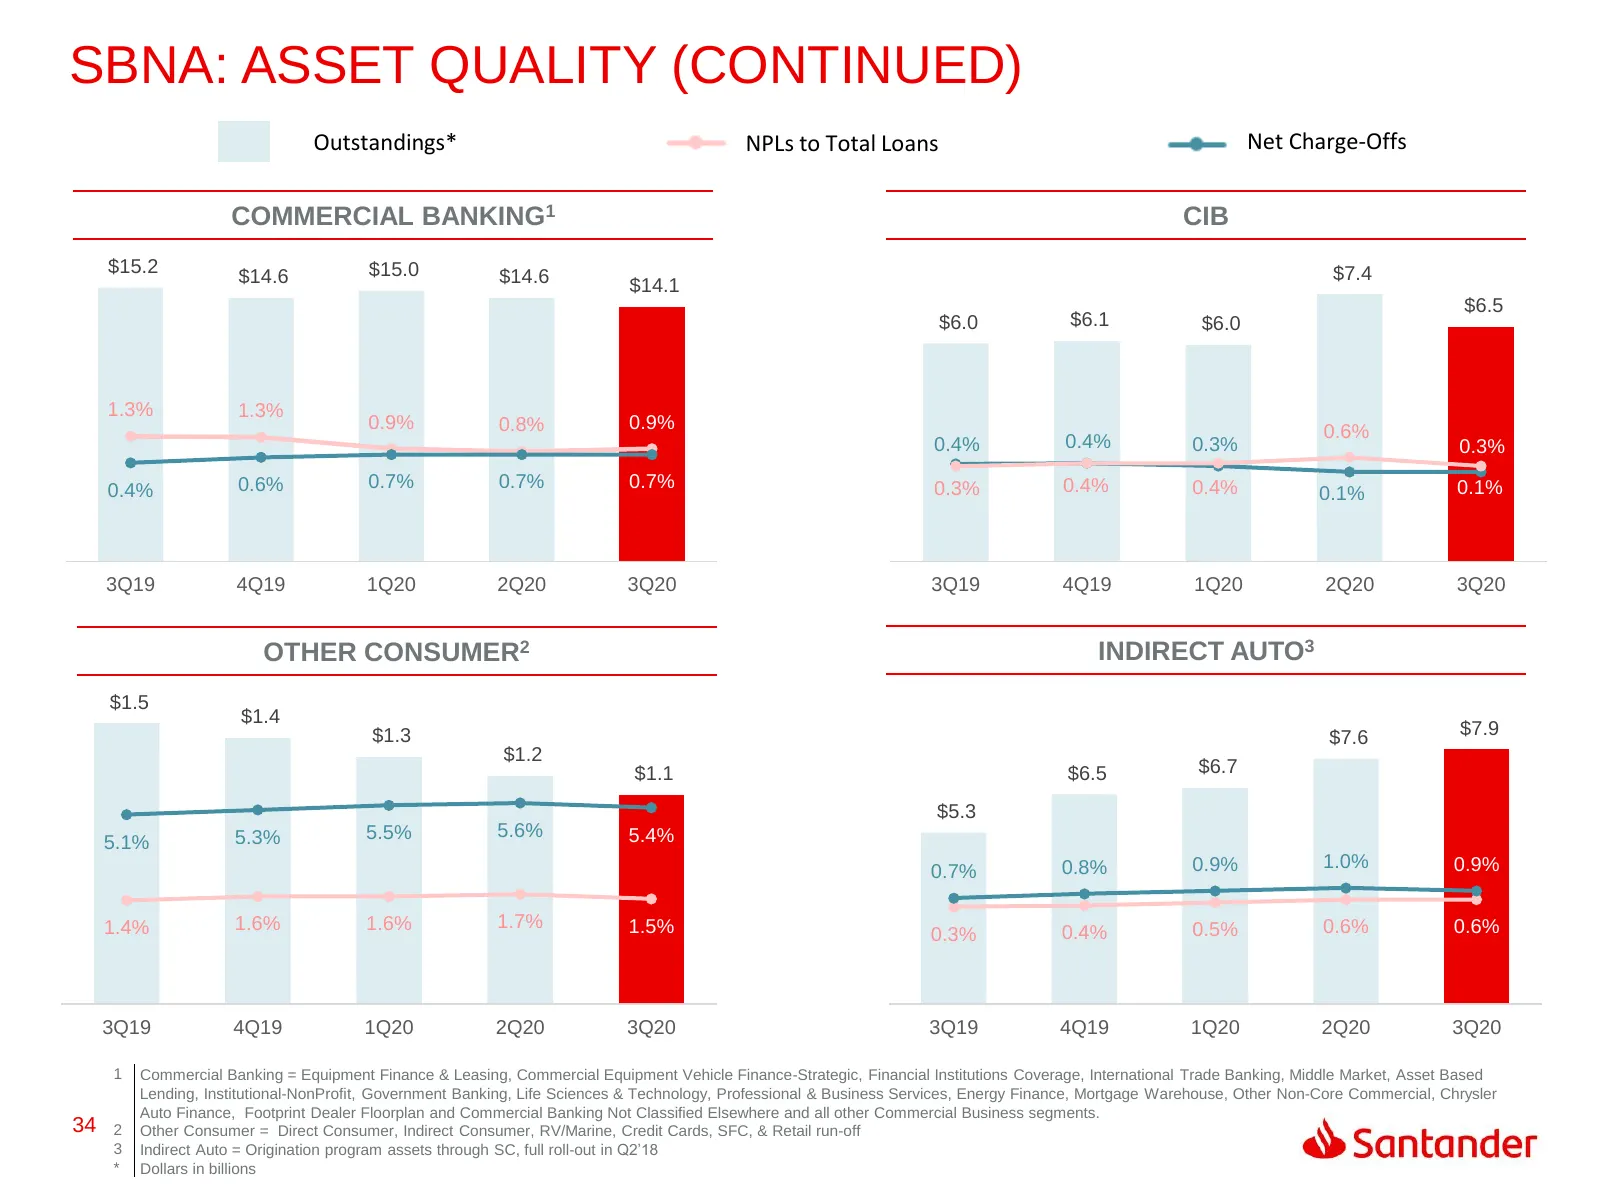
SBNA: ASSET QUALITY (CONTINUED) Outstandings* NPLs to Total Loans Net Charge-Offs COMMERCIAL BANKING1 CIB $15.2 $15.0 $7.4 $14.6 $14.6 7.0% $16.0 $8.0 7.0% $14.1 6.0% $6.5 6.0% $14.0 $7.0 5.0% $6.0 $6.1 $6.0 5.0% $12.0 $6.0 4.0% 4.0% $10.0 $5.0 3.0% 3.0% 1.3% 1.3% 0.9% 0.9% $8.0 2.0% $4.0 2.0% 0.8%
Slide 35: SBNA: Capital Ratios
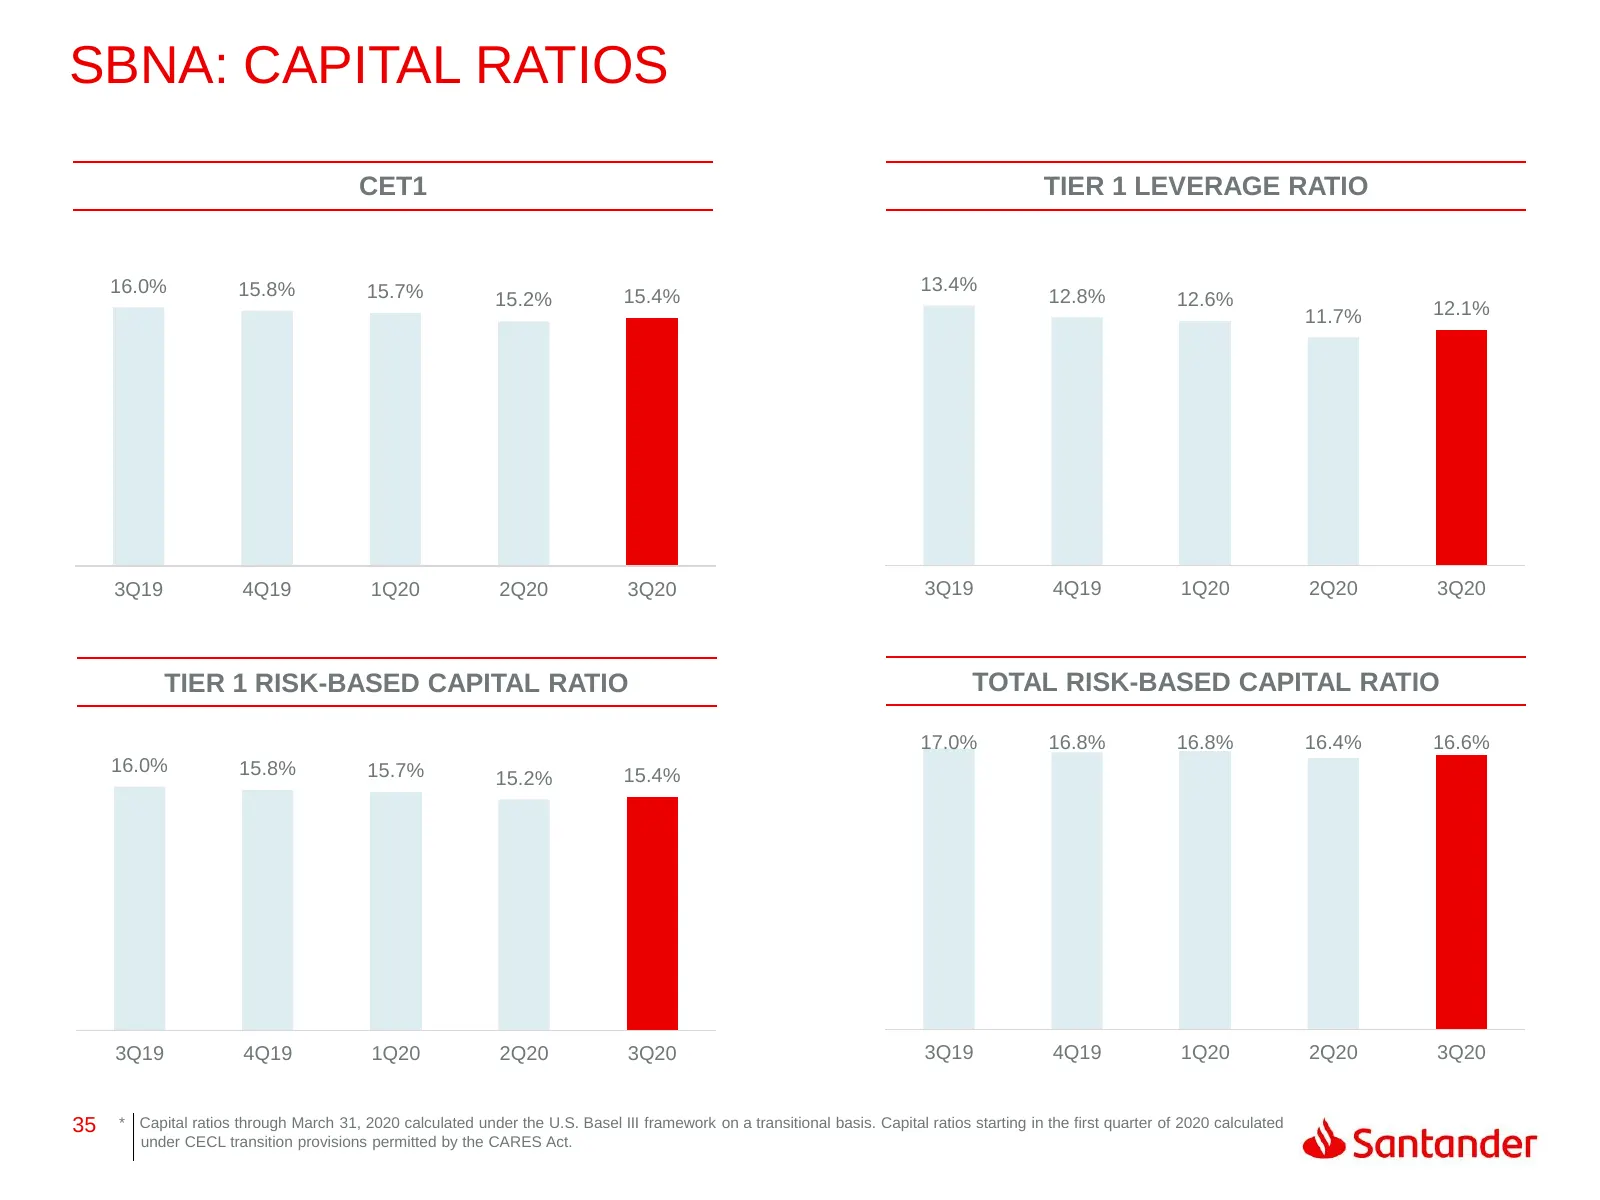
SBNA: CAPITAL RATIOS CET1 TIER 1 LEVERAGE RATIO 16.0% 15.8% 15.7% 13.4% 15.2% 15.4% 12.8% 12.6% 11.7% 12.1% 3Q19 4Q19 1Q20 2Q20 3Q20 3Q19 4Q19 1Q20 2Q20 3Q20 TIER 1 RISK-BASED CAPITAL RATIO TOTAL RISK-BASED CAPITAL RATIO 17.0% 16.8% 16.8% 16.4% 16.6% 16.0% 15.8% 15.7% 15.4% 15.2% 3Q19 4Q19 1Q20 2Q20
Slide 36: SC Auto YTD Monthly Originations
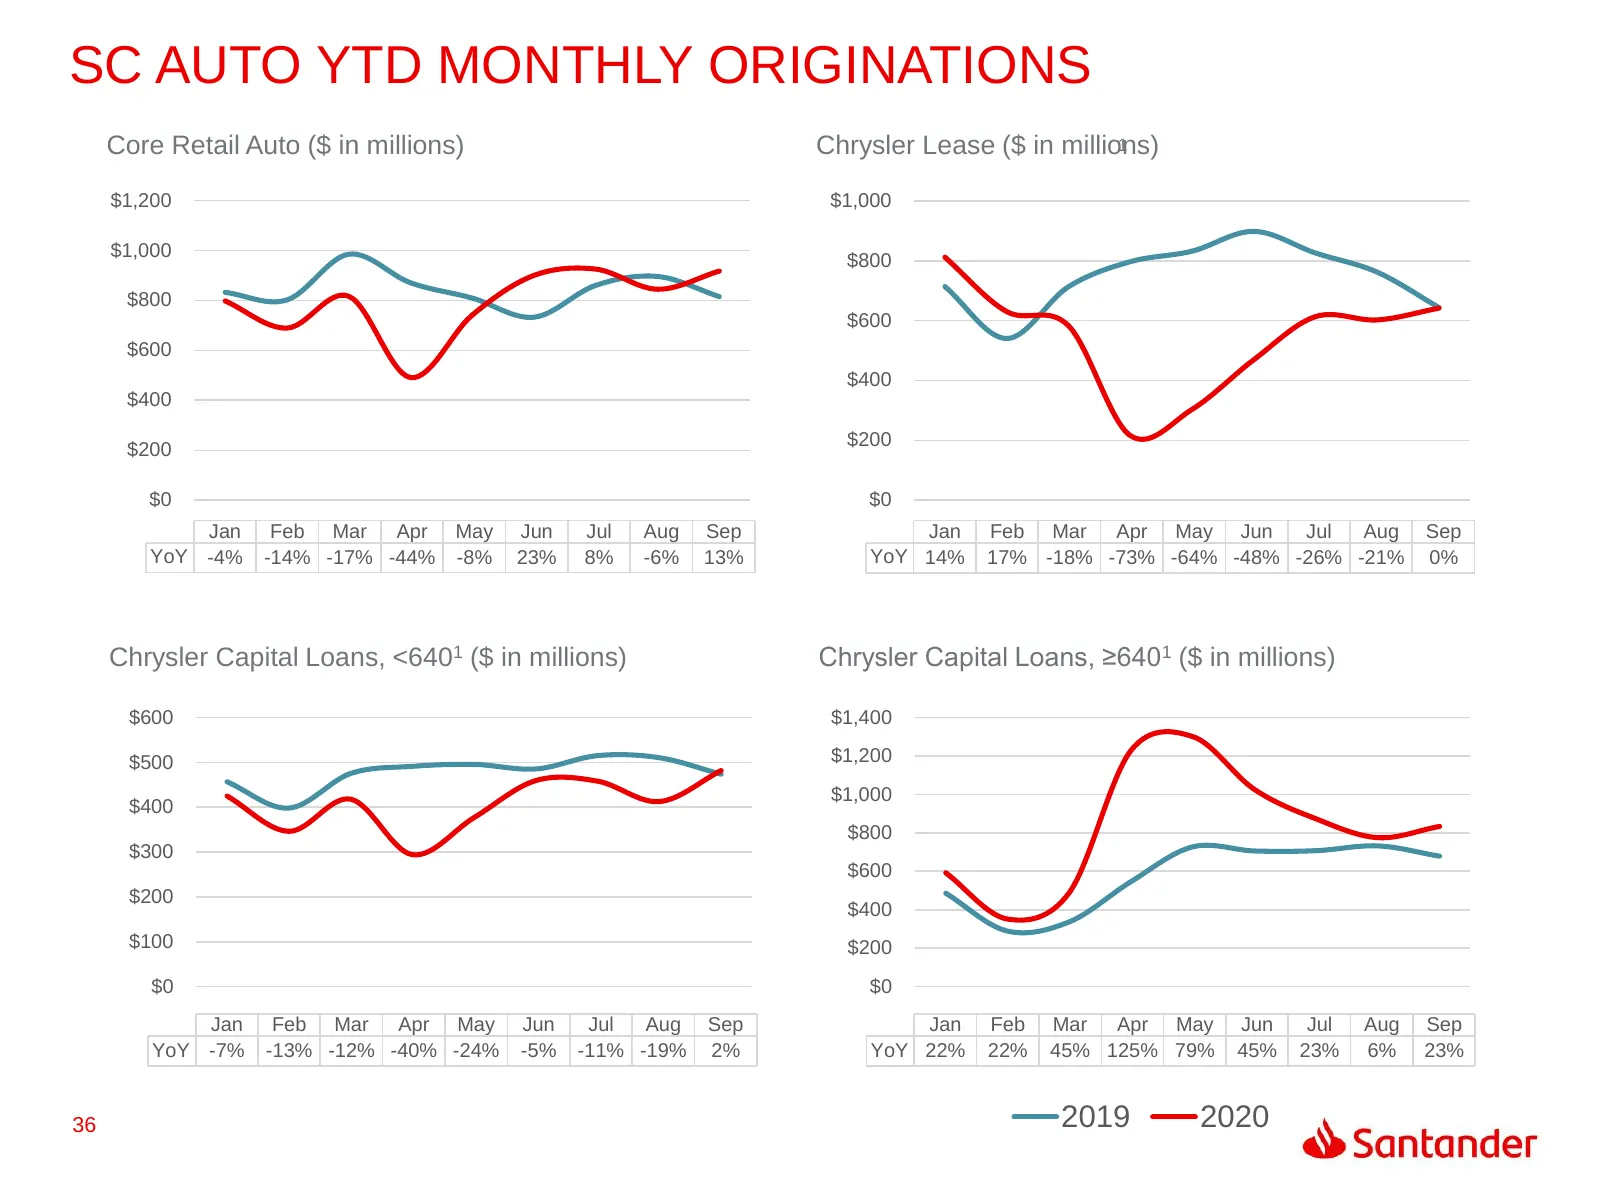
SC AUTO YTD MONTHLY ORIGINATIONS Core Retail Auto ($ in millions) Chrysler Lease ($ in millions) 1 $1,200 $1,000 $1,000 $800 $800 $600 $600 $400 $400 $200 $200 $0 $0 Jan Feb Mar Apr May Jun Jul Aug Sep Jan Feb Mar Apr May Jun Jul Aug Sep YoY -4% -14% -17% -44% -8% 23% 8% -6% 13% YoY 14% 17% -18% -73
Slide 37: SC Auto Loss & Recovery Ratios (Annualized)
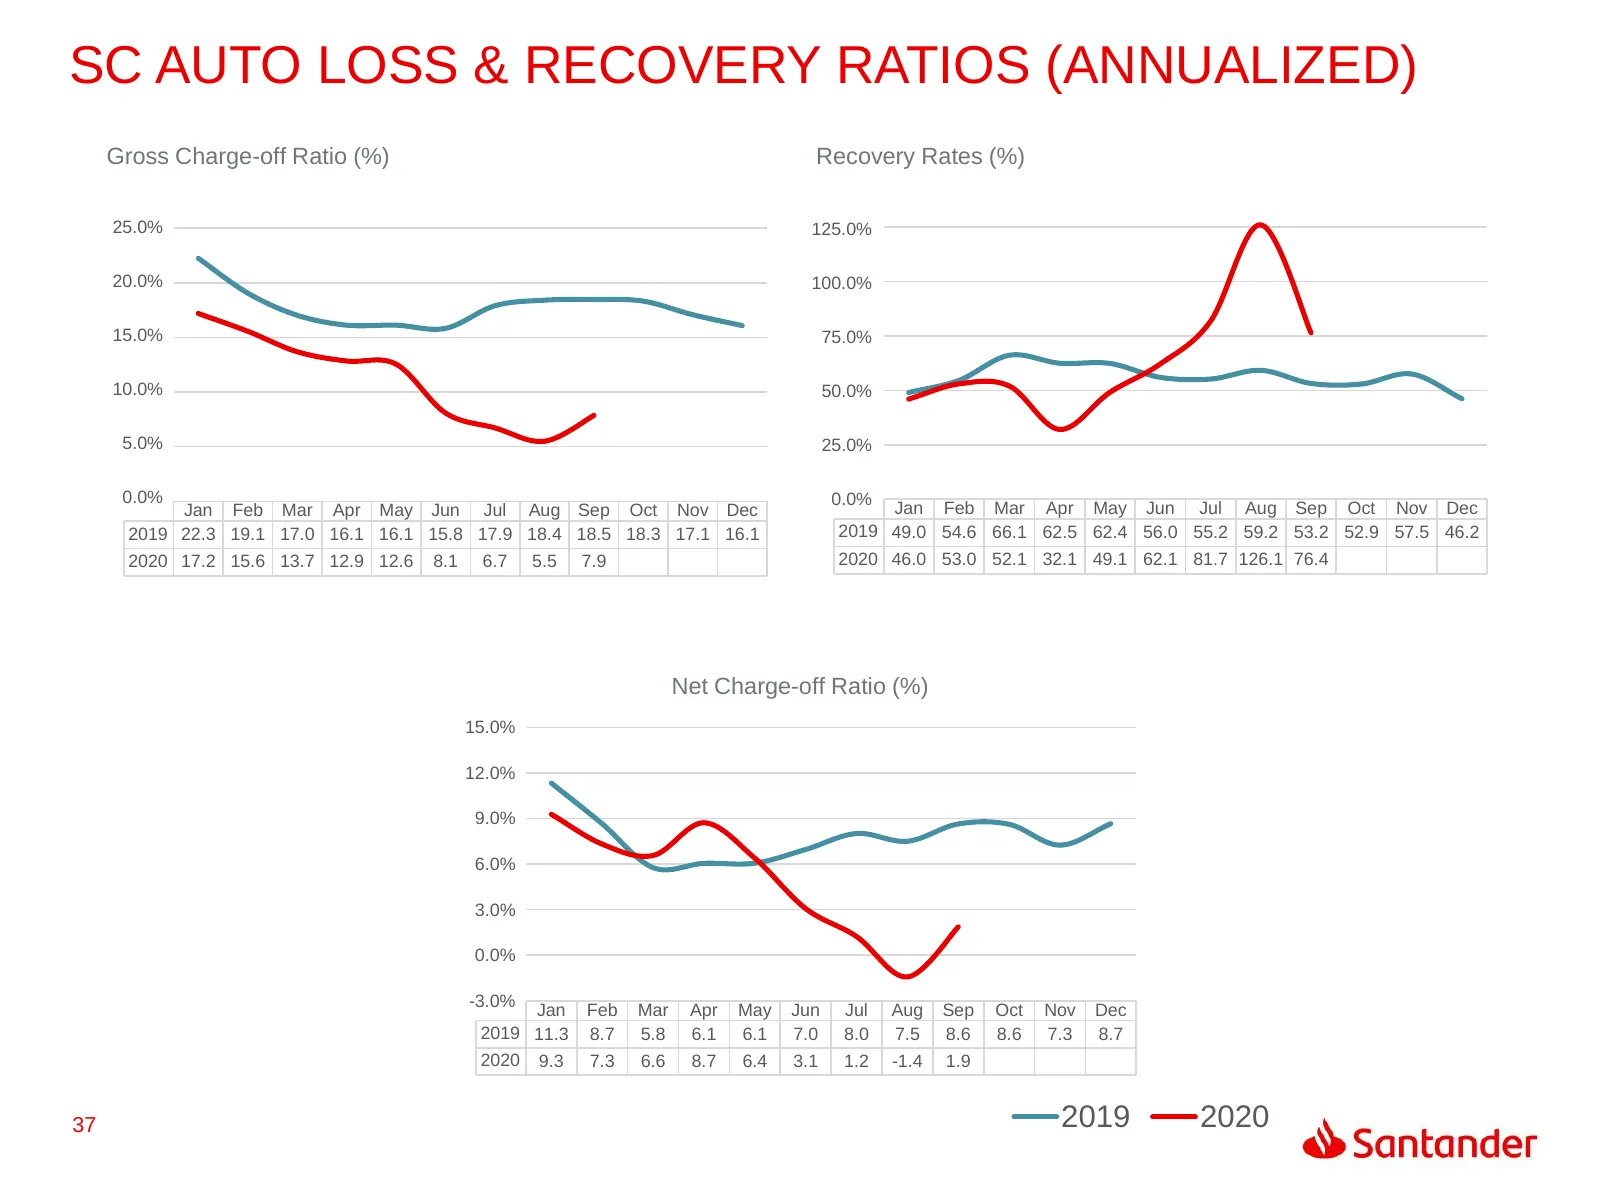
SC AUTO LOSS & RECOVERY RATIOS (ANNUALIZED) Gross Charge-off Ratio (%) Recovery Rates (%) 25.0% 125.0% 20.0% 100.0% 15.0% 75.0% 10.0% 50.0% 5.0% 25.0% 0.0% 0.0% Jan Feb Mar Apr May Jun Jul Aug Sep Oct Nov Dec Jan Feb Mar Apr May Jun Jul Aug Sep Oct Nov Dec 2019 22.3 19.1 17.0 16.1 16.1 15.8 17.9 18.
Slide 38: SBNA: Non-GAAP Reconciliations
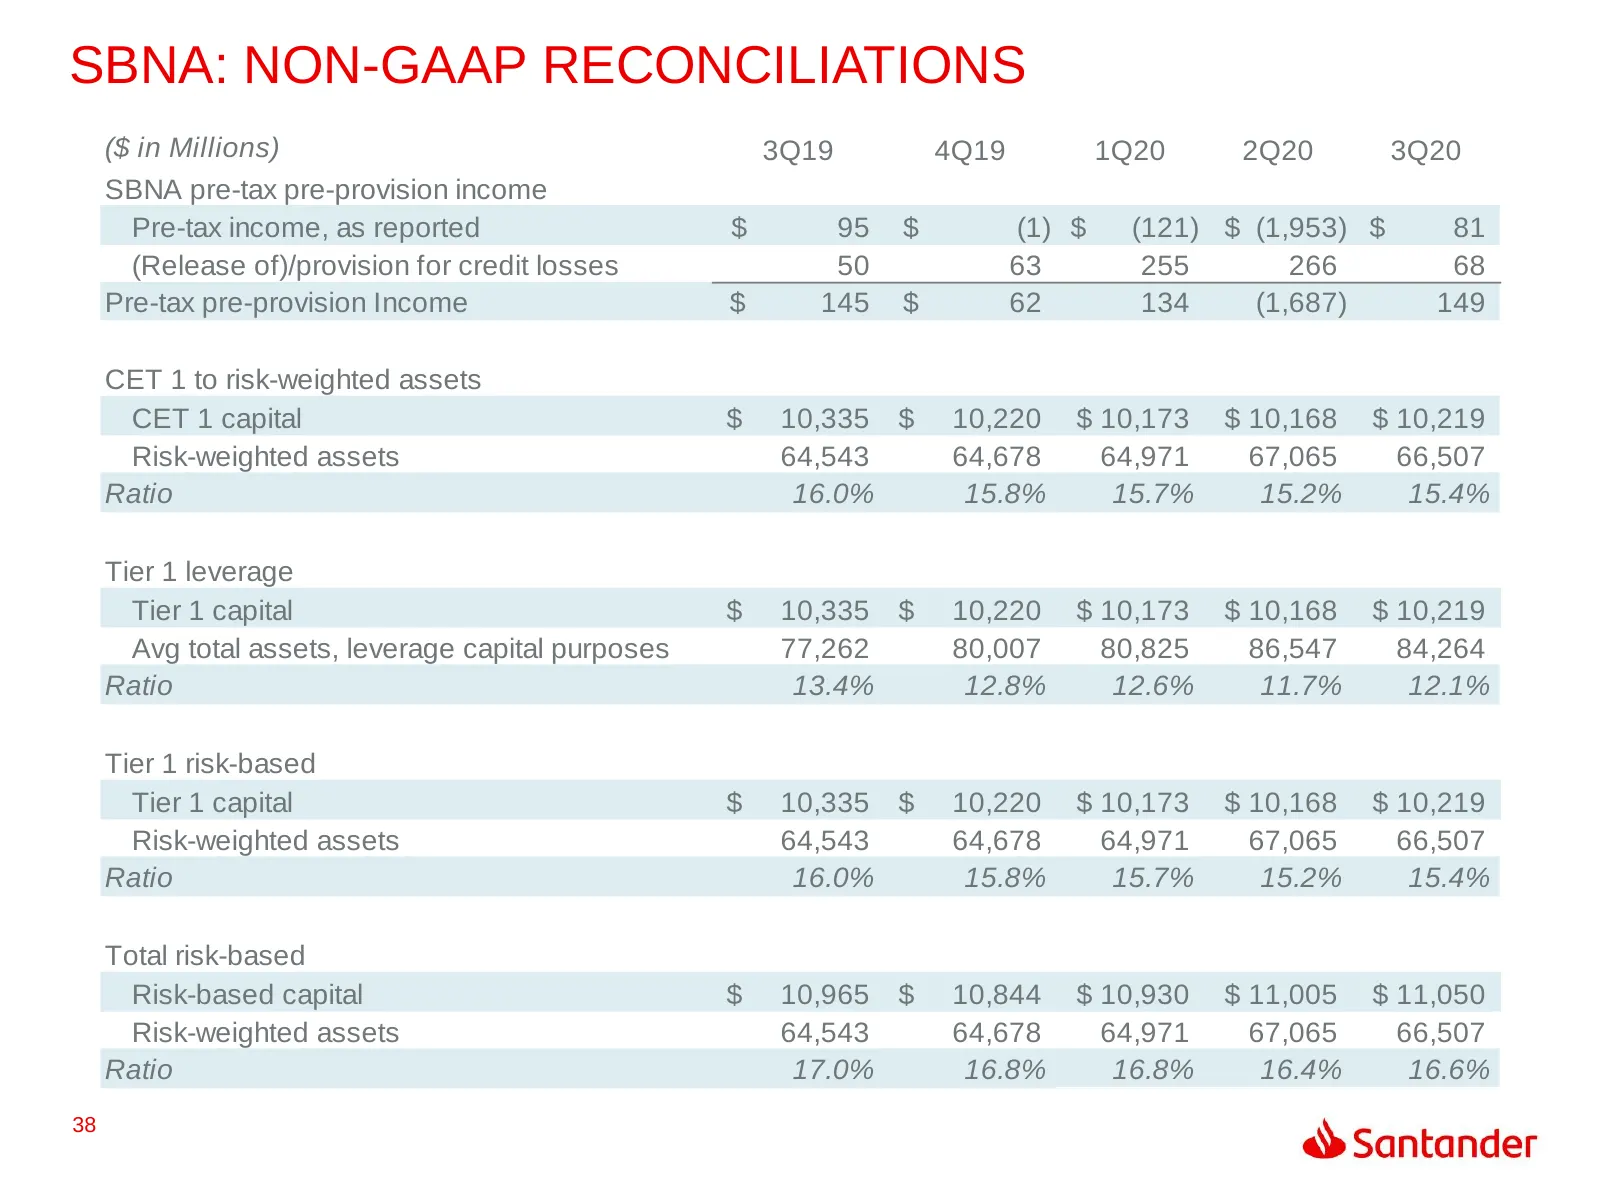
SBNA: NON-GAAP RECONCILIATIONS ($ in Millions) 3Q19 4Q19 1Q20 2Q20 3Q20 SBNA pre-tax pre-provision income Pre-tax income, as reported $ 95 $ (1) $ (121) $ (1,953) $ 81 (Release of)/provision for credit losses 50 63 255 266 68 Pre-tax pre-provision Income $ 145 $ 62 134 (1,687) 149 CET 1 to risk-weig
Slide 39: SBNA: Non-GAAP Reconciliations (cont.)
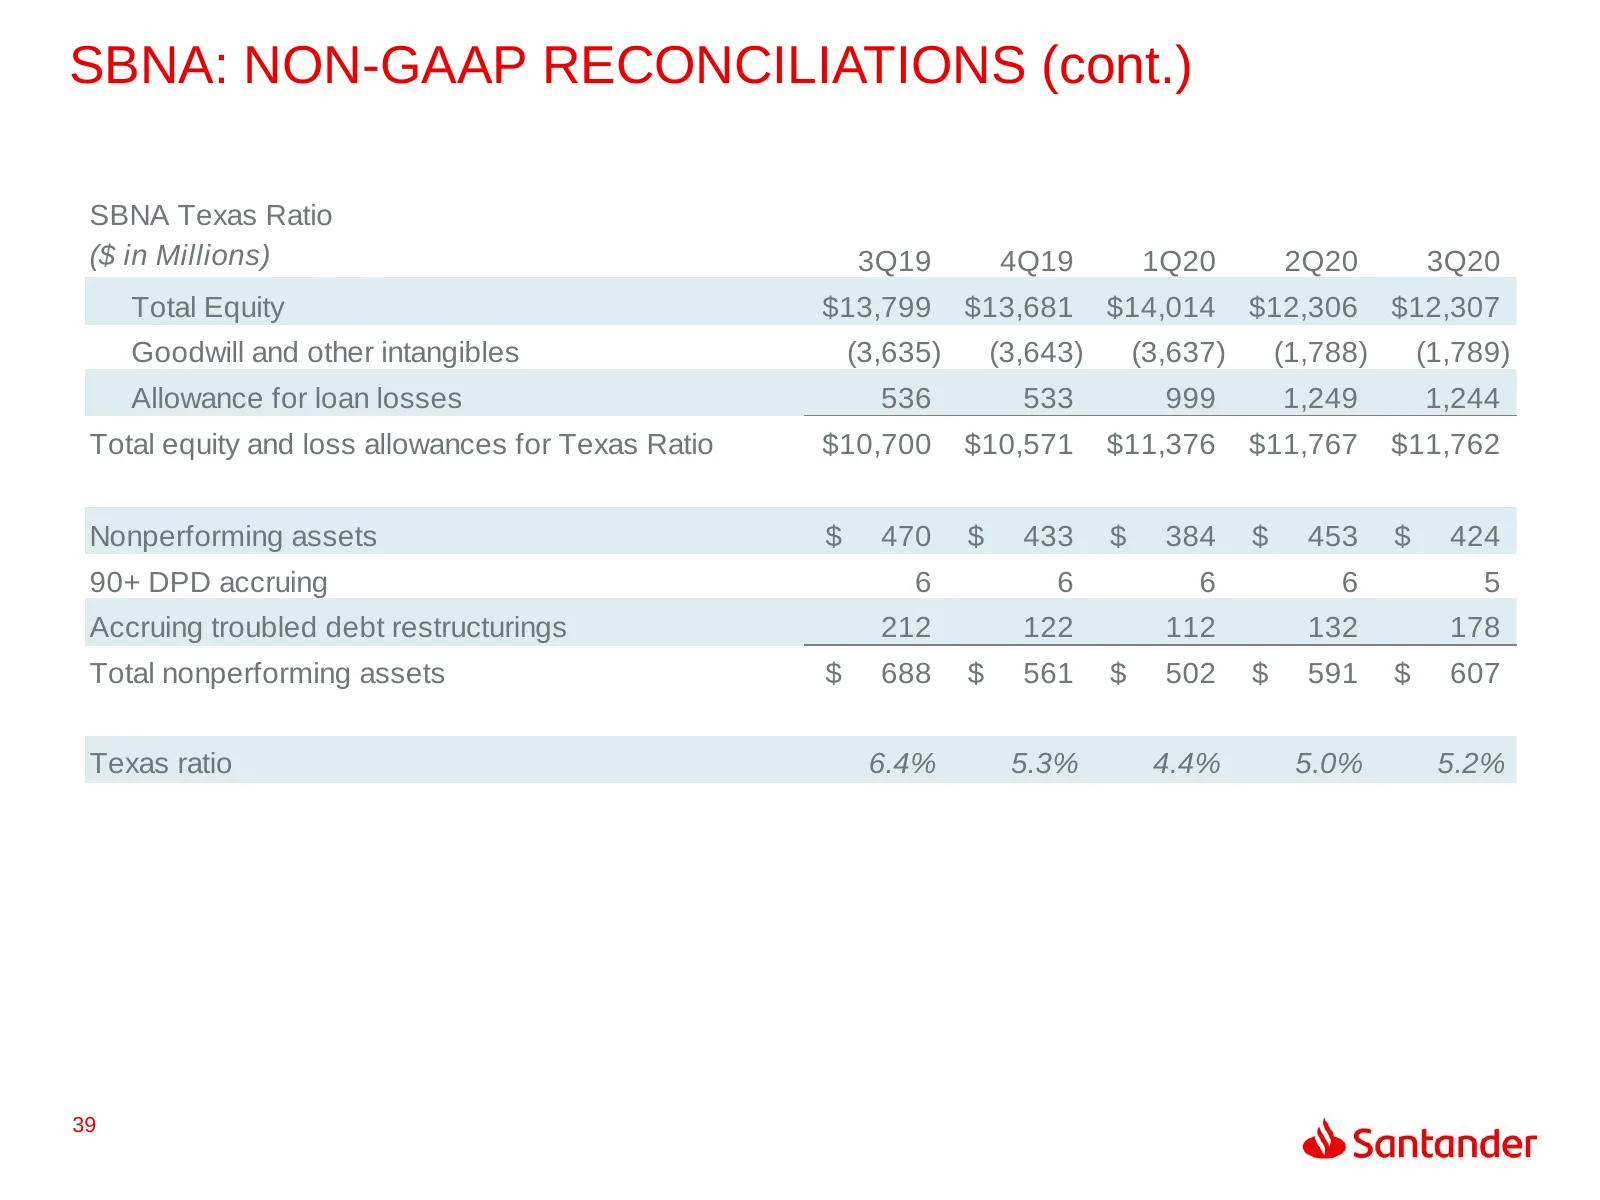
SBNA: NON-GAAP RECONCILIATIONS (cont.) SBNA Texas Ratio ($ in Millions) 3Q19 4Q19 1Q20 2Q20 3Q20 Total Equity $13,799 $13,681 $14,014 $12,306 $12,307 Goodwill and other intangibles (3,635) (3,643) (3,637) (1,788) (1,789) Allowance for loan losses 536 533 999 1,249 1,244 Total equity and loss allowan
Slide 40: Thank You
THANK YOU Our purpose is to help people and businesses prosper. Our culture is based on believing that everything we do should be:
Source: company website
More decks from Santander Holdings USA Inc
 Debt Investor Presentation (August 2026)30 slides · Aug 12, 2026
 Debt Investor Presentation (August 2026)30 slides · Aug 12, 2026
 Debt Investor Presentation (June 2026)29 slides · Jun 12, 2026
 Debt Investor Presentation (June 2026)29 slides · Jun 12, 2026
 Debt Investor Presentation (March 2026)36 slides · Mar 6, 2026
 Debt Investor Presentation (March 2026)36 slides · Mar 6, 2026