Vectren — Financial Community Presentation New York & Boston 2013
37 slides from Vectren's conference presentation, Feb 26, 2013
Slide 1: Financial Community Presentation New York & Boston February 26-28, 2013
Financial Community Presentation New York & Boston February 26-28, 2013
Slide 2: Management Representatives
2 Management Representatives Carl Chapman – Chairman, President and CEO Robert Goocher – Treasurer and VP - Investor Relations Aaron Musgrave – Director, Investor Relations
Slide 3: Forward-Looking Statements
3 Forward-Looking Statements All statements other than statements of historical fact are forward-looking statements made in good faith by the company and are intended to qualify for the safe harbor from liability established by the Private Securities Litigation Reform Act of 1995. Such statements ar
Slide 4: Vectren Corporation Overview
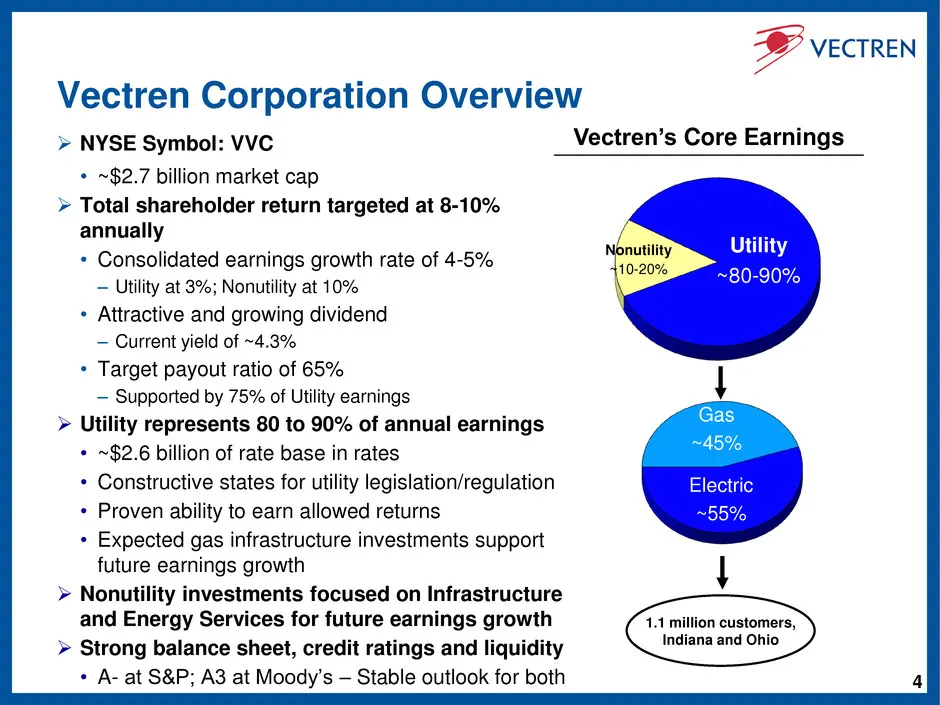
4 Vectren Corporation Overview NYSE Symbol: VVC • ~$2.7 billion market cap Total shareholder return targeted at 8-10% annually • Consolidated earnings growth rate of 4-5% – Utility at 3%; Nonutility at 10% • Attractive and growing dividend – Current yield of ~4.3% • Target payout ratio of 65% –
Slide 5: Vectren at a Glance
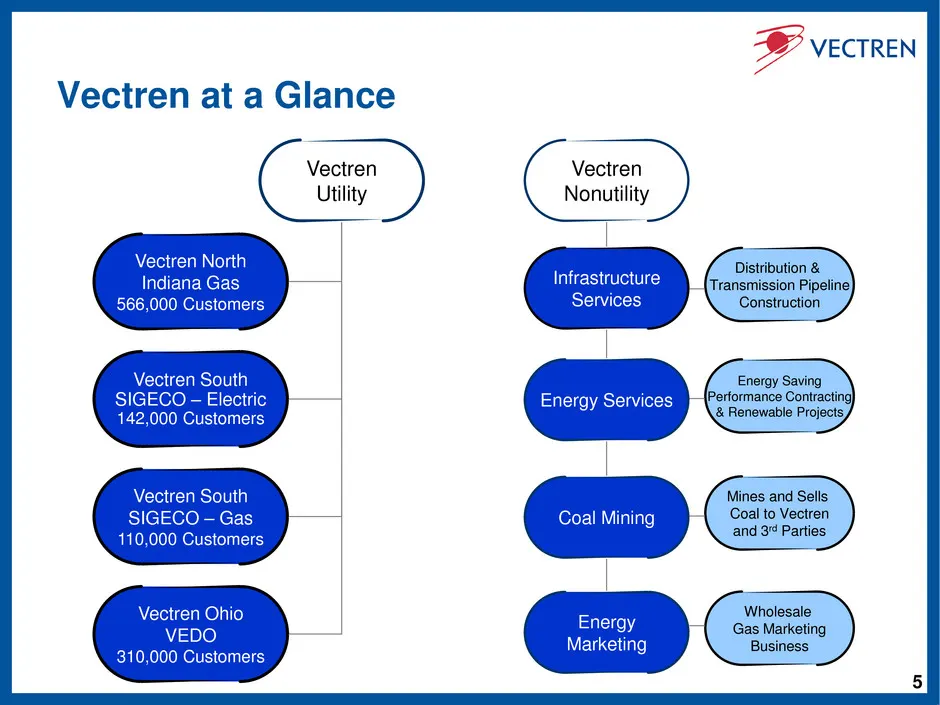
5 Vectren Nonutility Infrastructure Services Energy Services Coal Mining Energy Marketing Distribution & Transmission Pipeline Construction Energy Saving Performance Contracting & Renewable Projects Mines and Sells Coal to Vectren and 3rd Parties Wholesale Gas Marketing Business Vectren Utility Vect
Slide 6: Operating Strategies to Achieve Financial Goals
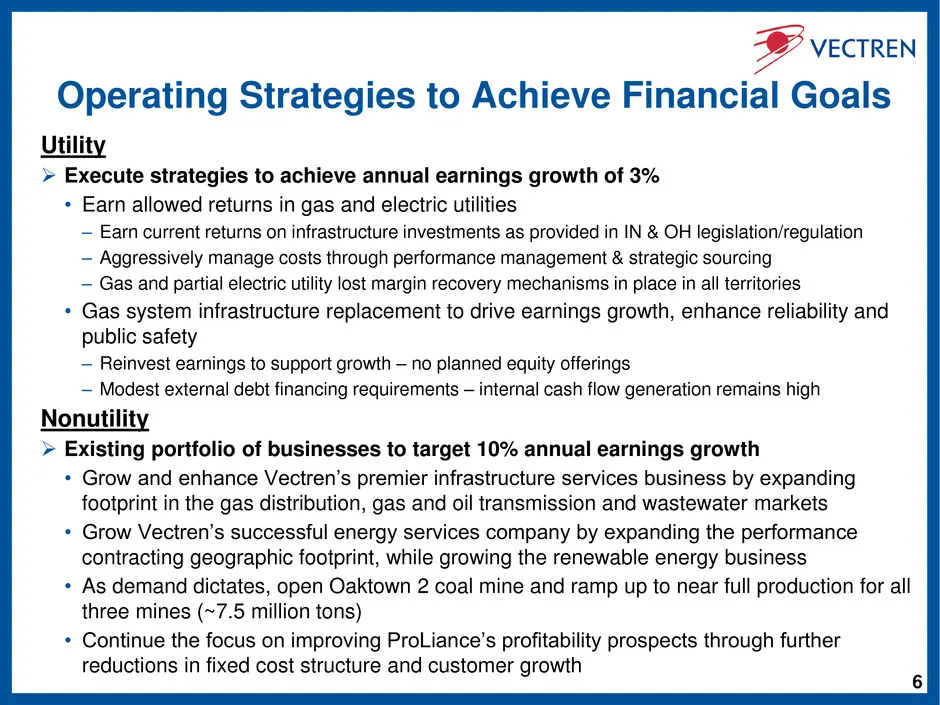
6 Operating Strategies to Achieve Financial Goals Utility Execute strategies to achieve annual earnings growth of 3% • Earn allowed returns in gas and electric utilities – Earn current returns on infrastructure investments as provided in IN & OH legislation/regulation – Aggressively manage costs t
Slide 7: Key Discussion Topics
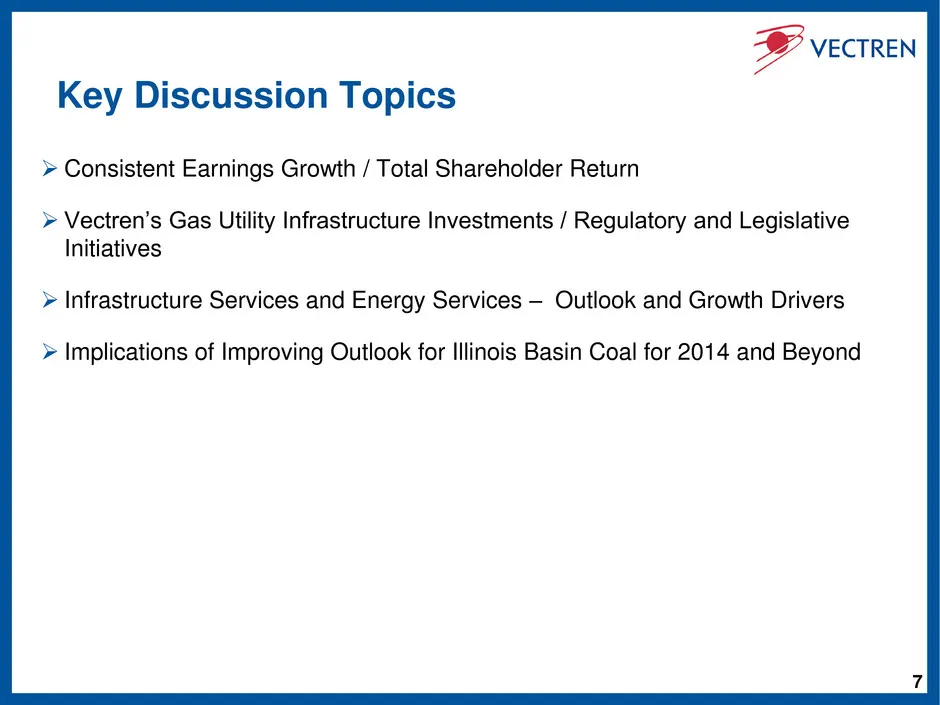
7 Key Discussion Topics Consistent Earnings Growth / Total Shareholder Return Vectren’s Gas Utility Infrastructure Investments / Regulatory and Legislative Initiatives Infrastructure Services and Energy Services – Outlook and Growth Drivers Implications of Improving Outlook for Illinois Basin
Slide 8: Review of 2012 Highlights
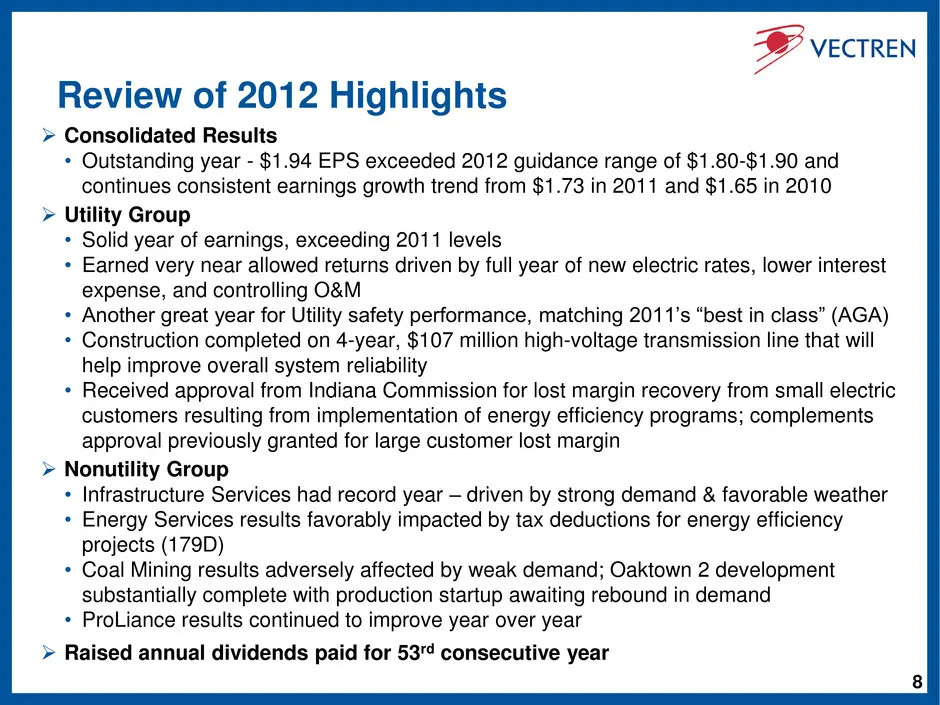
8 Review of 2012 Highlights Consolidated Results • Outstanding year - $1.94 EPS exceeded 2012 guidance range of $1.80-$1.90 and continues consistent earnings growth trend from $1.73 in 2011 and $1.65 in 2010 Utility Group • Solid year of earnings, exceeding 2011 levels • Earned very near allowed
Slide 9: Consistent Earnings Growth
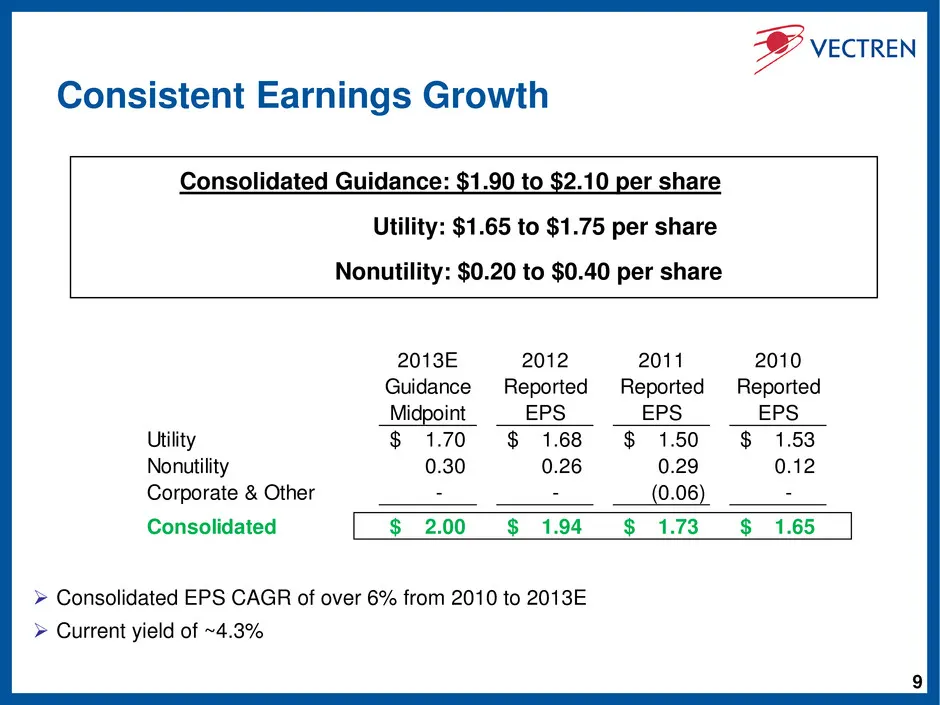
9 Consistent Earnings Growth Consolidated Guidance: $1.90 to $2.10 per share Utility: $1.65 to $1.75 per share Nonutility: $0.20 to $0.40 per share 2013E 2012 2011 2010 Guidance Reported Reported Reported Midpoint EPS EPS EPS Utility 1.70$ 1.68$ 1.50$ 1.53$ Nonutility 0.30 0.26 0.29 0.12 Corporate &
Slide 10: Utility – Service Territories & Rate Base
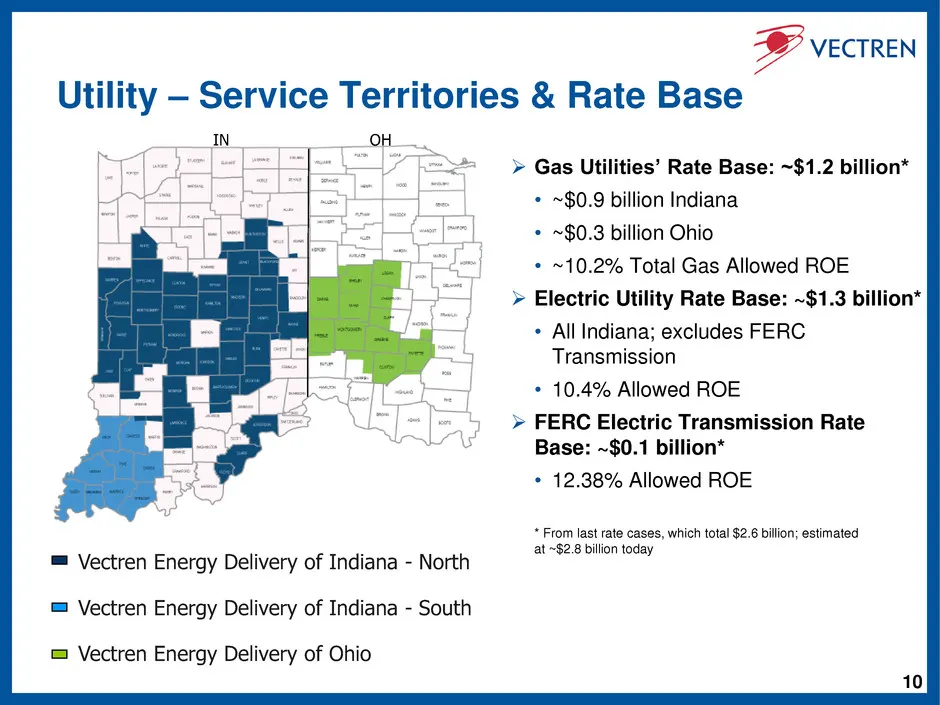
10 Vectren Energy Delivery of Indiana - North Vectren Energy Delivery of Indiana - South Vectren Energy Delivery of Ohio Utility – Service Territories & Rate Base Gas Utilities’ Rate Base: ~$1.2 billion* • ~$0.9 billion Indiana • ~$0.3 billion Ohio • ~10.2% Total Gas Allowed ROE Electric Utility
Slide 11: Utility - Earnings Growth
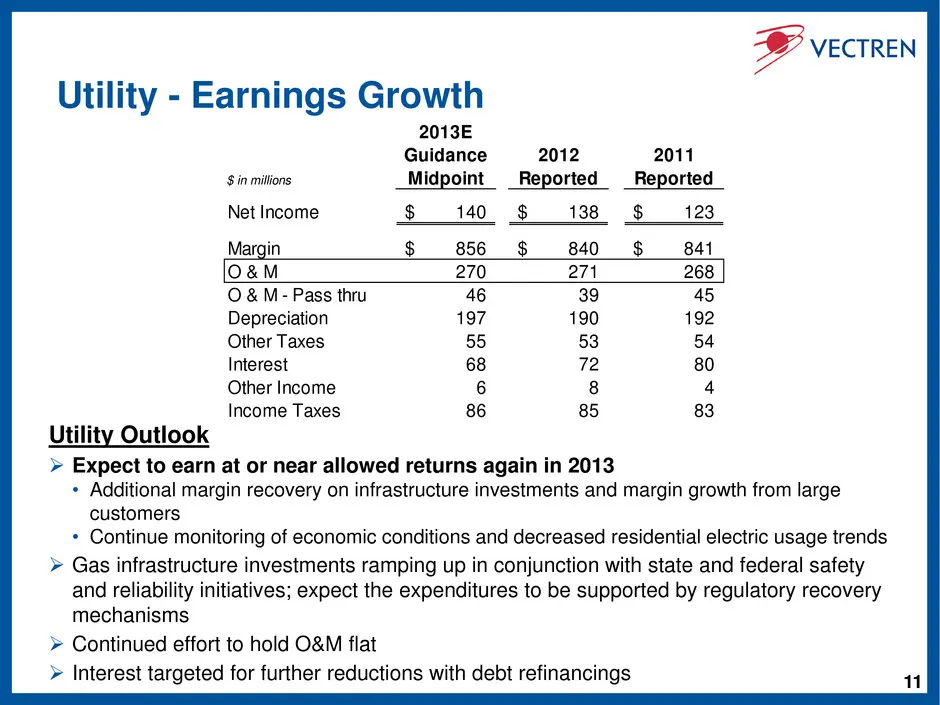
11 Utility - Earnings Growth Utility Outlook Expect to earn at or near allowed returns again in 2013 • Additional margin recovery on infrastructure investments and margin growth from large customers • Continue monitoring of economic conditions and decreased residential electric usage trends Gas
Slide 12: Utility - Infrastructure Recovery Mechanisms
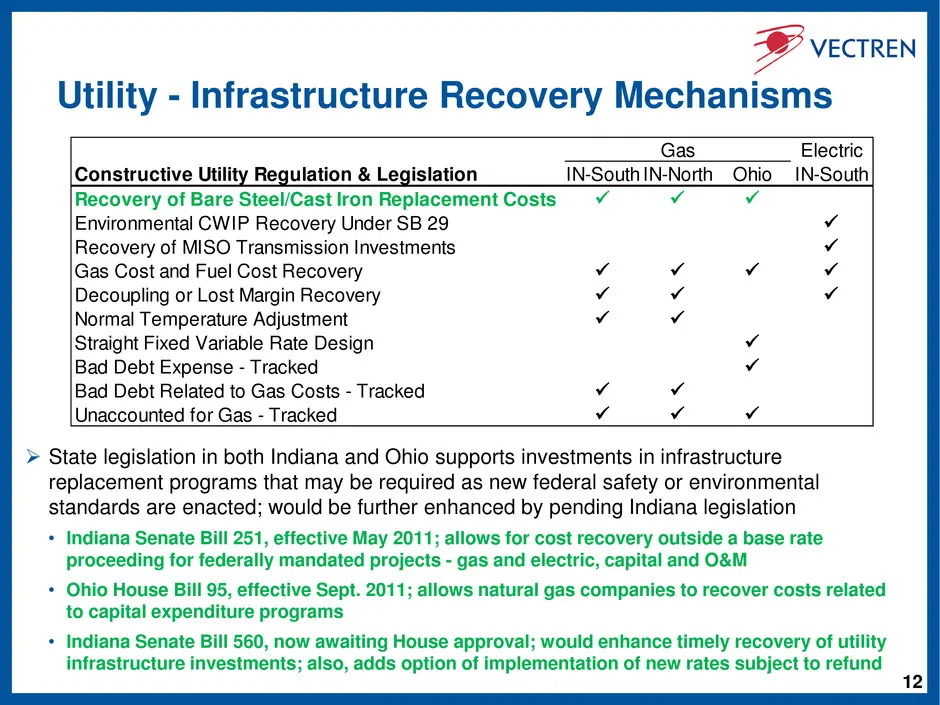
12 Utility - Infrastructure Recovery Mechanisms Electric Constructive Utility Regulation & Legislation IN-South IN-North Ohio IN-South Recovery of Bare Steel/Cast Iron Replacement Costs Environmental CWIP Recovery Under SB 29 Recovery of MISO Transmission Investments Gas Cost and Fuel Cost
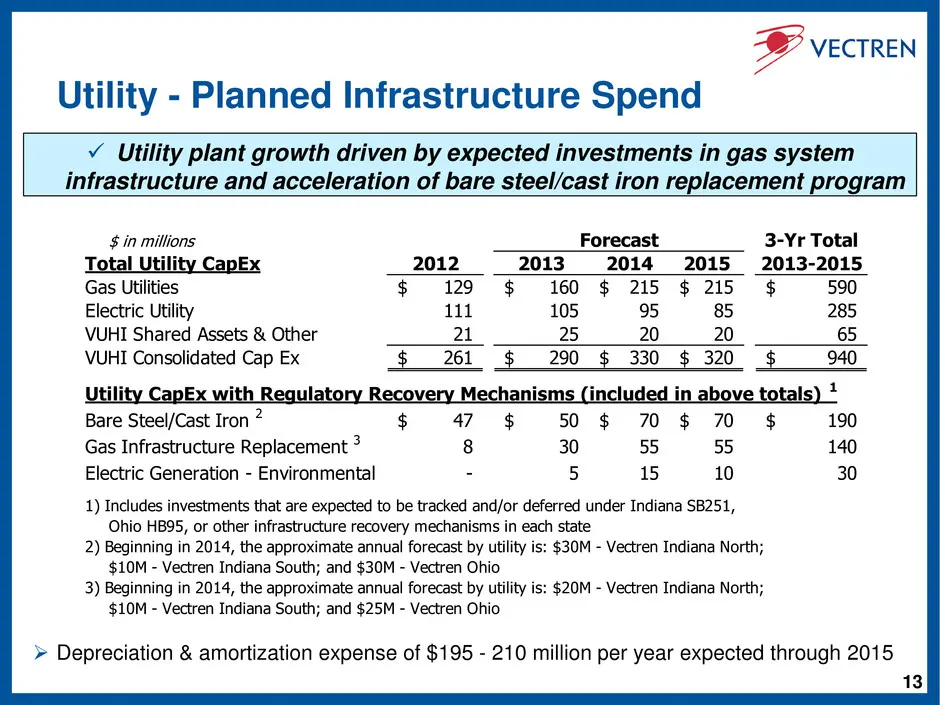
Slide 13: Utility - Planned Infrastructure Spend
13 Utility - Planned Infrastructure Spend $ in millions 3-Yr Total Total Utility CapEx 2012 2013 2014 2015 2013-2015 Gas Utilities 129$ 160$ 215$ 215$ 590$ Electric Utility 111 105 95 85 285 VUHI Shared Assets & Other 21 25 20 20 65 VUHI Consolidated Cap Ex 261$ 290$ 330$ 320$ 940$ Utility CapEx wit
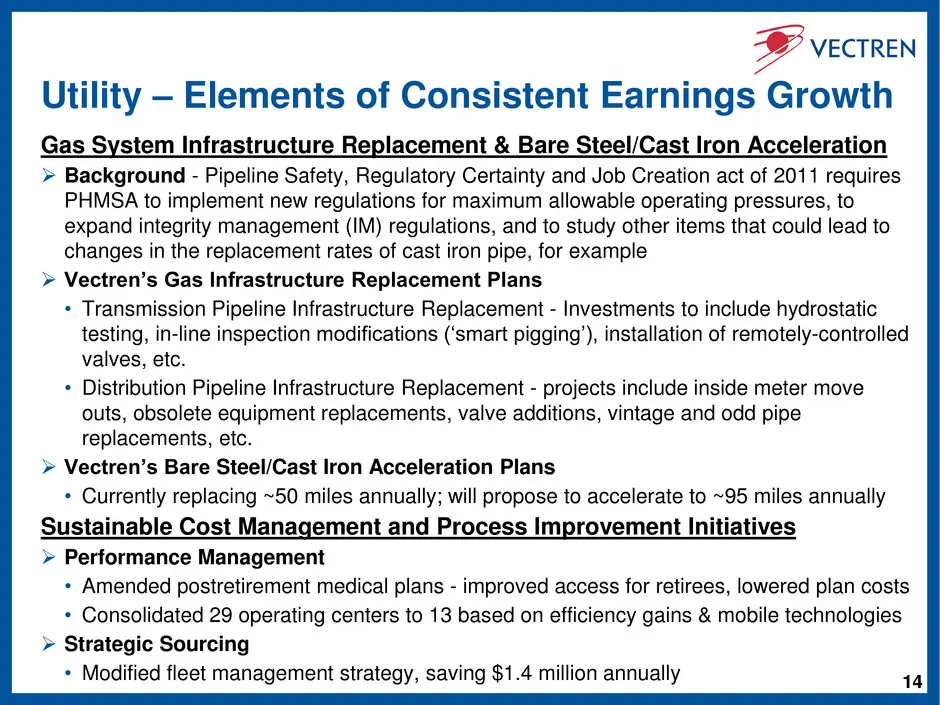
Slide 14: Utility – Elements of Consistent Earnings Growth
14 Utility – Elements of Consistent Earnings Growth Gas System Infrastructure Replacement & Bare Steel/Cast Iron Acceleration Background - Pipeline Safety, Regulatory Certainty and Job Creation act of 2011 requires PHMSA to implement new regulations for maximum allowable operating pressures, to ex
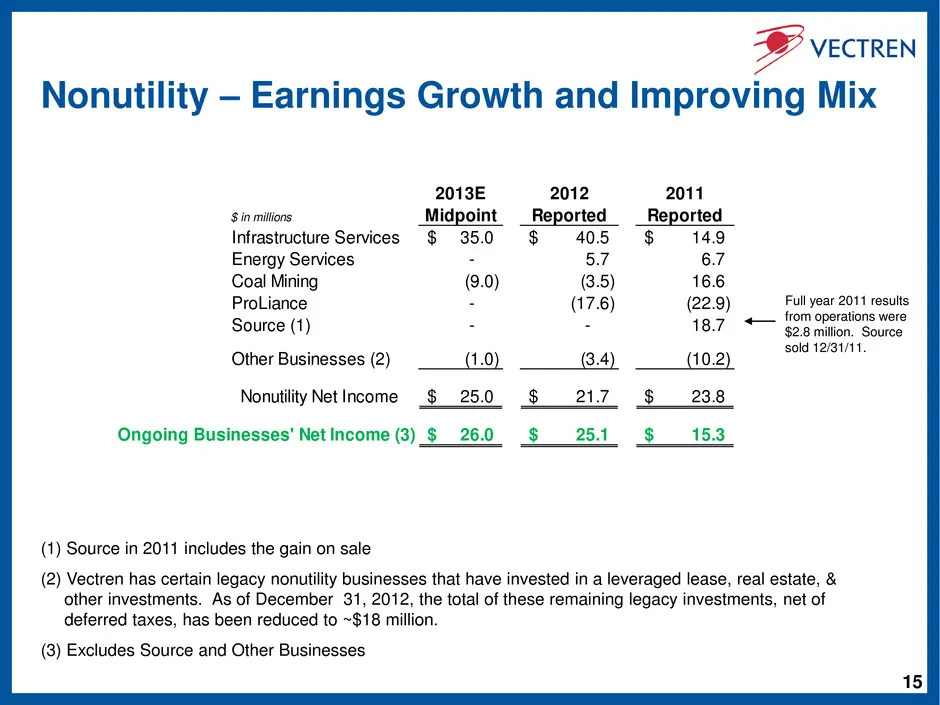
Slide 15: Nonutility – Earnings Growth and Improving Mix
15 Nonutility – Earnings Growth and Improving Mix 2013E 2012 2011 $ in millions Midpoint Reported Reported Infrastructure Services 35.0$ 40.5$ 14.9$ Energy Services - 5.7 6.7 Coal Mining (9.0) (3.5) 16.6 ProLiance - (17.6) (22.9) Source (1) - - 18.7 Other Businesses (2) (1.0) (3.4) (10.2) Nonutility
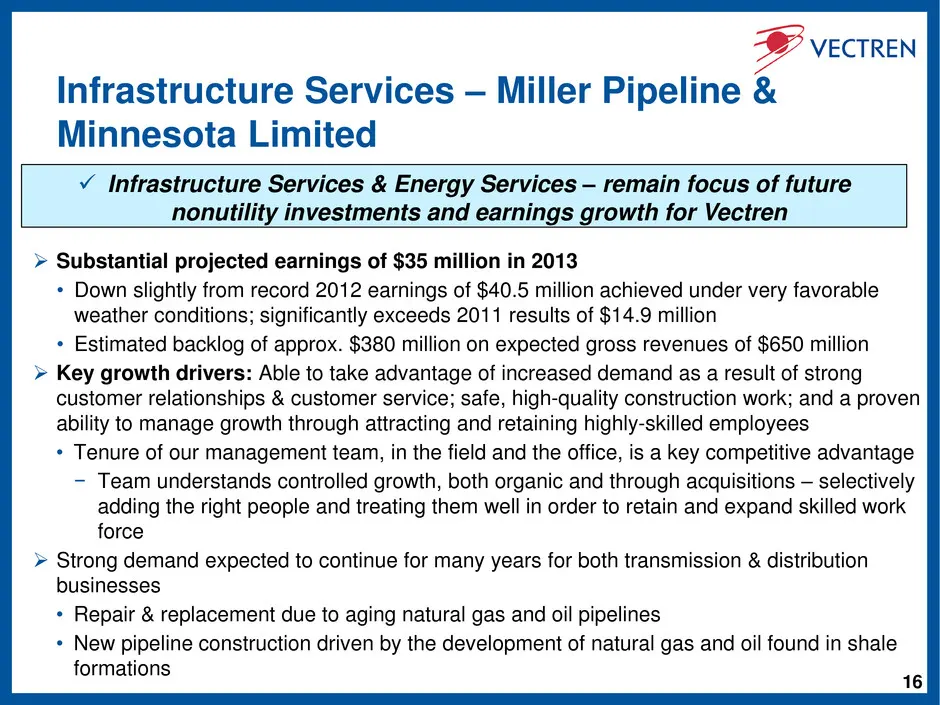
Slide 16: Infrastructure Services – Miller Pipeline & Minnesota Limited
16 Infrastructure Services – Miller Pipeline & Minnesota Limited Substantial projected earnings of $35 million in 2013 • Down slightly from record 2012 earnings of $40.5 million achieved under very favorable weather conditions; significantly exceeds 2011 results of $14.9 million • Estimated backlo
Slide 17: Infrastructure Services – Estimated Backlog
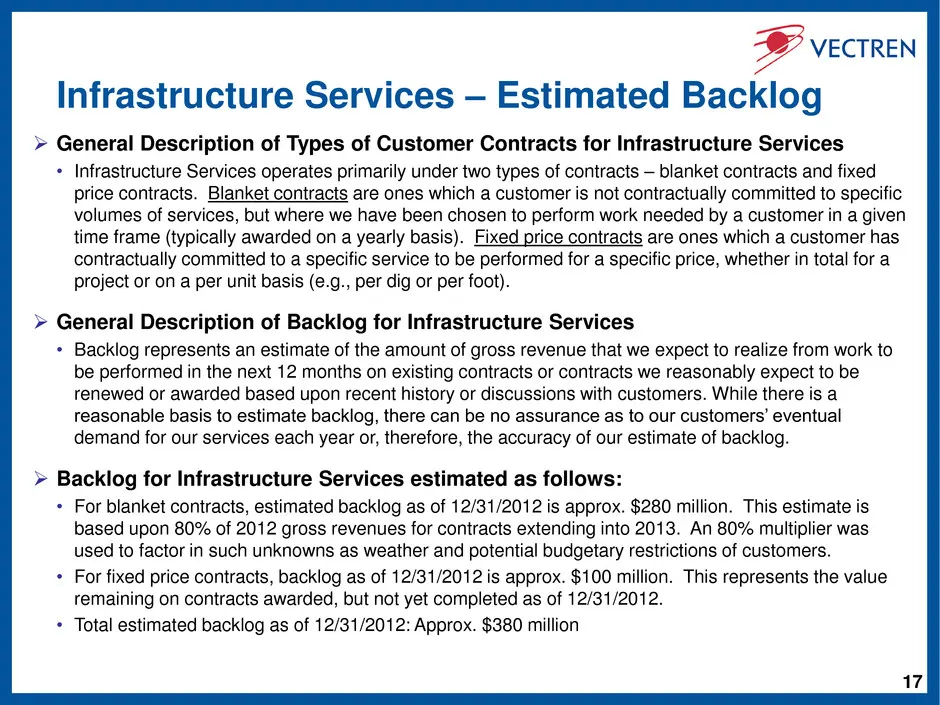
17 Infrastructure Services – Estimated Backlog General Description of Types of Customer Contracts for Infrastructure Services • Infrastructure Services operates primarily under two types of contracts – blanket contracts and fixed price contracts. Blanket contracts are ones which a customer is not
Slide 18: Infrastructure Services – Footprint
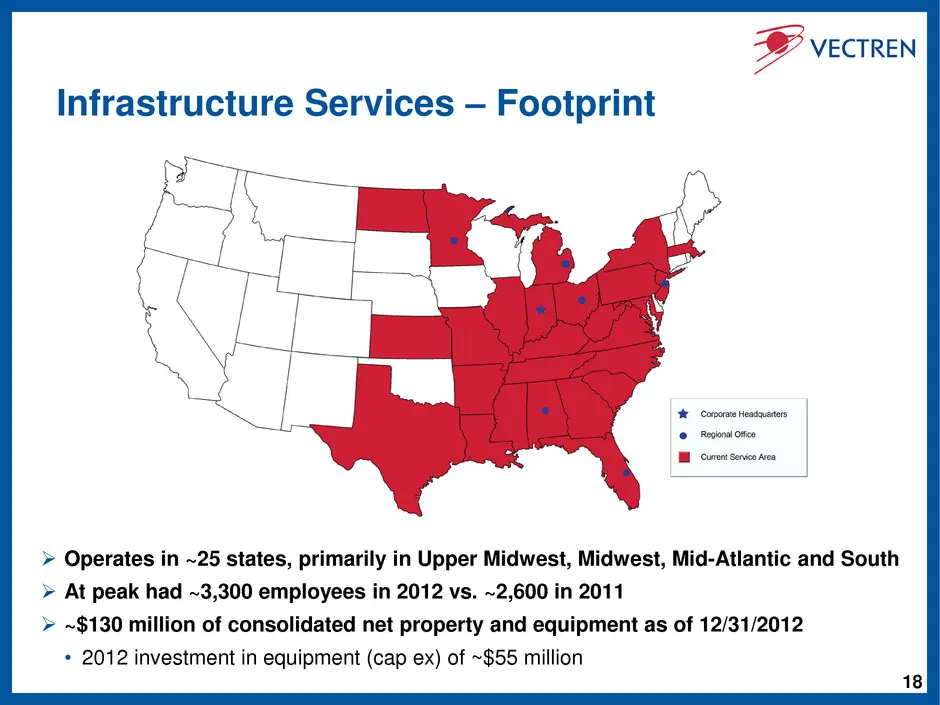
18 Infrastructure Services – Footprint Operates in ~25 states, primarily in Upper Midwest, Midwest, Mid-Atlantic and South At peak had ~3,300 employees in 2012 vs. ~2,600 in 2011 ~$130 million of consolidated net property and equipment as of 12/31/2012 • 2012 investment in equipment (cap ex) o
Slide 19: Infrastructure Services – Partial List of Customers
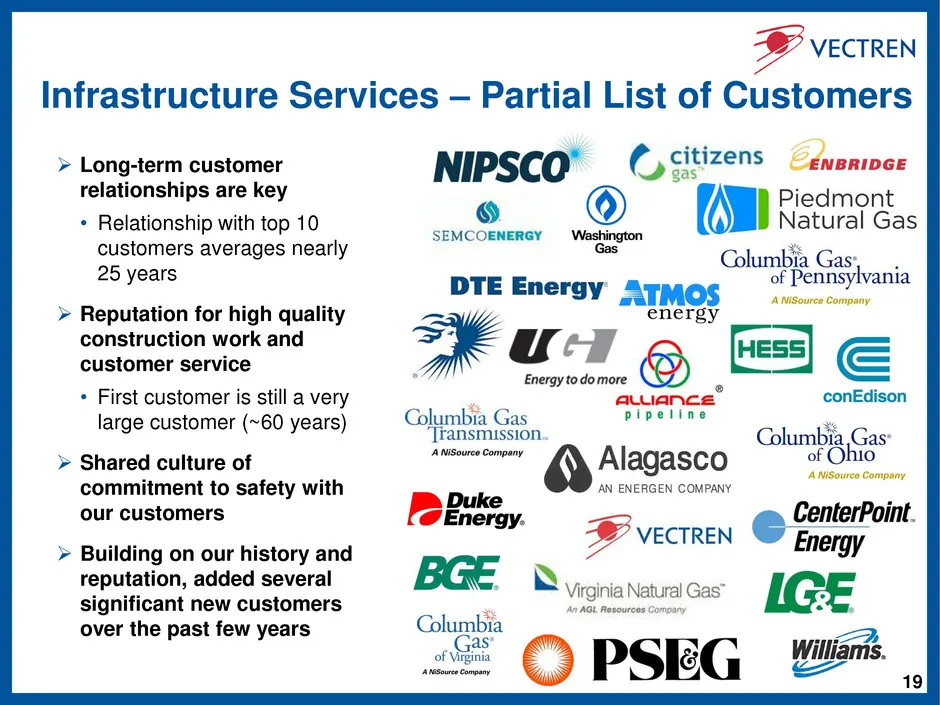
19 Infrastructure Services – Partial List of Customers Long-term customer relationships are key • Relationship with top 10 customers averages nearly 25 years Reputation for high quality construction work and customer service • First customer is still a very large customer (~60 years) Shared cu
Slide 20: Energy Services – Energy Systems Group (ESG)
20 Energy Services – Energy Systems Group (ESG) Projected breakeven results in 2013 • Flat revenues expected as uncertain economy continues to slow customer decision-making • Expecting fewer benefits from energy efficiency projects’ tax deductions in 2013 • Earnings for Energy Services will be lim
Slide 21: Coal Mining – Vectren Fuels
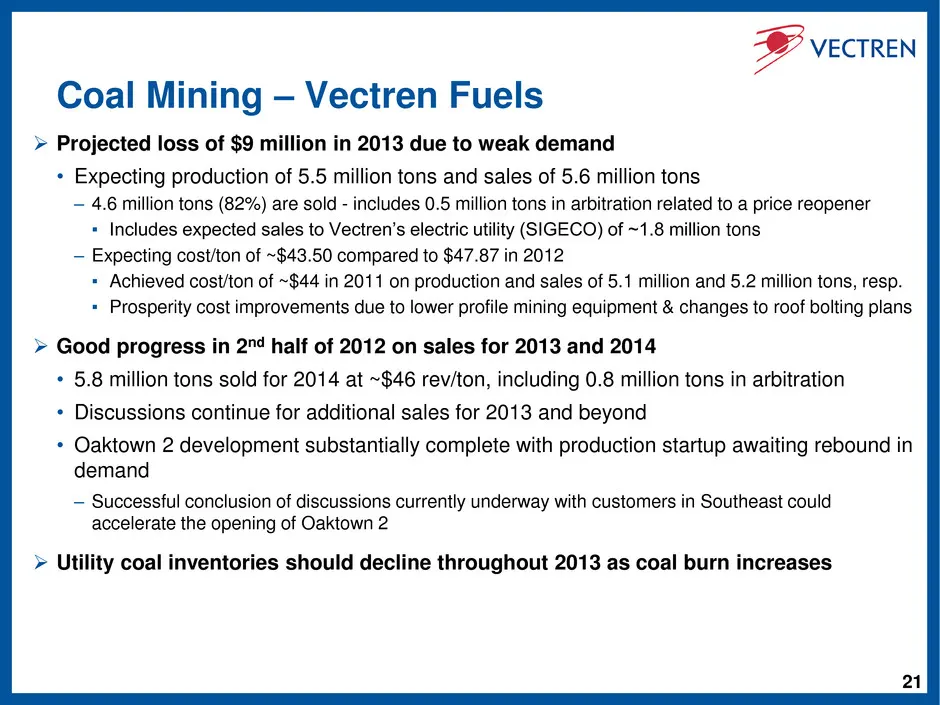
21 Coal Mining – Vectren Fuels Projected loss of $9 million in 2013 due to weak demand • Expecting production of 5.5 million tons and sales of 5.6 million tons – 4.6 million tons (82%) are sold - includes 0.5 million tons in arbitration related to a price reopener ▪ Includes expected sales to Vect
Slide 22: Coal Mining – Outlook for Illinois Basin Coal
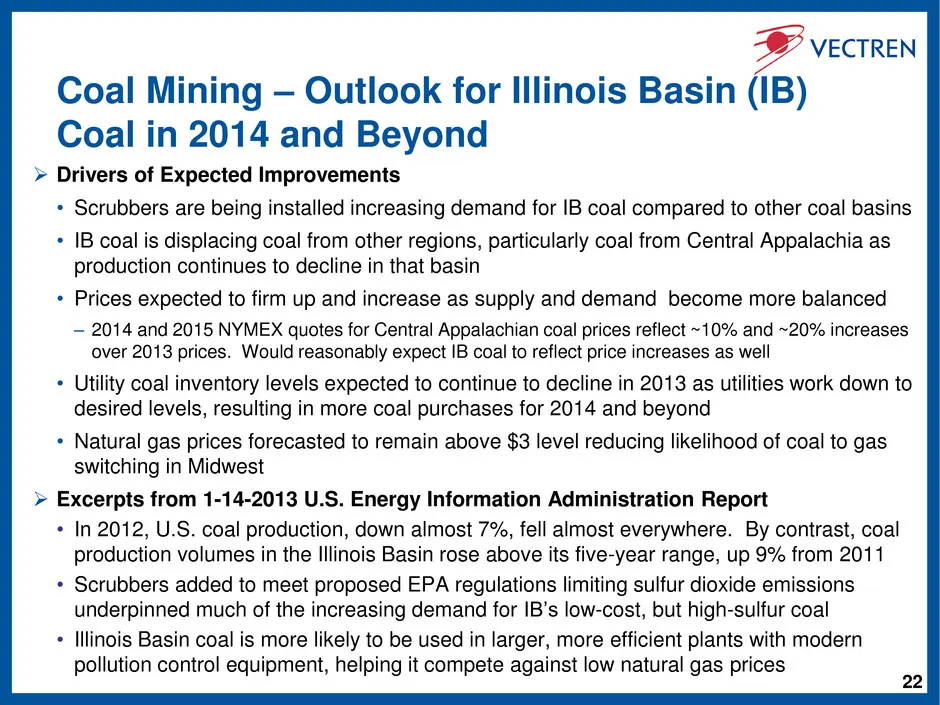
22 Coal Mining – Outlook for Illinois Basin (IB) Coal in 2014 and Beyond Drivers of Expected Improvements • Scrubbers are being installed increasing demand for IB coal compared to other coal basins • IB coal is displacing coal from other regions, particularly coal from Central Appalachia as produc
Slide 23: Energy Marketing - ProLiance
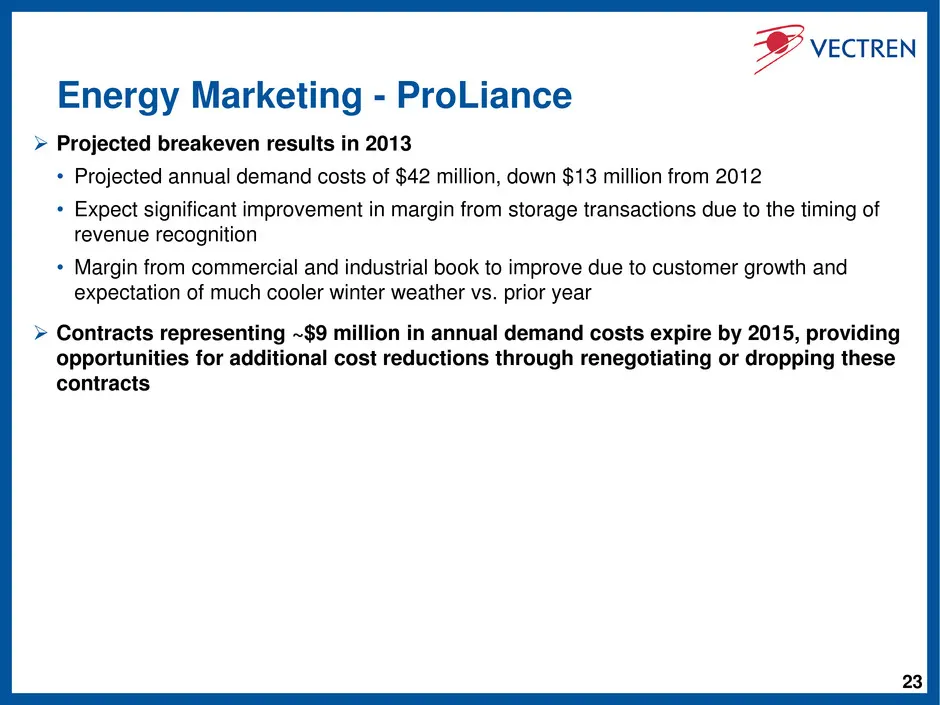
23 Energy Marketing - ProLiance Projected breakeven results in 2013 • Projected annual demand costs of $42 million, down $13 million from 2012 • Expect significant improvement in margin from storage transactions due to the timing of revenue recognition • Margin from commercial and industrial book
Slide 24: Vectren: Strength, Stability, Utility
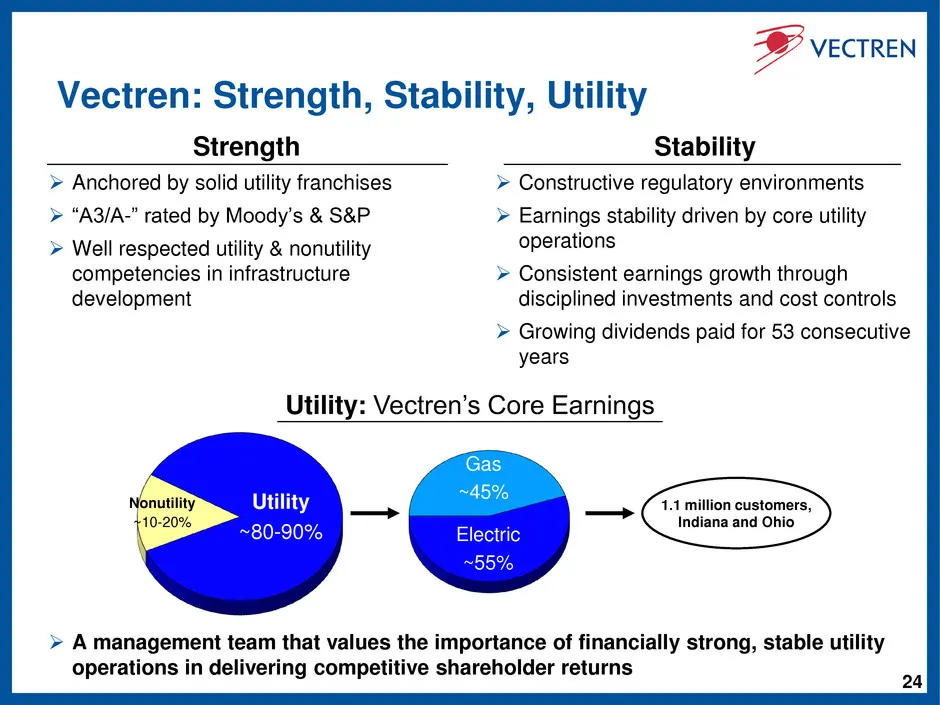
24 Vectren: Strength, Stability, Utility Stability Constructive regulatory environments Earnings stability driven by core utility operations Consistent earnings growth through disciplined investments and cost controls Growing dividends paid for 53 consecutive years Strength Anchored by sol
Slide 25: Appendix
tA VECTREN Appendix
Slide 26: Consolidated 2012 Results
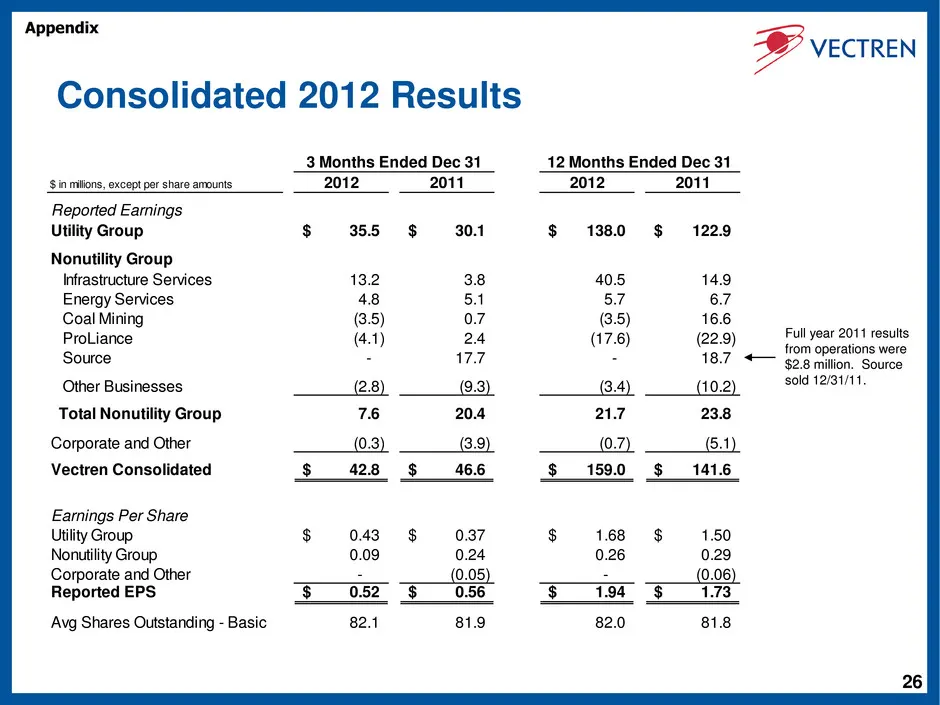
26 Consolidated 2012 Results $ in millions, except per share amounts 2012 2011 2012 2011 Reported Earnings Utility Group 35.5$ 30.1$ 138.0$ 122.9$ Nonutility Group Infrastructure Services 13.2 3.8 40.5 14.9 Energy Services 4.8 5.1 5.7 6.7 Coal Mining (3.5) 0.7 (3.5) 16.6 ProLiance (4.1) 2.4 (17.6) (
Slide 27: Environmental Generation Portfolio - Profile
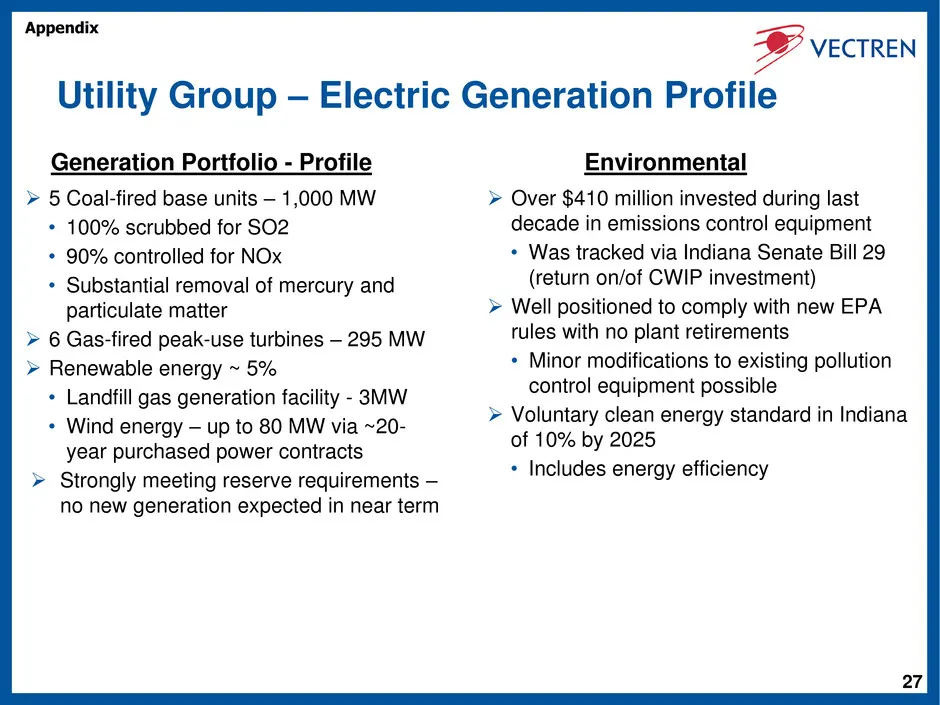
27 Environmental Generation Portfolio - Profile Utility Group – Electric Generation Profile Over $410 million invested during last decade in emissions control equipment • Was tracked via Indiana Senate Bill 29 (return on/of CWIP investment) Well positioned to comply with new EPA rules with no pl
Slide 28: Utility Group – Seasonally Adjusted Unemployment Rates
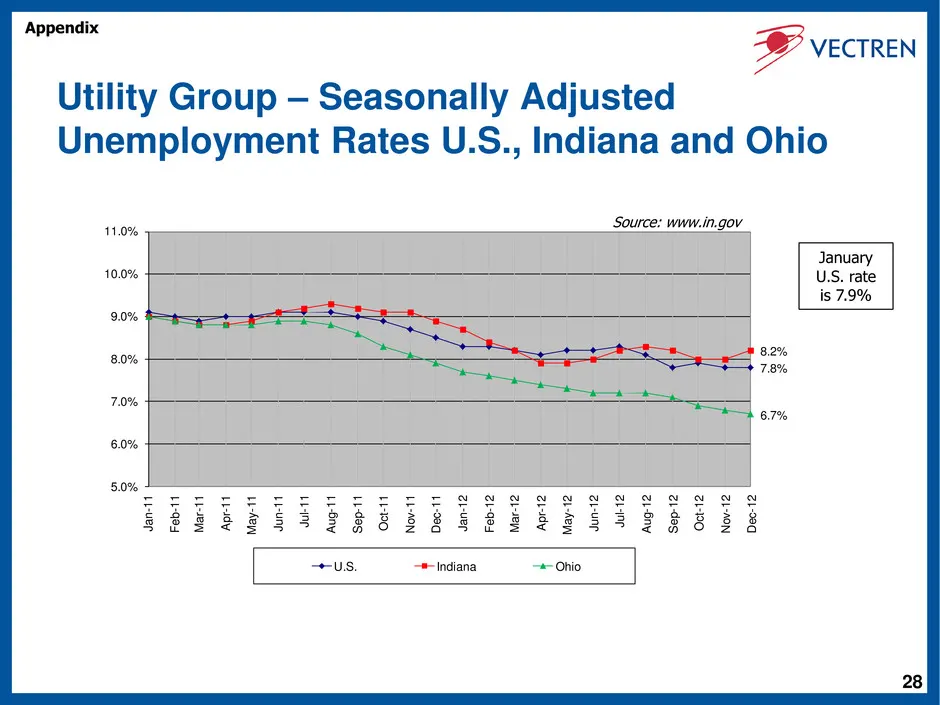
28 Utility Group – Seasonally Adjusted Unemployment Rates U.S., Indiana and Ohio 7.8% 8.2% 6.7% 5.0% 6.0% 7.0% 8.0% 9.0% 10.0% 11.0% Ja n-1 1 Fe b-1 1 Ma r-1 1 Ap r-1 1 Ma y-1 1 Ju n-1 1 Ju l-1 1 Au g-1 1 Se p-1 1 Oc t-1 1 No v-1 1 De c-1 1 Ja n-1 2 Fe b-1 2 Ma r-1 2 Ap r-1 2 Ma y-1 2 Ju n-1 2 Ju l-
Slide 29: Infrastructure Services – Miller Pipeline & Minnesota Limited
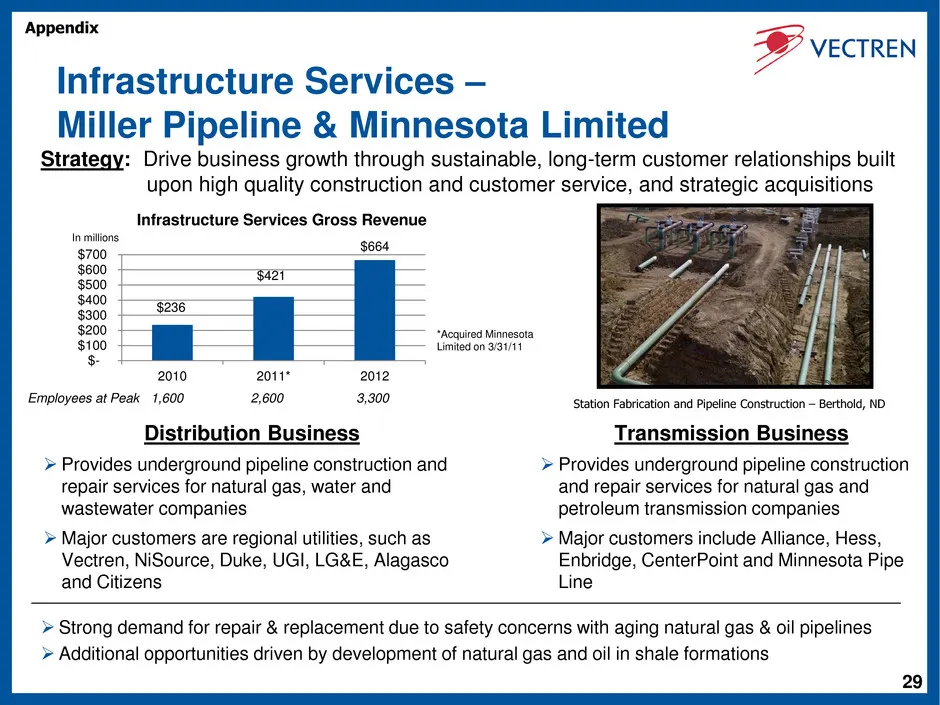
29 Infrastructure Services – Miller Pipeline & Minnesota Limited Distribution Business Provides underground pipeline construction and repair services for natural gas, water and wastewater companies Major customers are regional utilities, such as Vectren, NiSource, Duke, UGI, LG&E, Alagasco and Ci
Slide 30: Nonutility Metrics – Infrastructure Services
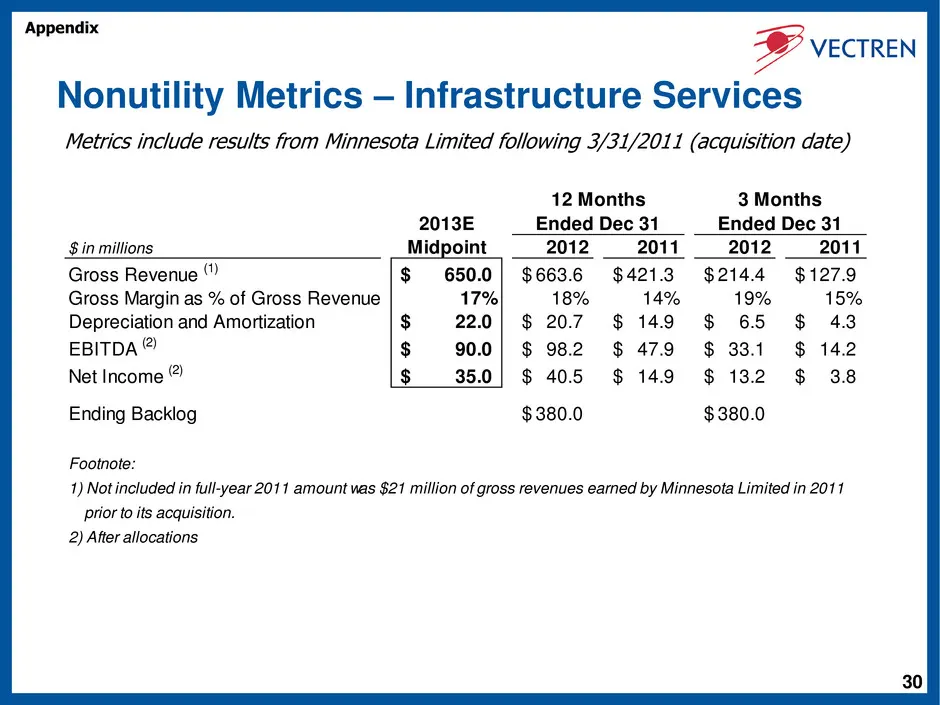
30 Nonutility Metrics – Infrastructure Services 2013E $ in millions Midpoint 2012 2011 2012 2011 Gross Revenue (1) 650.0$ 663.6$ 421.3$ 214.4$ 127.9$ Gross Margin as % of Gross Revenue 17% 18% 14% 19% 15% Depreciation and Amortization 22.0$ 20.7$ 14.9$ 6.5$ 4.3$ EBITDA (2) 90.0$ 98.2$ 47.9$ 33.1$ 14
Slide 31: Energy Services - Energy Systems Group (ESG)
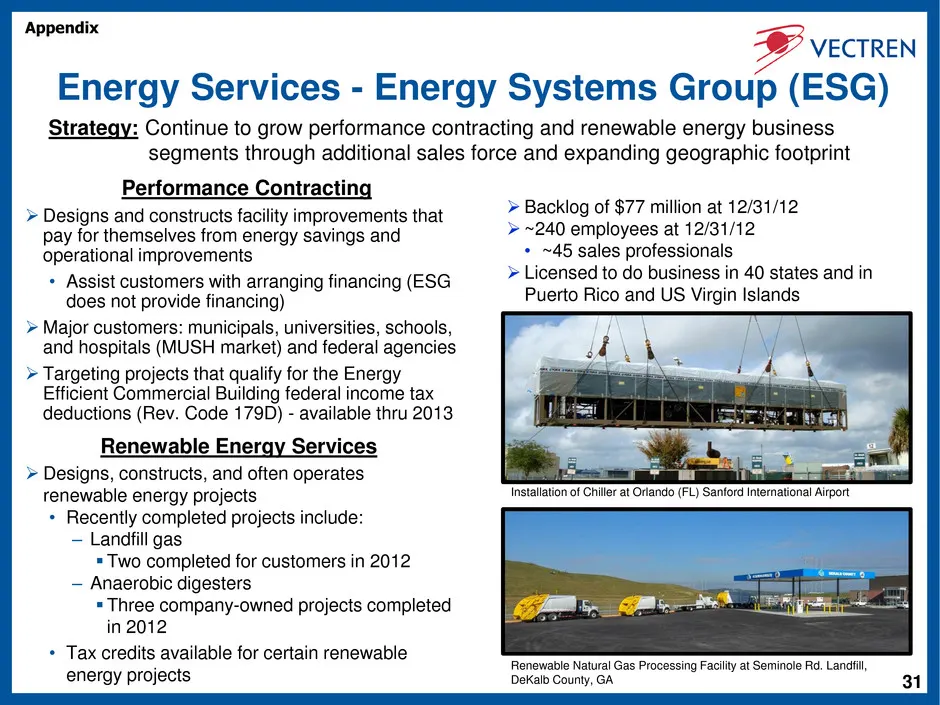
31 Energy Services - Energy Systems Group (ESG) Performance Contracting Designs and constructs facility improvements that pay for themselves from energy savings and operational improvements • Assist customers with arranging financing (ESG does not provide financing) Major customers: municipals, un
Slide 32: Nonutility Metrics – Energy Services
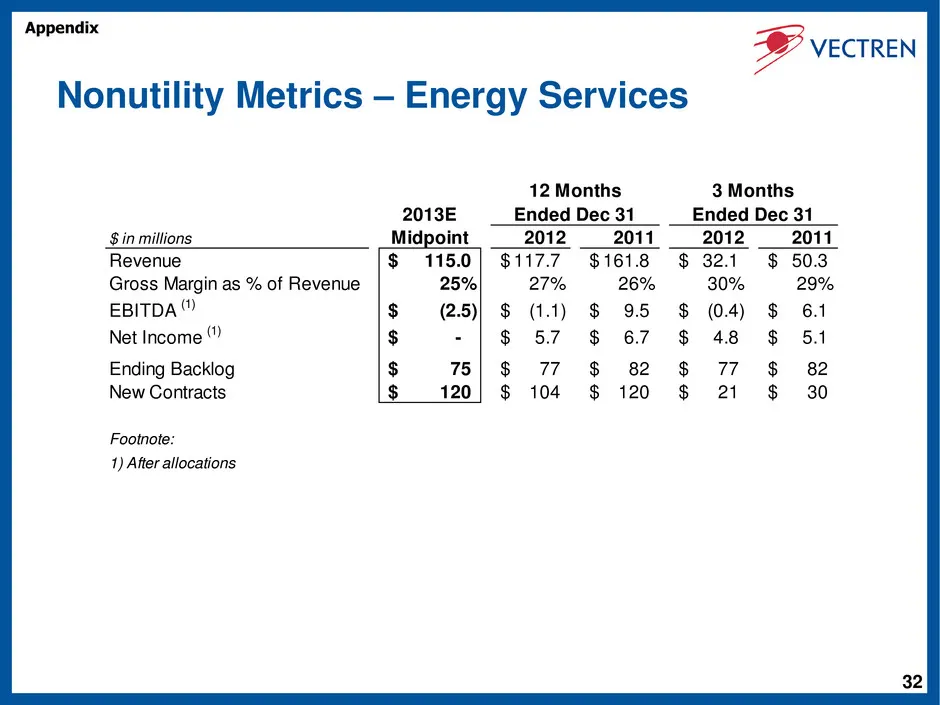
32 Nonutility Metrics – Energy Services 2013E $ in millions Midpoint 2012 2011 2012 2011 Revenue 115.0$ 117.7$ 161.8$ 32.1$ 50.3$ Gross Margin as % of Revenue 25% 27% 26% 30% 29% EBITDA (1) (2.5)$ (1.1)$ 9.5$ (0.4)$ 6.1$ Net Income (1) -$ 5.7$ 6.7$ 4.8$ 5.1$ Ending Backlog 75$ 77$ 82$ 77$ 82$ New Co
Slide 33: Coal Mining – Vectren Fuels
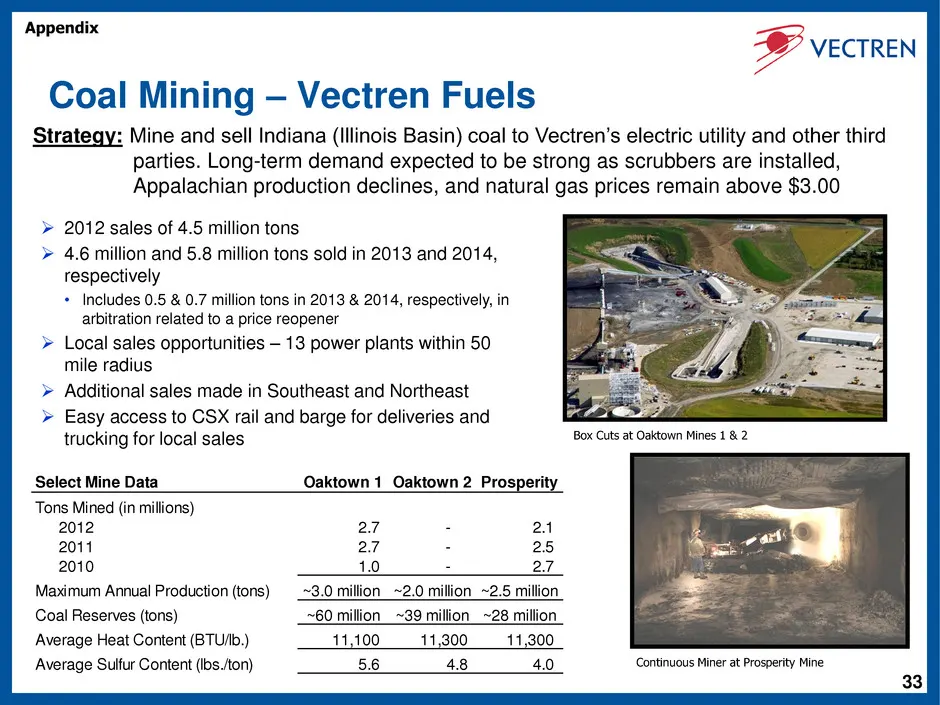
33 Coal Mining – Vectren Fuels 2012 sales of 4.5 million tons 4.6 million and 5.8 million tons sold in 2013 and 2014, respectively • Includes 0.5 & 0.7 million tons in 2013 & 2014, respectively, in arbitration related to a price reopener Local sales opportunities – 13 power plants within 50 mi
Slide 34: Nonutility Metrics – Coal Mining
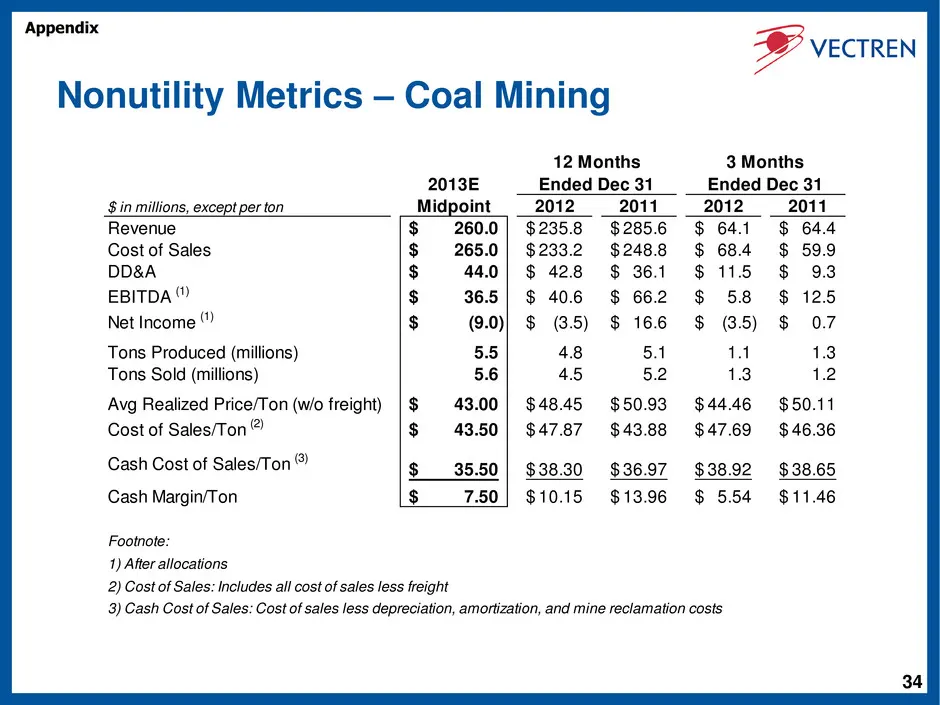
34 Nonutility Metrics – Coal Mining 2013E $ in millions, except per ton Midpoint 2012 2011 2012 2011 Revenue 260.0$ 235.8$ 285.6$ 64.1$ 64.4$ Cost of Sales 265.0$ 233.2$ 248.8$ 68.4$ 59.9$ DD&A 44.0$ 42.8$ 36.1$ 11.5$ 9.3$ EBITDA (1) 36.5$ 40.6$ 66.2$ 5.8$ 12.5$ Net Income (1) (9.0)$ (3.5)$ 16.6$ (3
Slide 35: Energy Marketing – ProLiance
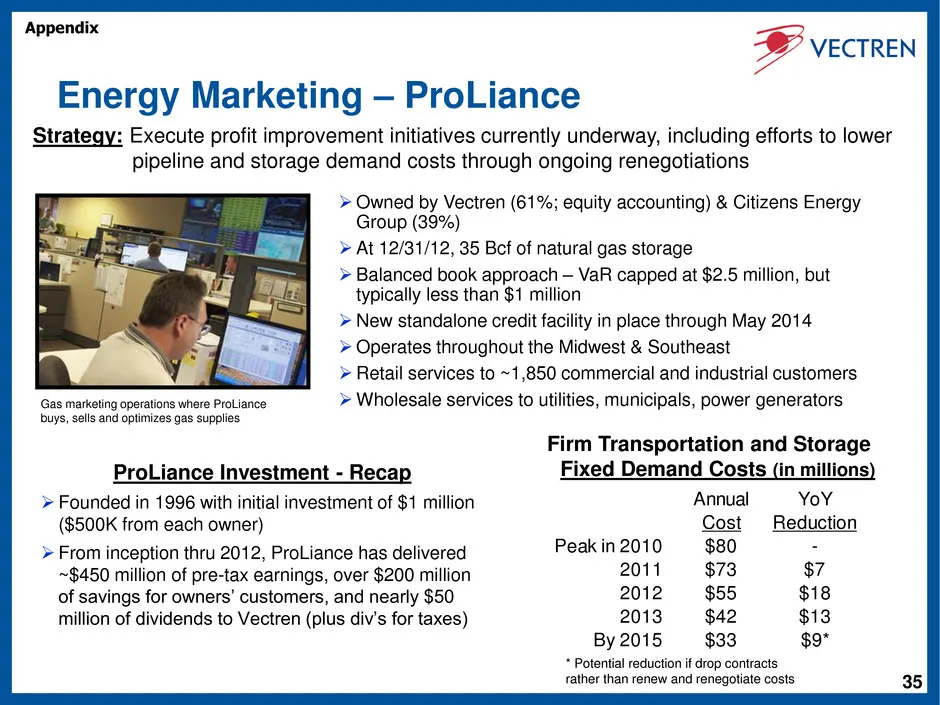
35 Energy Marketing – ProLiance ProLiance Investment - Recap Founded in 1996 with initial investment of $1 million ($500K from each owner) From inception thru 2012, ProLiance has delivered ~$450 million of pre-tax earnings, over $200 million of savings for owners’ customers, and nearly $50 million
Slide 36: Nonutility Metrics – ProLiance
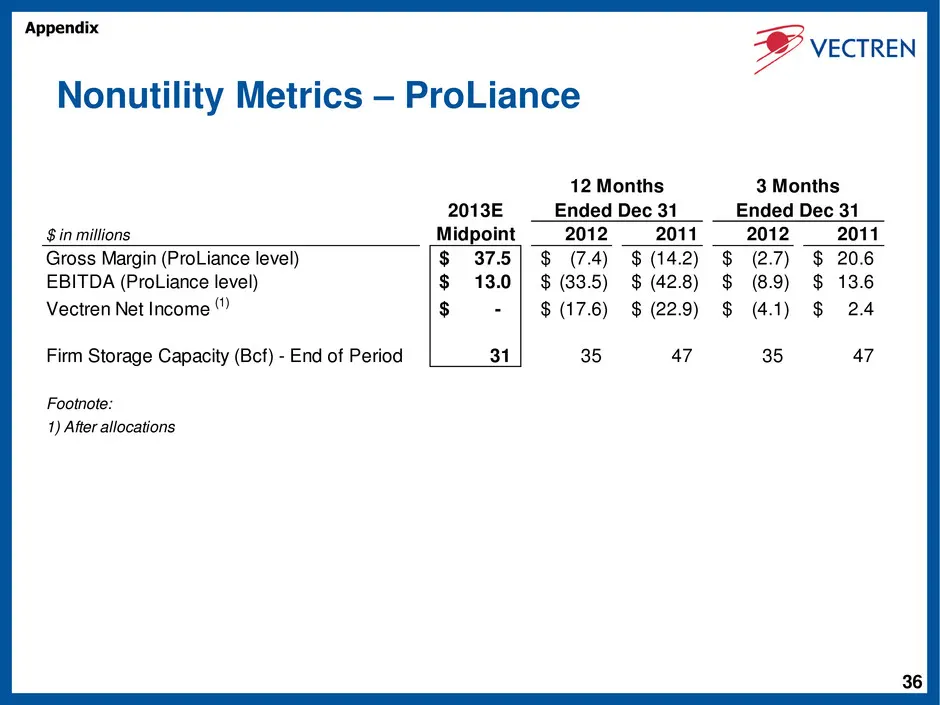
36 Nonutility Metrics – ProLiance 2013E $ in millions Midpoint 2012 2011 2012 2011 Gross Margin (ProLiance level) 37.5$ (7.4)$ (14.2)$ (2.7)$ 20.6$ EBITDA (ProLiance level) 13.0$ (33.5)$ (42.8)$ (8.9)$ 13.6$ Vectren Net Income (1) -$ (17.6)$ (22.9)$ (4.1)$ 2.4$ Firm Storage Capacity (Bcf) - End of P
Slide 37: Use of Non-GAAP Performance Measures and Per Share Measures
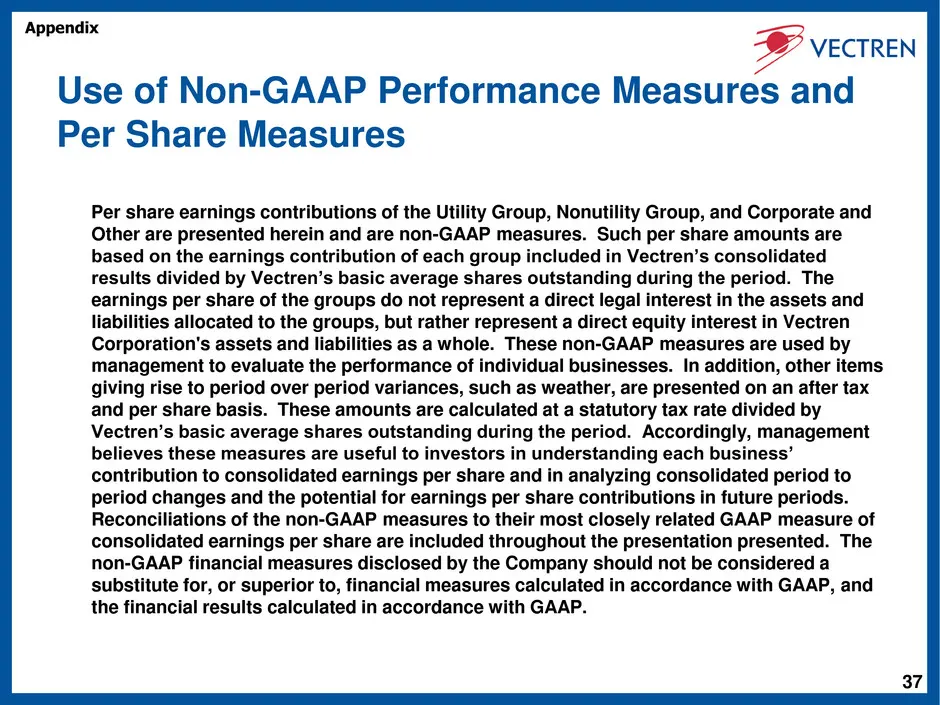
37 Use of Non-GAAP Performance Measures and Per Share Measures Per share earnings contributions of the Utility Group, Nonutility Group, and Corporate and Other are presented herein and are non-GAAP measures. Such per share amounts are based on the earnings contribution of each group included in Vect
Source: SEC EDGAR · 8-K filed Feb 26, 2013
More decks from Vectren Corporation
 Edison Electric Institute Financial Conference 201833 slides · Nov 9, 2018
 Q2 2018 Earnings Presentation31 slides · Aug 3, 2018
 Merger or Acquisition (June 2018)18 slides · Jun 12, 2018
 American Gas Association Financial Forum 201855 slides · May 18, 2018
 Q1 2018 Earnings Presentation27 slides · May 4, 2018
 FY2017 Earnings Presentation43 slides · Feb 27, 2018