Vectren — Edison Electric Institute Financial Conference 2018
33 slides from Vectren's conference presentation, Nov 9, 2018
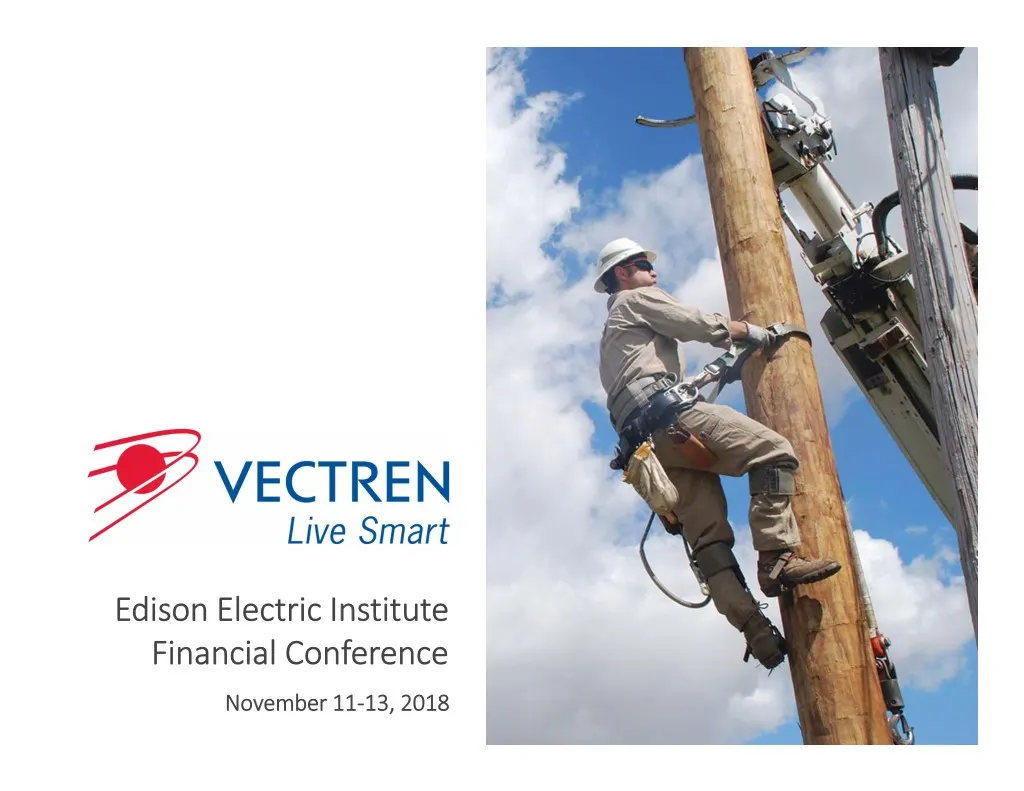
Slide 1: Edison Electric Institute Financial Conference November 11-13, 2018
Edison Electric Institute Financial Conference November 11‐13, 2018
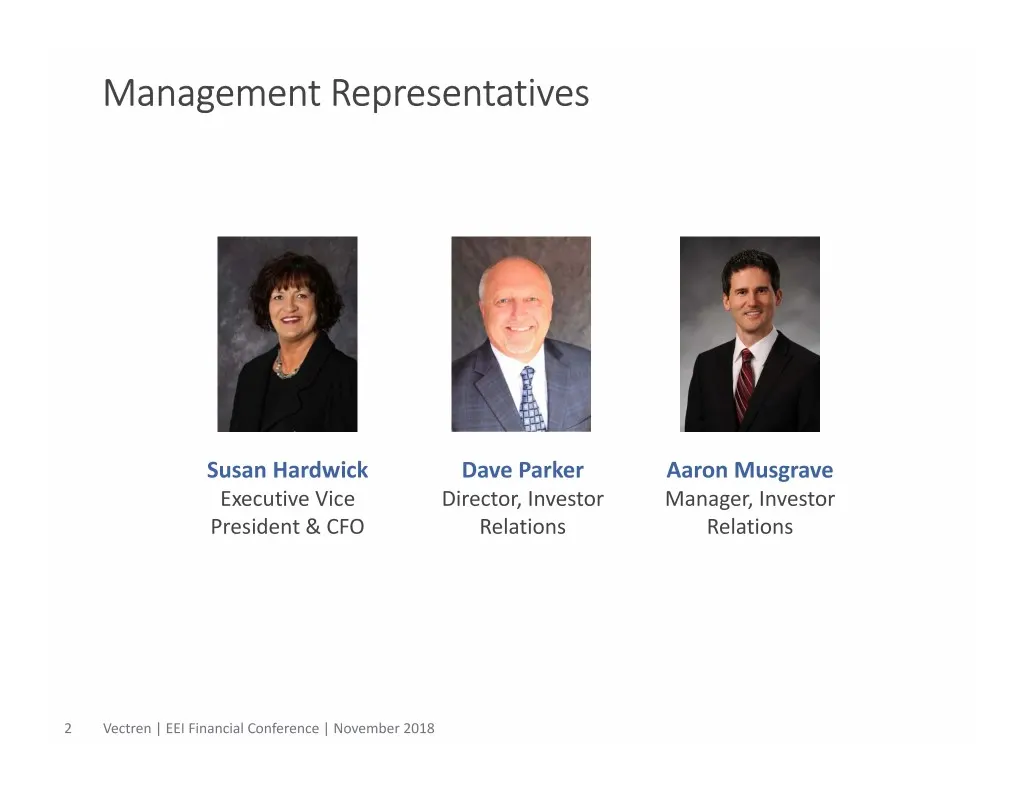
Slide 2: Management Representatives
Management Representatives Susan Hardwick Dave Parker Aaron Musgrave Executive Vice Director, Investor Manager, Investor President & CFO Relations Relations 2 Vectren | EEI Financial Conference | November 2018
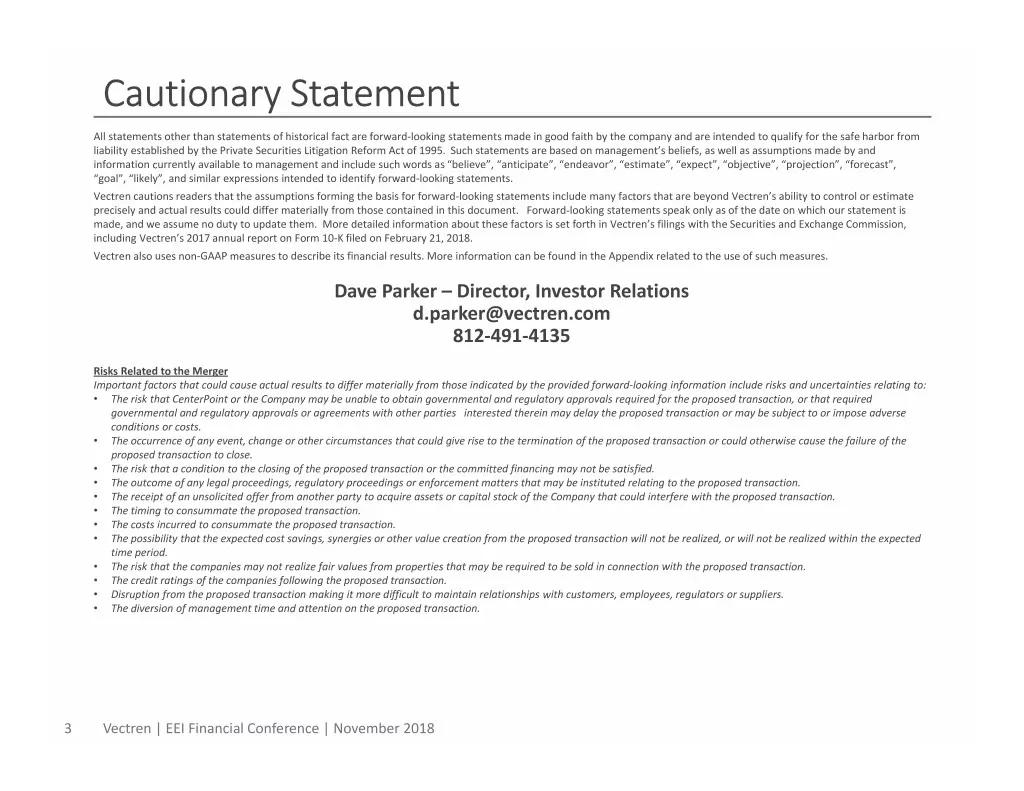
Slide 3: Cautionary Statement
Cautionary Statement All statements other than statements of historical fact are forward‐looking statements made in good faith by the company and are intended to qualify for the safe harbor from liability established by the Private Securities Litigation Reform Act of 1995. Such statements are based
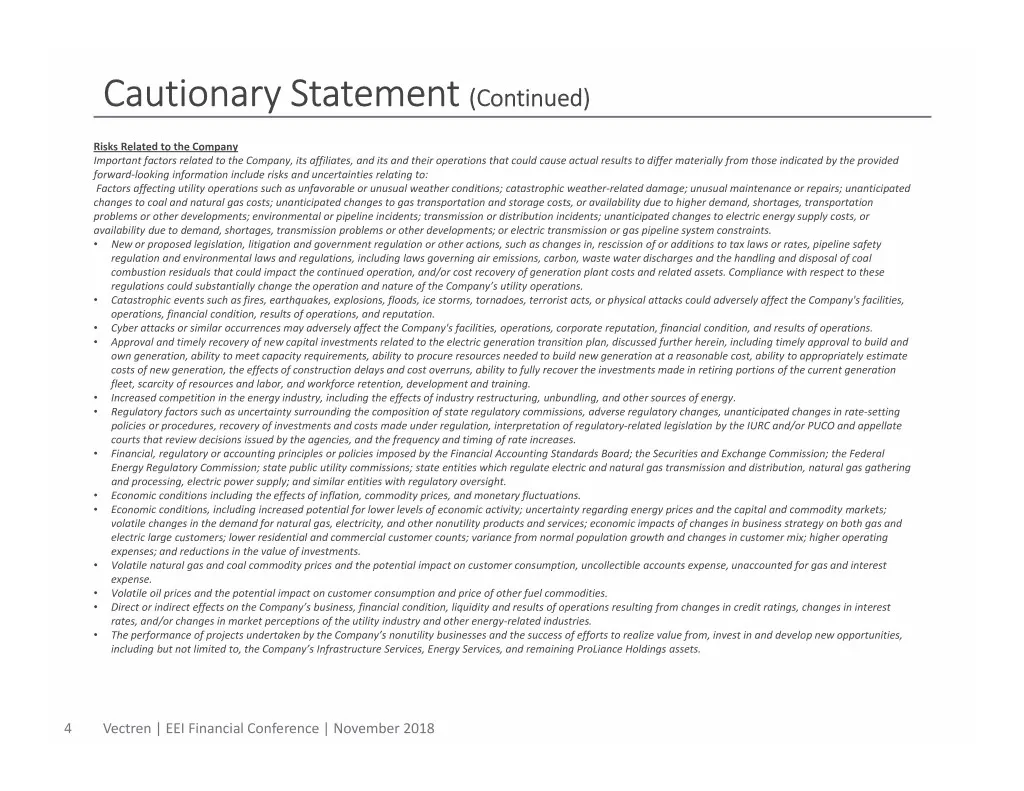
Slide 4: Cautionary Statement (Continued) Risks Related to the Company
Cautionary Statement (Continued) Risks Related to the Company Important factors related to the Company, its affiliates, and its and their operations that could cause actual results to differ materially from those indicated by the provided forward‐looking information include risks and uncertainties r
Slide 5: Cautionary Statement (Continued) Risks Related to the Company (continued)
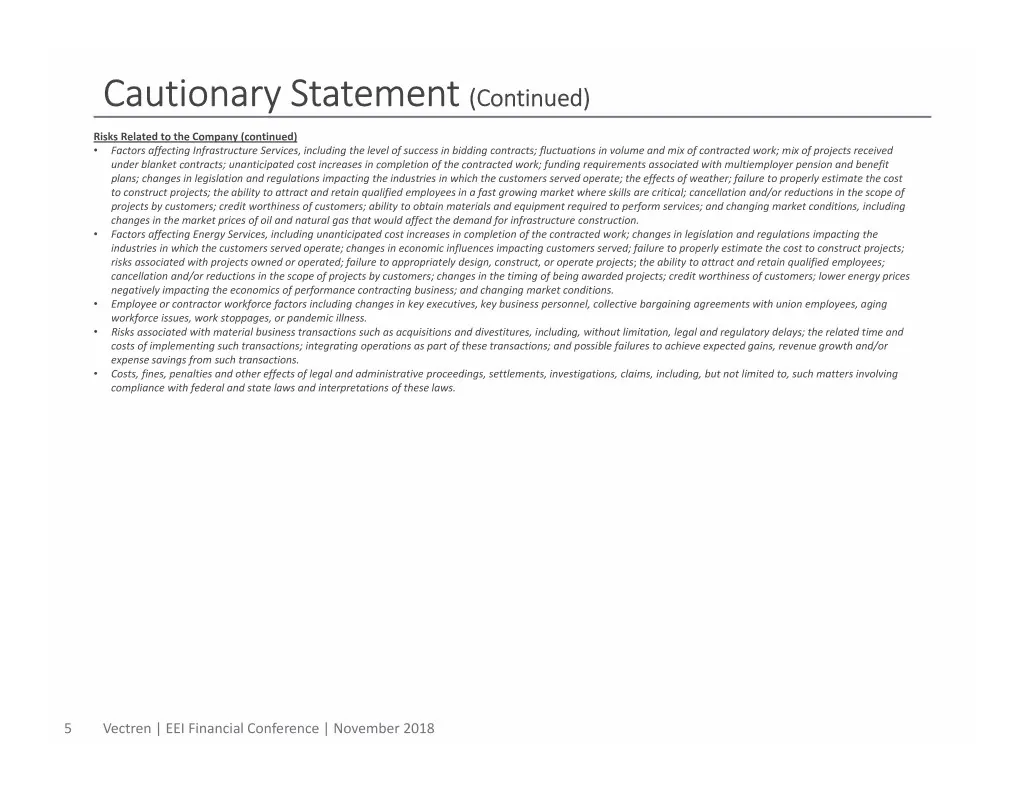
Cautionary Statement (Continued) Risks Related to the Company (continued) • Factors affecting Infrastructure Services, including the level of success in bidding contracts; fluctuations in volume and mix of contracted work; mix of projects received under blanket contracts; unanticipated cost increase
Slide 6: Q3 2018 Update
Q3 2018 Update 6 Vectren | EEI Financial Conference | November 2018
Slide 7: Consolidated Q3 and YTD 2018 Results
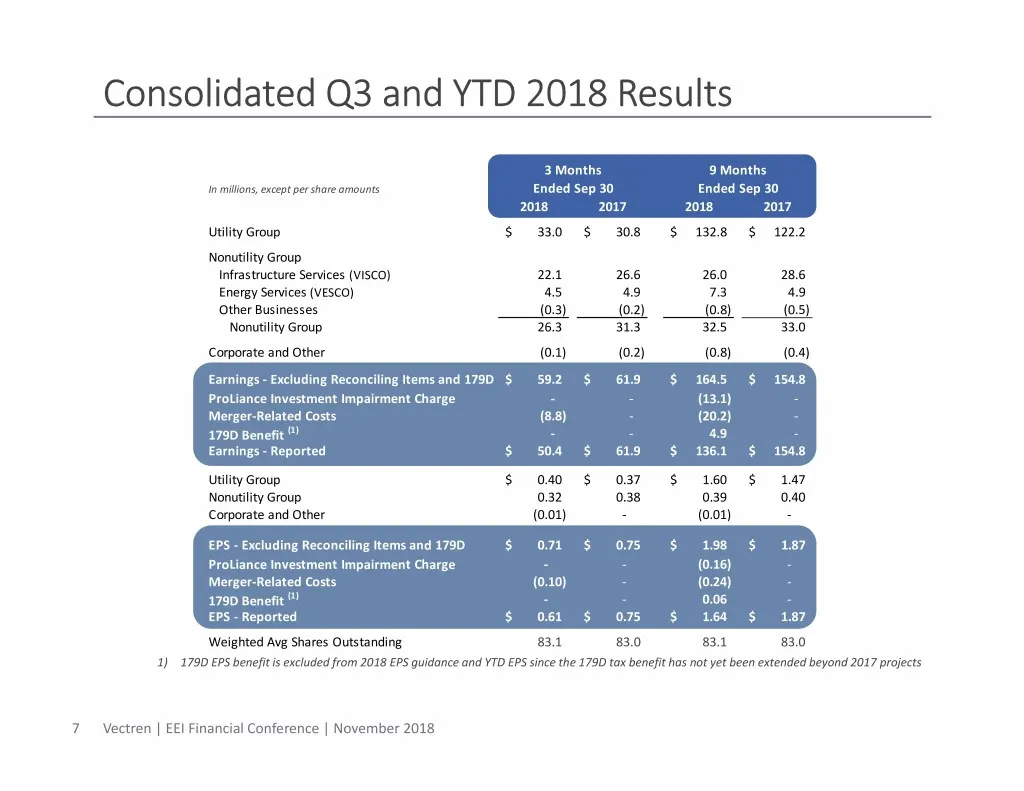
Consolidated Q3 and YTD 2018 Results 3 Months 9 Months In millions, except per share amounts Ended Sep 30 Ended Sep 30 2018 2017 2018 2017 Utility Group$ 33.0 $ 30.8 $ 132.8 $ 122.2 Nonutility Group Infrastructure Services (VISCO) 22.1 26.6 26.0 28.6 Energy Services (VESCO) 4.5 4.9 7.3 4.9 Other Bus
Slide 8: 2018 Q3 & YTD Results and Highlights
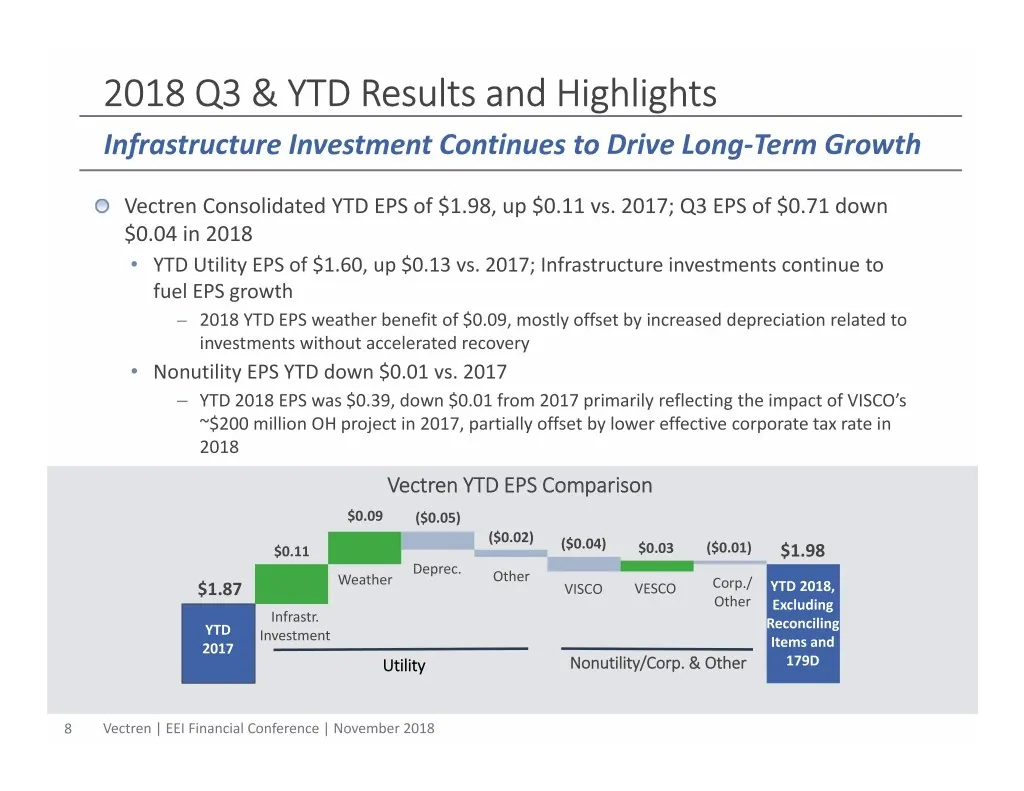
2018 Q3 & YTD Results and Highlights Infrastructure Investment Continues to Drive Long‐Term Growth Vectren Consolidated YTD EPS of $1.98, up $0.11 vs. 2017; Q3 EPS of $0.71 down $0.04 in 2018 • YTD Utility EPS of $1.60, up $0.13 vs. 2017; Infrastructure investments continue to fuel EPS growth – 2018
Slide 9: 2018 Q3 and YTD Nonutility Results
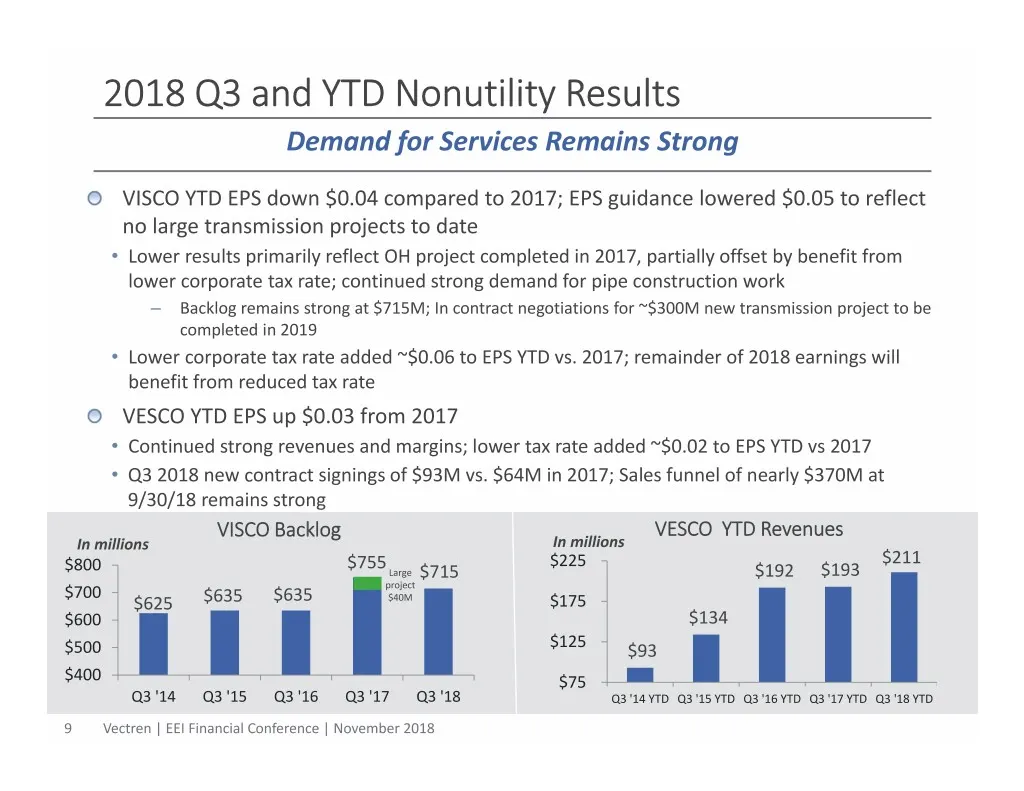
2018 Q3 and YTD Nonutility Results Demand for Services Remains Strong VISCO YTD EPS down $0.04 compared to 2017; EPS guidance lowered $0.05 to reflect no large transmission projects to date • Lower results primarily reflect OH project completed in 2017, partially offset by benefit from lower corpora
Slide 10: Executing Our Plan: 2018 EPS Guidance Affirmed
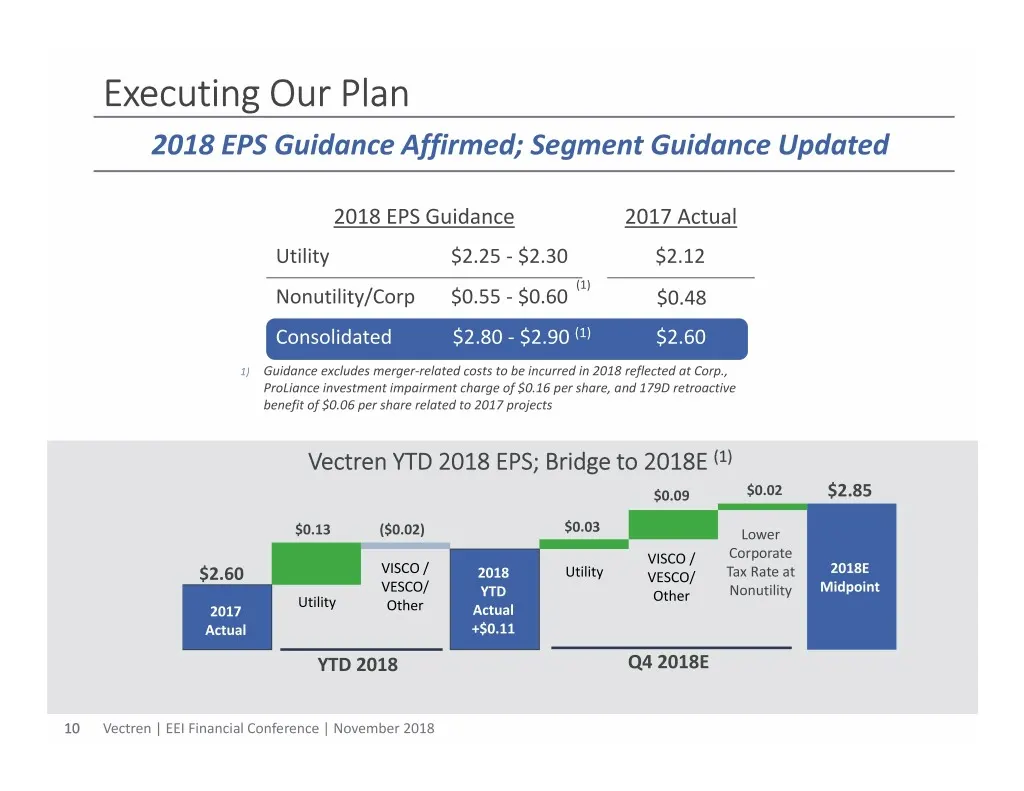
Executing Our Plan 2018 EPS Guidance Affirmed; Segment Guidance Updated 2018 EPS Guidance 2017 Actual Utility $2.25 ‐ $2.30 $2.12 (1) Nonutility/Corp $0.55 ‐ $0.60 $0.48 Consolidated $2.80 ‐ $2.90 (1) $2.60 1) Guidance excludes merger‐related costs to be incurred in 2018 reflected at Corp., ProLianc
Slide 11: Dividend Increased 6.7% in November 2018
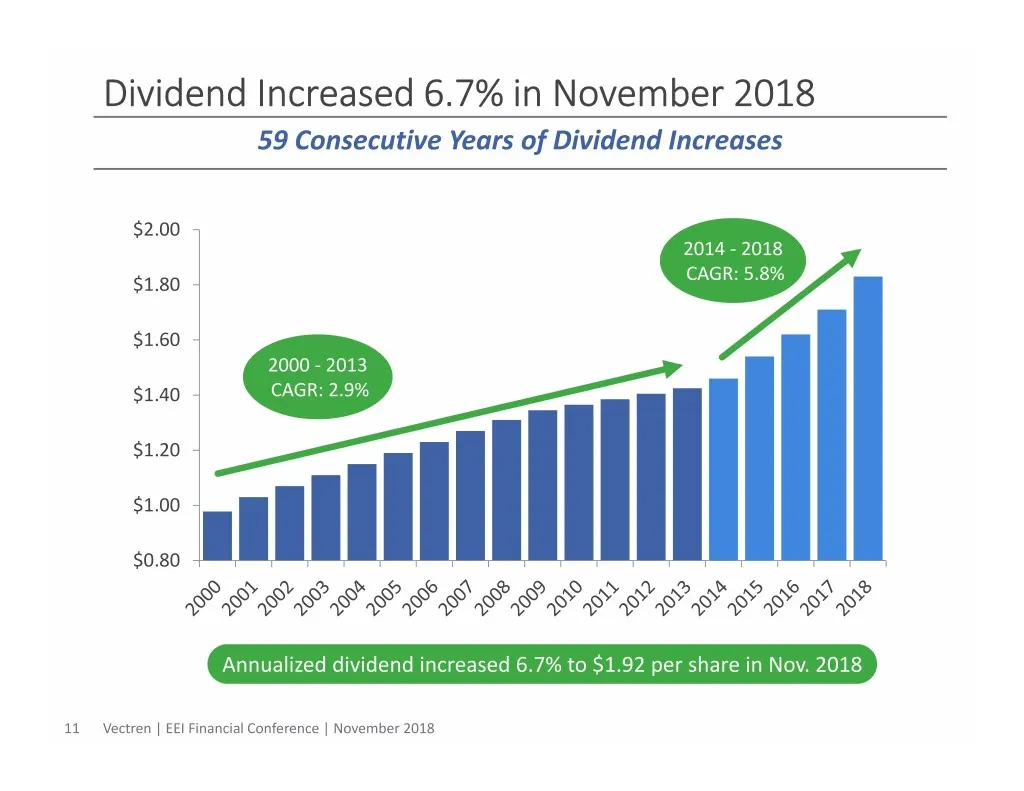
Dividend Increased 6.7% in November 2018 59 Consecutive Years of Dividend Increases $2.00 2014 ‐ 2018 CAGR: 5.8% $1.80 $1.60 2000 ‐ 2013 $1.40 CAGR: 2.9% $1.20 $1.00 $0.80 Annualized dividend increased 6.7% to $1.92 per share in Nov. 2018 11 Vectren | EEI Financial Conference | November 2018
Slide 12: Merger Update
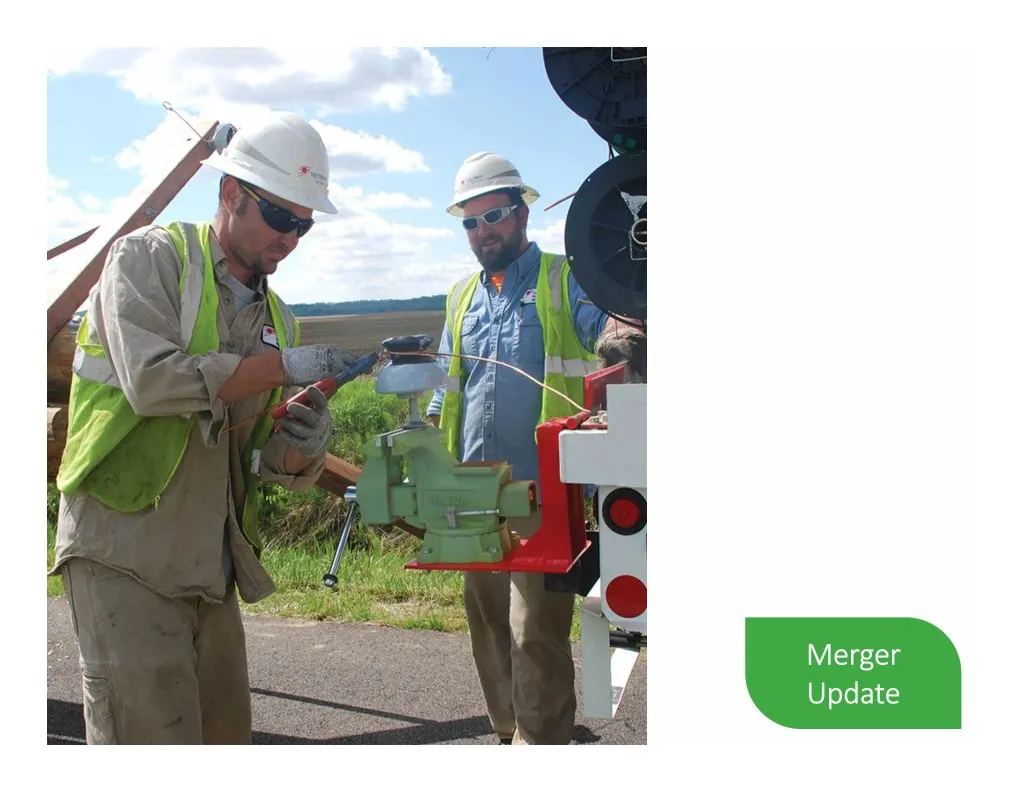
Merger Update
Slide 13: Vectren and CenterPoint Merger Combined Operations
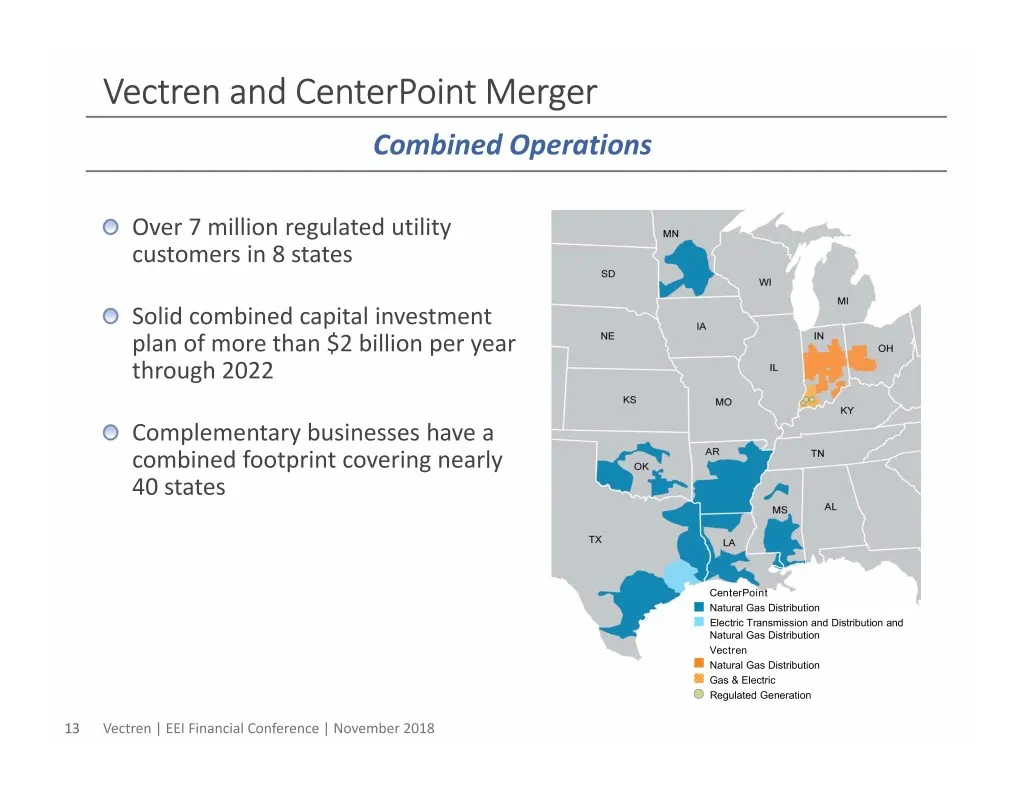
Vectren and CenterPoint Merger Combined Operations Over 7 million regulated utility customers in 8 states Solid combined capital investment plan of more than $2 billion per year through 2022 Complementary businesses have a combined footprint covering nearly 40 states CenterPoint Natural Gas Distribu
Slide 14: Vectren, CenterPoint Merger Update
Vectren, CenterPoint Merger Update Subject to closure of Indiana and Ohio informational dockets, continue to anticipate merger closing will occur no later than Q1 of 2019 Informational filings were made in mid June in both IN and OH; State change of control filings are not required Indiana heari
Slide 15: Utility Operations
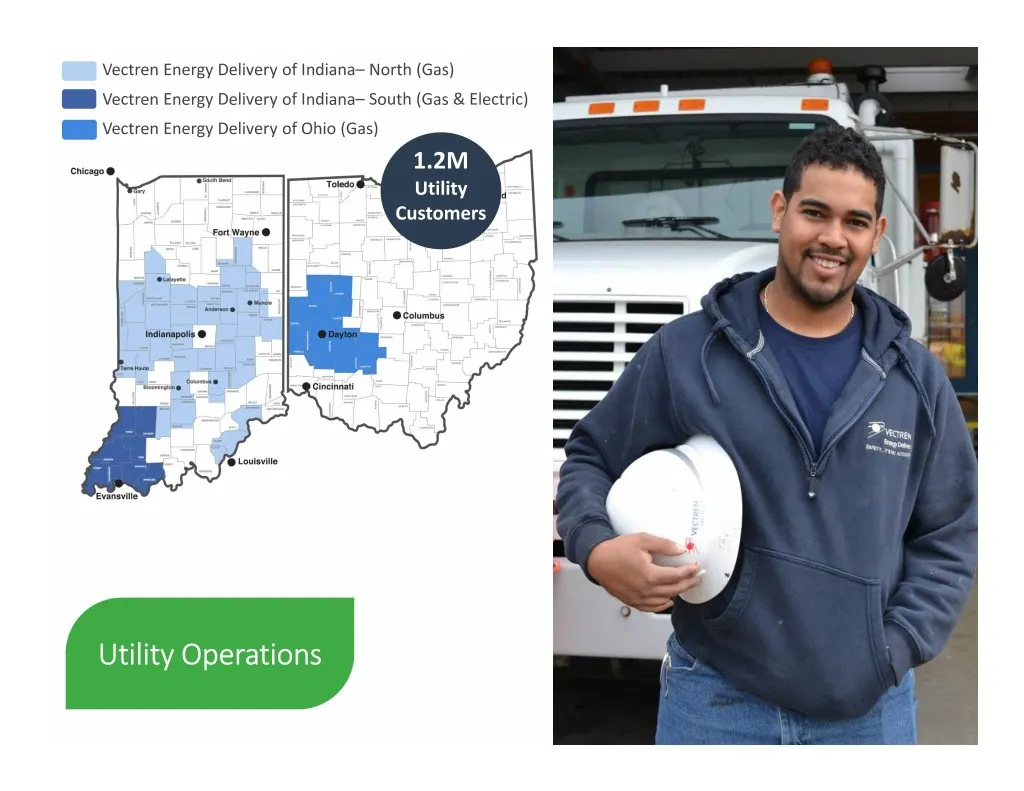
Vectren Energy Delivery of Indiana– North (Gas) Vectren Energy Delivery of Indiana– South (Gas & Electric) Vectren Energy Delivery of Ohio (Gas) 1.2M Utility Customers Utility Operations
Slide 16: Key Regulatory Initiatives Achieved
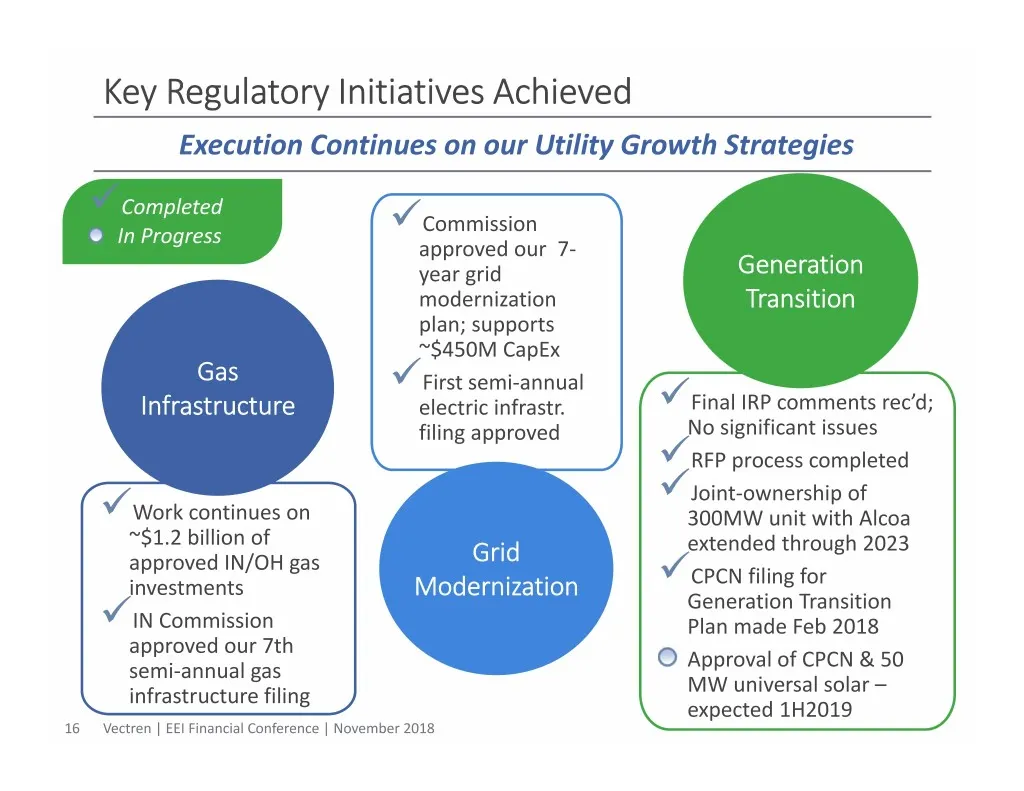
Key Regulatory Initiatives Achieved Execution Continues on our Utility Growth Strategies Completed Commission In Progress approved our 7‐ year grid Generation modernization Transition plan; supports ~$450M CapEx Gas First semi‐annual Infrastructure electric infrastr. Final IRP comments rec’d; f
Slide 17: Significant Utility CapEx Drives Earnings
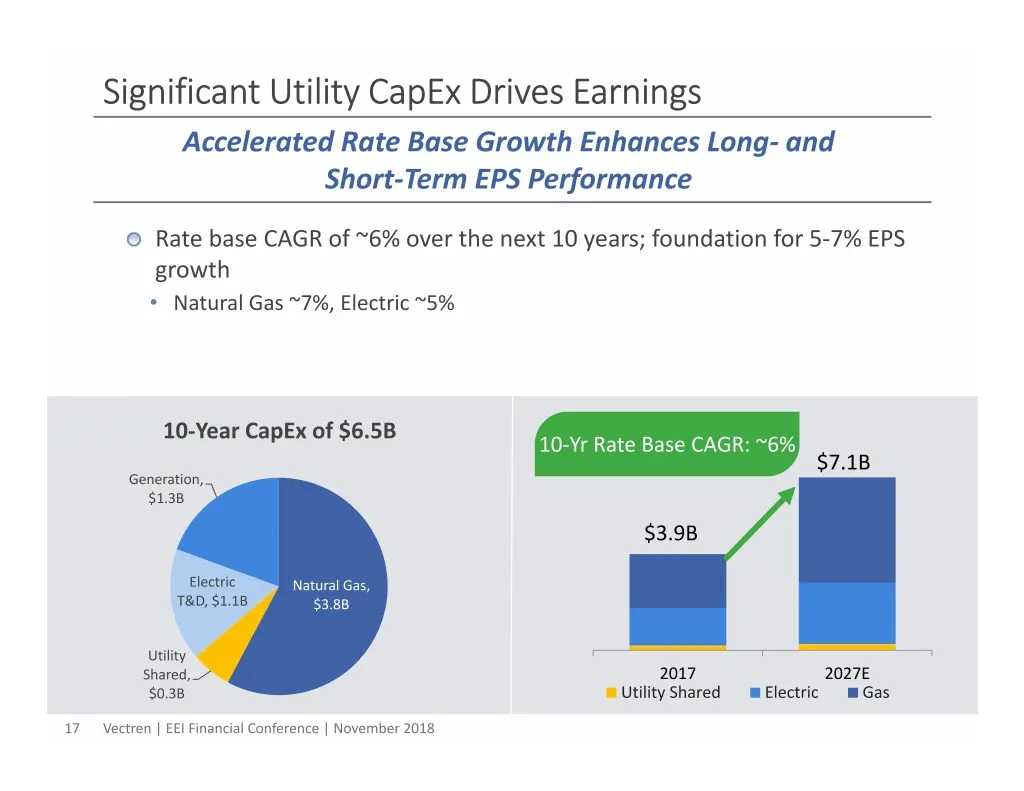
Significant Utility CapEx Drives Earnings Accelerated Rate Base Growth Enhances Long‐ and Short‐Term EPS Performance Rate base CAGR of ~6% over the next 10 years; foundation for 5‐7% EPS growth • Natural Gas ~7%, Electric ~5% 10‐Year CapEx of $6.5B 10‐Yr Rate Base CAGR: ~6% $7.1B Generation, $1.3B $
Slide 18: Smart Energy Future - 10-Year CapEx Plan Overview
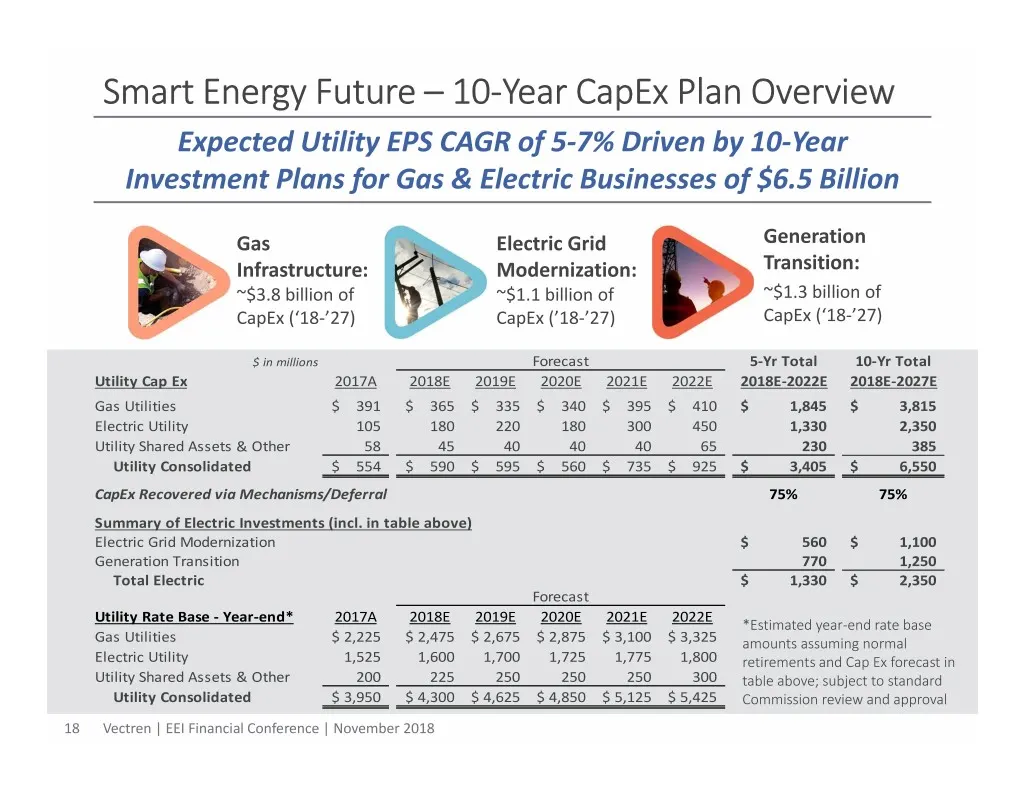
Smart Energy Future –10‐Year CapEx Plan Overview Expected Utility EPS CAGR of 5‐7% Driven by 10‐Year Investment Plans for Gas & Electric Businesses of $6.5 Billion Gas Electric Grid Generation Infrastructure: Modernization: Transition: ~$3.8 billion of ~$1.1 billion of ~$1.3 billion of CapEx (‘18‐’2
Slide 19: Generation Transition Plan
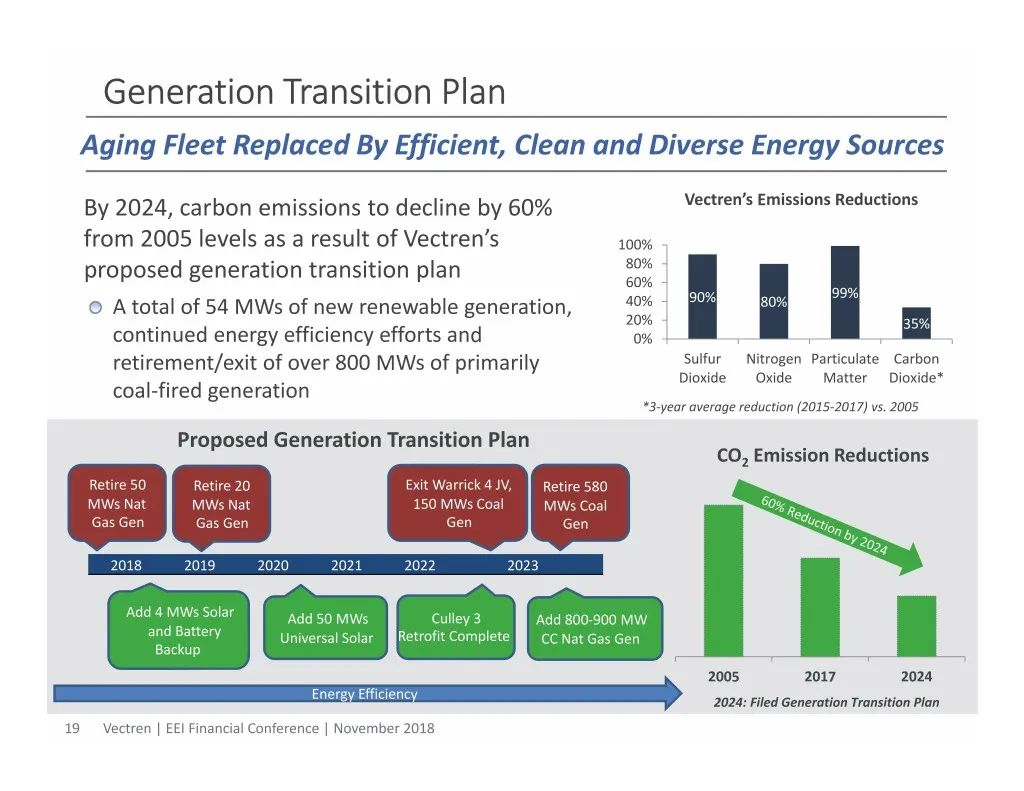
Generation Transition Plan Aging Fleet Replaced By Efficient, Clean and Diverse Energy Sources By 2024, carbon emissions to decline by 60% Vectren’s Emissions Reductions from 2005 levels as a result of Vectren’s 100% 80% proposed generation transition plan 60% 99% A total of 54 MWs of new renewable
Slide 20: Utility Regulatory Update
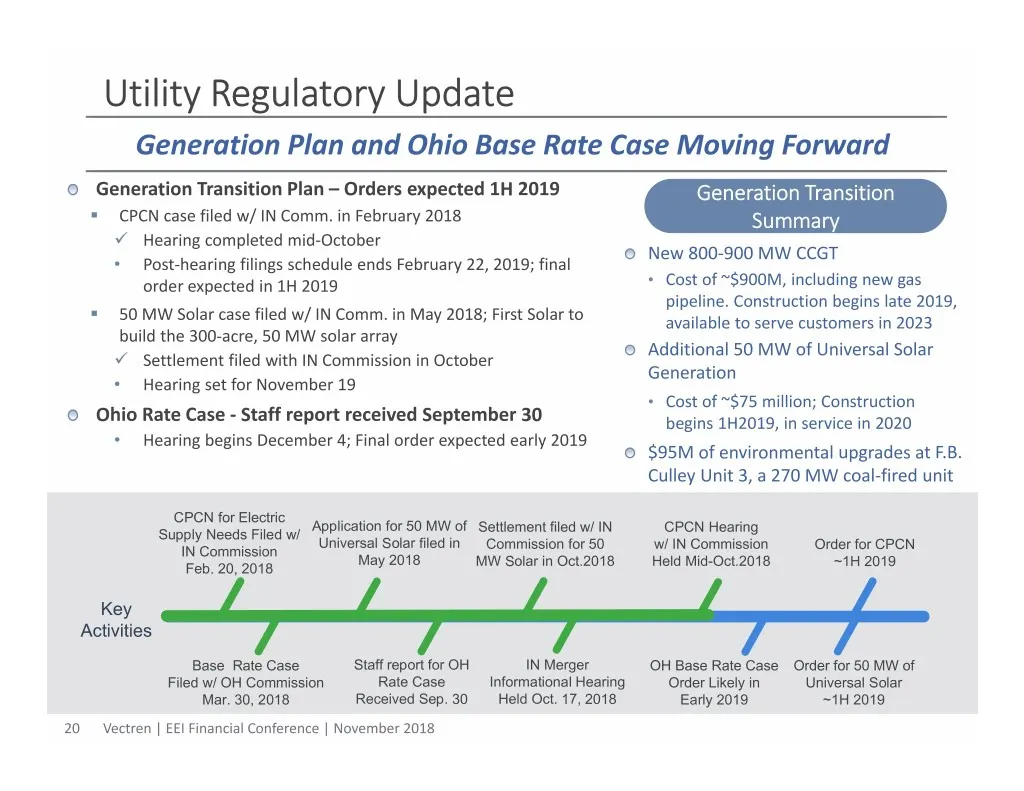
Utility Regulatory Update Generation Plan and Ohio Base Rate Case Moving Forward Generation Transition Plan –Orders expected 1H 2019 Generation Transition . CPCN case filed w/ IN Comm. in February 2018 Summary Hearing completed mid‐October New 800‐900 MW CCGT • Post‐hearing filings schedule ends F
Slide 21: Nonutility Operations
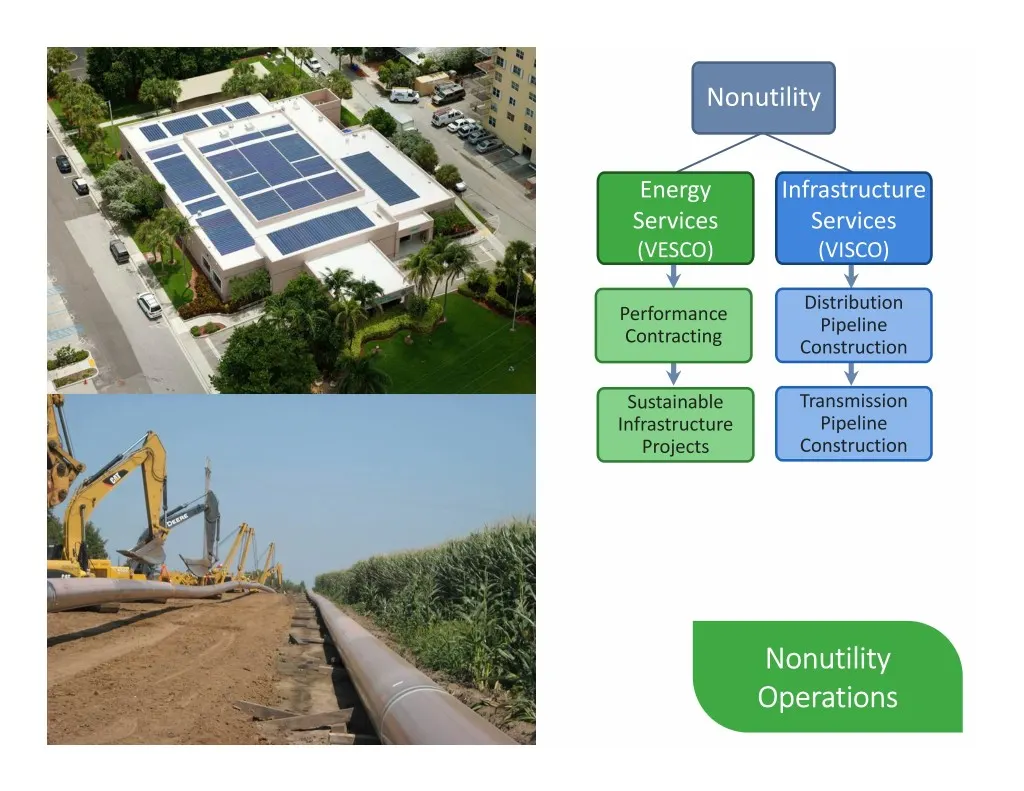
Nonutility Energy Infrastructure Services Services (VESCO) (VISCO) Distribution Performance Pipeline Contracting Construction Sustainable Transmission Infrastructure Pipeline Projects Construction Nonutility Operations 21 Vectren | EEI Financial Conference | November 2018
Slide 22: Infrastructure Services (VISCO) Business Profile
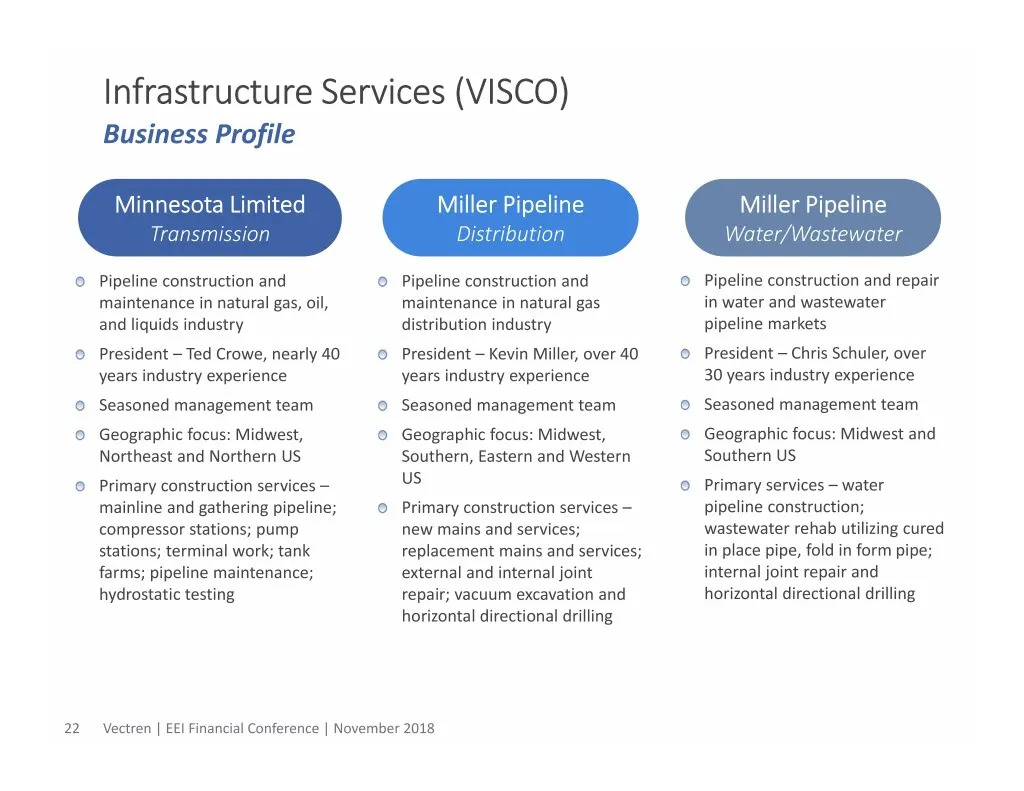
Infrastructure Services (VISCO) Business Profile Minnesota Limited Miller Pipeline Miller Pipeline Transmission Distribution Water/Wastewater Pipeline construction and Pipeline construction and Pipeline construction and repair maintenance in natural gas, oil, maintenance in natural gas in water and
Slide 23: VISCO Long-Term Customer Relationships
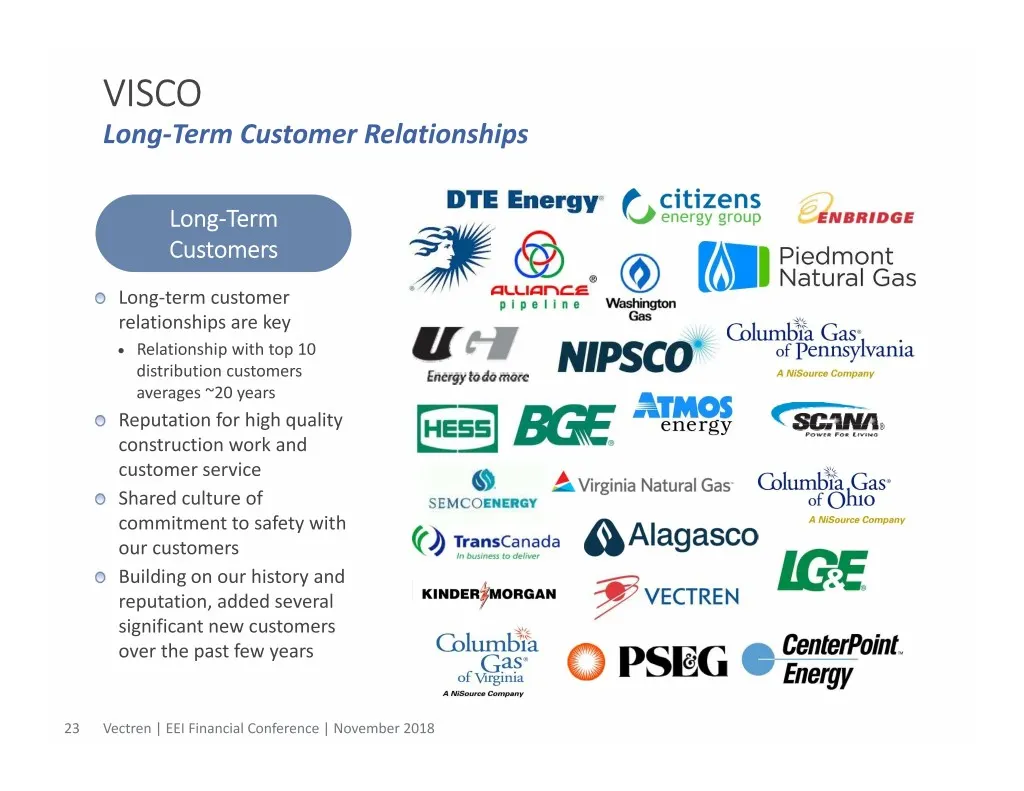
VISCO Long‐Term Customer Relationships Long‐Term Customers Long‐term customer relationships are key Relationship with top 10 distribution customers averages ~20 years Reputation for high quality construction work and customer service Shared culture of commitment to safety with our customers Buildi
Slide 24: Energy Services (VESCO) Business Profile
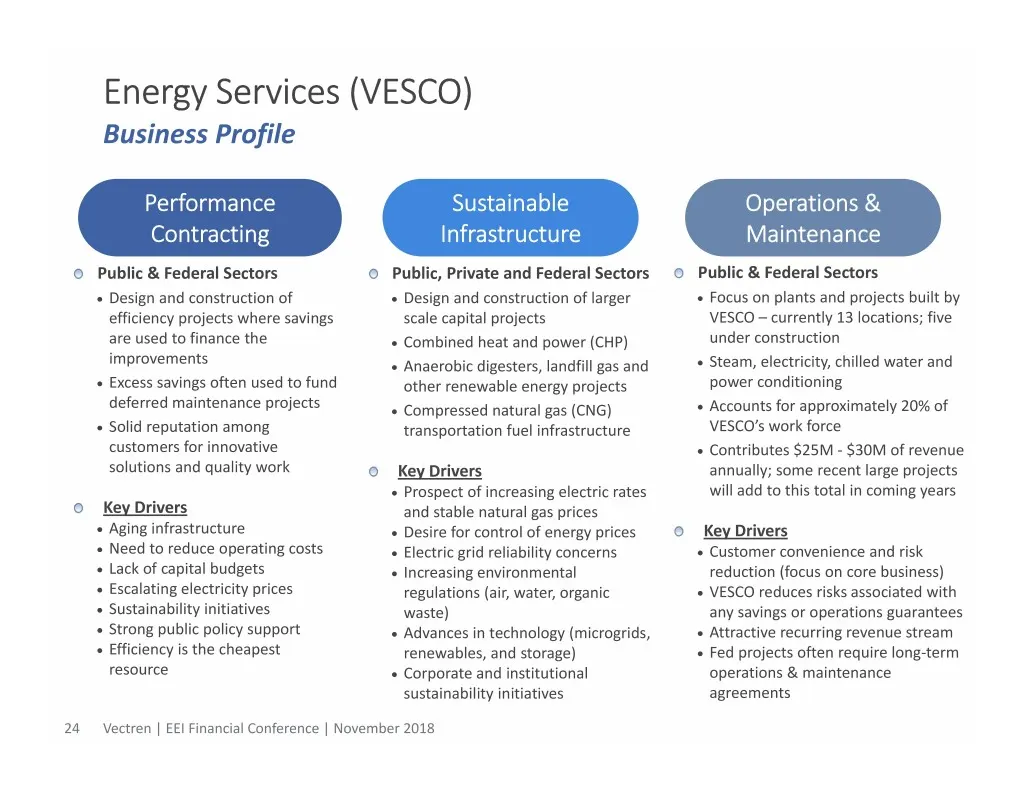
Energy Services (VESCO) Business Profile Performance Sustainable Operations & Contracting Infrastructure Maintenance Public & Federal Sectors Public, Private and Federal Sectors Public & Federal Sectors Design and construction of Design and construction of larger Focus on plants and projects b
Slide 25: VESCO Market Sectors and Customers
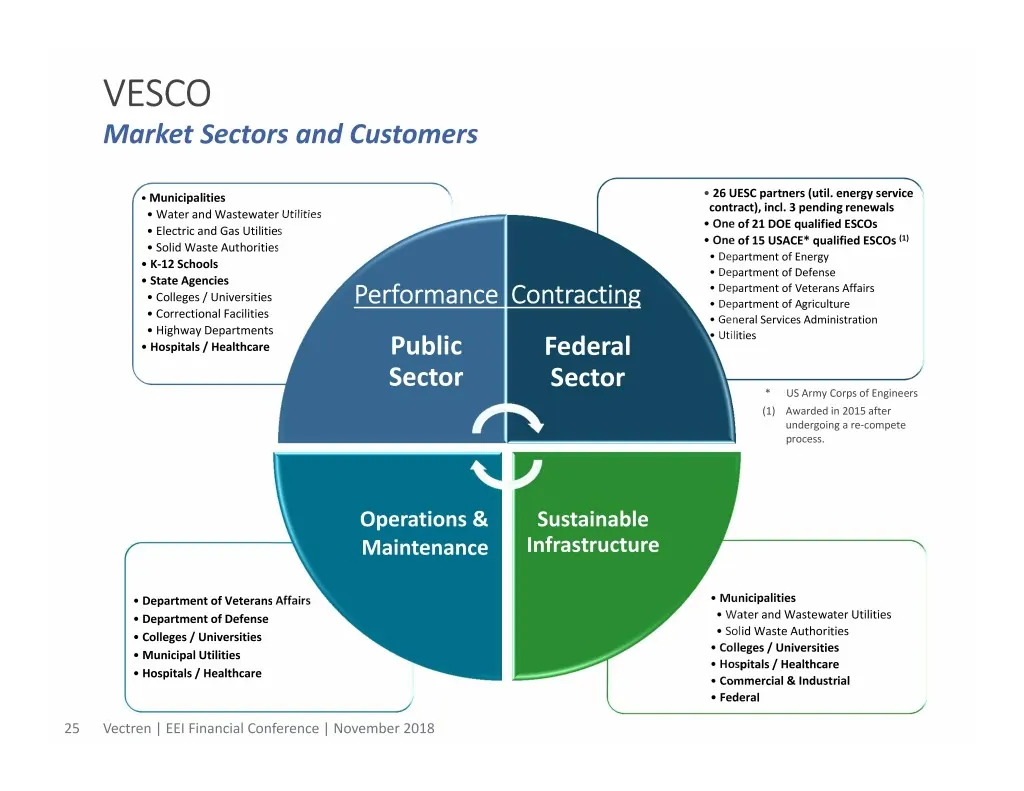
VESCO Market Sectors and Customers • Municipalities • 26 UESC partners (util. energy service contract), incl. 3 pending renewals •Water and Wastewater Utilities • One of 21 DOE qualified ESCOs •Electric and Gas Utilities • One of 15 USACE* qualified ESCOs (1) • Solid Waste Authorities • Department o
Slide 26: Appendix
Appendix
Slide 27: Use of Non-GAAP Performance Measures and Per Share Measures
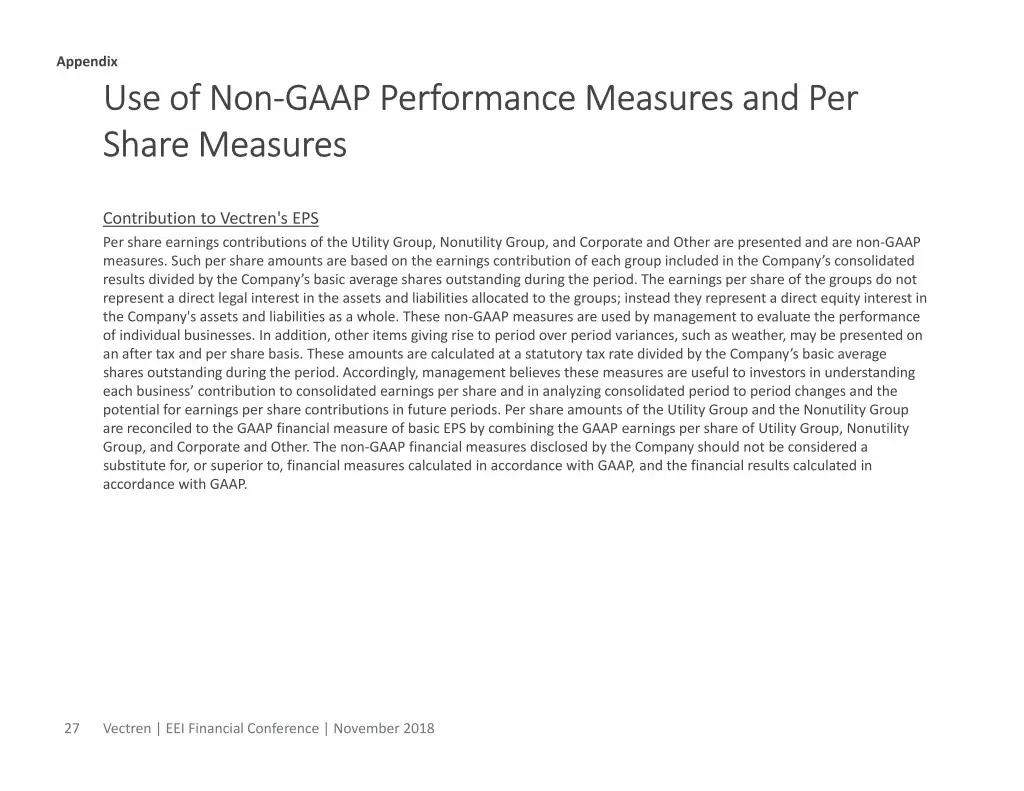
Appendix Use of Non‐GAAP Performance Measures and Per Share Measures Contribution to Vectren's EPS Per share earnings contributions of the Utility Group, Nonutility Group, and Corporate and Other are presented and are non‐GAAP measures. Such per share amounts are based on the earnings contribution o
Slide 28: Reconciliation GAAP to non-GAAP Net Income and EPS
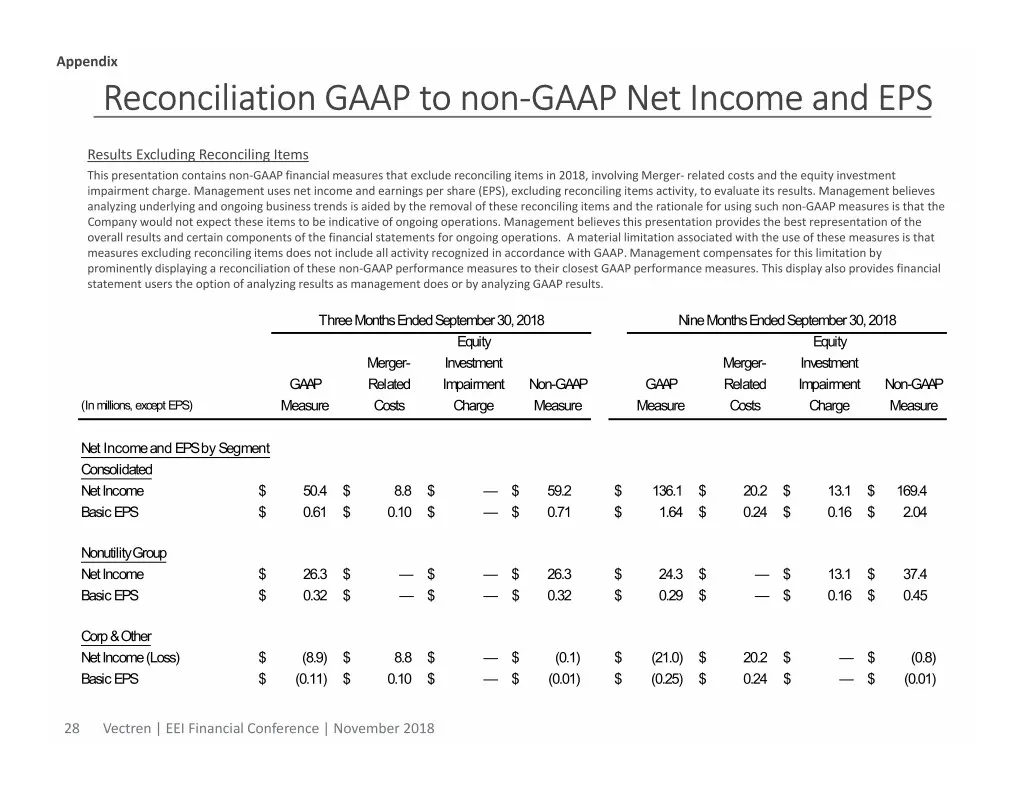
Appendix Reconciliation GAAP to non‐GAAP Net Income and EPS Results Excluding Reconciling Items This presentation contains non‐GAAP financial measures that exclude reconciling items in 2018, involving Merger‐ related costs and the equity investment impairment charge. Management uses net income and e
Slide 29: Regulatory Activity Planned in the Future
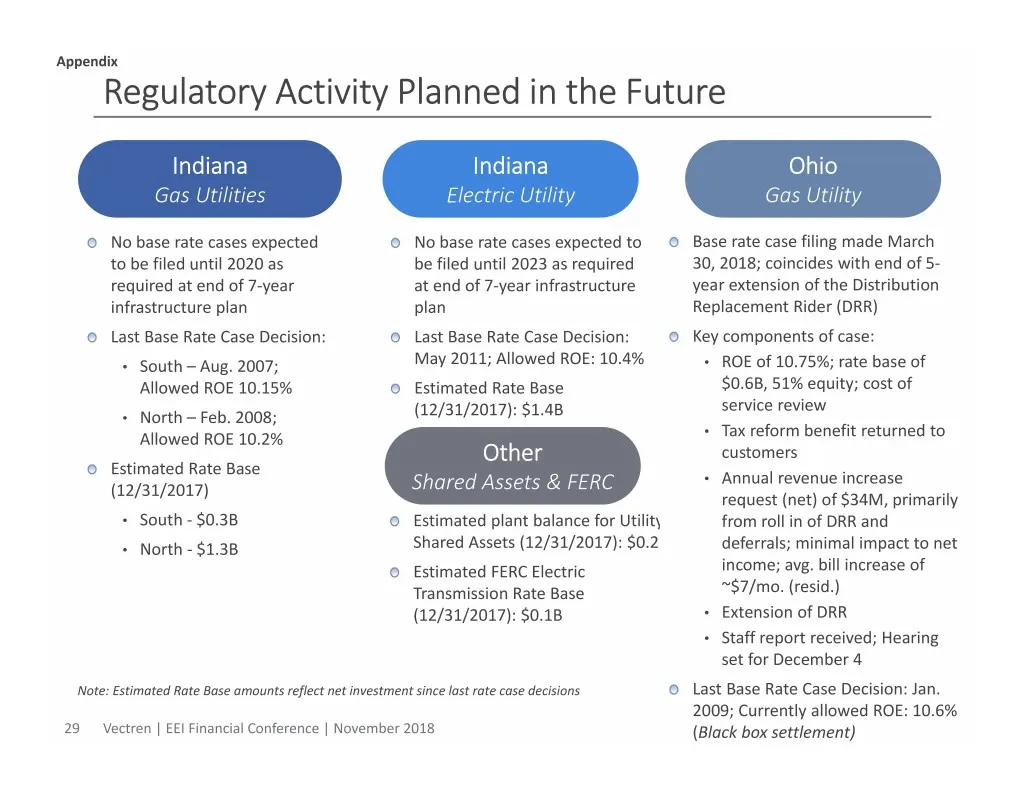
Appendix Regulatory Activity Planned in the Future Indiana Indiana Ohio Gas Utilities Electric Utility Gas Utility No base rate cases expected No base rate cases expected to Base rate case filing made March to be filed until 2020 as be filed until 2023 as required 30, 2018; coincides with end of 5‐
Slide 30: Favorable Utility Environments
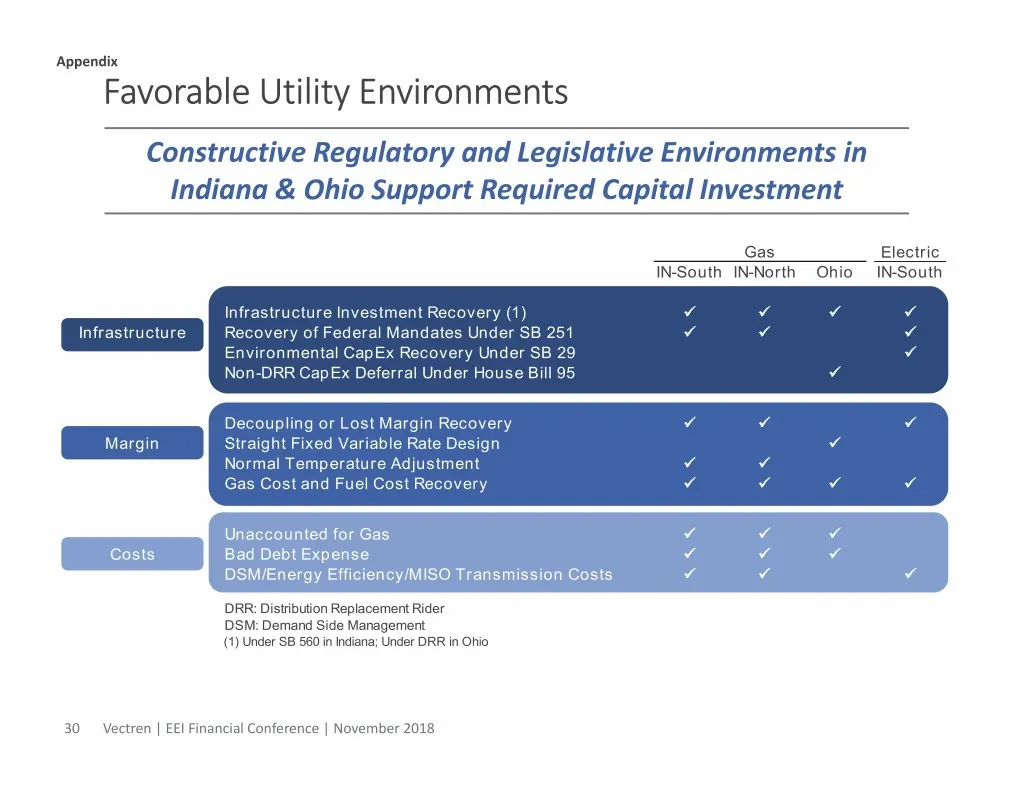
Appendix Favorable Utility Environments Constructive Regulatory and Legislative Environments in Indiana & Ohio Support Required Capital Investment Gas Electric IN-South IN-North Ohio IN-South Infrastructure Investment Recovery (1) Infrastructure Recovery of Federal Mandates Under SB 251 En
Slide 31: Utility Metrics
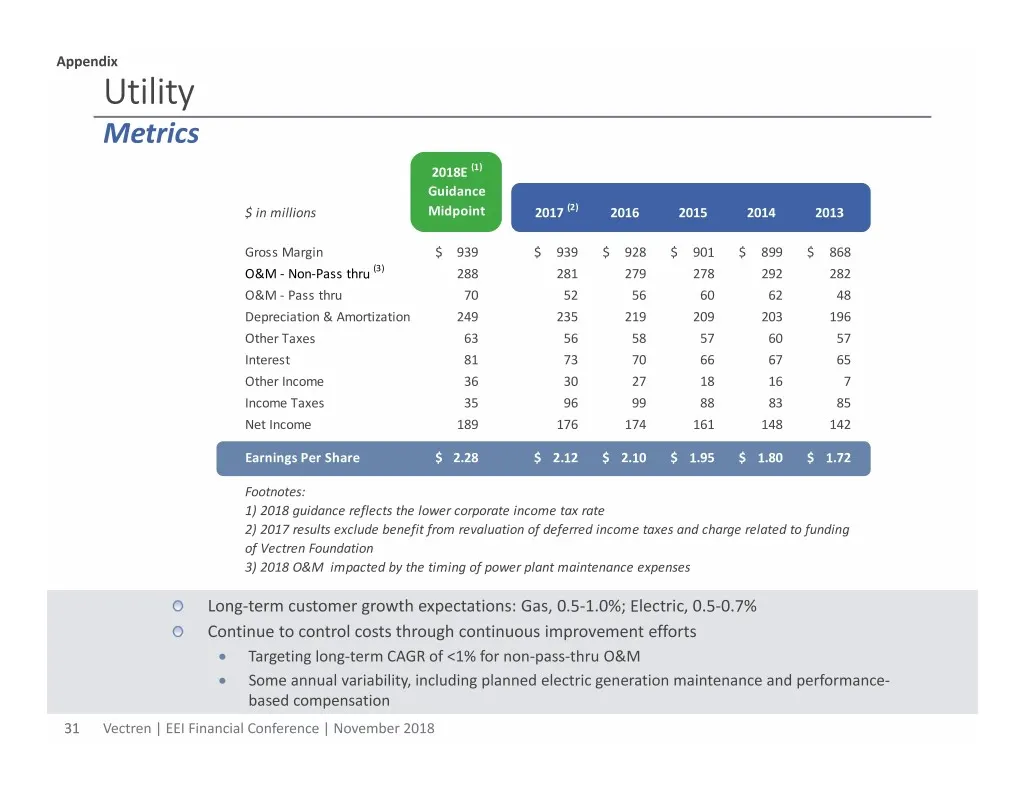
Appendix Utility Metrics 2018E (1) Guidance $ in millions Midpoint 2017 (2) 2016 2015 2014 2013 Gross Margin$ 939 $ 939 $ 928 $ 901 $ 899 $ 868 O&M ‐ Non‐Pass thru (3) 288 281 279 278 292 282 O&M ‐ Pass thru 70 52 56 60 62 48 Depreciation & Amortization 249 235 219 209 203 196 Other Taxes 63 56 58 5
Slide 32: Infrastructure Services (VISCO) Metrics
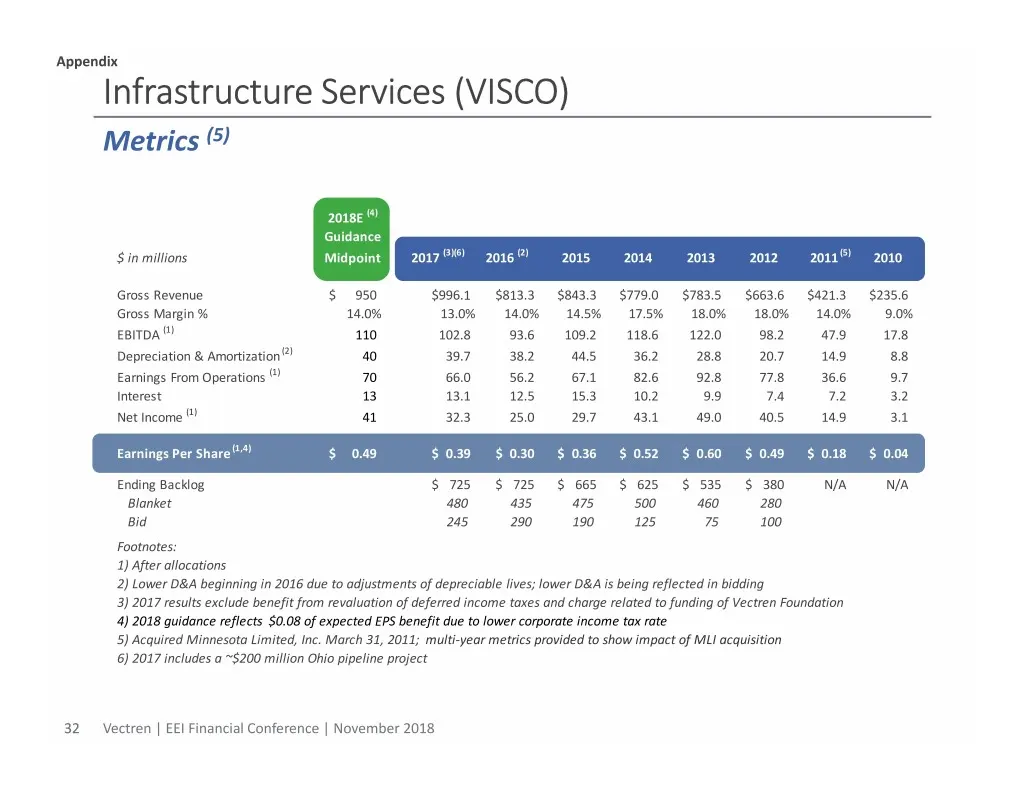
Appendix Infrastructure Services (VISCO) Metrics (5) 2018E (4) Guidance $ in millions Midpoint 2017 (3)(6) 2016 (2) 2015 2014 2013 2012 2011 (5) 2010 Gross Revenue$ 950 $996.1 $813.3 $843.3 $779.0 $783.5 $663.6 $421.3 $235.6 Gross Margin % 14.0% 13.0% 14.0% 14.5% 17.5% 18.0% 18.0% 14.0% 9.0% EBITDA
Slide 33: Energy Services (VESCO) Metrics
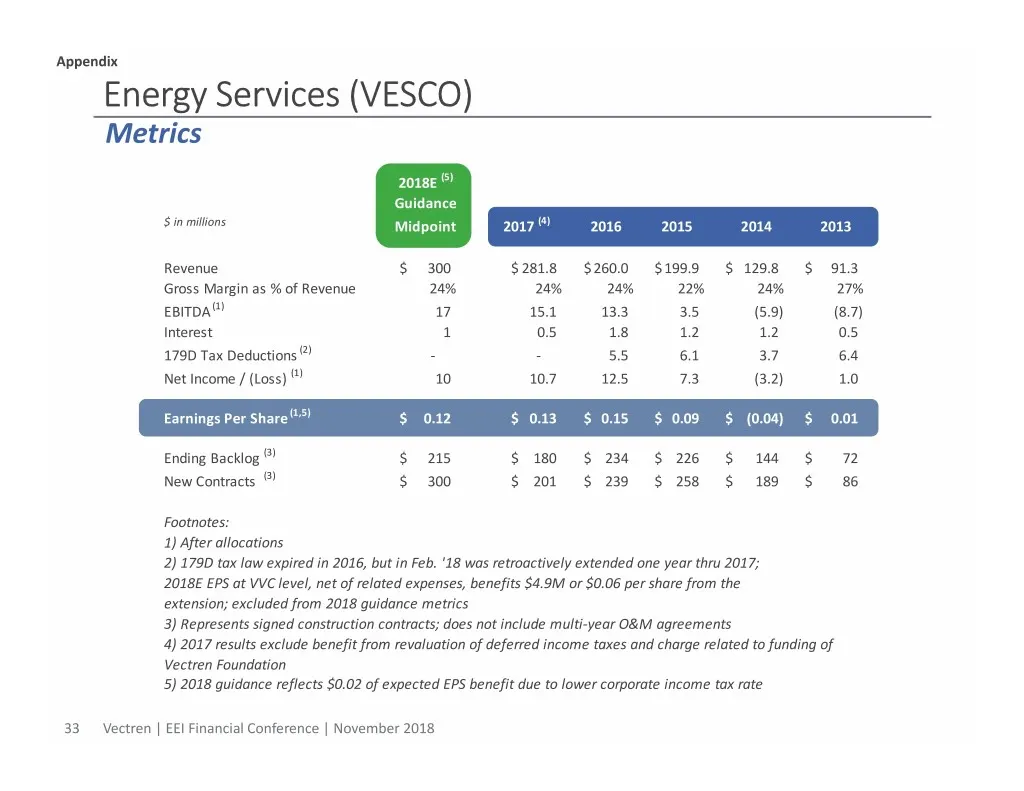
Appendix Energy Services (VESCO) Metrics 2018E (5) Guidance $ in millions Midpoint 2017 (4) 2016 2015 2014 2013 Revenue$ 300 $ 281.8 $ 260.0 $ 199.9 $ 129.8 $ 91.3 Gross Margin as % of Revenue 24% 24% 24% 22% 24% 27% EBITDA (1) 17 15.1 13.3 3.5 (5.9) (8.7) Interest 1 0.5 1.8 1.2 1.2 0.5 179D Tax Ded
Source: SEC EDGAR · 8-K filed Nov 9, 2018
More decks from Vectren Corporation
 Q2 2018 Earnings Presentation31 slides · Aug 3, 2018
 Merger or Acquisition (June 2018)18 slides · Jun 12, 2018
 American Gas Association Financial Forum 201855 slides · May 18, 2018
 Q1 2018 Earnings Presentation27 slides · May 4, 2018
 FY2017 Earnings Presentation43 slides · Feb 27, 2018
 Fact Sheet (February 2018)1 slide · February 2018