Vectren — American Gas Association Financial Forum 2018
55 slides from Vectren's conference presentation, May 18, 2018
Slide 1: American Gas Association Financial Forum May 20-22, 2018
American Gas Association Financial Forum May 20-22, 2018
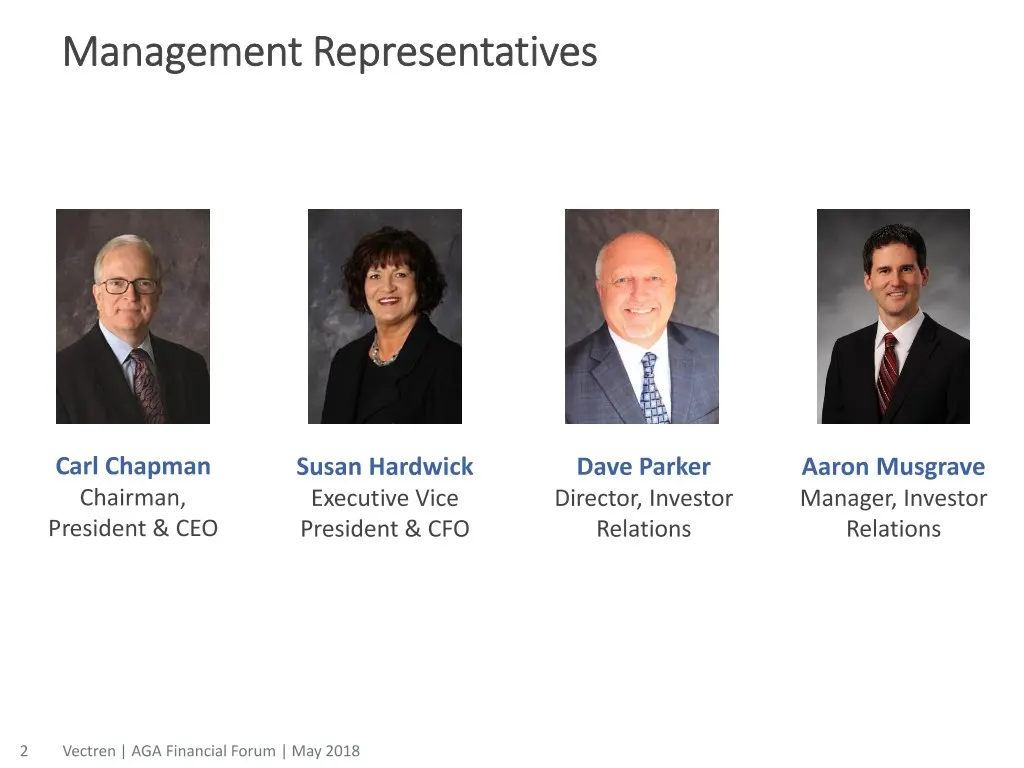
Slide 2: Management Representatives
Management Representatives Carl Chapman Susan Hardwick Dave Parker Aaron Musgrave Chairman, Executive Vice Director, Investor Manager, Investor President & CEO President & CFO Relations Relations 2 Vectren | AGA Financial Forum | May 2018
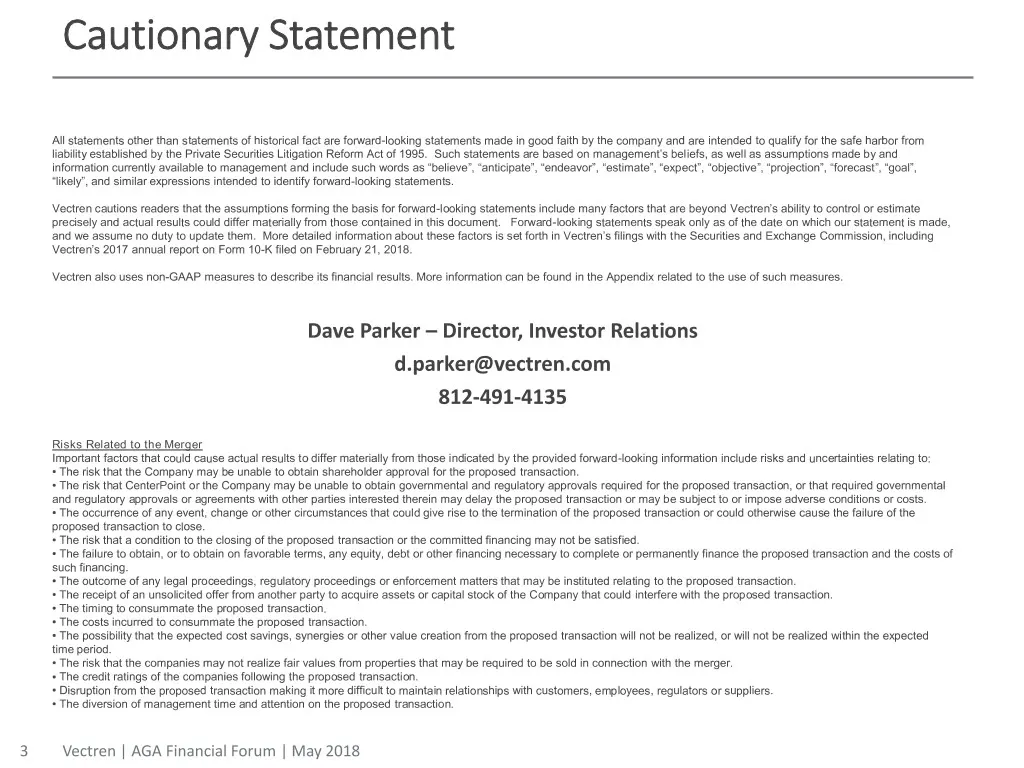
Slide 3: Cautionary Statement
Cautionary Statement All statements other than statements of historical fact are forward-looking statements made in good faith by the company and are intended to qualify for the safe harbor from liability established by the Private Securities Litigation Reform Act of 1995. Such statements are based
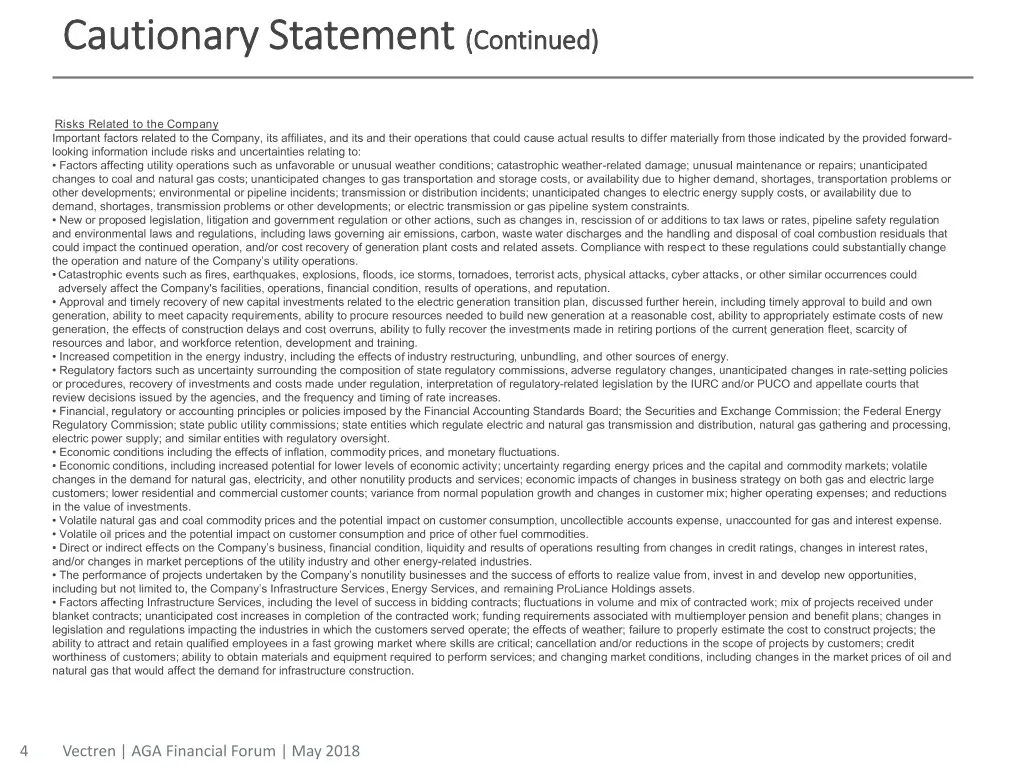
Slide 4: Cautionary Statement (Continued) Risks Related to the Company
Cautionary Statement (Continued) Risks Related to the Company Important factors related to the Company, its affiliates, and its and their operations that could cause actual results to differ materially from those indicated by the provided forward- looking information include risks and uncertainties
Slide 5: Cautionary Statement (Continued) Risks Related to the Company (continued)
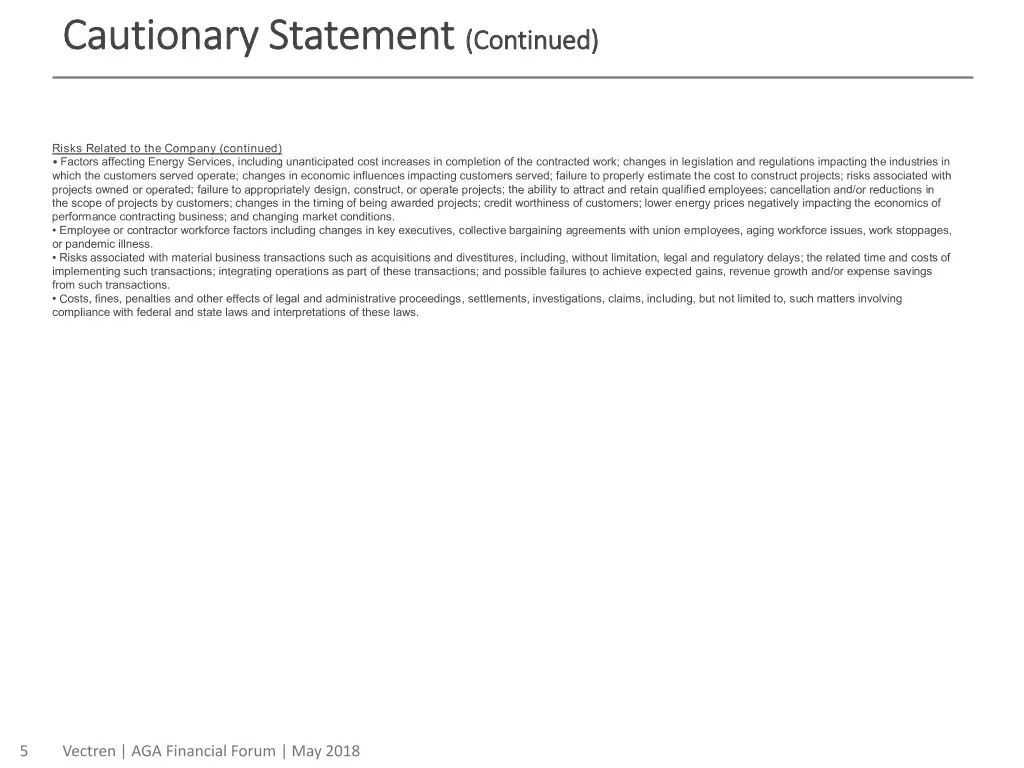
Cautionary Statement (Continued) Risks Related to the Company (continued) • Factors affecting Energy Services, including unanticipated cost increases in completion of the contracted work; changes in legislation and regulations impacting the industries in which the customers served operate; changes i
Slide 6: Q1 2018 Update
Q1 2018 Update 6 Vectren | AGA Financial Forum | May 2018
Slide 7: Consolidated Q1 2018 Results
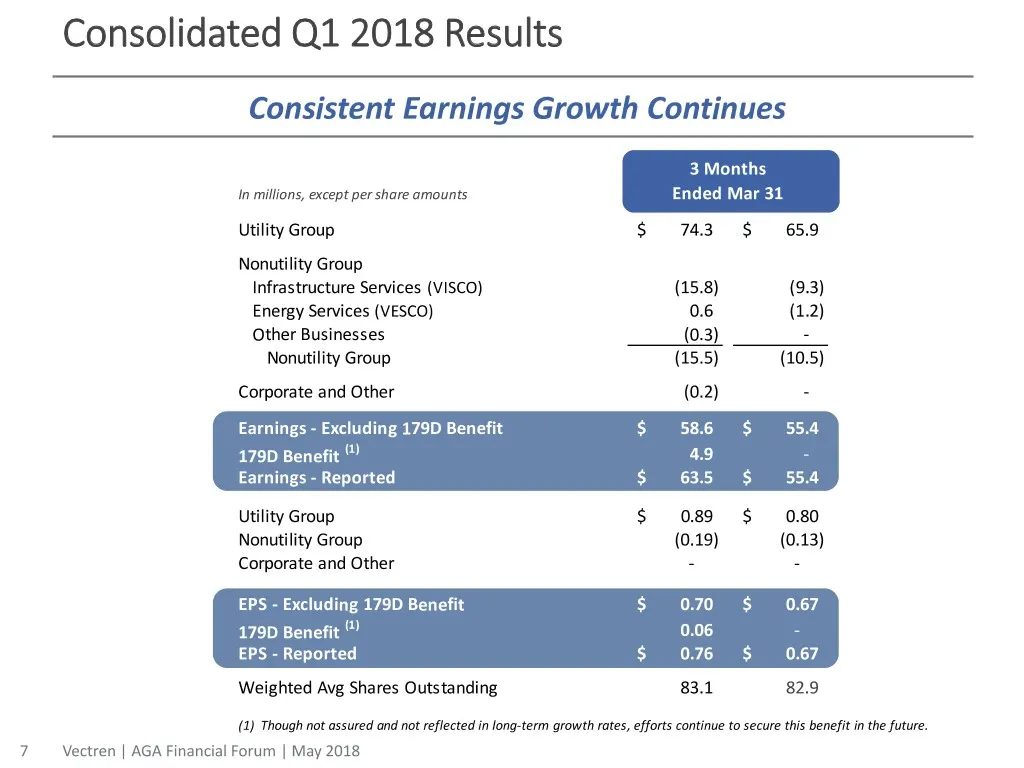
Consolidated Q1 2018 Results Consistent Earnings Growth Continues 3 Months In millions, except per share amounts Ended Mar 31 Utility Group $ 74.3 $ 65.9 Nonutility Group Infrastructure Services (VISCO) (15.8) (9.3) Energy Services (VESCO) 0.6 (1.2) Other Businesses (0.3) - Nonutility Group (15.5) (
Slide 8: 2018 Q1 Results and Highlights
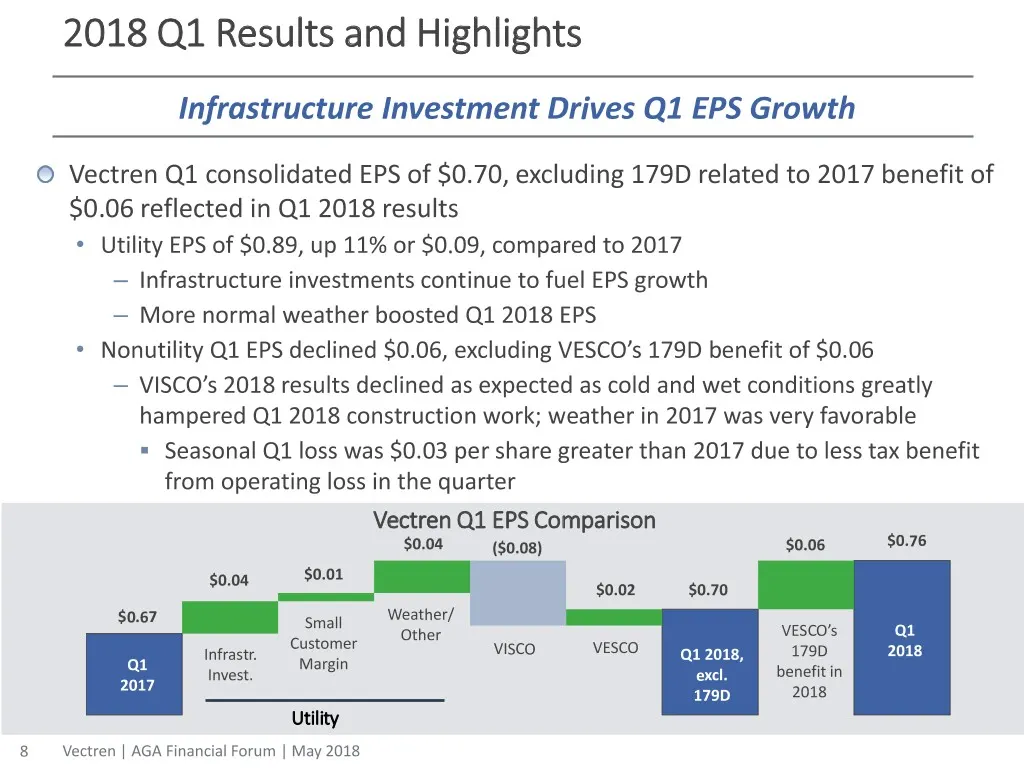
2018 Q1 Results and Highlights Infrastructure Investment Drives Q1 EPS Growth Vectren Q1 consolidated EPS of $0.70, excluding 179D related to 2017 benefit of $0.06 reflected in Q1 2018 results • Utility EPS of $0.89, up 11% or $0.09, compared to 2017 – Infrastructure investments continue to fuel EPS
Slide 9: 2018 Q1 Nonutility Results
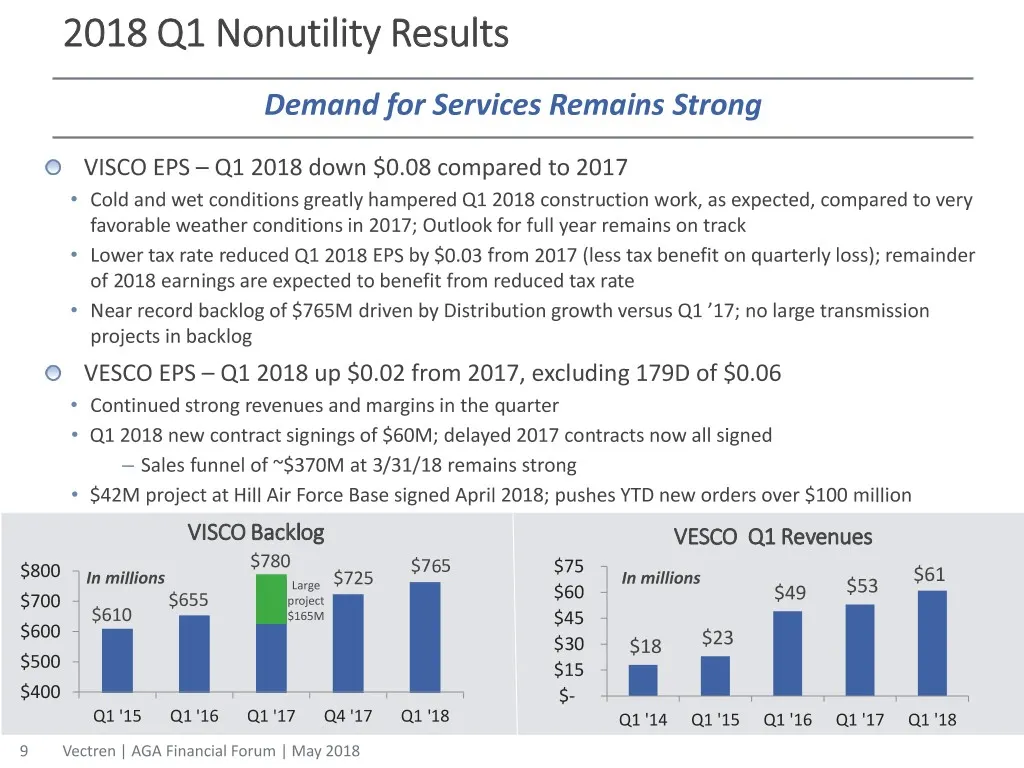
2018 Q1 Nonutility Results Demand for Services Remains Strong VISCO EPS – Q1 2018 down $0.08 compared to 2017 • Cold and wet conditions greatly hampered Q1 2018 construction work, as expected, compared to very favorable weather conditions in 2017; Outlook for full year remains on track • Lower tax r
Slide 10: 2018 EPS Guidance Affirmed
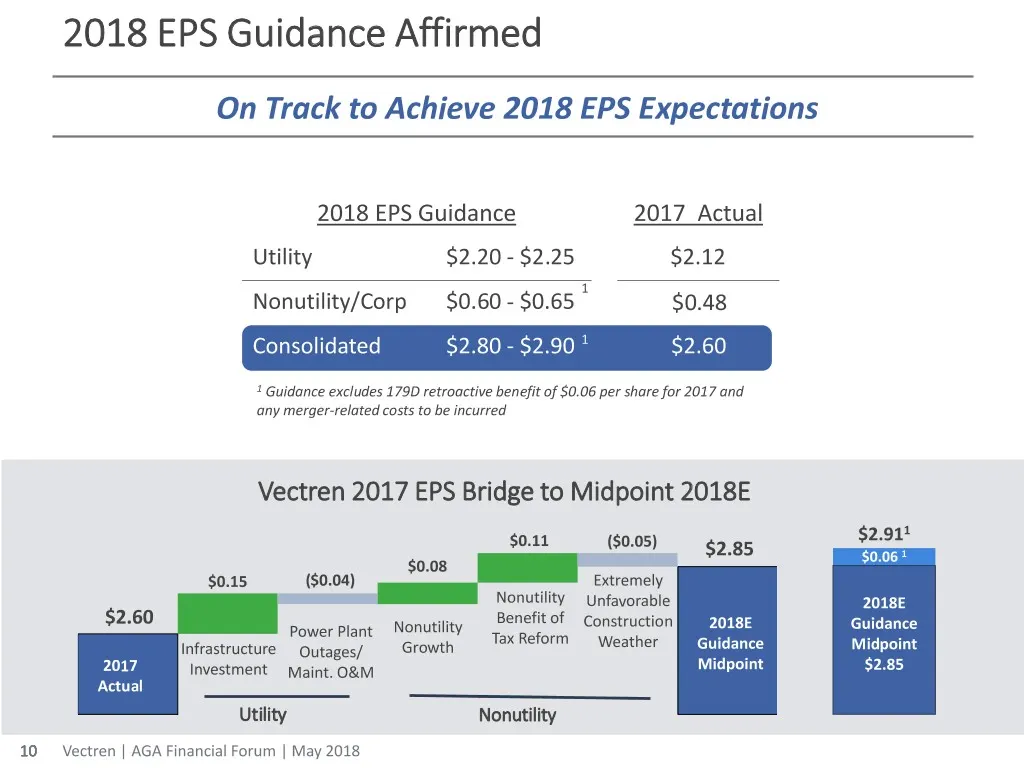
2018 EPS Guidance Affirmed On Track to Achieve 2018 EPS Expectations 2018 EPS Guidance 2017 Actual Utility $2.20 - $2.25 $2.12 1 Nonutility/Corp $0.60 - $0.65 $0.48 Consolidated $2.80 - $2.90 1 $2.60 1 Guidance excludes 179D retroactive benefit of $0.06 per share for 2017 and any merger-related cost
Slide 11: Utility Regulatory Update
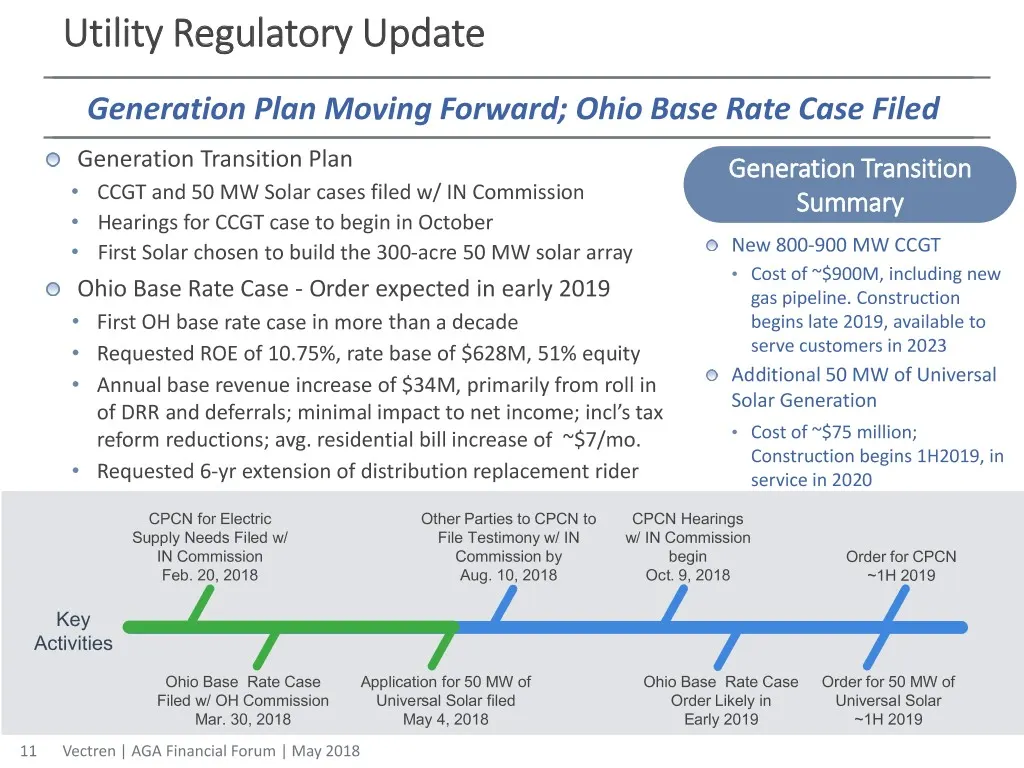
Utility Regulatory Update Generation Plan Moving Forward; Ohio Base Rate Case Filed Generation Transition Plan Generation Transition • CCGT and 50 MW Solar cases filed w/ IN Commission Summary • Hearings for CCGT case to begin in October • First Solar chosen to build the 300-acre 50 MW solar array N
Slide 12: Transforming Our Utility
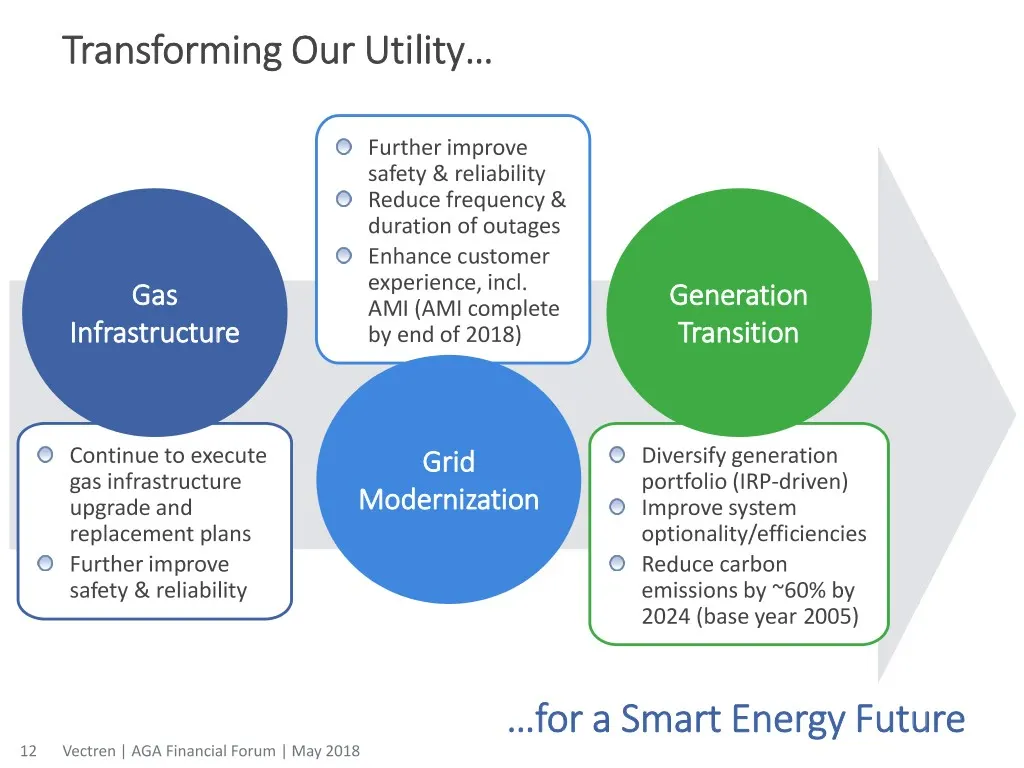
Transforming Our Utility… Further improve safety & reliability Reduce frequency & duration of outages Enhance customer experience, incl. Gas AMI (AMI complete Generation Infrastructure by end of 2018) Transition Continue to execute Grid Diversify generation gas infrastructure portfolio (IRP-driven)
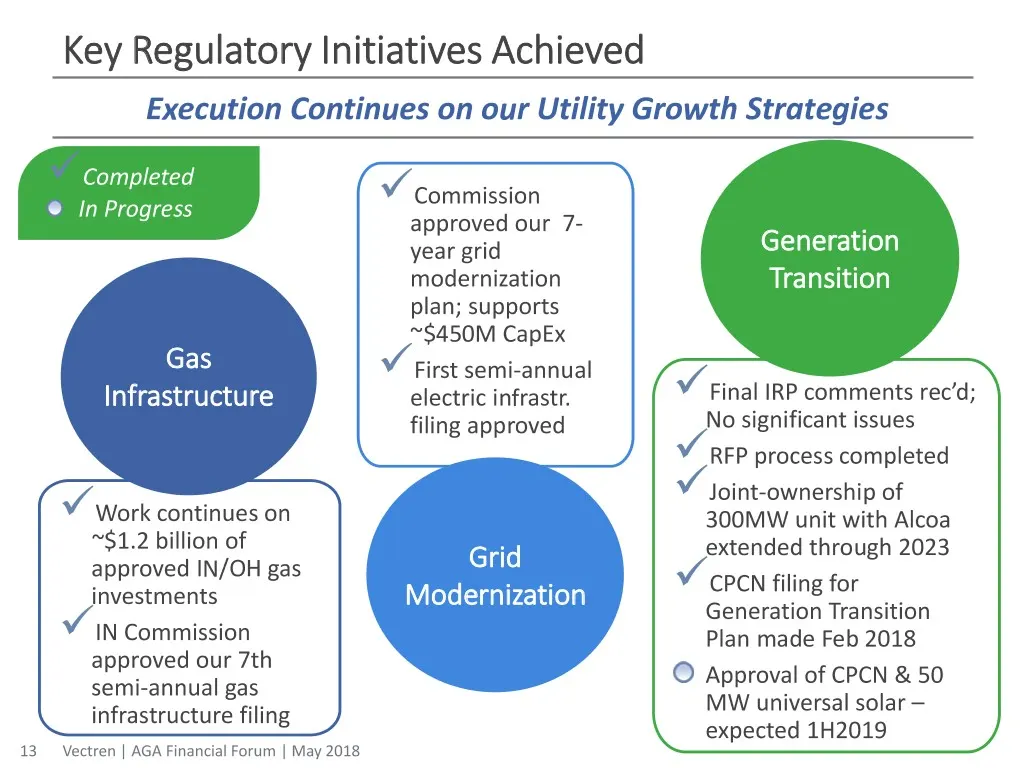
Slide 13: Key Regulatory Initiatives Achieved
Key Regulatory Initiatives Achieved Execution Continues on our Utility Growth Strategies Completed Commission In Progress approved our 7- year grid Generation modernization Transition plan; supports ~$450M CapEx Gas First semi-annual Infrastructure electric infrastr. Final IRP comments rec’d;
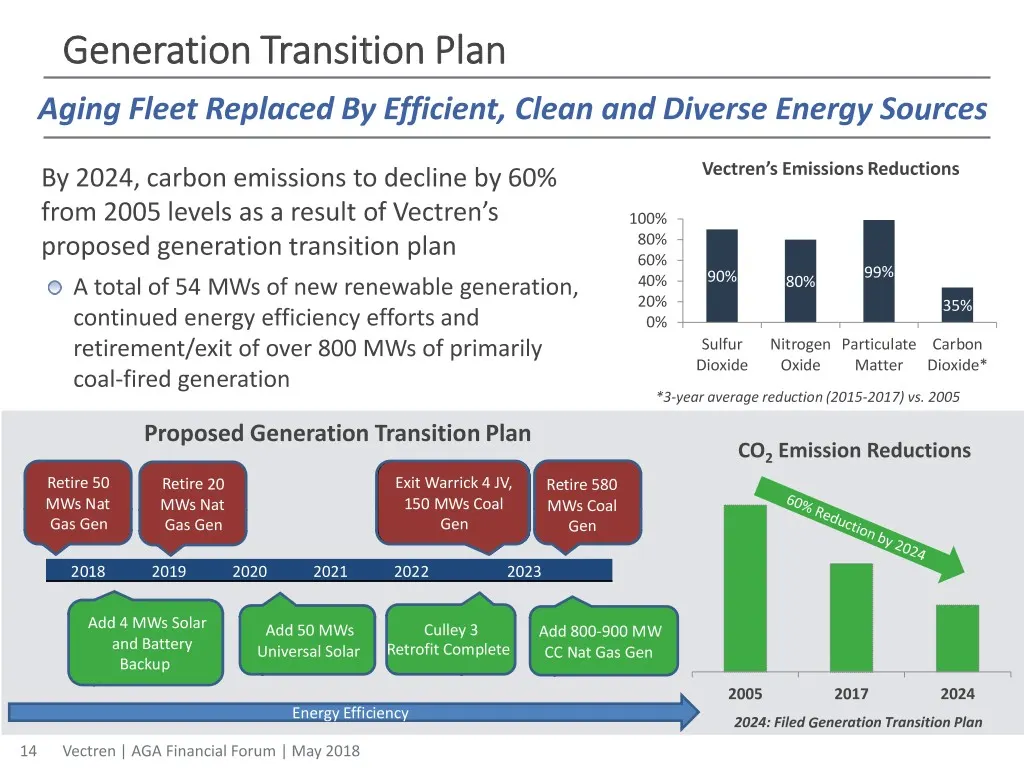
Slide 14: Generation Transition Plan
Generation Transition Plan Aging Fleet Replaced By Efficient, Clean and Diverse Energy Sources Vectren’s Emissions Reductions By 2024, carbon emissions to decline by 60% from 2005 levels as a result of Vectren’s 100% 80% proposed generation transition plan 60% 99% A total of 54 MWs of new renewable
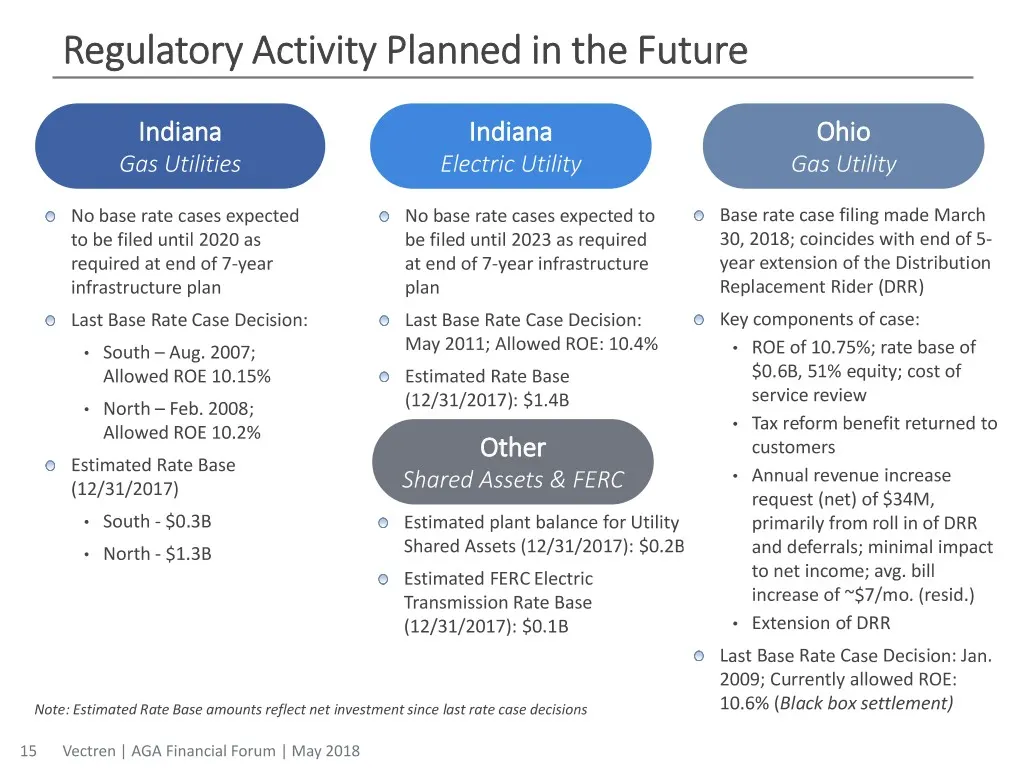
Slide 15: Regulatory Activity Planned in the Future
Regulatory Activity Planned in the Future Indiana Indiana Ohio Gas Utilities Electric Utility Gas Utility No base rate cases expected No base rate cases expected to Base rate case filing made March to be filed until 2020 as be filed until 2023 as required 30, 2018; coincides with end of 5- required
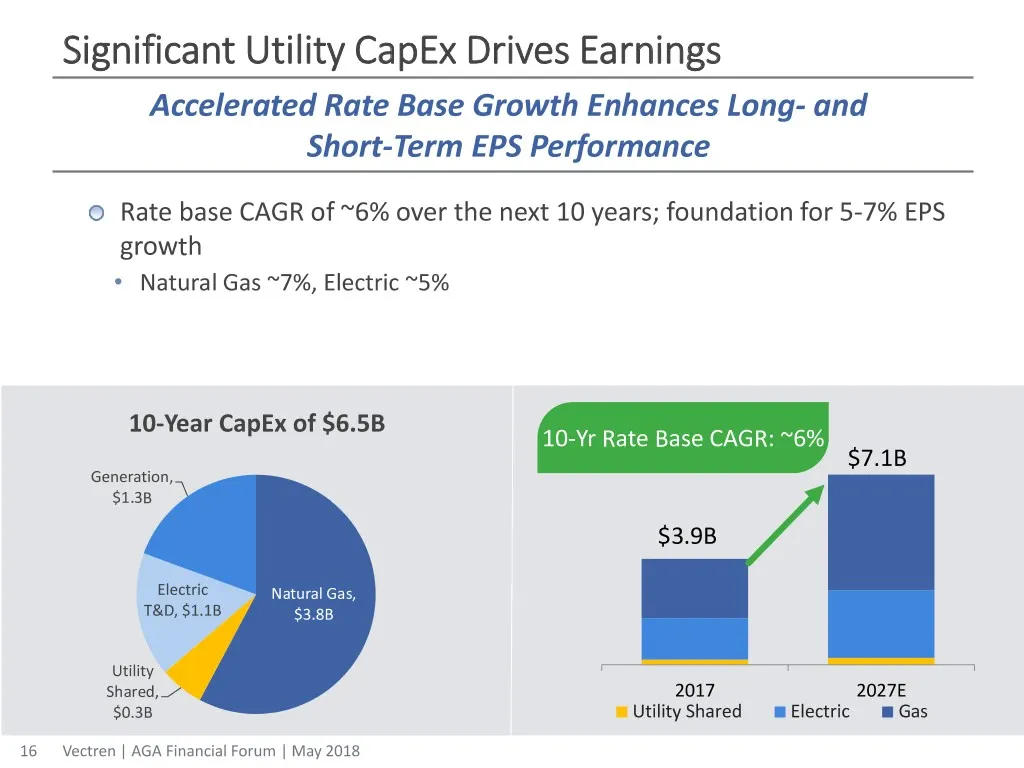
Slide 16: Significant Utility CapEx Drives Earnings
Significant Utility CapEx Drives Earnings Accelerated Rate Base Growth Enhances Long- and Short-Term EPS Performance Rate base CAGR of ~6% over the next 10 years; foundation for 5-7% EPS growth • Natural Gas ~7%, Electric ~5% 10-Year CapEx of $6.5B 10-Yr Rate Base CAGR: ~6% $7.1B Generation, $1.3B $
Slide 17: Smart Energy Future – 10-Year CapEx Plan Overview
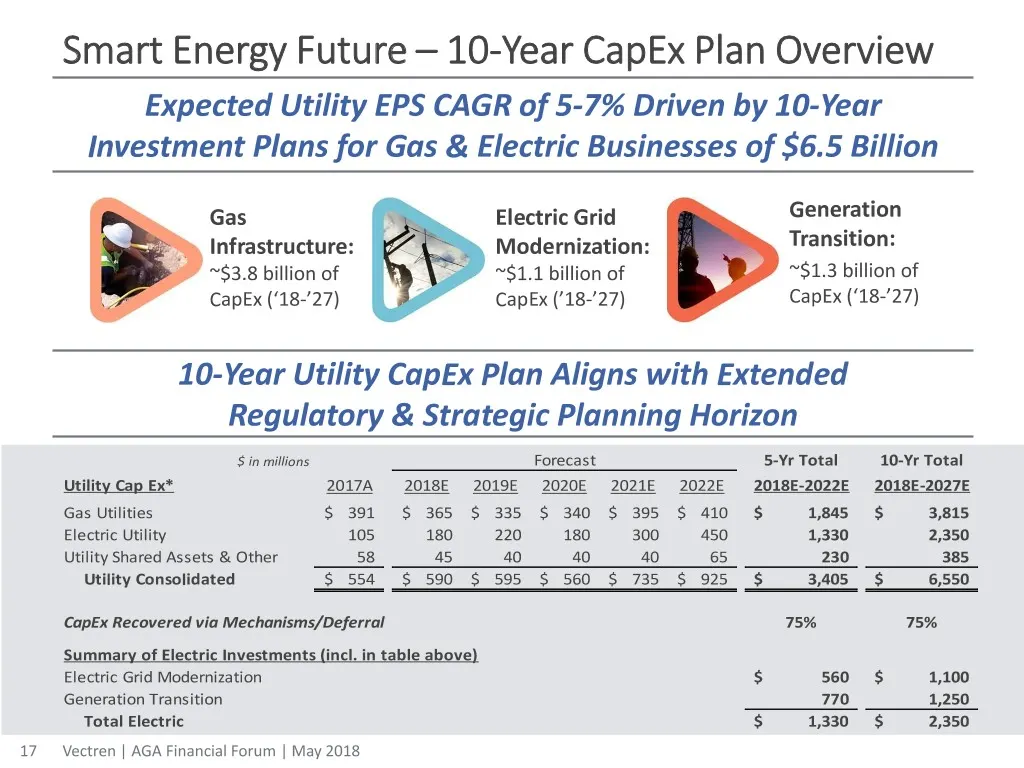
Smart Energy Future – 10-Year CapEx Plan Overview Expected Utility EPS CAGR of 5-7% Driven by 10-Year Investment Plans for Gas & Electric Businesses of $6.5 Billion Gas Electric Grid Generation Infrastructure: Modernization: Transition: ~$3.8 billion of ~$1.1 billion of ~$1.3 billion of CapEx (‘18-’
Slide 18: Executing Our Plan
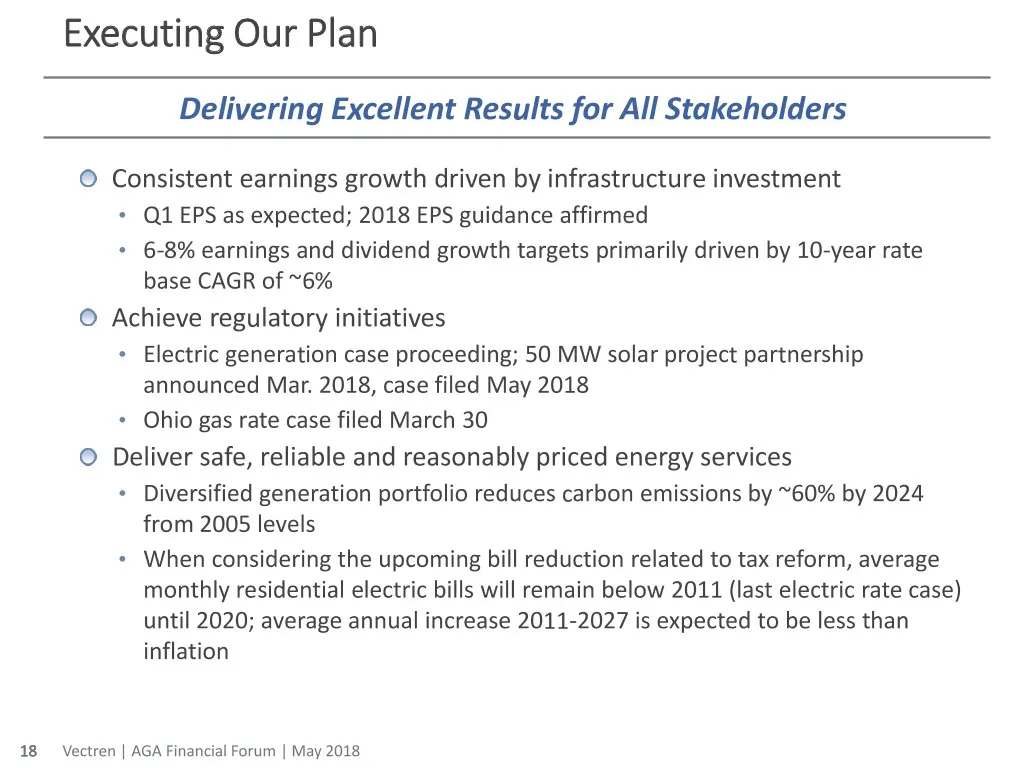
Executing Our Plan Delivering Excellent Results for All Stakeholders Consistent earnings growth driven by infrastructure investment • Q1 EPS as expected; 2018 EPS guidance affirmed • 6-8% earnings and dividend growth targets primarily driven by 10-year rate base CAGR of ~6% Achieve regulatory initia
Slide 19: Long Track Record of Utility Growth
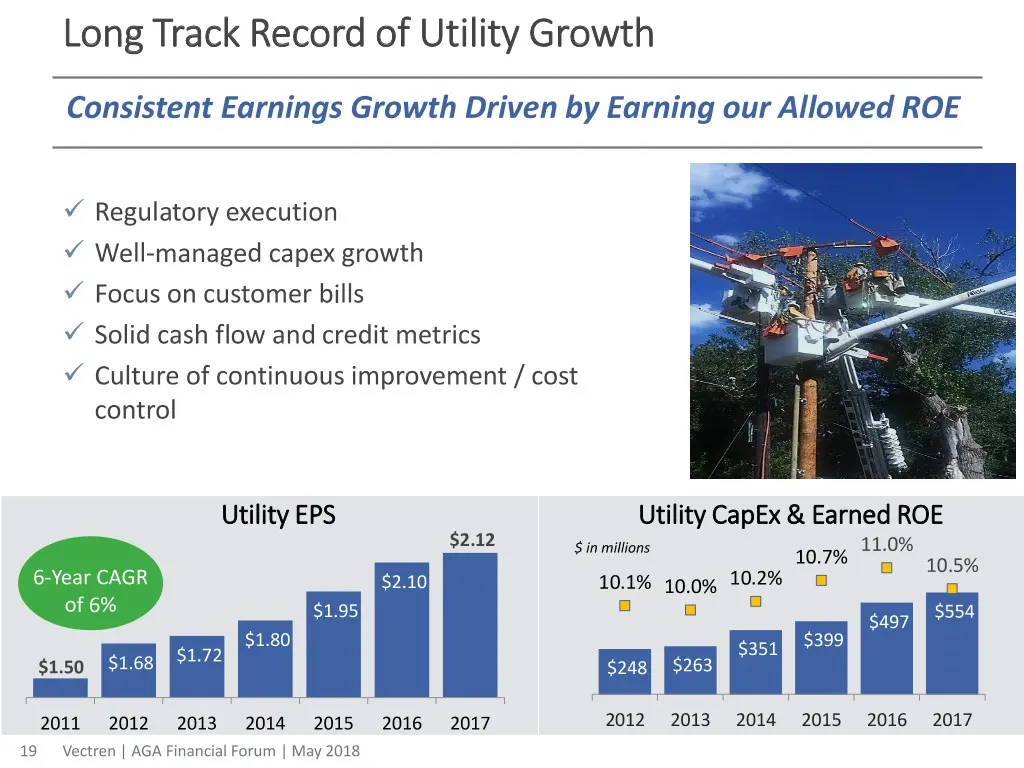
Long Track Record of Utility Growth Consistent Earnings Growth Driven by Earning our Allowed ROE Regulatory execution Well-managed capex growth Focus on customer bills Solid cash flow and credit metrics Culture of continuous improvement / cost control Utility EPS Utility CapEx & Earned ROE
Slide 20: Long History of Consistent Growth and Execution
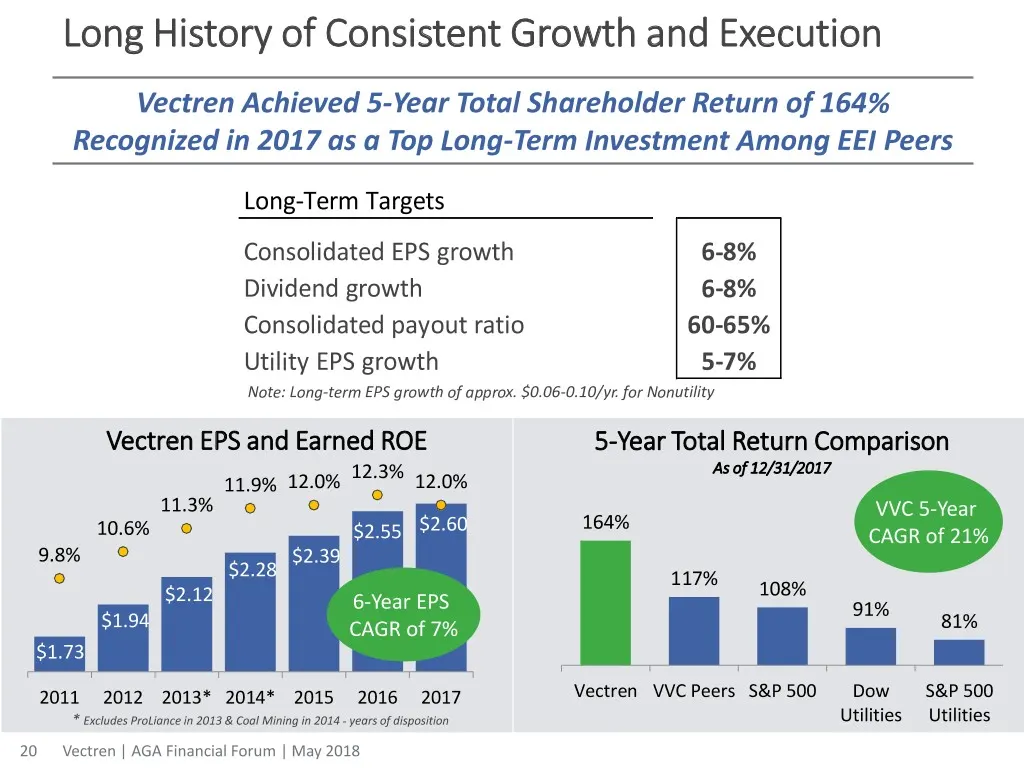
Long History of Consistent Growth and Execution Vectren Achieved 5-Year Total Shareholder Return of 164% Recognized in 2017 as a Top Long-Term Investment Among EEI Peers Long-Term Targets Consolidated EPS growth 6-8% Dividend growth 6-8% Consolidated payout ratio 60-65% Utility EPS growth 5-7% Note:
Slide 21: Long-Term Outlook Remains Strong
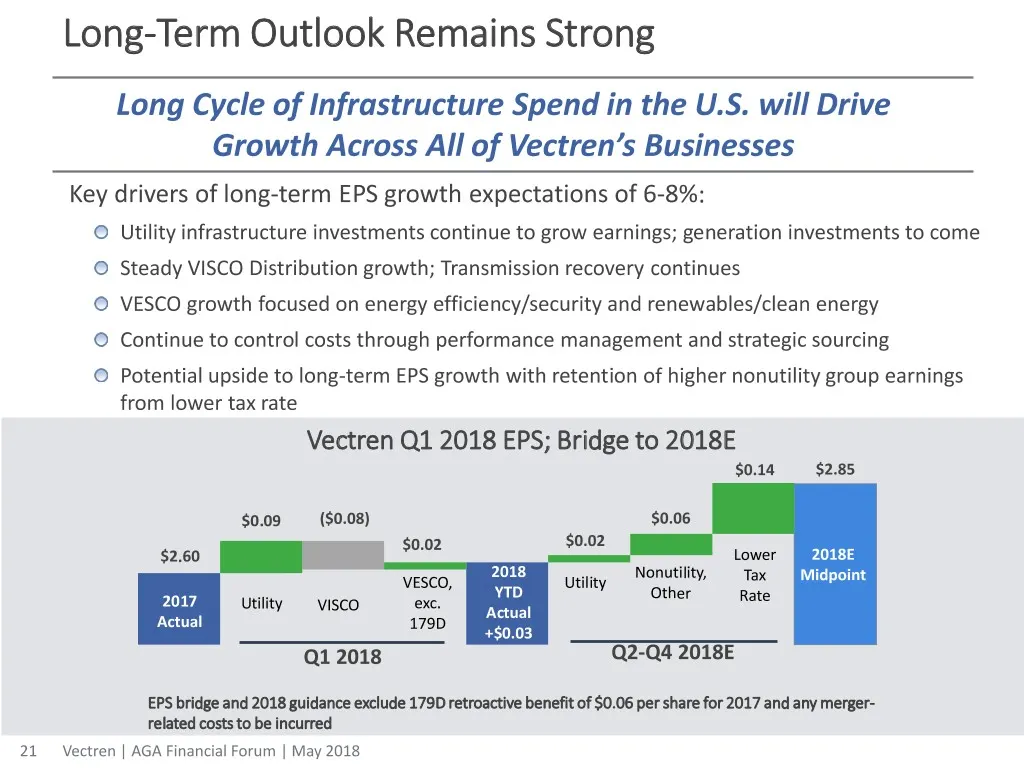
Long-Term Outlook Remains Strong Long Cycle of Infrastructure Spend in the U.S. will Drive Growth Across All of Vectren’s Businesses Key drivers of long-term EPS growth expectations of 6-8%: Utility infrastructure investments continue to grow earnings; generation investments to come Steady VISCO Dis
Slide 22: Long History of Dividend Stability and Growth
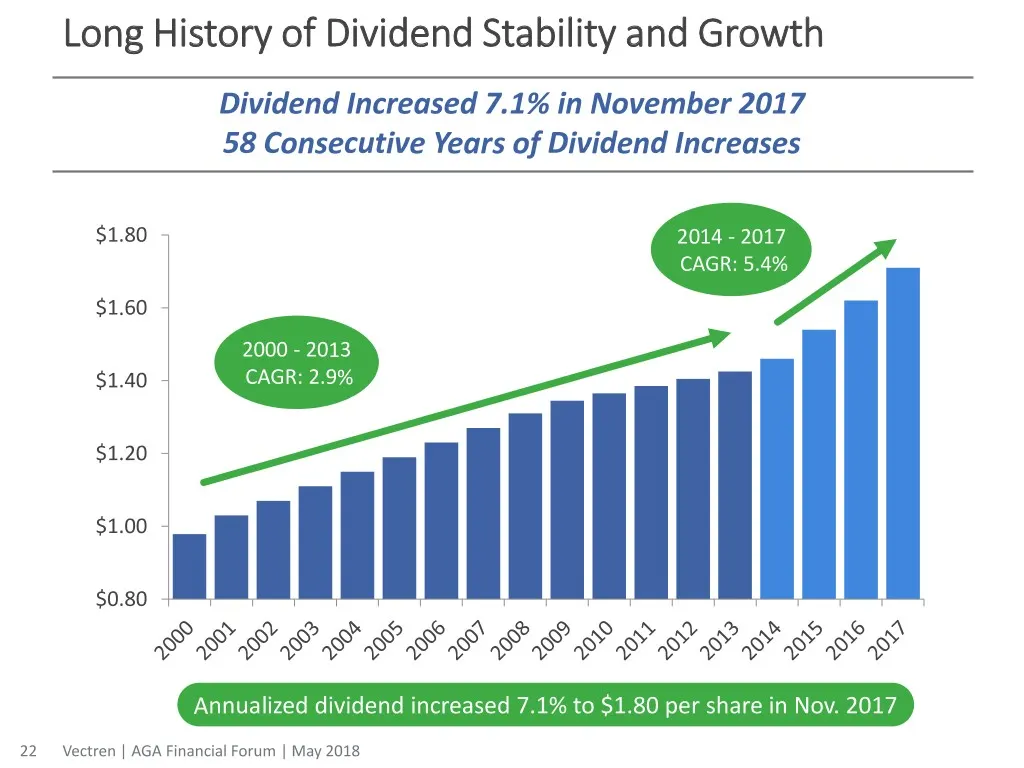
Long History of Dividend Stability and Growth Dividend Increased 7.1% in November 2017 58 Consecutive Years of Dividend Increases $1.80 2014 - 2017 CAGR: 5.4% $1.60 2000 - 2013 $1.40 CAGR: 2.9% $1.20 $1.00 $0.80 Annualized dividend increased 7.1% to $1.80 per share in Nov. 2017 22 Vectren | AGA Fina
Slide 23: Merger Summary
Merger Summary
Slide 24: Vectren and CenterPoint Merger Transaction Overview
Vectren and CenterPoint Merger Transaction Overview – Announced April 23, 2018 CenterPoint Energy, Inc. and Vectren Corporation to combine: $27 billion total enterprise value and nearly $29 billion in combined assets • Cash consideration of $72 per share, plus assumed debt • Approximately 83.1 milli
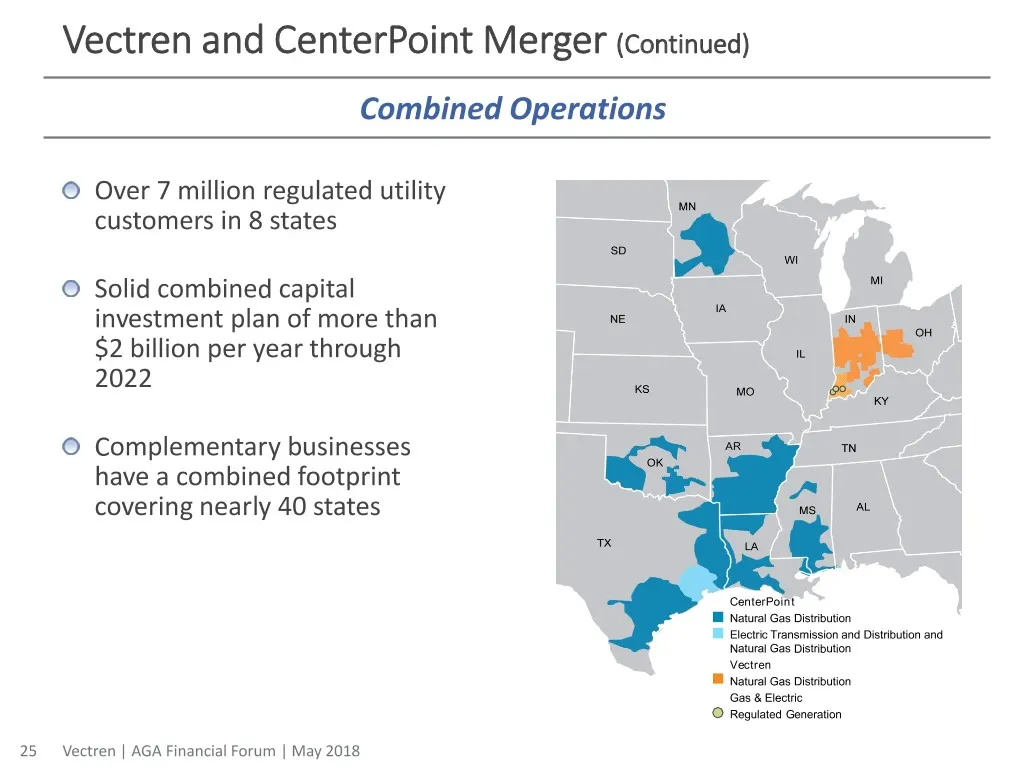
Slide 25: Vectren and CenterPoint Merger (Continued) Combined Operations
Vectren and CenterPoint Merger (Continued) Combined Operations Over 7 million regulated utility customers in 8 states Solid combined capital investment plan of more than $2 billion per year through 2022 Complementary businesses have a combined footprint covering nearly 40 states CenterPoint Natural
Slide 26: Vectren and CenterPoint Merger (Continued) Transaction Rationale
Vectren and CenterPoint Merger (Continued) Transaction Rationale Complementary Capabilities • Combining the Vectren and CenterPoint utilities positions the company as a customer-centric, technology-focused utility of the future – CenterPoint experience with smart meters, intelligent grid, data manag
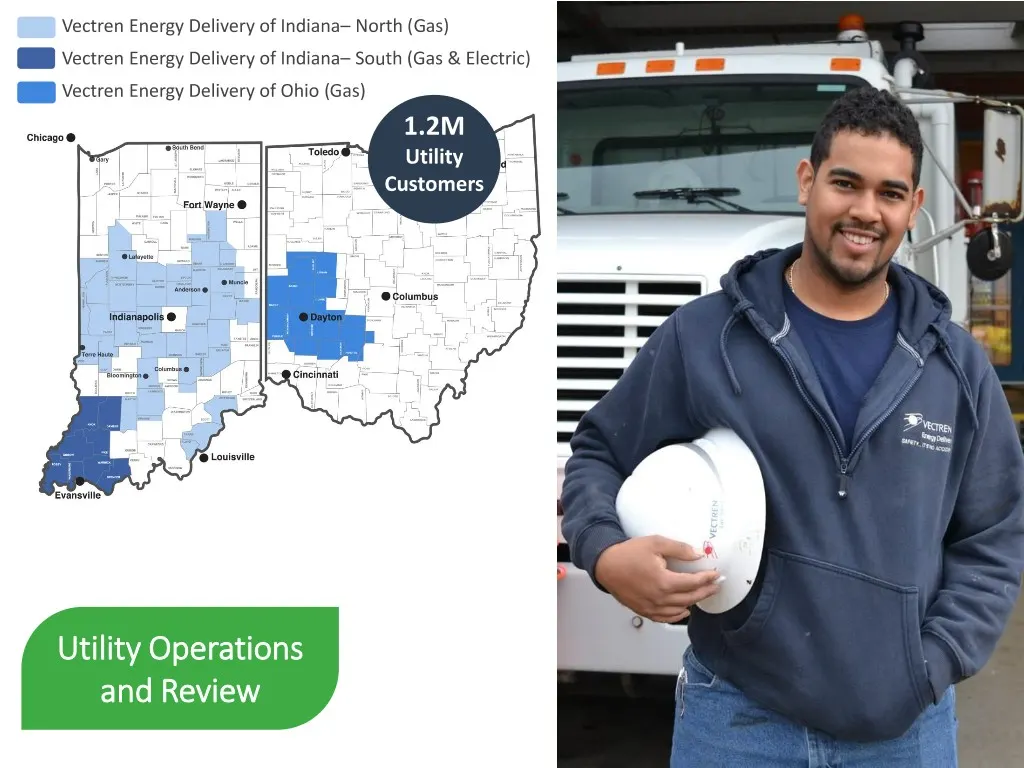
Slide 27: Utility Operations and Review
Vectren Energy Delivery of Indiana– North (Gas) Vectren Energy Delivery of Indiana– South (Gas & Electric) Vectren Energy Delivery of Ohio (Gas) 1.2M Utility Customers Utility Operations and Review
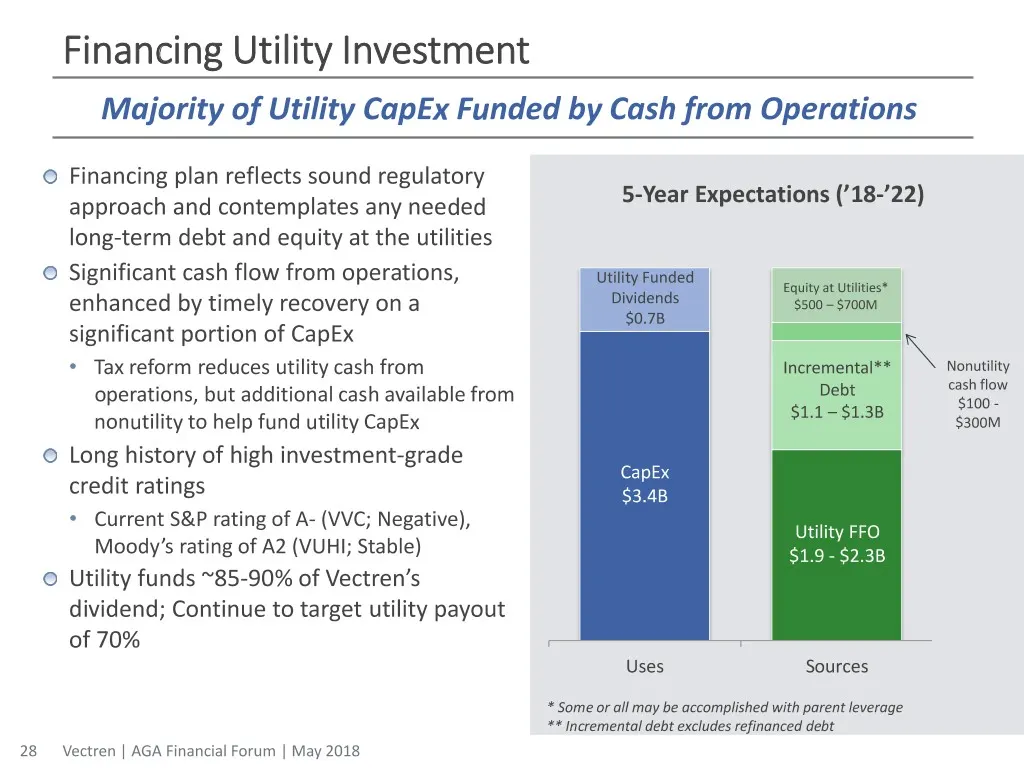
Slide 28: Financing Utility Investment
Financing Utility Investment Majority of Utility CapEx Funded by Cash from Operations Financing plan reflects sound regulatory approach and contemplates any needed 5-Year Expectations (’18-’22) long-term debt and equity at the utilities Significant cash flow from operations, Utility Funded Equity at
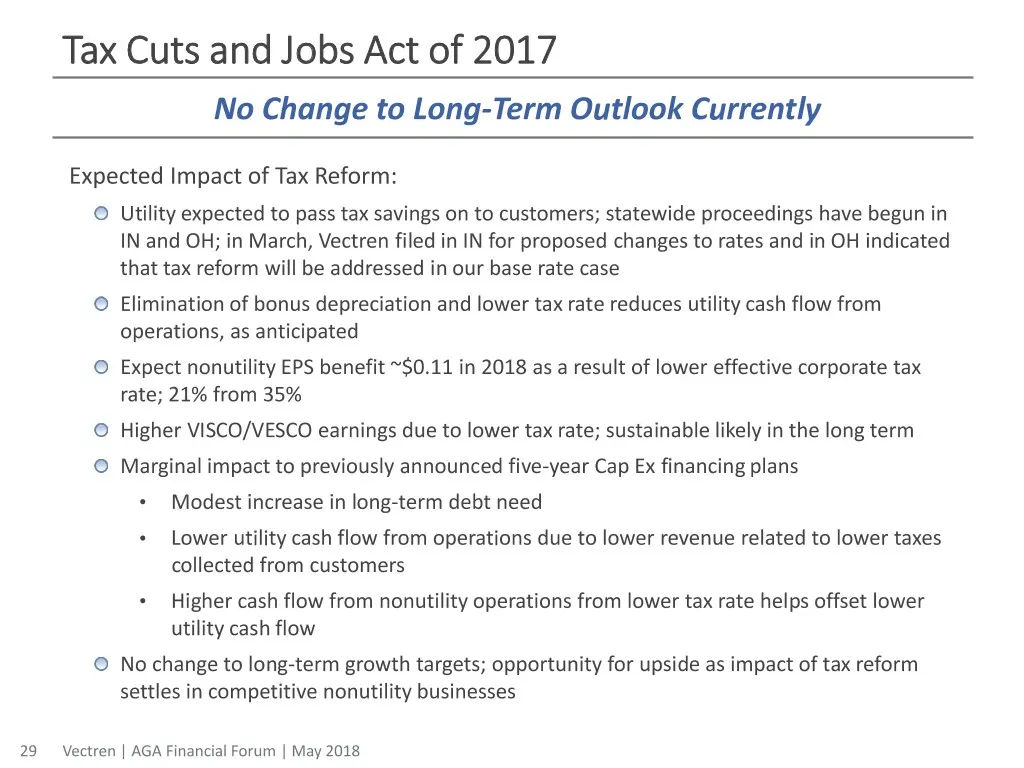
Slide 29: Tax Cuts and Jobs Act of 2017
Tax Cuts and Jobs Act of 2017 No Change to Long-Term Outlook Currently Expected Impact of Tax Reform: Utility expected to pass tax savings on to customers; statewide proceedings have begun in IN and OH; in March, Vectren filed in IN for proposed changes to rates and in OH indicated that tax reform w
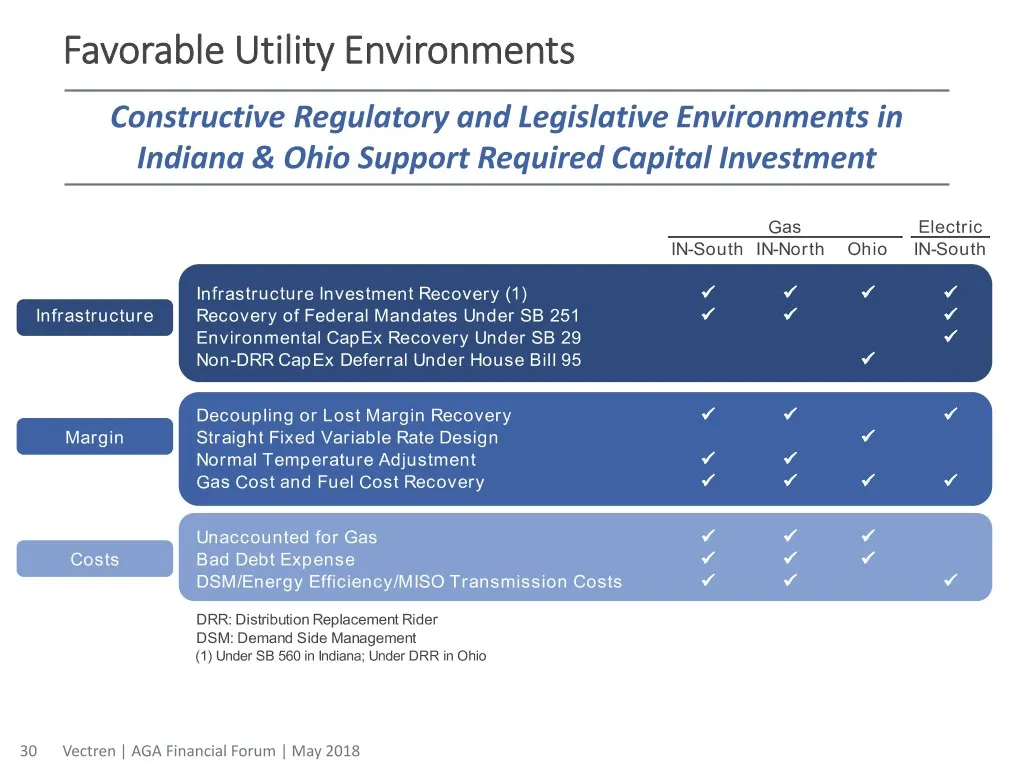
Slide 30: Favorable Utility Environments
Favorable Utility Environments Constructive Regulatory and Legislative Environments in Indiana & Ohio Support Required Capital Investment Gas Electric IN-South IN-North Ohio IN-South Infrastructure Investment Recovery (1) Infrastructure Recovery of Federal Mandates Under SB 251 Environ
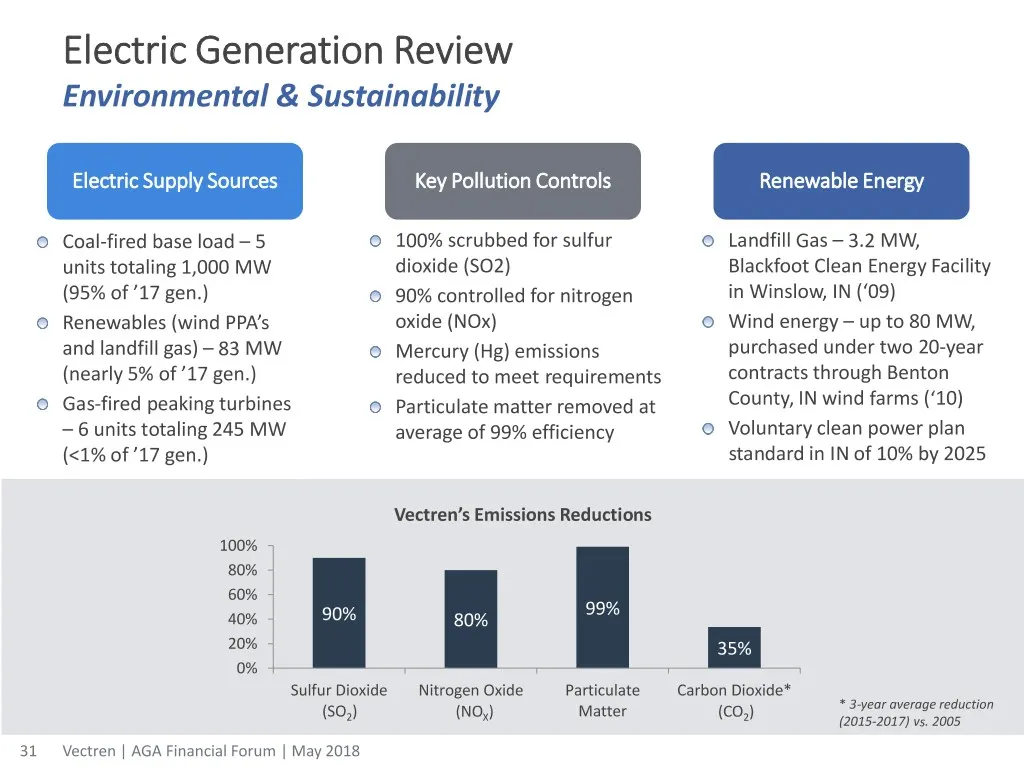
Slide 31: Electric Generation Review: Environmental & Sustainability
Electric Generation Review Environmental & Sustainability Electric Supply Sources Key Pollution Controls Renewable Energy Coal-fired base load – 5 100% scrubbed for sulfur Landfill Gas – 3.2 MW, units totaling 1,000 MW dioxide (SO2) Blackfoot Clean Energy Facility (95% of ’17 gen.) 90% controlled fo
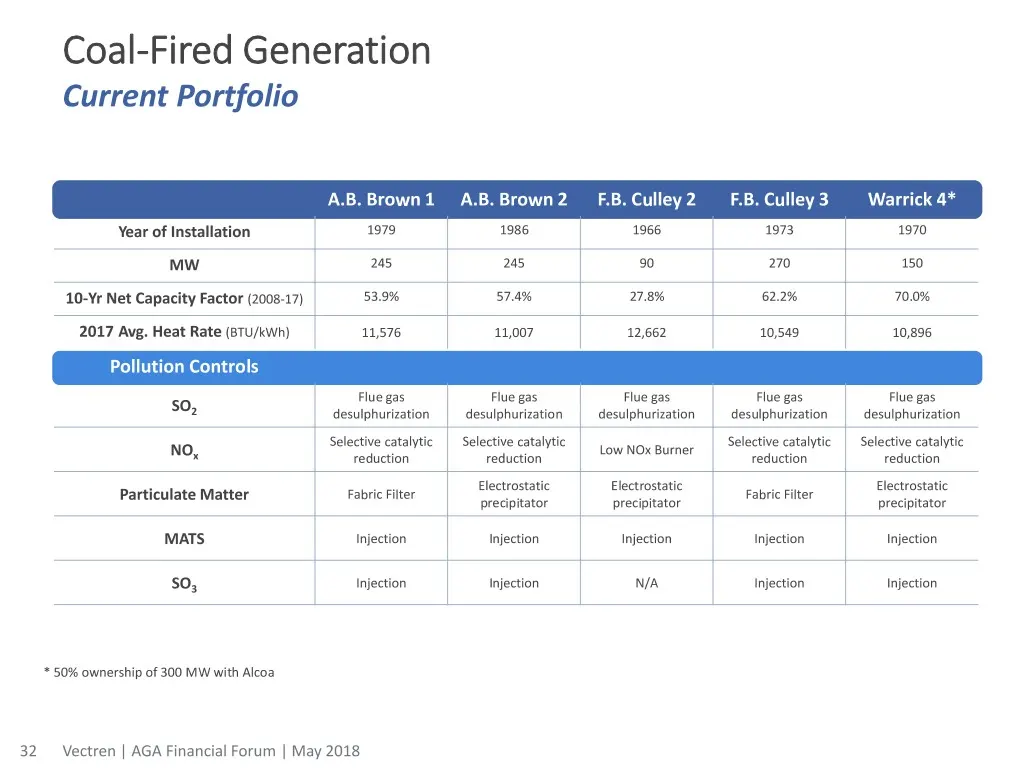
Slide 32: Coal-Fired Generation Current Portfolio
Coal-Fired Generation Current Portfolio A.B. Brown 1 A.B. Brown 2 F.B. Culley 2 F.B. Culley 3 Warrick 4* Year of Installation 1979 1986 1966 1973 1970 MW 245 245 90 270 150 10-Yr Net Capacity Factor (2008-17) 53.9% 57.4% 27.8% 62.2% 70.0% 2017 Avg. Heat Rate (BTU/kWh) 11,576 11,007 12,662 10,549 10,
Slide 33: Utility Metrics
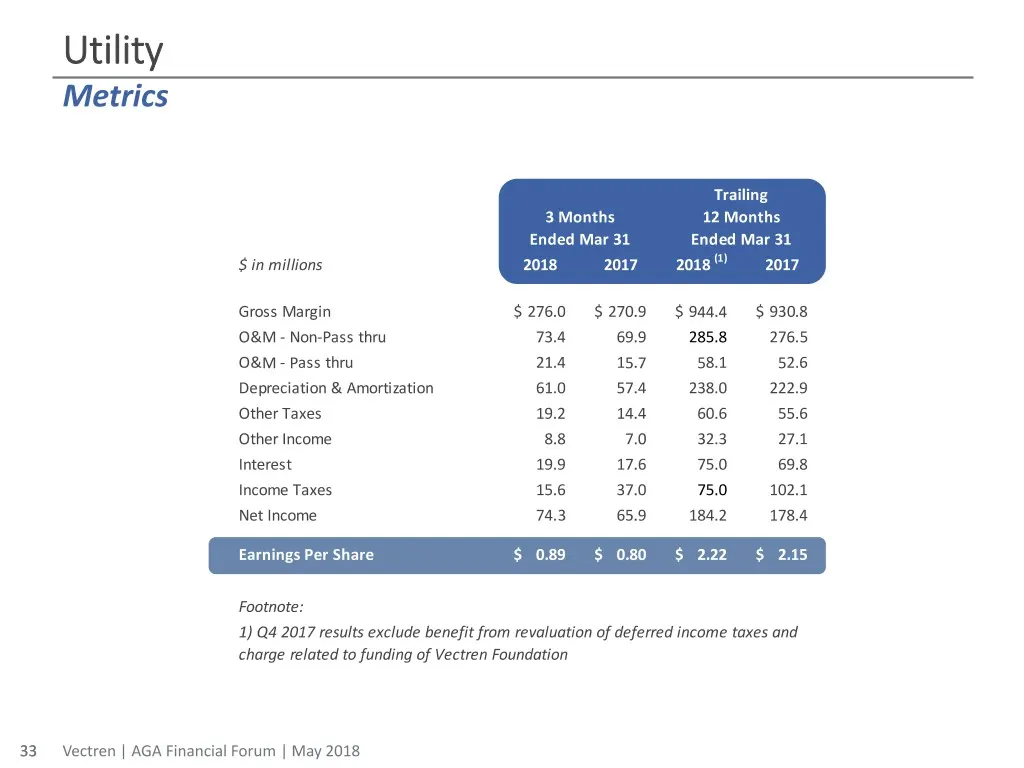
Utility Metrics Trailing 3 Months 12 Months Ended Mar 31 Ended Mar 31 $ in millions 2018 2017 2018 (1) 2017 Gross Margin $ 276.0 $ 270.9 $ 944.4 $ 930.8 O&M - Non-Pass thru 73.4 69.9 285.8 276.5 O&M - Pass thru 21.4 15.7 58.1 52.6 Depreciation & Amortization 61.0 57.4 238.0 222.9 Other Taxes 19.2 14
Slide 34: Utility Metrics 2018E Guidance
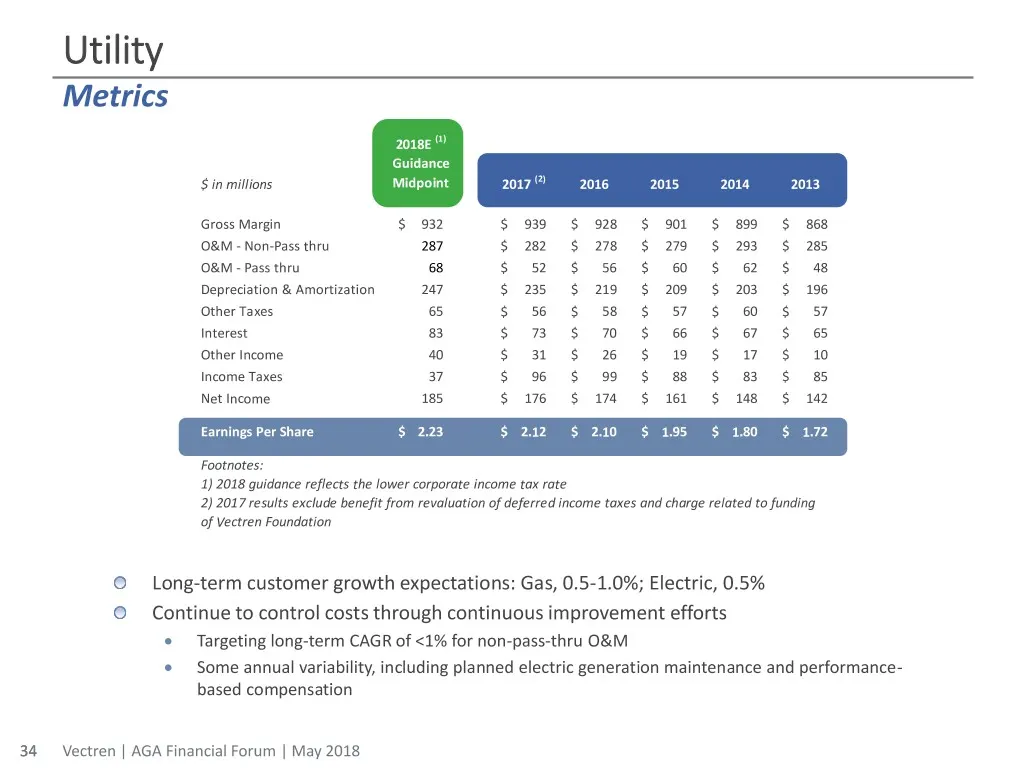
Utility Metrics 2018E (1) Guidance $ in millions Midpoint 2017 (2) 2016 2015 2014 2013 Gross Margin $ 932 $ 939 $ 928 $ 901 $ 899 $ 868 O&M - Non-Pass thru 287 $ 282 $ 278 $ 279 $ 293 $ 285 O&M - Pass thru 68 $ 52 $ 56 $ 60 $ 62 $ 48 Depreciation & Amortization 247 $ 235 $ 219 $ 209 $ 203 $ 196 Othe
Slide 35: Nonutility Review
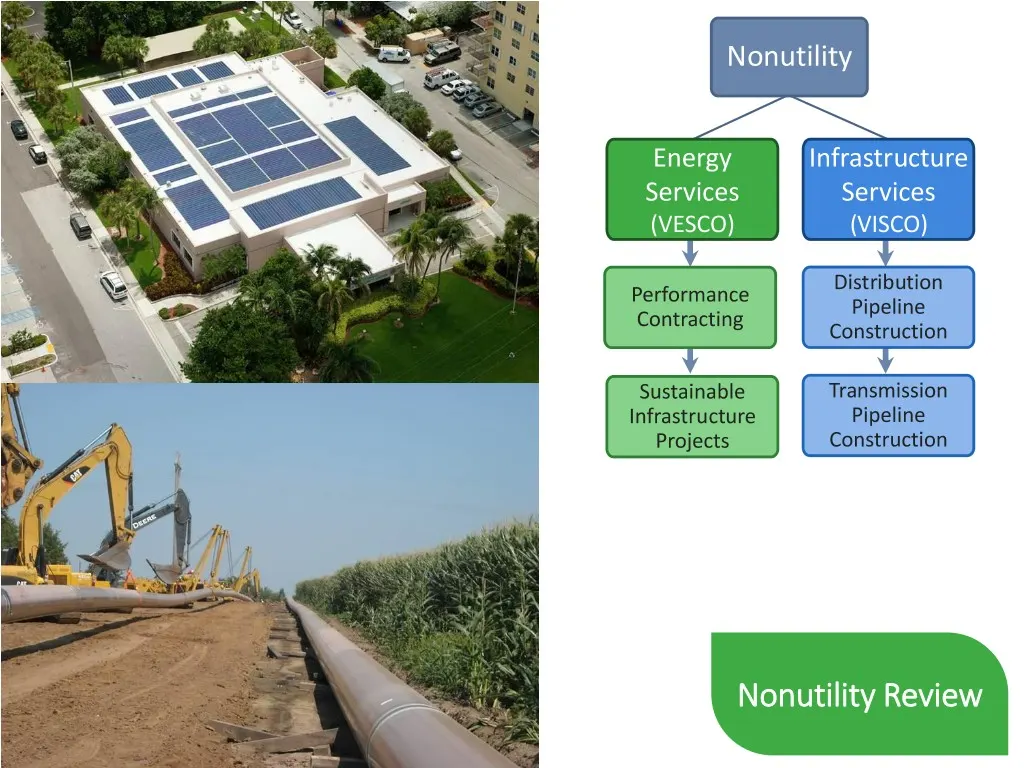
Nonutility Energy Infrastructure Services Services (VESCO) (VISCO) Distribution Performance Pipeline Contracting Construction Sustainable Transmission Infrastructure Pipeline Projects Construction Nonutility Review 35 Vectren | AGA Financial Forum | May 2018
Slide 36: VISCO 2018 Outlook
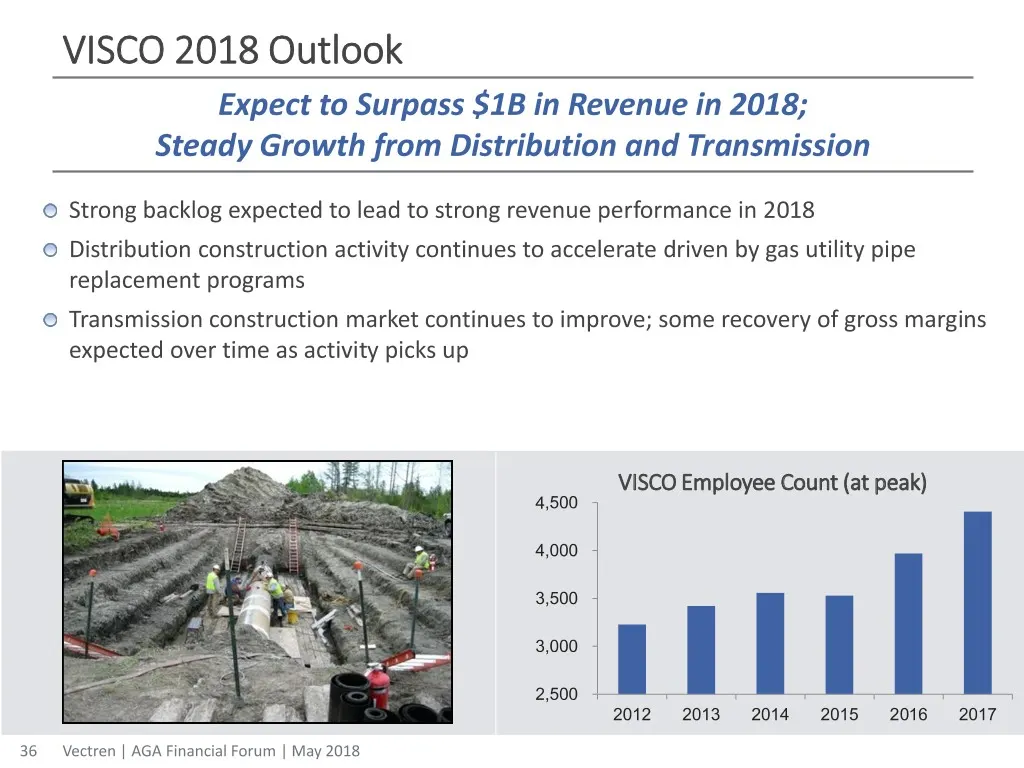
VISCO 2018 Outlook Expect to Surpass $1B in Revenue in 2018; Steady Growth from Distribution and Transmission Strong backlog expected to lead to strong revenue performance in 2018 Distribution construction activity continues to accelerate driven by gas utility pipe replacement programs Transmission
Slide 37: VESCO 2018 Outlook
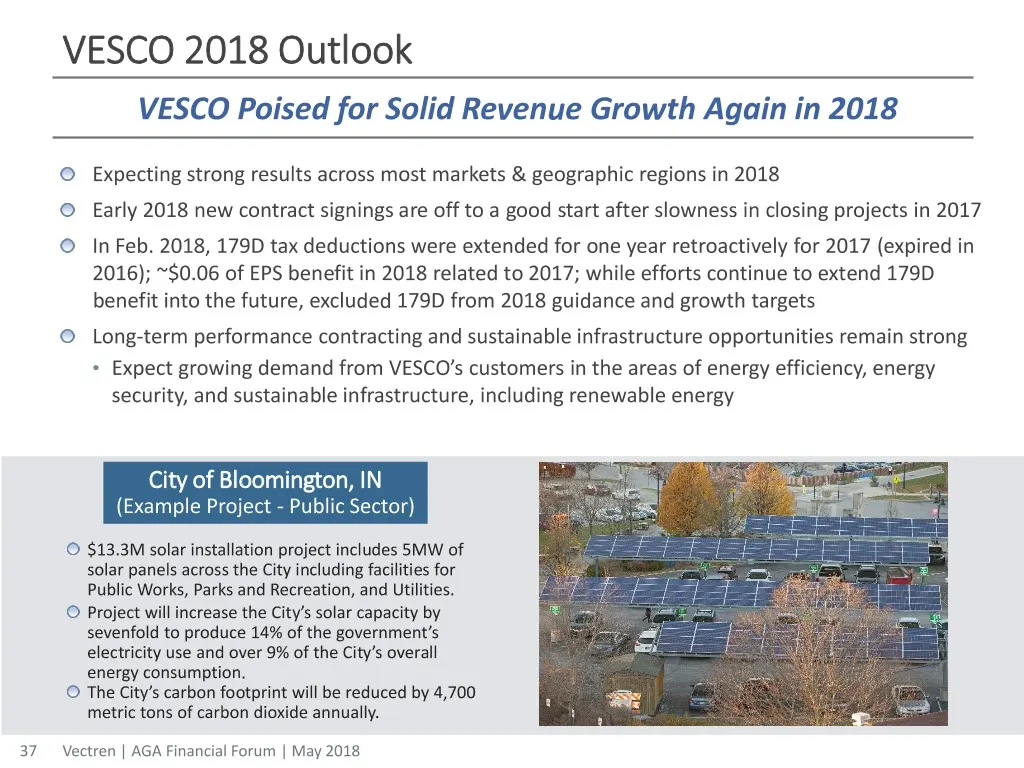
VESCO 2018 Outlook VESCO Poised for Solid Revenue Growth Again in 2018 Expecting strong results across most markets & geographic regions in 2018 Early 2018 new contract signings are off to a good start after slowness in closing projects in 2017 In Feb. 2018, 179D tax deductions were extended for one
Slide 38: Infrastructure Services (VISCO) Metrics
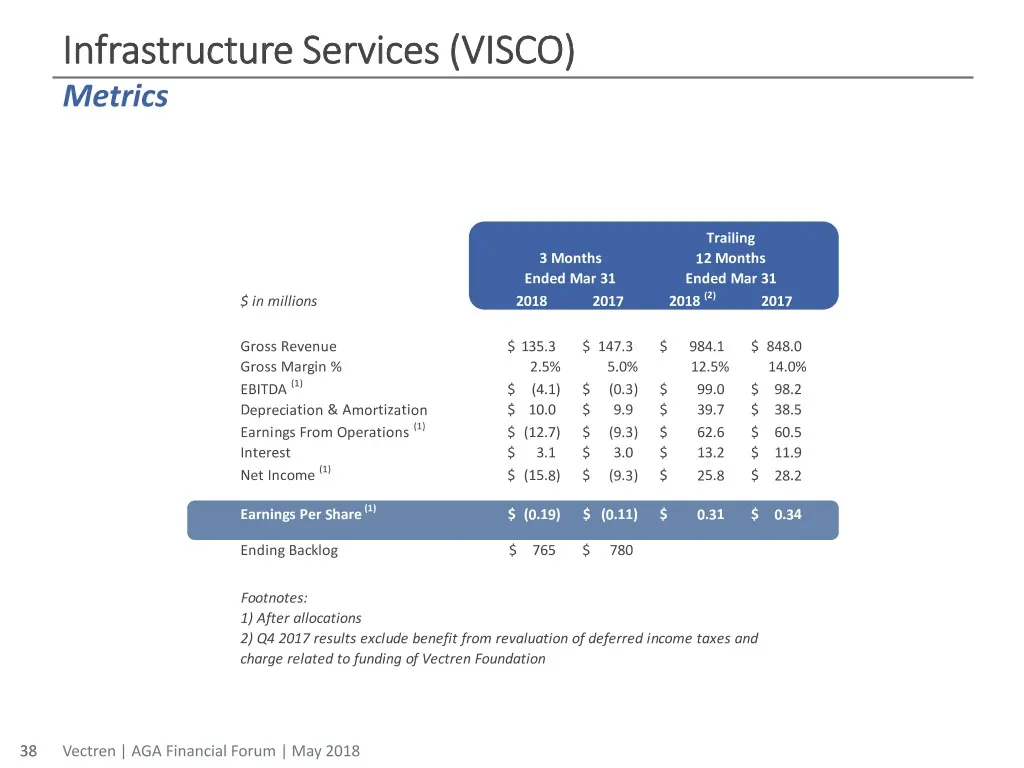
Infrastructure Services (VISCO) Metrics Trailing 3 Months 12 Months Ended Mar 31 Ended Mar 31 $ in millions 2018 2017 2018 (2) 2017 Gross Revenue $ 135.3 $ 147.3 $ 984.1 $ 848.0 Gross Margin % 2.5% 5.0% 12.5% 14.0% EBITDA (1) $ (4.1) $ (0.3) $ 99.0 $ 98.2 Depreciation & Amortization $ 10.0 $ 9.9 $ 3
Slide 39: Infrastructure Services (VISCO) Metrics 2018E Guidance
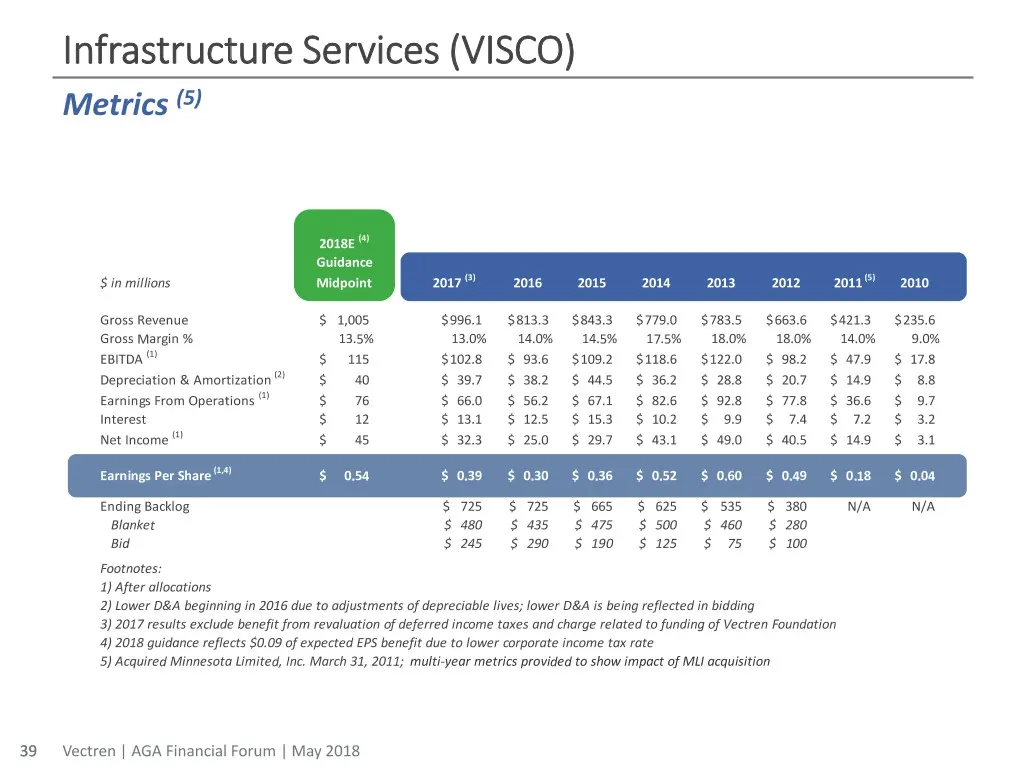
Infrastructure Services (VISCO) Metrics (5) 2018E (4) Guidance $ in millions Midpoint 2017 (3) 2016 2015 2014 2013 2012 2011 (5) 2010 Gross Revenue $ 1,005 $ 996.1 $ 813.3 $ 843.3 $ 779.0 $ 783.5 $ 663.6 $ 421.3 $ 235.6 Gross Margin % 13.5% 13.0% 14.0% 14.5% 17.5% 18.0% 18.0% 14.0% 9.0% EBITDA (1) $
Slide 40: Infrastructure Services (VISCO) Estimated Backlog
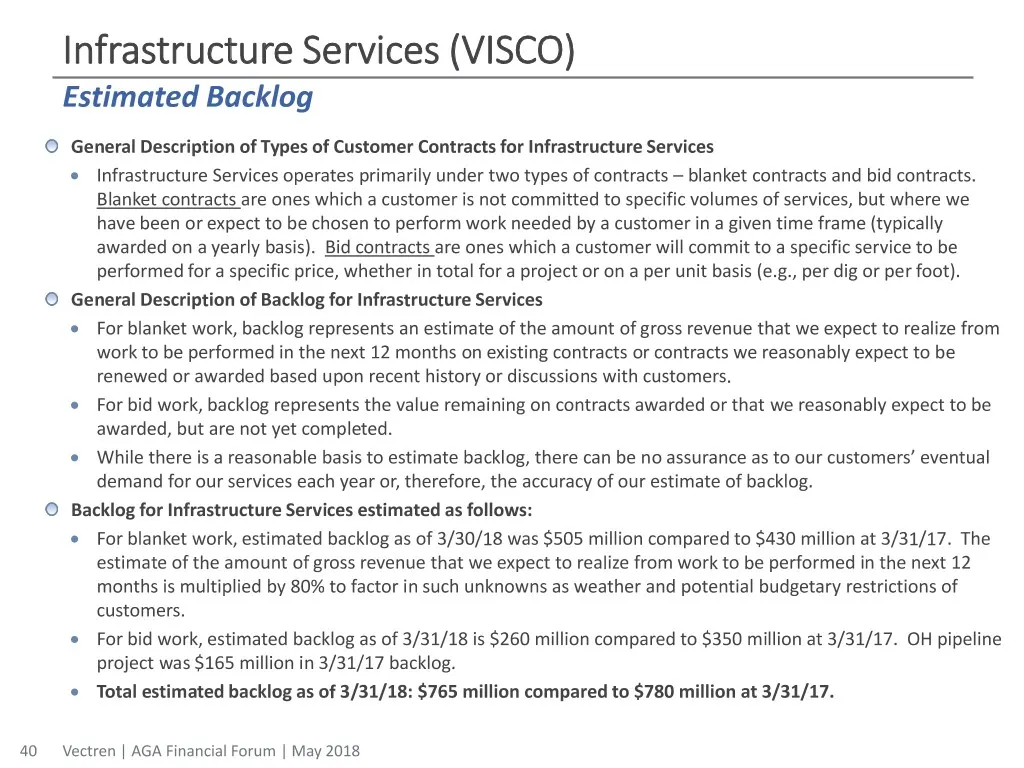
Infrastructure Services (VISCO) Estimated Backlog General Description of Types of Customer Contracts for Infrastructure Services Infrastructure Services operates primarily under two types of contracts – blanket contracts and bid contracts. Blanket contracts are ones which a customer is not committ
Slide 41: Energy Services (VESCO) Metrics
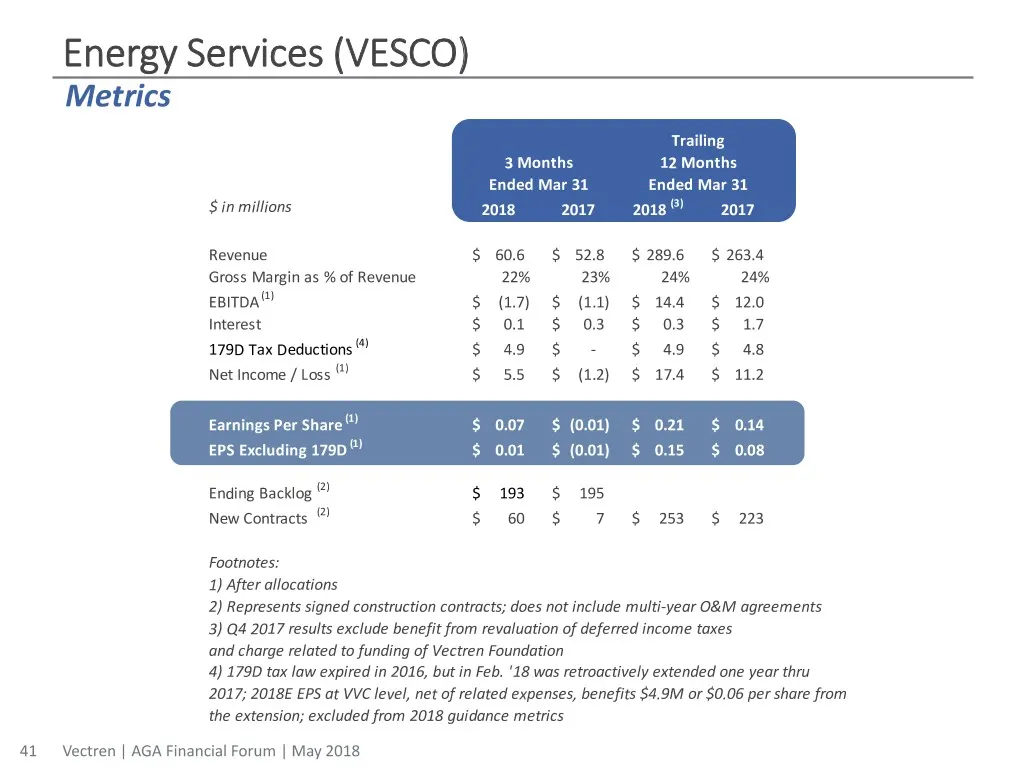
Energy Services (VESCO) Metrics Trailing 3 Months 12 Months Ended Mar 31 Ended Mar 31 $ in millions 2018 2017 2018 (3) 2017 Revenue $ 60.6 $ 52.8 $ 289.6 $ 263.4 Gross Margin as % of Revenue 22% 23% 24% 24% EBITDA (1) $ (1.7) $ (1.1) $ 14.4 $ 12.0 Interest $ 0.1 $ 0.3 $ 0.3 $ 1.7 179D Tax Deductions
Slide 42: Energy Services (VESCO) Metrics 2018E Guidance
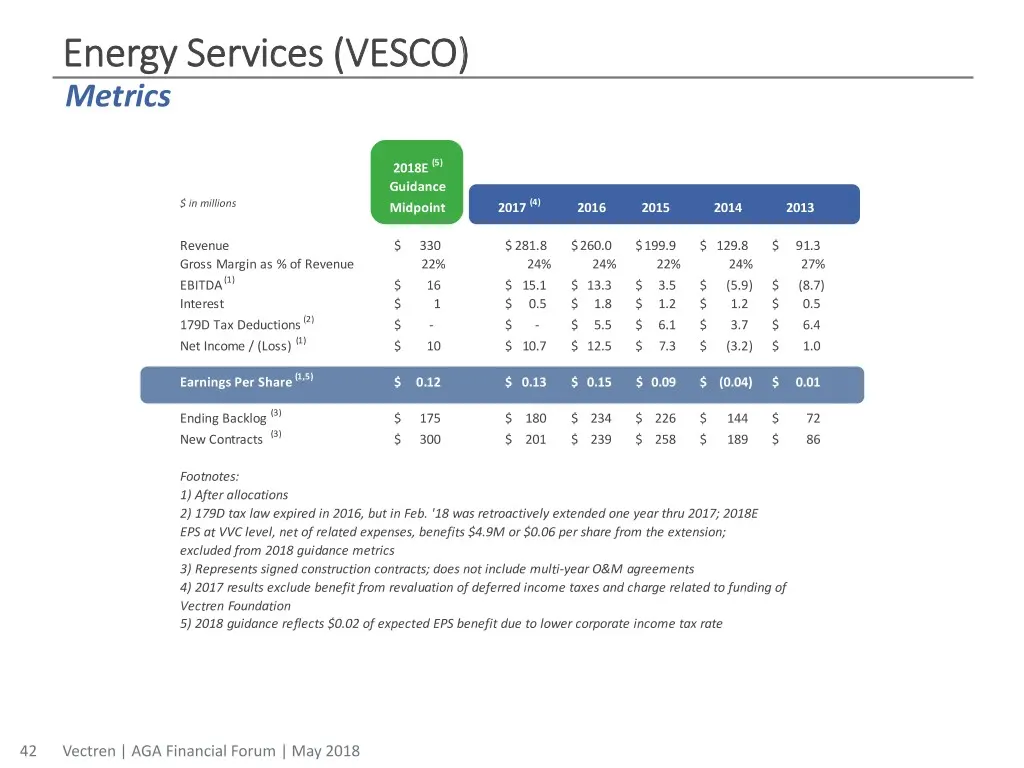
Energy Services (VESCO) Metrics 2018E (5) Guidance $ in millions Midpoint 2017 (4) 2016 2015 2014 2013 Revenue $ 330 $ 281.8 $ 260.0 $ 199.9 $ 129.8 $ 91.3 Gross Margin as % of Revenue 22% 24% 24% 22% 24% 27% EBITDA (1) $ 16 $ 15.1 $ 13.3 $ 3.5 $ (5.9) $ (8.7) Interest $ 1 $ 0.5 $ 1.8 $ 1.2 $ 1.2 $
Slide 43: Appendix
Appendix
Slide 44: State Utility Commissioners
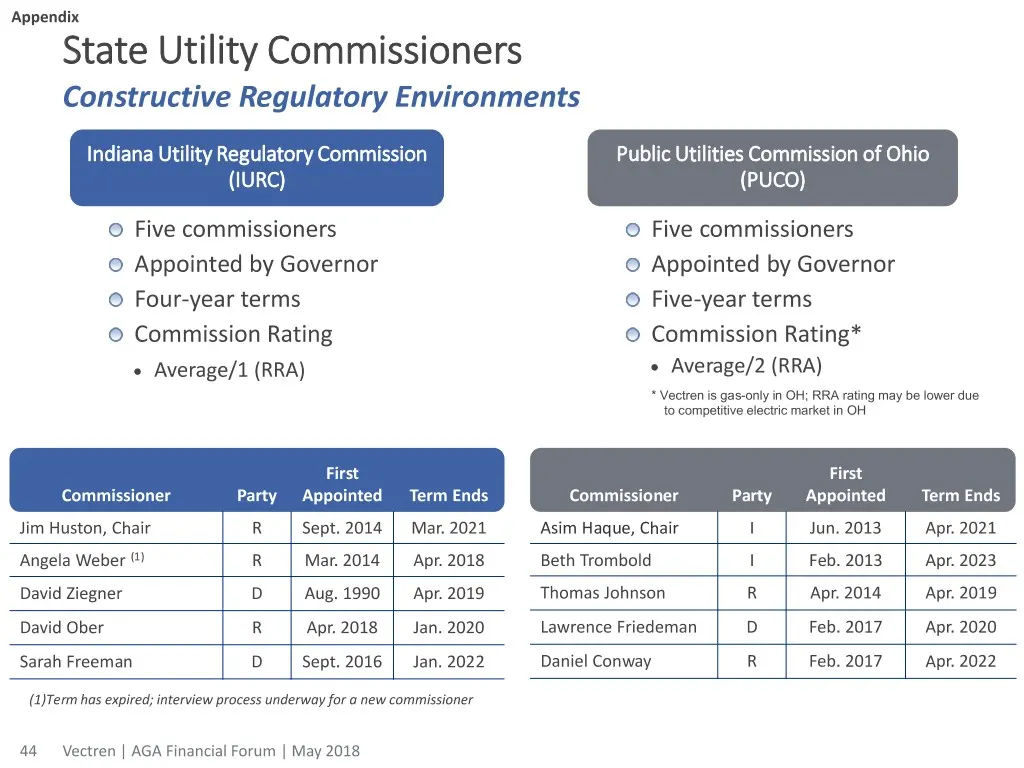
Appendix State Utility Commissioners Constructive Regulatory Environments Indiana Utility Regulatory Commission Public Utilities Commission of Ohio (IURC) (PUCO) Five commissioners Five commissioners Appointed by Governor Appointed by Governor Four-year terms Five-year terms Commission Rating Commis
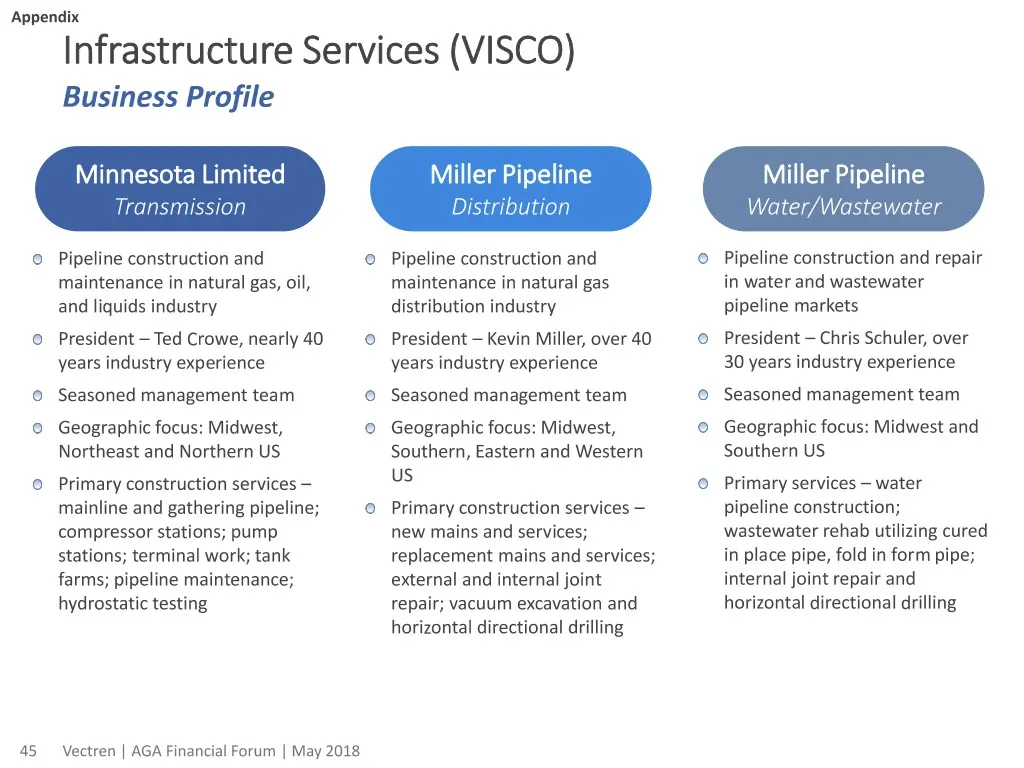
Slide 45: Infrastructure Services (VISCO) Business Profile
Appendix Infrastructure Services (VISCO) Business Profile Minnesota Limited Miller Pipeline Miller Pipeline Transmission Distribution Water/Wastewater Pipeline construction and Pipeline construction and Pipeline construction and repair maintenance in natural gas, oil, maintenance in natural gas in w
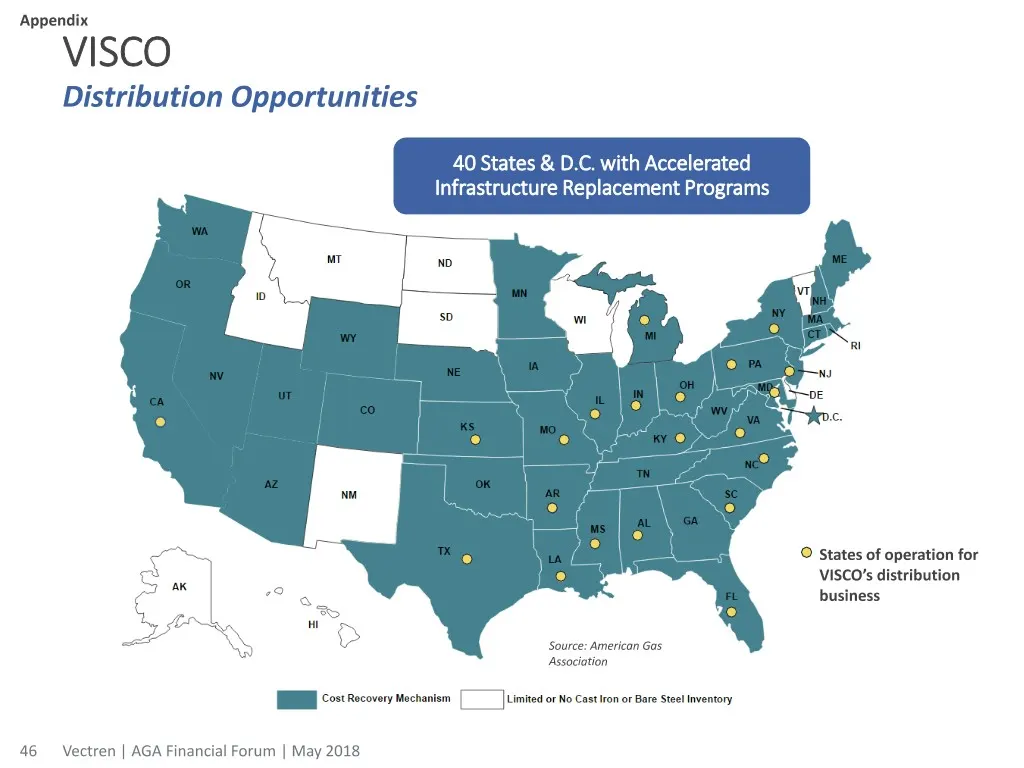
Slide 46: VISCO Distribution Opportunities
Appendix VISCO Distribution Opportunities 40 States & D.C. with Accelerated Infrastructure Replacement Programs States of operation for VISCO’s distribution business Source: American Gas Association 46 Vectren | AGA Financial Forum | May 2018
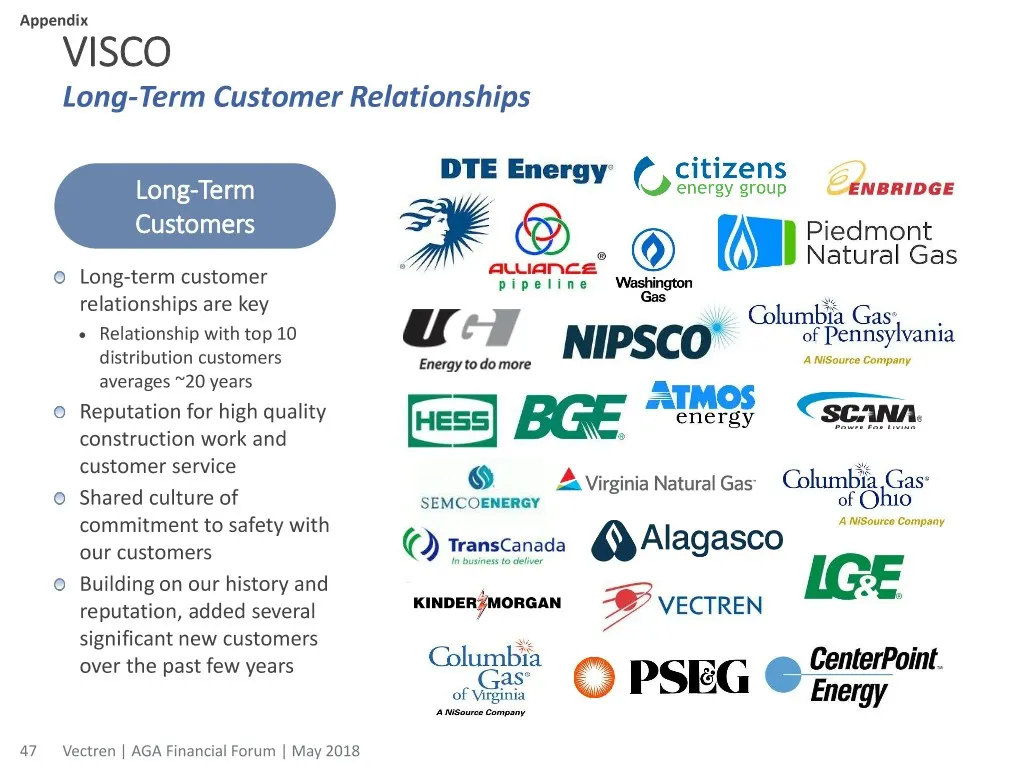
Slide 47: VISCO Long-Term Customer Relationships
Appendix VISCO Long-Term Customer Relationships Long-Term Customers Long-term customer relationships are key Relationship with top 10 distribution customers averages ~20 years Reputation for high quality construction work and customer service Shared culture of commitment to safety with our custome
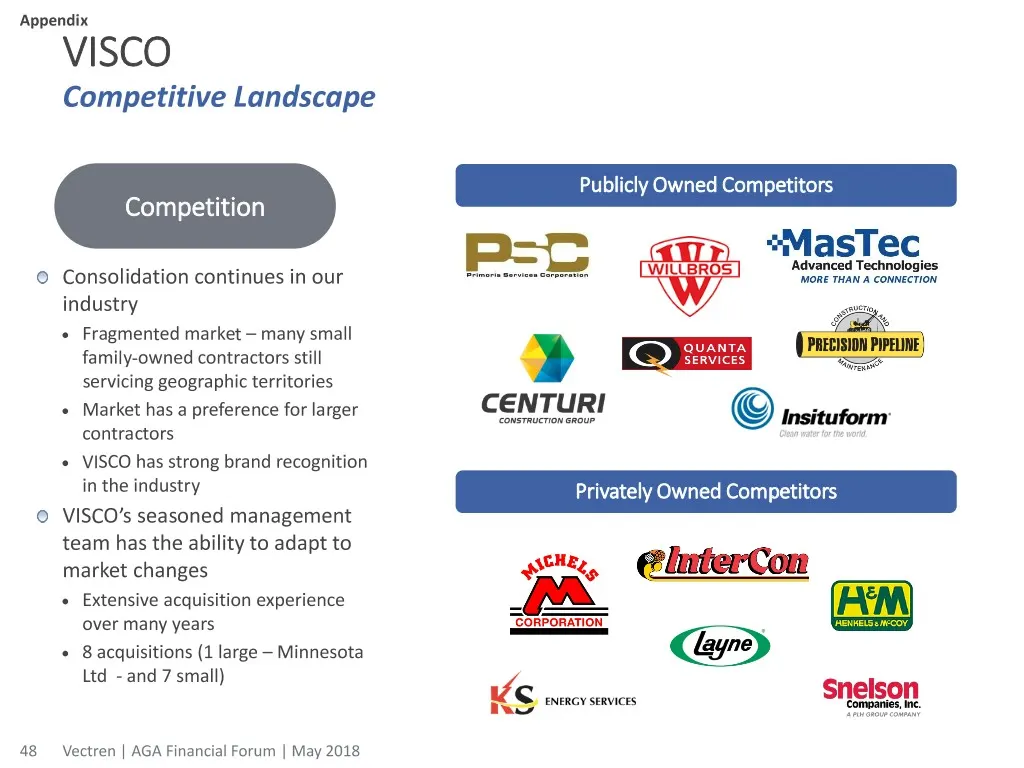
Slide 48: VISCO Competitive Landscape
Appendix VISCO Competitive Landscape Publicly Owned Competitors Competition Consolidation continues in our industry Fragmented market – many small family-owned contractors still servicing geographic territories Market has a preference for larger contractors VISCO has strong brand recognition i
Slide 49: Energy Services (VESCO) Business Profile
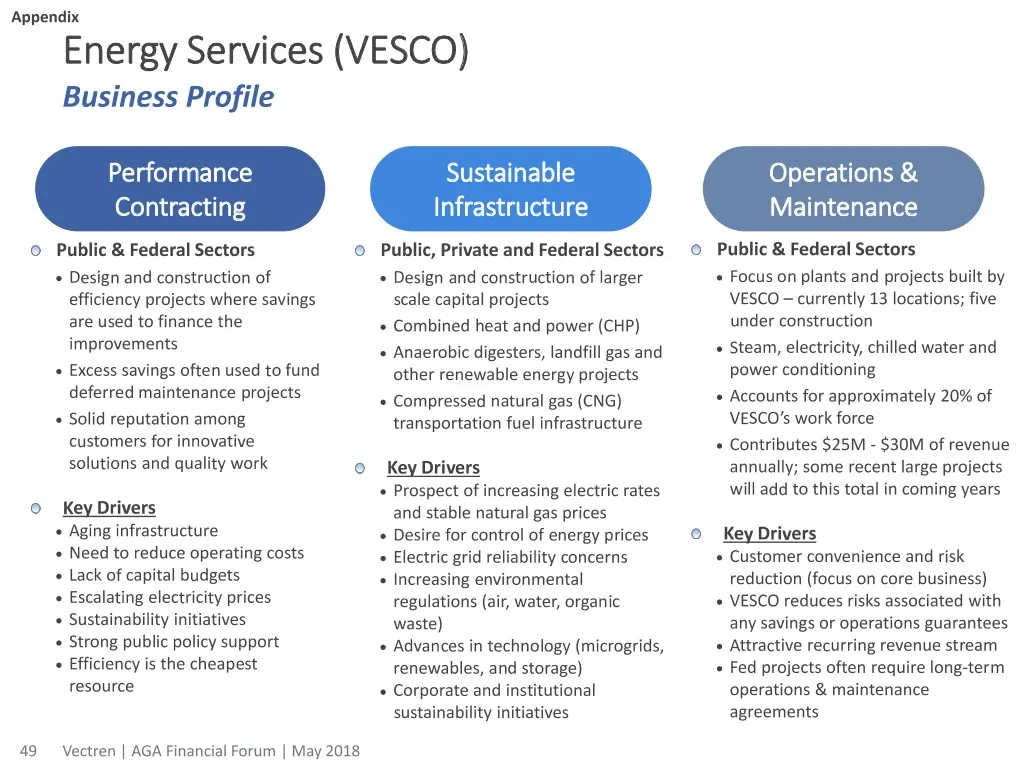
Appendix Energy Services (VESCO) Business Profile Performance Sustainable Operations & Contracting Infrastructure Maintenance Public & Federal Sectors Public, Private and Federal Sectors Public & Federal Sectors Design and construction of Design and construction of larger Focus on plants and p
Slide 50: VESCO At A Glance
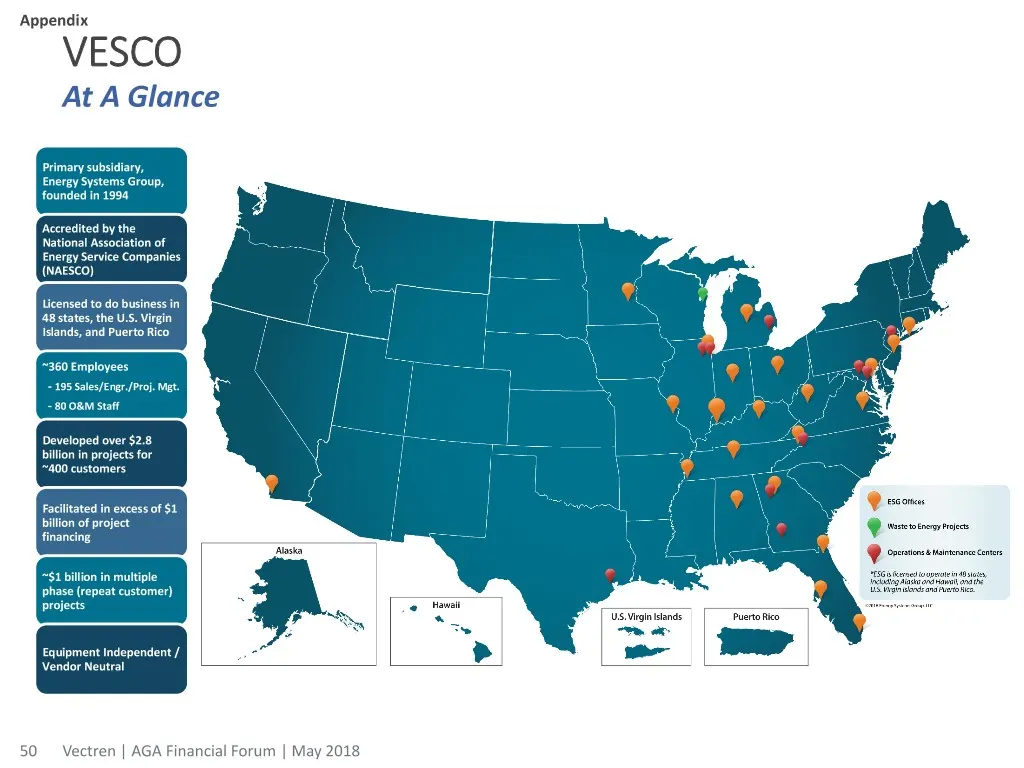
Appendix VESCO At A Glance Primary subsidiary, Energy Systems Group, founded in 1994 Accredited by the National Association of Energy Service Companies (NAESCO) Licensed to do business in 48 states, the U.S. Virgin Islands, and Puerto Rico ~360 Employees - 195 Sales/Engr./Proj. Mgt. - 80 O&M Staff D
Slide 51: VESCO Market Sectors and Customers
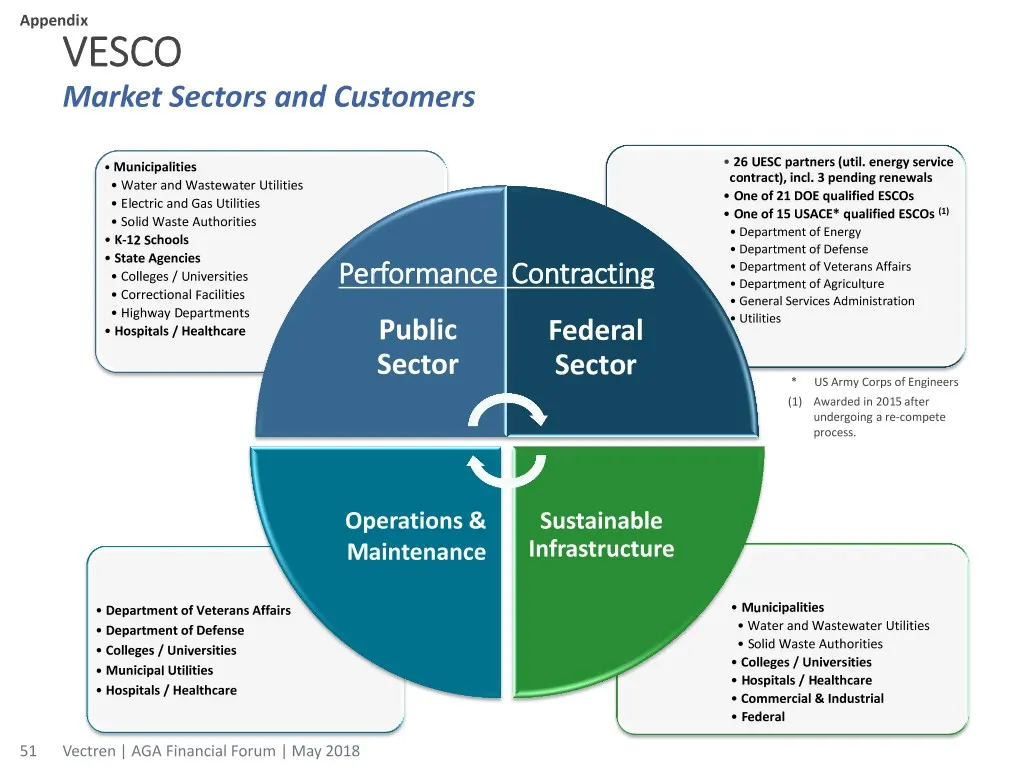
Appendix VESCO Market Sectors and Customers • Municipalities • 26 UESC partners (util. energy service contract), incl. 3 pending renewals • Water and Wastewater Utilities • One of 21 DOE qualified ESCOs • Electric and Gas Utilities • One of 15 USACE* qualified ESCOs (1) • Solid Waste Authorities • D
Slide 52: VESCO Competitive Landscape
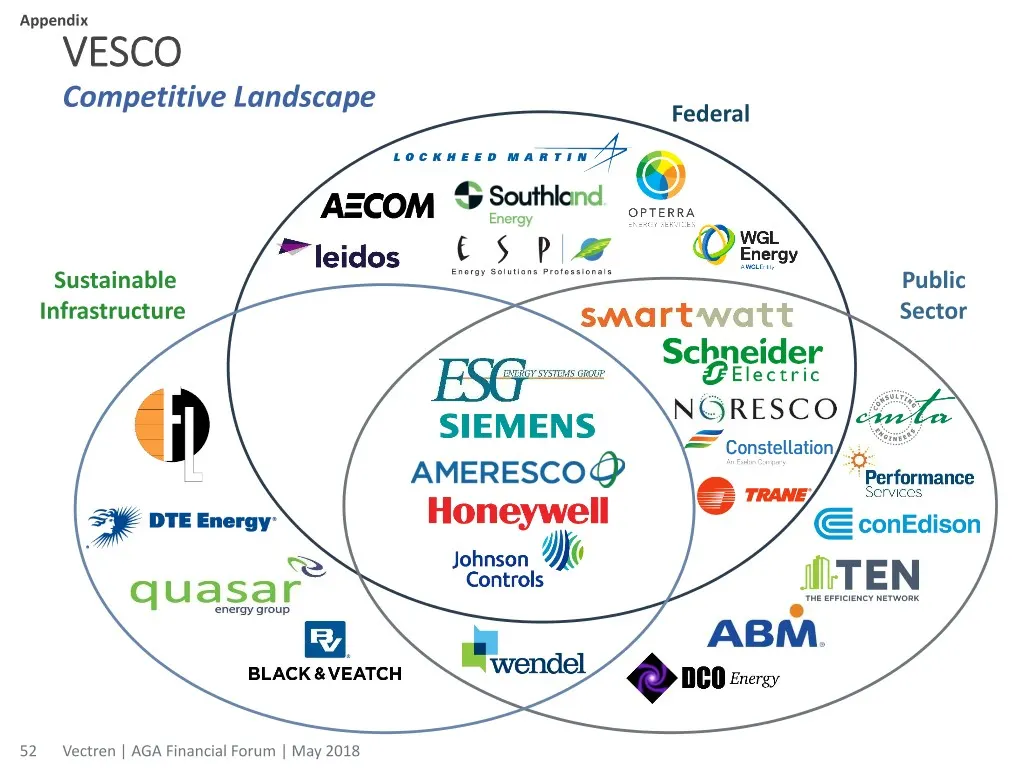
Appendix VESCO Competitive Landscape Federal Sustainable Public Infrastructure Sector 52 Vectren | AGA Financial Forum | May 2018
Slide 53: Key VESCO Projects
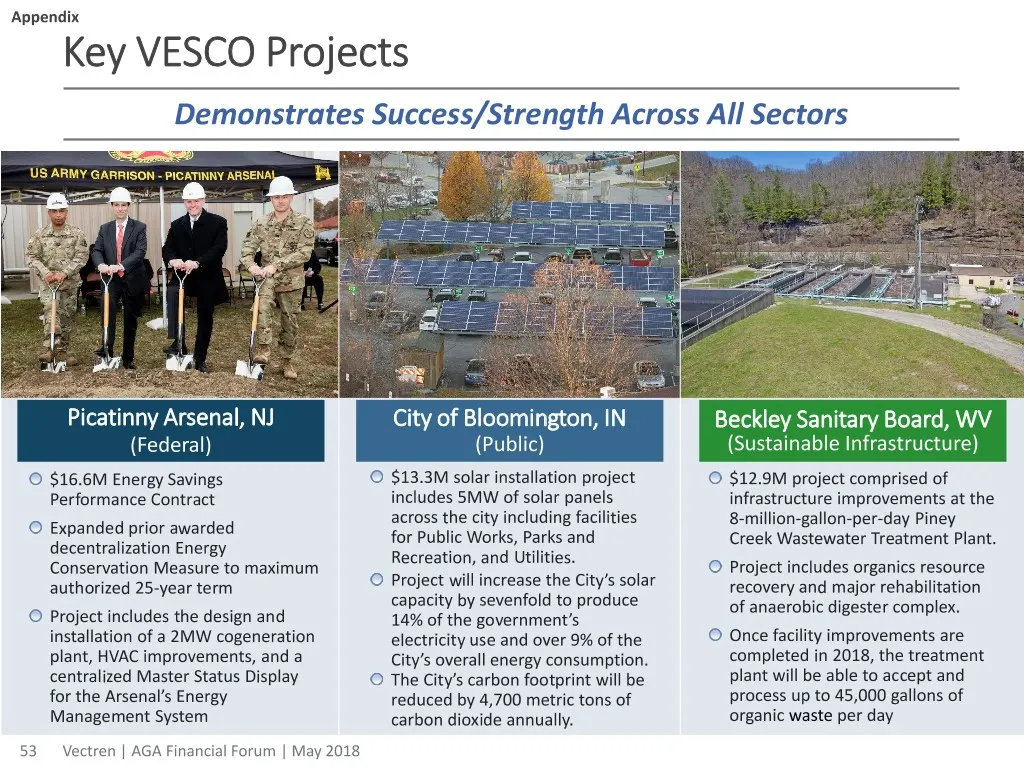
Appendix Key VESCO Projects Demonstrates Success/Strength Across All Sectors Picatinny Arsenal, NJ City of Bloomington, IN Beckley Sanitary Board, WV (Federal) (Public) (Sustainable Infrastructure) $16.6M Energy Savings $13.3M solar installation project $12.9M project comprised of Performance Contra
Slide 54: Tax Reform in 2017: GAAP to Non-GAAP Reconciliation
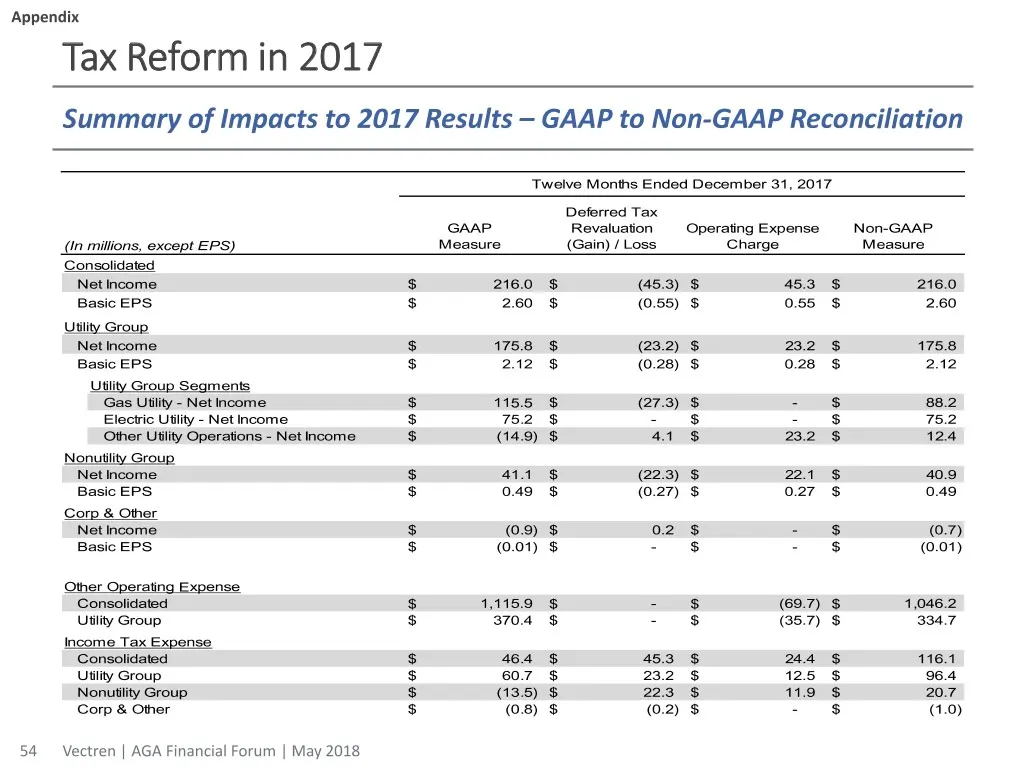
Appendix Tax Reform in 2017 Summary of Impacts to 2017 Results – GAAP to Non-GAAP Reconciliation Twelve Months Ended December 31, 2017 Deferred Tax GAAP Revaluation Operating Expense Non-GAAP (In millions, except EPS) Measure (Gain) / Loss Charge Measure Consolidated Net Income $ 216.0 $ (45.3) $ 45
Slide 55: Use of Non-GAAP Performance Measures and Per Share Measures
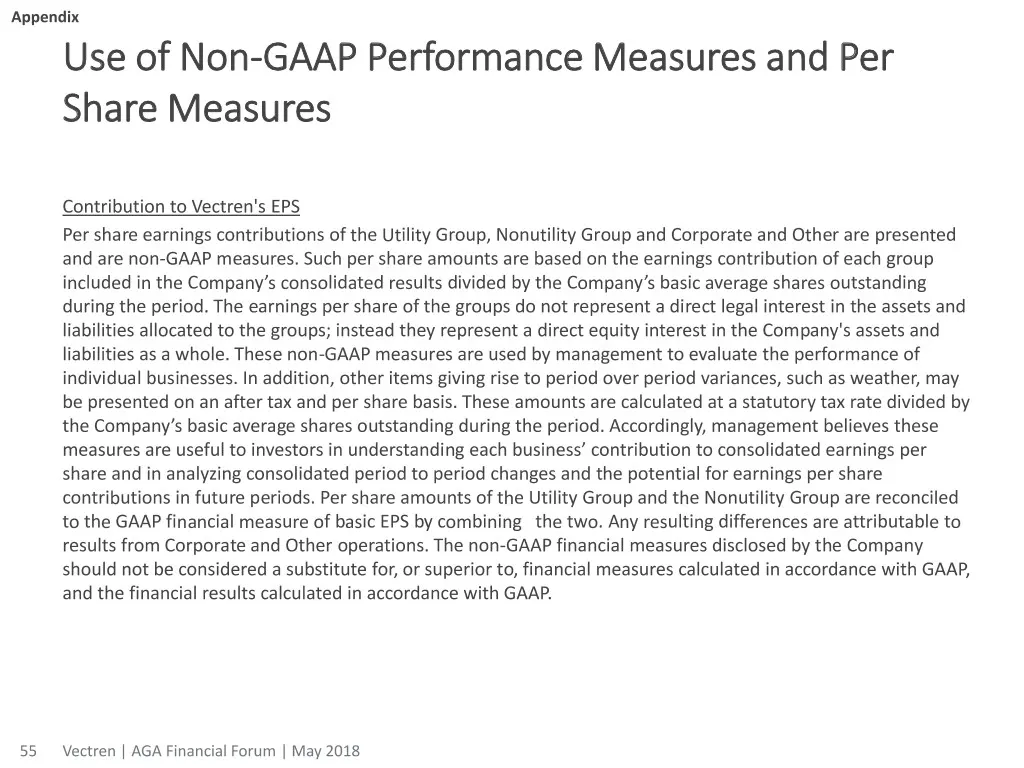
Appendix Use of Non-GAAP Performance Measures and Per Share Measures Contribution to Vectren's EPS Per share earnings contributions of the Utility Group, Nonutility Group and Corporate and Other are presented and are non-GAAP measures. Such per share amounts are based on the earnings contribution of
Source: SEC EDGAR · 8-K filed May 18, 2018
More decks from Vectren Corporation
 Edison Electric Institute Financial Conference 201833 slides · Nov 9, 2018
 Q2 2018 Earnings Presentation31 slides · Aug 3, 2018
 Merger or Acquisition (June 2018)18 slides · Jun 12, 2018
 Q1 2018 Earnings Presentation27 slides · May 4, 2018
 FY2017 Earnings Presentation43 slides · Feb 27, 2018
 Fact Sheet (February 2018)1 slide · February 2018