PowerSecure International — Canaccord Genuity 33rd Annual Growth Conference 2013
28 slides from PowerSecure International's conference presentation, Aug 14, 2013
Slide 1: Canaccord Genuity 33rd Annual Growth Conference
Canaccord Genuity 33rd Annual Growth Conference August 14, 2013 Chris Hutter, Chief Financial Officer
Slide 2: Forward Looking Statements Safe Harbor
Forward Looking Statements Safe Harbor All forward-looking statements made in this presentation are made under the safe harbor provisions of the Private Securities Litigation Reform Act of 1995. Forward-looking statements, which are all statements other than statements of historical facts and includ
Slide 3: PowerSecure: Who We Are
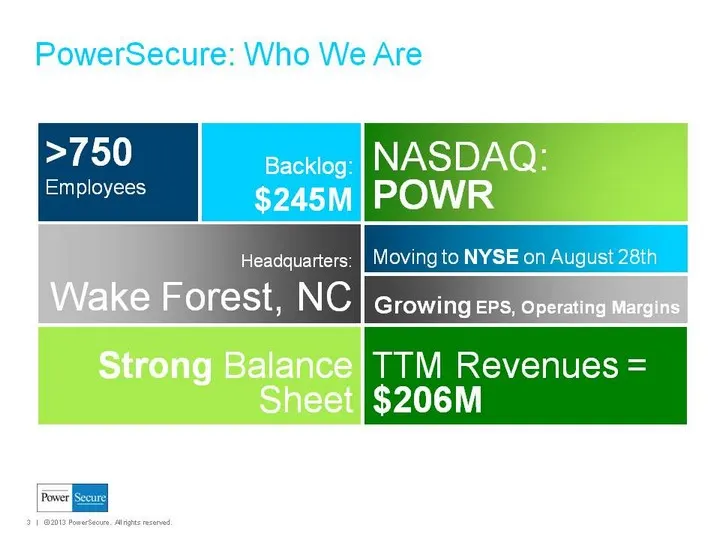
TTM Revenues = $206M PowerSecure: Who We Are Backlog: $245M NASDAQ: POWR >750 Employees Growing EPS, Operating Margins Strong Balance Sheet Moving to NYSE on August 28th Headquarters: Wake Forest, NC
Slide 4: PowerSecure: Utility Focused
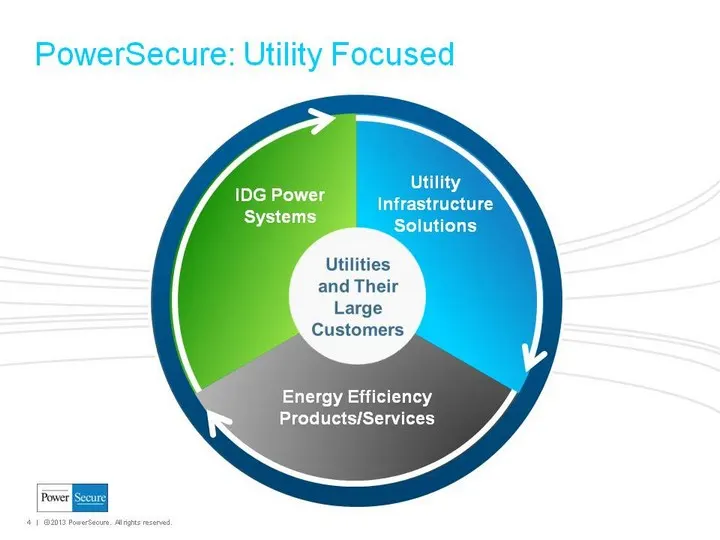
(CHART) PowerSecure: Utility Focused Energy Efficiency Products/Services Utility Infrastructure Solutions Utilities and Their Large Customers IDG Power Systems
Slide 5: Revenue Scaling Quickly to $300M Target in 2015
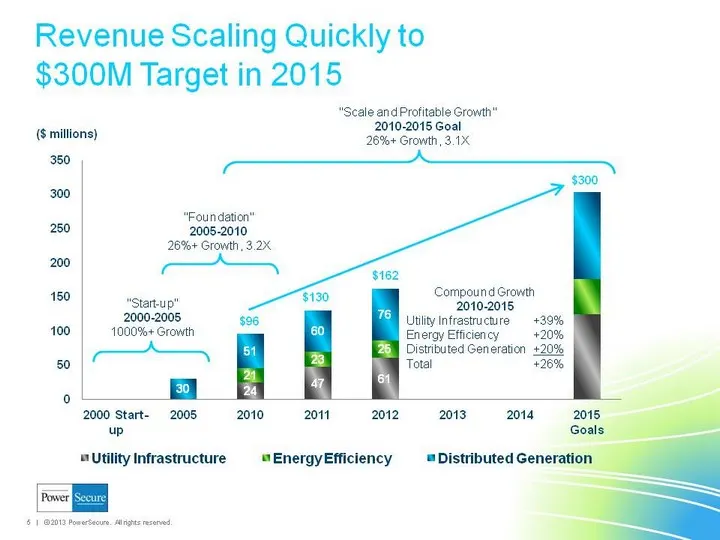
Revenue Scaling Quickly to $300M Target in 2015 (CHART)
Slide 6: 2Q13 Results
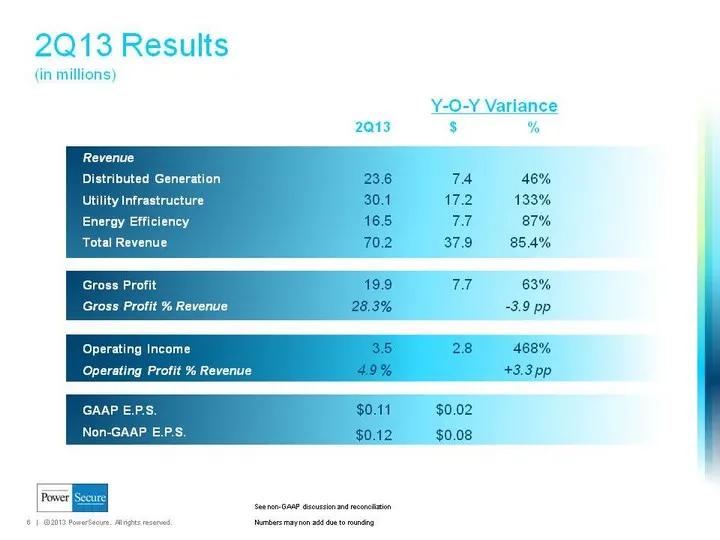
2Q13 Results (in millions) 2Q13 $ % Revenue Distributed Generation 23.6 7.4 46% Utility Infrastructure 30.1 17.2 133% Energy Efficiency 16.5 7.7 87% Total Revenue 70.2 37.9 85.4% Gross Profit 19.9 7.7 63% Gross Profit % Revenue 28.3% -3.9 pp Operating Income 3.5 2.8 468% Operating Profit % Revenue 4
Slide 7: Meaningful Bottom Line Leverage
Operating margins increasing Increasing scale across all business lines 2012 cost reduction program further leverages OpEx Major investment to build UI business from scratch in '07 now completed Expect decreasing OpEx as % of revenue 2013 EBITDA target: >$20M Meaningful Bottom Line Leverage See non-
Slide 8: 2011 Progression
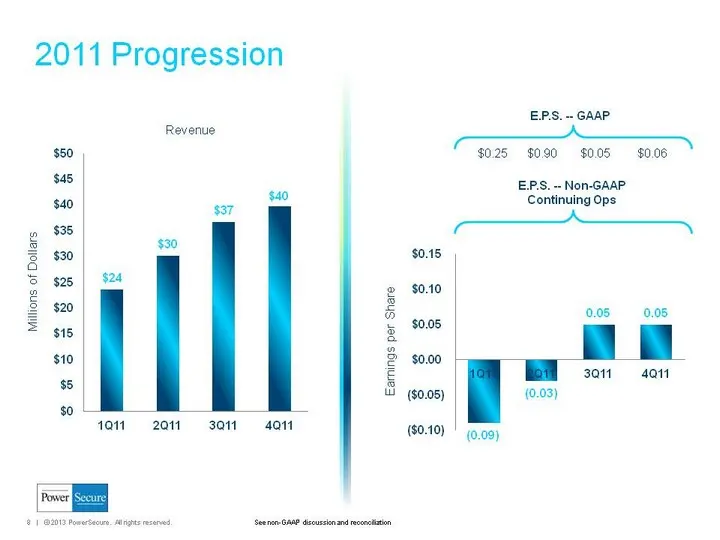
2011 Progression (CHART) Revenue Millions of Dollars (CHART) E.P.S. -- Non-GAAP Continuing Ops E.P.S. -- GAAP $0.25 $0.90 $0.05 $0.06 Earnings per Share See non-GAAP discussion and reconciliation
Slide 9: 2012 Progression
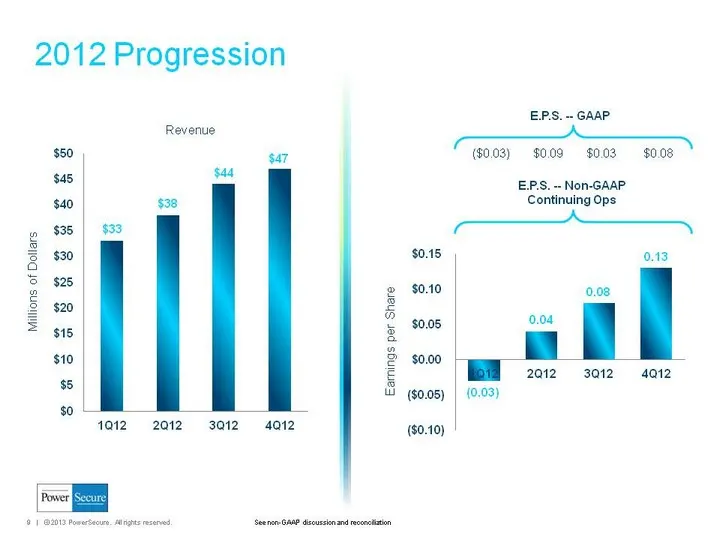
(CHART) Revenue Millions of Dollars 2012 Progression (CHART) E.P.S. -- Non-GAAP Continuing Ops E.P.S. -- GAAP ($0.03) $0.09 $0.03 $0.08 Earnings per Share See non-GAAP discussion and reconciliation
Slide 10: Recent Acquisitions Add Value: Solar
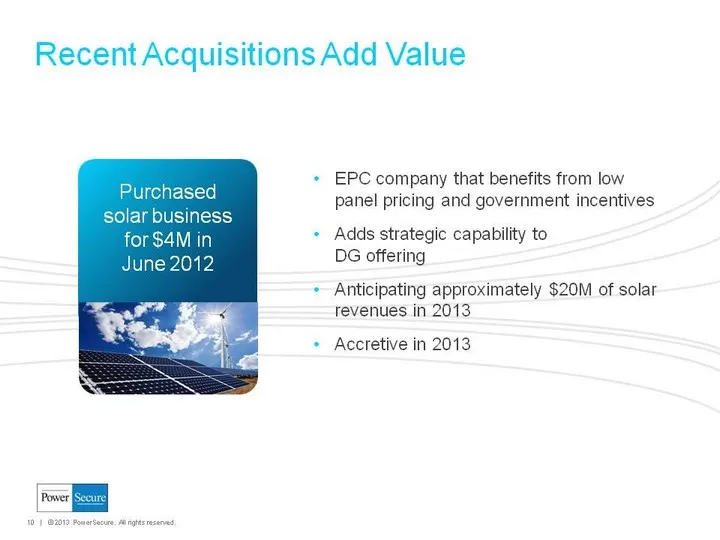
EPC company that benefits from low panel pricing and government incentives Adds strategic capability to DG offering Anticipating approximately $20M of solar revenues in 2013 Accretive in 2013 Recent Acquisitions Add Value Purchased solar business for $4M in June 2012
Slide 11: Recent Acquisitions Add Value: ESCO Services
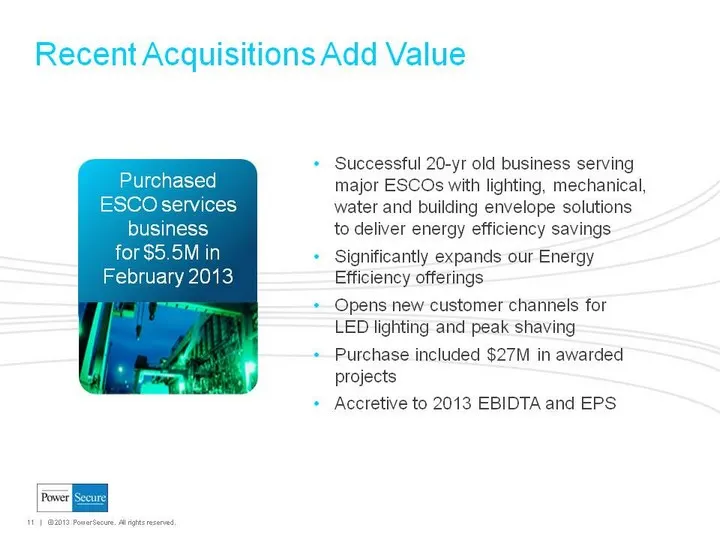
Recent Acquisitions Add Value Successful 20-yr old business serving major ESCOs with lighting, mechanical, water and building envelope solutions to deliver energy efficiency savings Significantly expands our Energy Efficiency offerings Opens new customer channels for LED lighting and peak shaving Pu
Slide 12: Recent Acquisitions Add Value: Solais
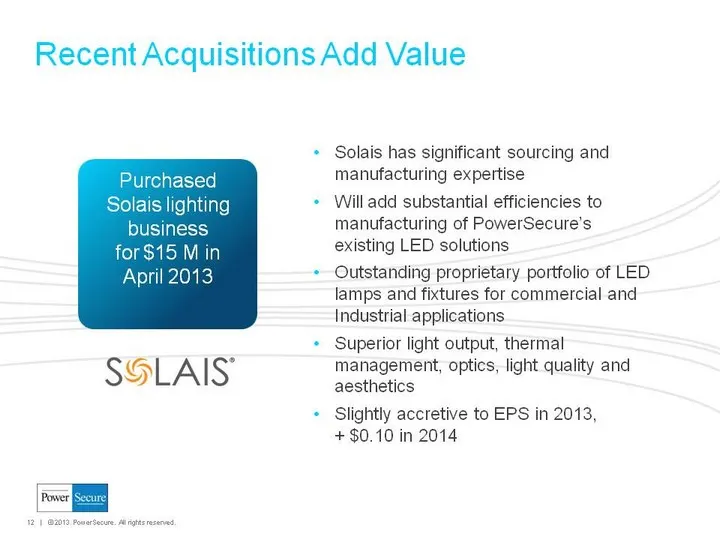
Recent Acquisitions Add Value Solais has significant sourcing and manufacturing expertise Will add substantial efficiencies to manufacturing of PowerSecure's existing LED solutions Outstanding proprietary portfolio of LED lamps and fixtures for commercial and Industrial applications Superior light o
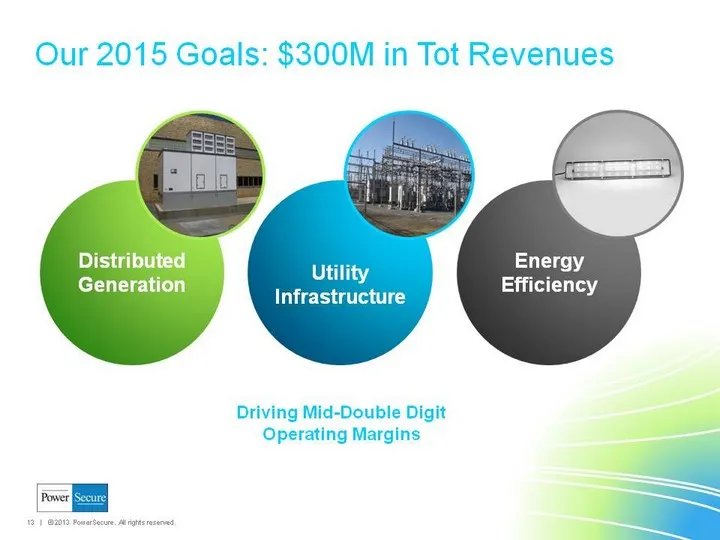
Slide 13: Our 2015 Goals: $300M in Total Revenues
Our 2015 Goals: $300M in Tot Revenues Distributed Generation Utility Infrastructure Energy Efficiency Driving Mid-Double Digit Operating Margins
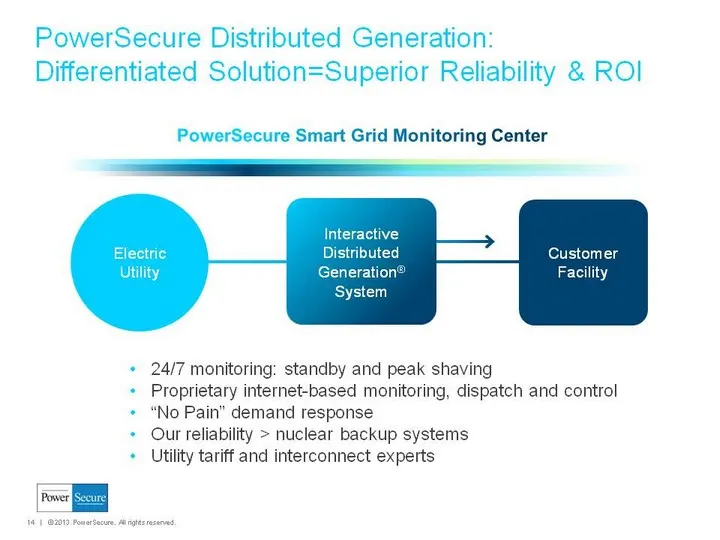
Slide 14: PowerSecure Distributed Generation
PowerSecure Distributed Generation: Differentiated Solution=Superior Reliability & ROI Electric Utility Customer Facility 24/7 monitoring: standby and peak shaving Proprietary internet-based monitoring, dispatch and control "No Pain" demand response Our reliability > nuclear backup systems Utility t
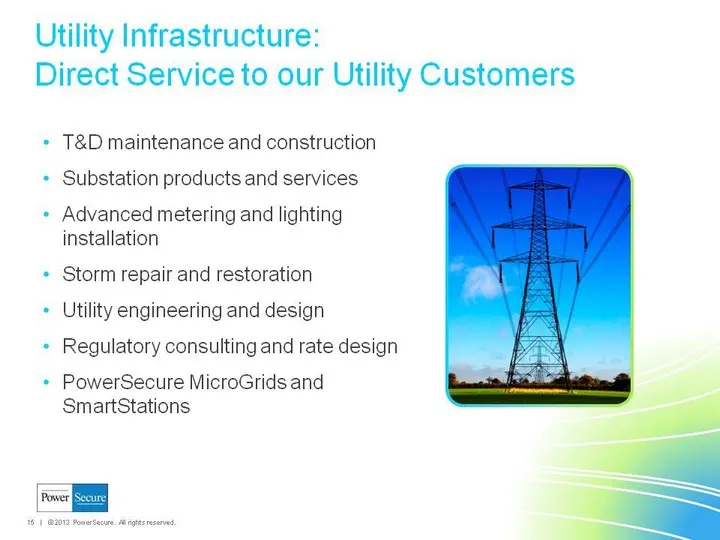
Slide 15: Utility Infrastructure: Direct Service to our Utility Customers
T&D maintenance and construction Substation products and services Advanced metering and lighting installation Storm repair and restoration Utility engineering and design Regulatory consulting and rate design PowerSecure MicroGrids and SmartStations Utility Infrastructure: Direct Service to our Utili
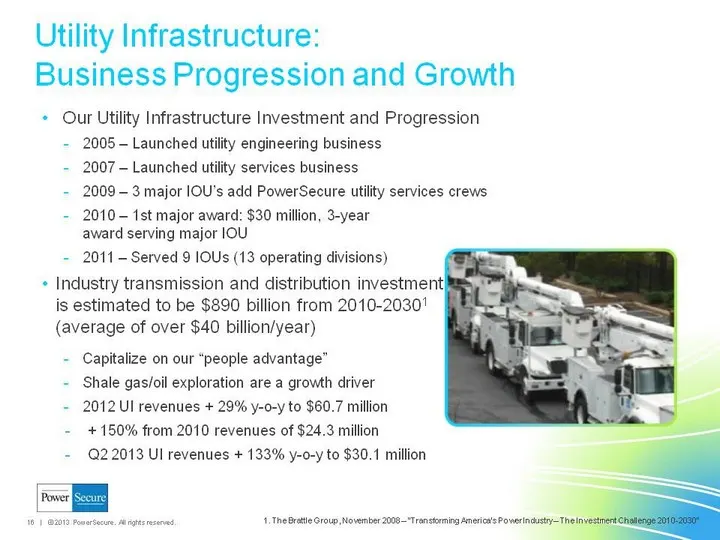
Slide 16: Utility Infrastructure: Business Progression and Growth
Our Utility Infrastructure Investment and Progression 2005 - Launched utility engineering business 2007 - Launched utility services business 2009 - 3 major IOU's add PowerSecure utility services crews 2010 - 1st major award: $30 million, 3-year award serving major IOU 2011 - Served 9 IOUs (13 operat
Slide 17: Energy Efficiency: LED Solutions for Retailers
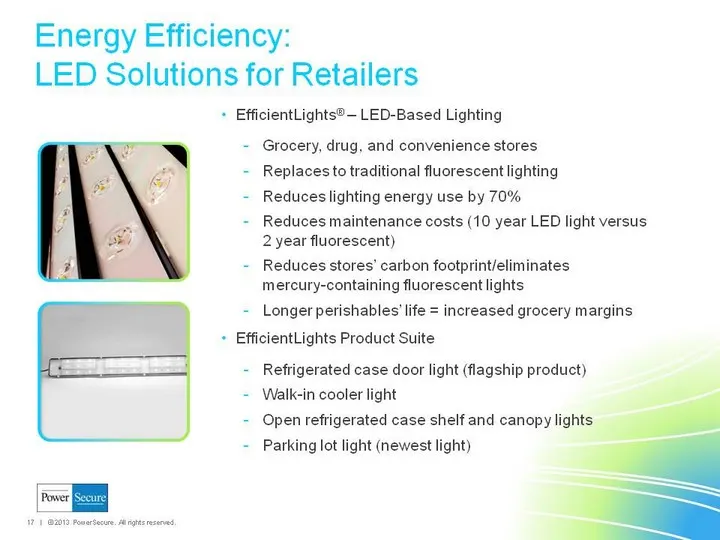
EfficientLights(r) - LED-Based Lighting Grocery, drug, and convenience stores Replaces to traditional fluorescent lighting Reduces lighting energy use by 70% Reduces maintenance costs (10 year LED light versus 2 year fluorescent) Reduces stores' carbon footprint/eliminates mercury-containing fluores
Slide 18: Energy Efficiency: LED Solutions for Utilities
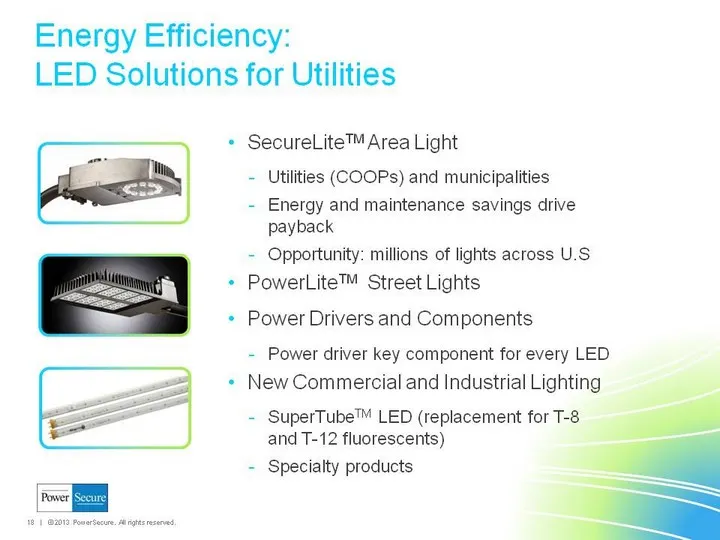
SecureLiteTM Area Light Utilities (COOPs) and municipalities Energy and maintenance savings drive payback Opportunity: millions of lights across U.S PowerLiteTM Street Lights Power Drivers and Components Power driver key component for every LED New Commercial and Industrial Lighting SuperTubeTM LED
Slide 19: Revenue Scaling Quickly to $300M Target in 2015
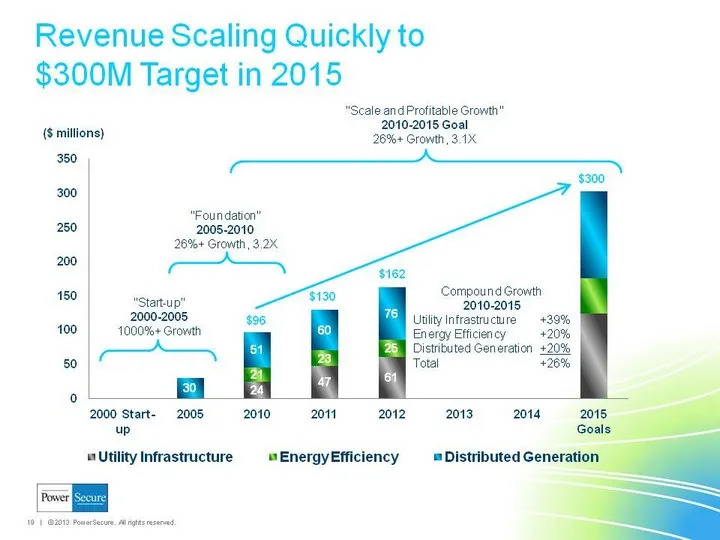
Revenue Scaling Quickly to $300M Target in 2015 (CHART)

Slide 20: Thank you
Power Thank you
Slide 21: Non-GAAP Pro forma financial measures
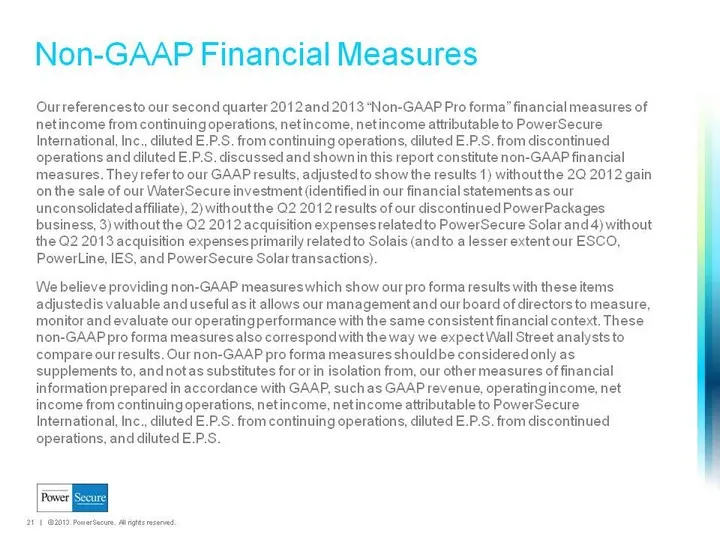
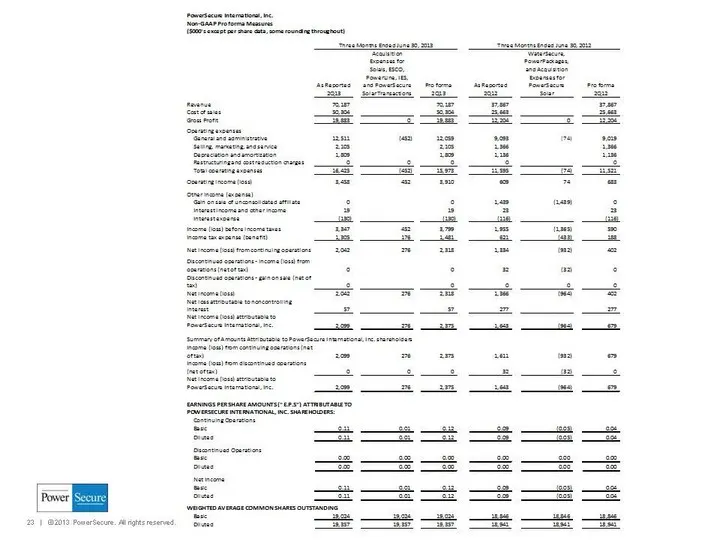
Our references to our second quarter 2012 and 2013 "Non-GAAP Pro forma" financial measures of net income from continuing operations, net income, net income attributable to PowerSecure International, Inc., diluted E.P.S. from continuing operations, diluted E.P.S. from discontinued operations and dilu
Slide 22: Non-GAAP Financial Measures: EBITDA
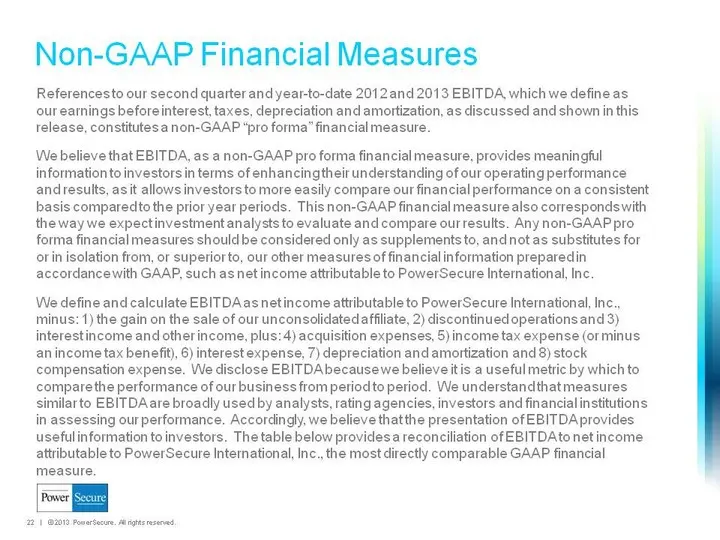
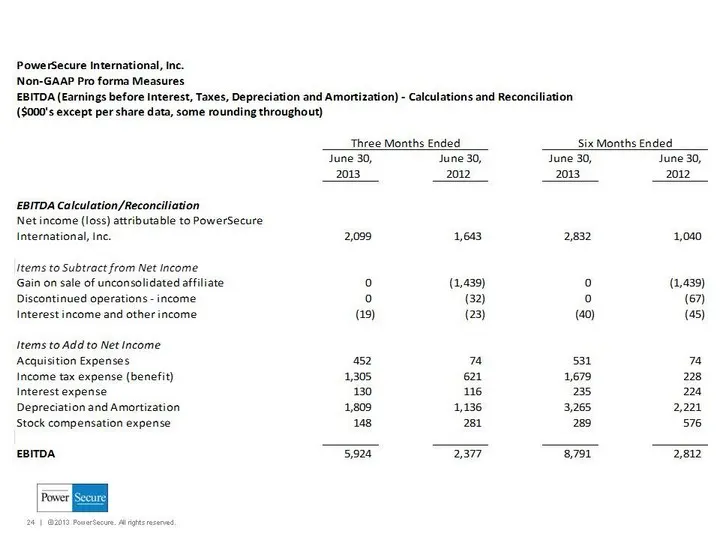
Non-GAAP Financial Measures References to our second quarter and year-to-date 2012 and 2013 EBITDA, which we define as our earnings before interest, taxes, depreciation and amortization, as discussed and shown in this release, constitutes a non-GAAP "pro forma" financial measure. We believe that EBI
Slide 23: cl")
cl")
Slide 24: EBITDA Calculation/Reconciliation
PowerSecure International, Inc. Non-GAAP Pro forma Measures EBITDA (Earnings before Interest, Taxes, Depreciation and Amor {($000's except per share data, some rounding throughout) ation) - Calculations and Recon« ‘Three Months Ended Six Months Ended Tune 30, June 30, Tune 30, June 30, 2013 2012 201
Slide 25: Non-GAAP Pro forma measures, 2012 and 2011
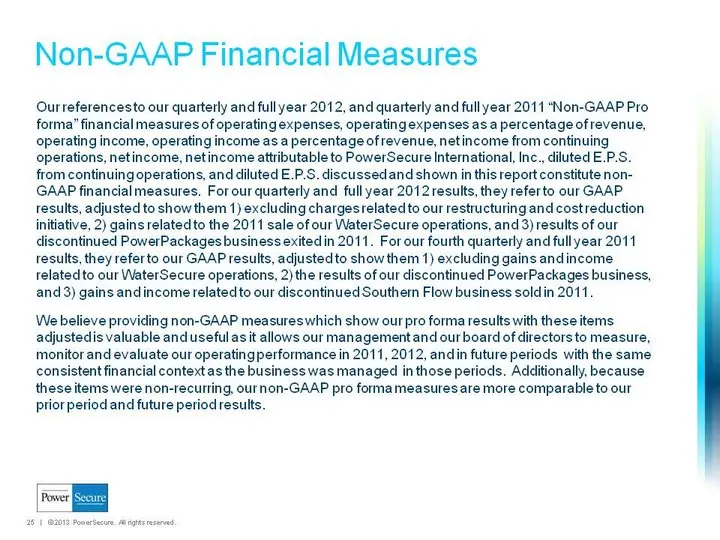
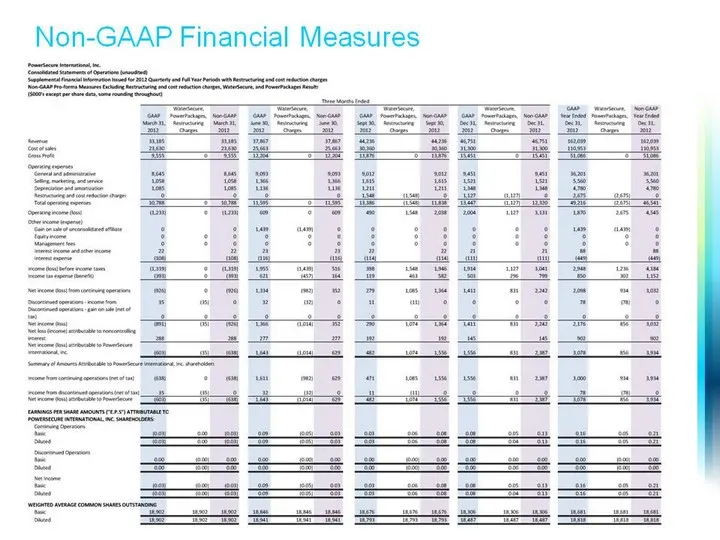
Our references to our quarterly and full year 2012, and quarterly and full year 2011 "Non-GAAP Pro forma" financial measures of operating expenses, operating expenses as a percentage of revenue, operating income, operating income as a percentage of revenue, net income from continuing operations, net
Slide 26: Non-GAAP Financial Measures
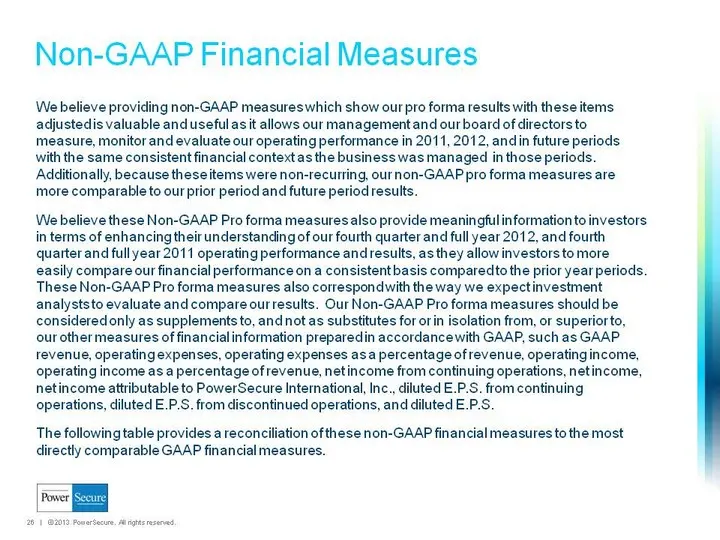
Non-GAAP Financial Measures We believe providing non-GAAP measures which show our pro forma results with these items adjusted is valuable and useful as it allows our management and our board of directors to measure, monitor and evaluate our operating performance in 2011, 2012, and in future periods
Slide 27: Non-GAAP Financial Measures
Non-GAAP Financial Measures
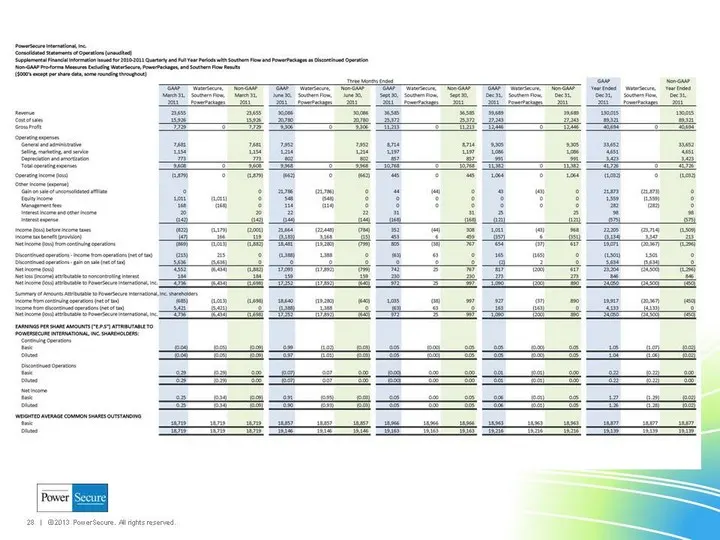
Slide 28: Consolidated Statements of Operations (unaudited)
Source: SEC EDGAR · 8-K filed Aug 14, 2013
More decks from PowerSecure International Inc
 Investor Presentation (January 2016)19 slides · Jan 13, 2016
 Q3 2015 Earnings Presentation19 slides · Nov 9, 2015
 Investor Presentation (September 2015)19 slides · Sep 2, 2015
 Investor Presentation (August 2015)16 slides · Aug 10, 2015
 Investor Presentation (May 2015)21 slides · May 26, 2015
 Investor Presentation (May 2015)18 slides · May 6, 2015