Cal Dive International — Q1 2008 Earnings Presentation
14 slides from Cal Dive International's earnings presentation, May 1, 2008
Slide 1: 1st Quarter 2008 Earnings Conference Call
>» Ca Dive UNTERMATIONAL 1st Quarter 2008 Earnings Conference Call May 1, 2008 Commitment to Safety Operational Efficiency Family Oriented
Slide 2: Forward-Looking Statements
I Forward-Looking Statements This presentation may include “forward-looking” staterments that are generally identifiable through our use of words such as “believe,” “expect,” “anticipate,” “intend,” “plan,” “estimate,” “project” and similar expressions and include any statements that we make regardi
Slide 3: Presentation Outline
Presentation Outline @> Summary of 1+ Quarter 2008 Results @> Backlog and Outlook @> Non-GAAP Reconciliations > Questions and Answers ee |
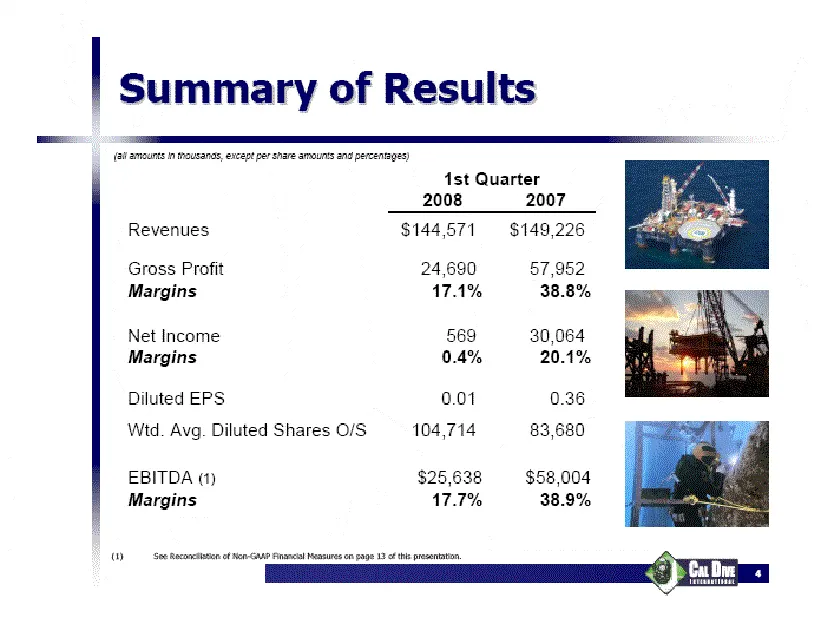
Slide 4: Summary of Results
Summary of Results (al amzurts in nausance, except per are amaunve ana percentges) 1st Quarter 2008 2007 Revenues $144,571 $149,226 Gross Profit 24,690 57,952 Margins ATA% 38.8% Net Income 569 30,064 Margins 0.4% 20.1% Diluted EPS 0.01 0.36 Wtd. Avg. Diluted Shares O/S 104,714 83,680 EBITDA «1) $25,
Slide 5: Summary of Results — Key Statistics
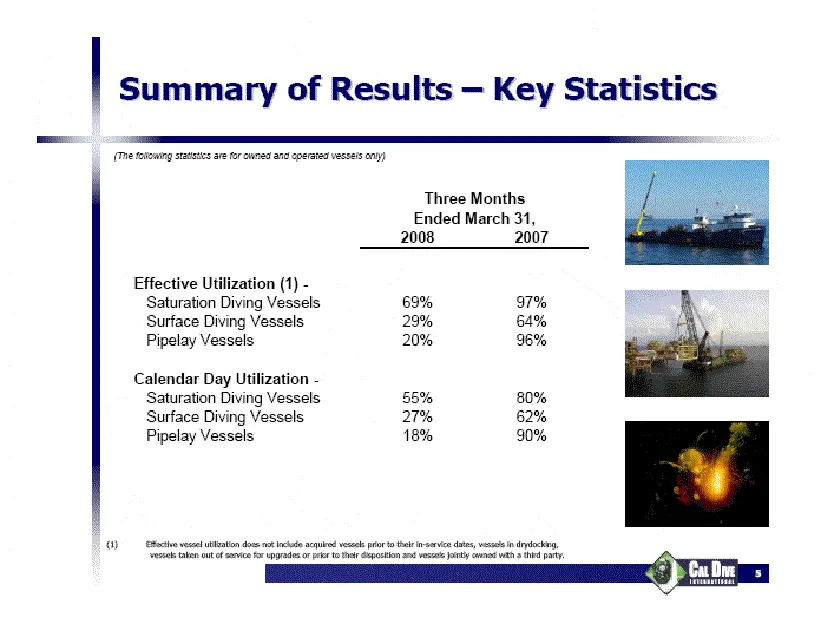
Summary of Results — Key Statistics (Mme eoumg seteuee are frowned ane azarae veeeee ony) Three Months Ended March 31, 2008 2007 Effective Utilization (1) - Saturation Diving Vessels 69% 97% Surface Diving Vessels 29% 64% " Pipelay Vessels 20% 98% ‘Calendar Day Utilization - Saturation Diving Vessel
Slide 6: Summary of Results — Key Points
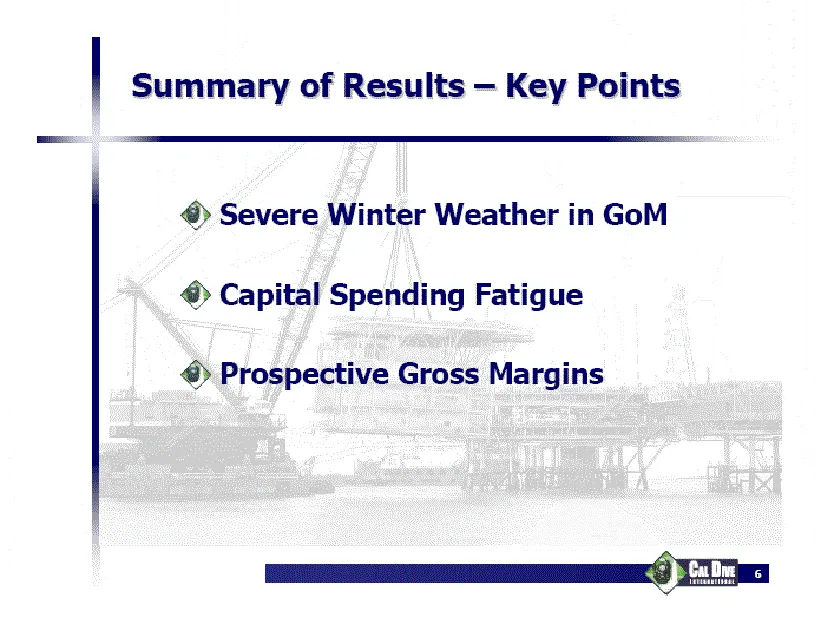
Summary of Results — Key Points @> Severe Winter Weather in GoM © Capital Spending Fatigue @> Prospective Gross Margins aT "ay
Slide 7: Backlog Growth
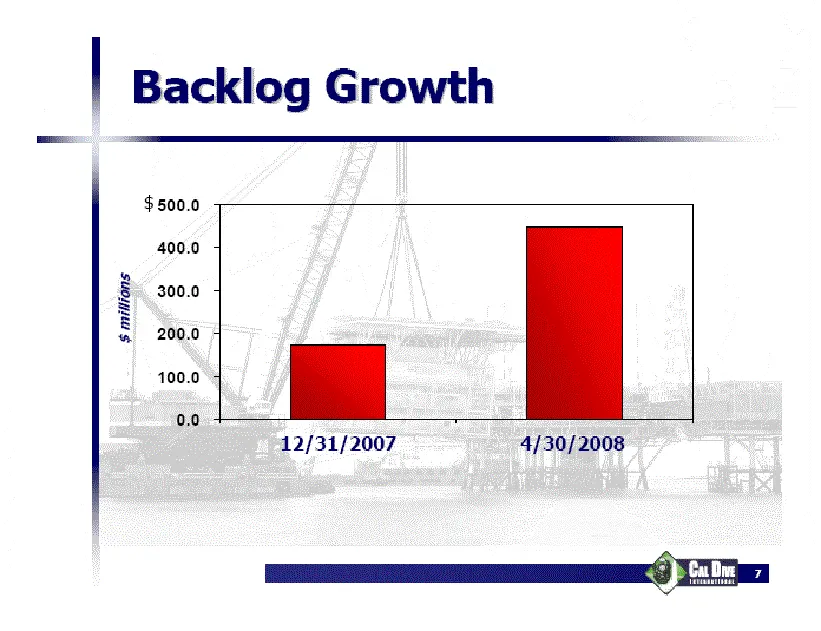
$ millions Backlog Growth 12/31/2007 4/30/2008 Vr "ee
Slide 8: International Revenue
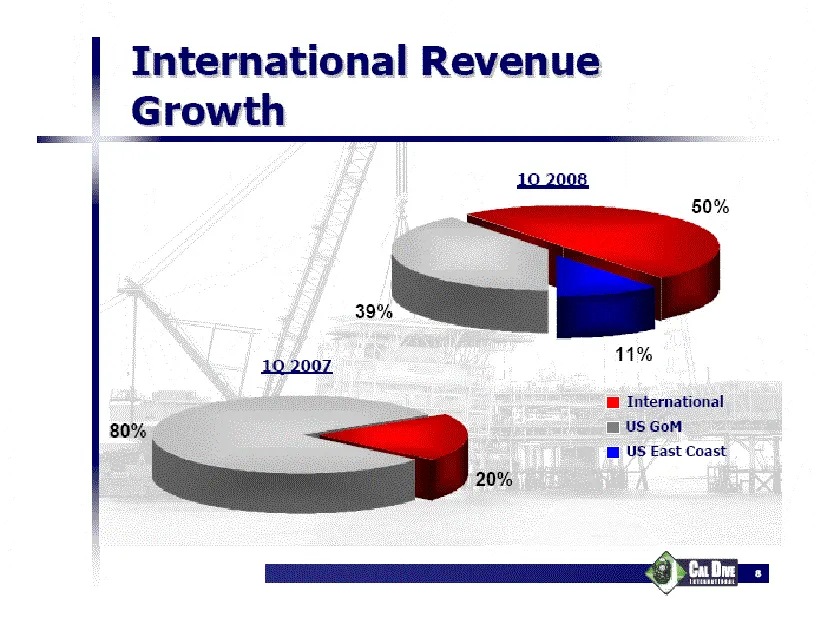
International Revenue Growth 11% @ International @ US GoM m US East Coast
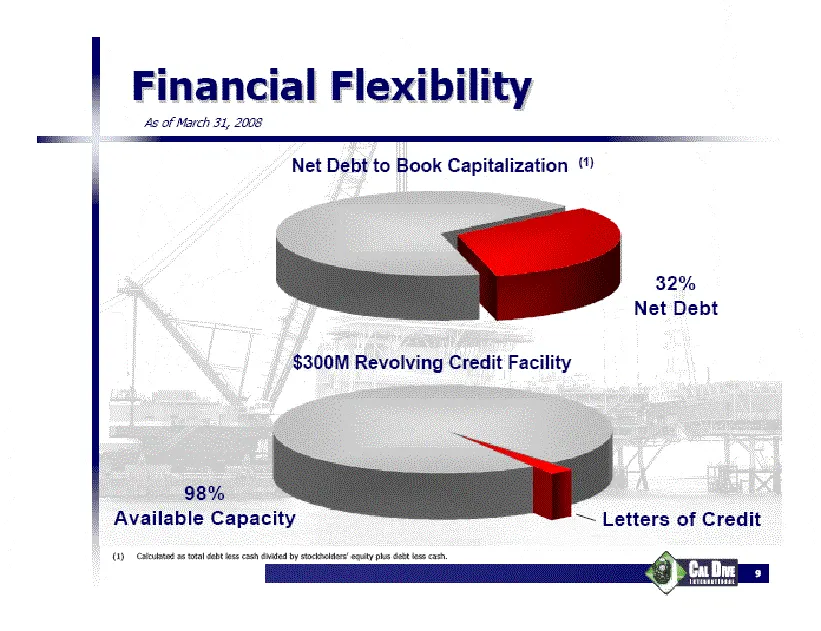
Slide 9: Financial Flexibility
Financial Flexibility ‘As of March $1, 2008 Net Debt to Book Capitalization “) ee 32% Net Debt $300M Revolving Credit Facility ee 98% Available Capacity (1) Ctatta ttal abe te ese ade mcg pla bt ae a2 j ~~ Letters of Credit
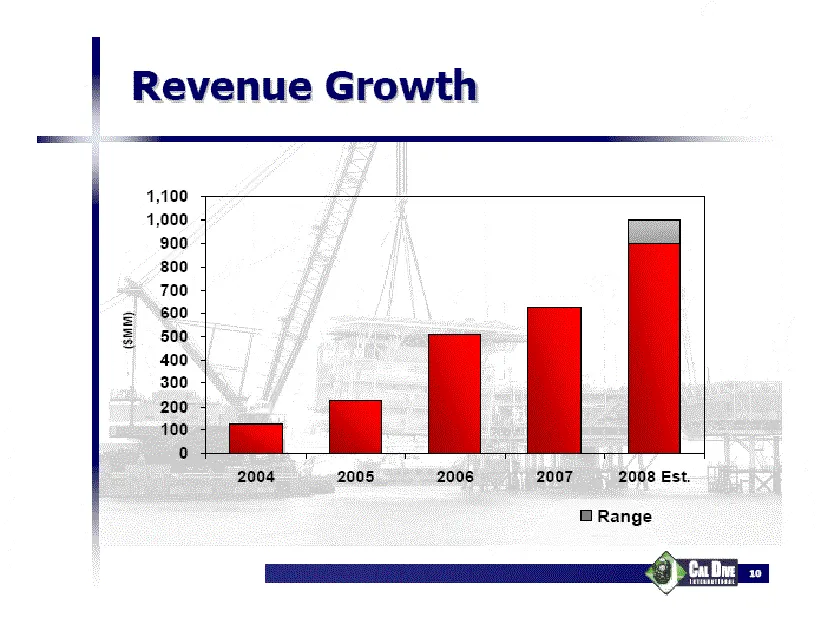
Slide 10: Revenue Growth
Revenue Growth (smm) 2004 2005 2006 2007 2008 Est. Range er "a
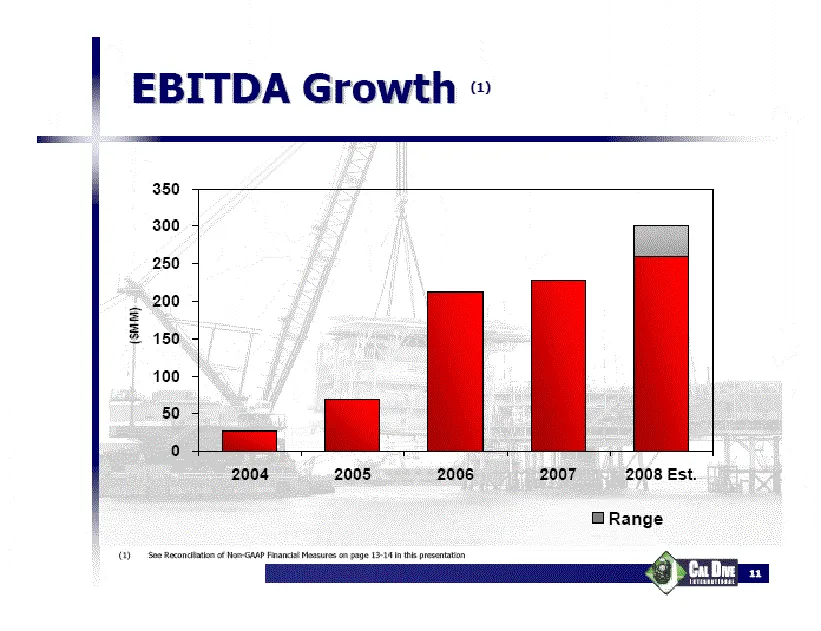
Slide 11: EBITDA Growth
EBITDA Growth » /enal 2004 2005 2006 2007 2008 Est. @ Range
Slide 12: Reconciliations
UNTER WATIONAL Reconciliations
Slide 13: Reconciliation of Non-GAAP Financial Measures
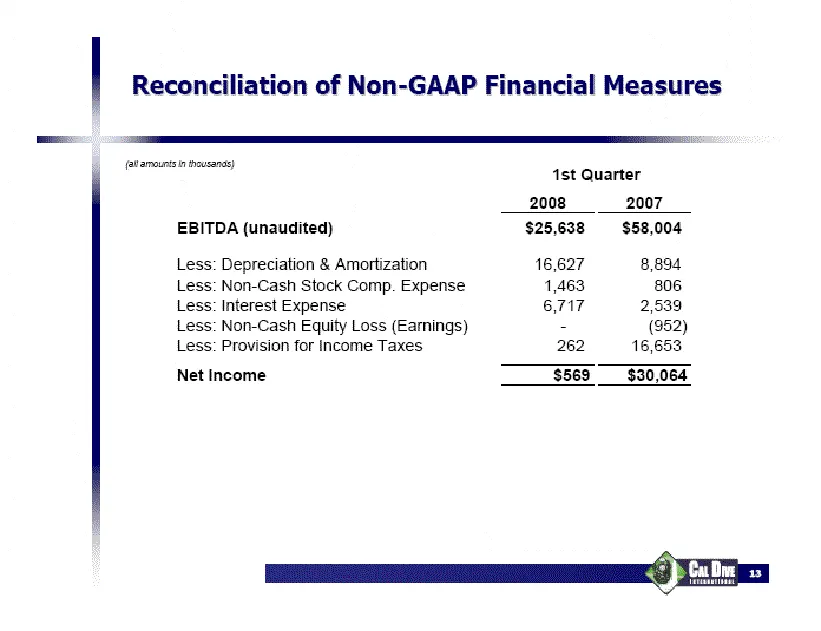
Reconciliation of Non-GAAP Financial Measures peareenca bee ‘1st Quarter 2008 2007 EBITDA (unaudited) $25,638 $58,004 Less: Depreciation & Amortization 16,627 8,894 Less: Non-Cash Stock Comp. Expense 1,463 806 Less: Interest Expense 6717 2,539 Less: Non-Cash Equity Loss (Earnings) - (952) Less: Prov
Slide 14: Reconciliation of Non-GAAP Financial Measures
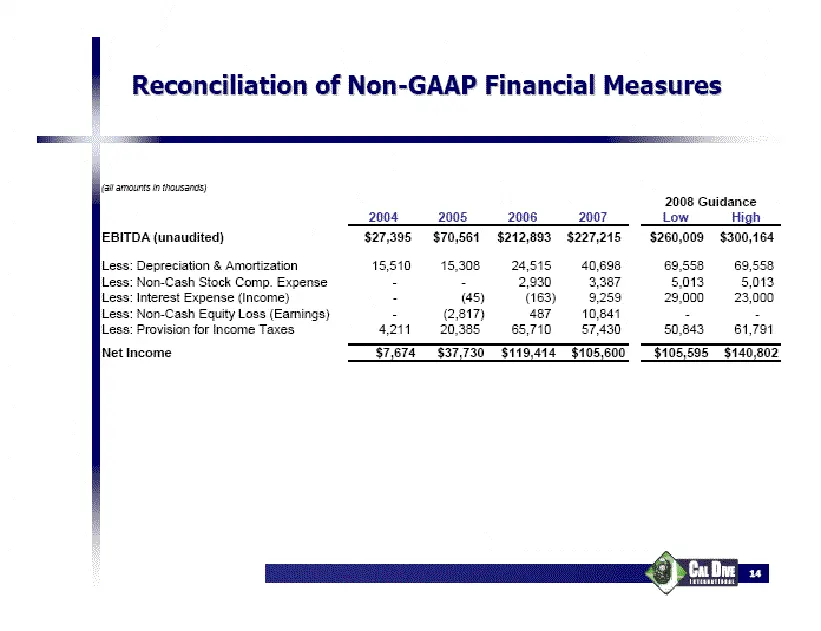
Reconciliation of Non-GAAP Financial Measures css amour i nousaras) EBITDA (unaudited) Less: Depreciation & Amortization Less: Non-Cash Stock Comp. Expense Less: Interest Expense (Income) Less: Non-Cash Equity Loss (Eamings) Less: Provision for Income Taxes Net Income 2004 2005 2006 2007 i 2008 Guid
Source: SEC EDGAR · 8-K filed May 1, 2008
More decks from Cal Dive International Inc
 Q3 2014 Earnings Presentation12 slides · Nov 6, 2014
 Q2 2014 Earnings Presentation12 slides · Aug 11, 2014
 Q1 2014 Earnings Presentation12 slides · May 9, 2014
 Q4 2013 Earnings Presentation11 slides · Mar 5, 2014
 Q3 2013 Earnings Presentation11 slides · Nov 7, 2013
 Q2 2013 Earnings Presentation11 slides · Aug 8, 2013