Santander Holdings USA Inc · NYSE:SNUS/PH
Santander Holdings USA — Debt Investor Presentation (November 2022)
33 slides from Santander Holdings USA's debt investor presentation, Nov 15, 2022
Slide 1: Third Quarter 2022 Fixed Income Investor Presentation
November 14, 2022 SANTANDER HOLDINGS USA, INC. Third Quarter 2022 Fixed Income Investor Presentation « Santander
Slide 2: Important Information
Important Information This presentation of Santander Holdings USA, Inc. ("SHUSA") contains ‘forward-looking statements" within the meaning of the Private Securities Litigation Reform Act of 1995 regarding the Financial condition, results of operations, business plans and Future performance of SHUSA.
Slide 3: Index
Index Ata Glance
Slide 4: Santander Group
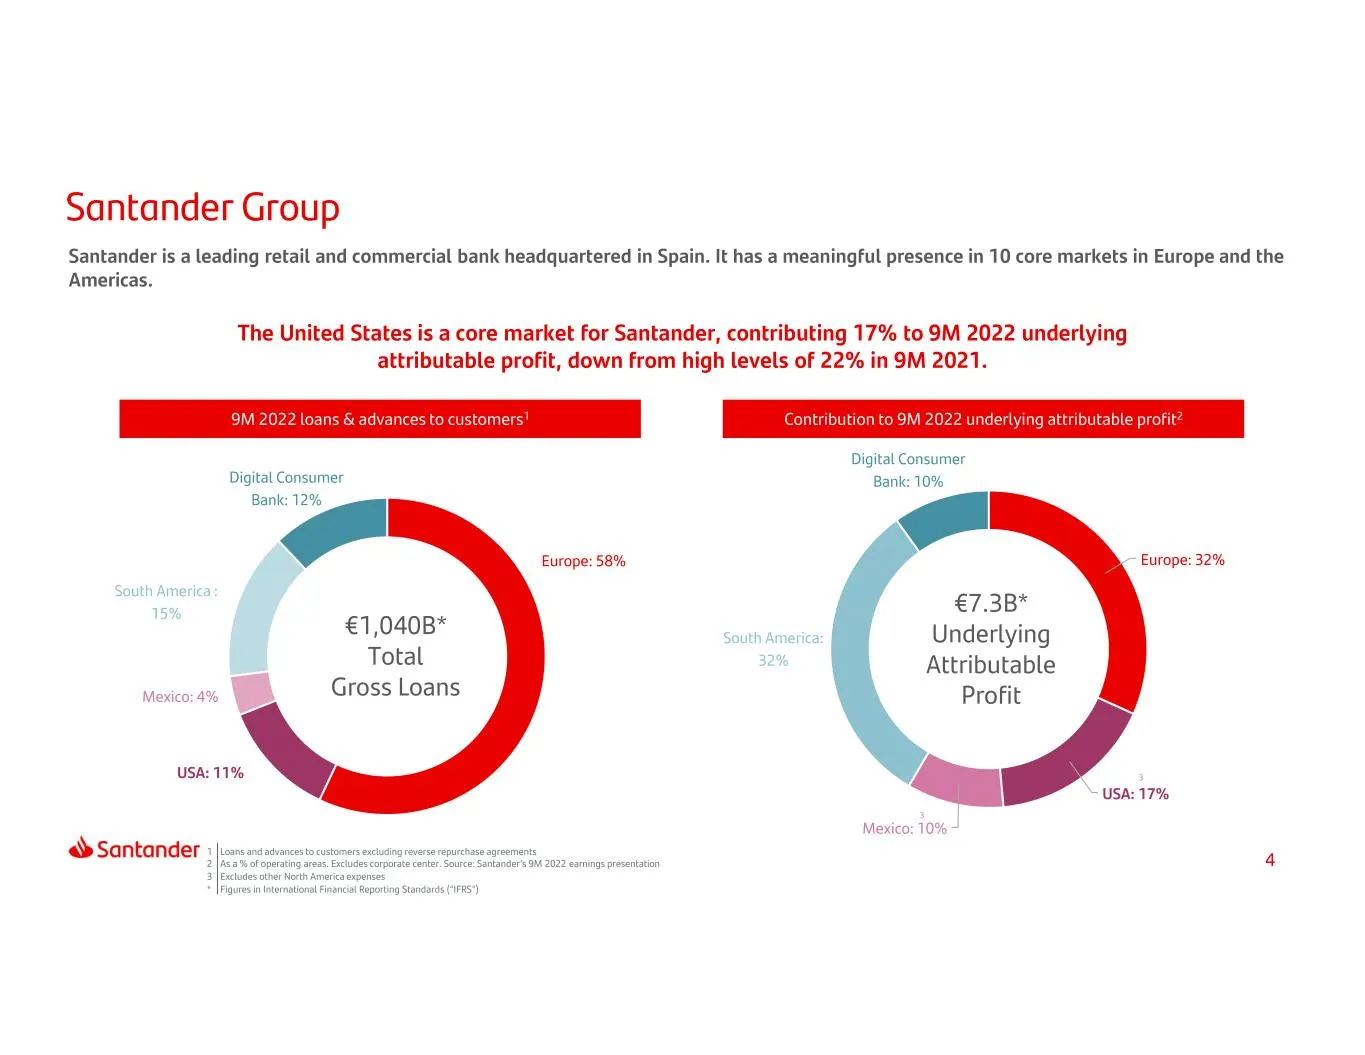
Santander Group Santander is a leading retail and commercial bank headquartered in Spain. It has a meaningful presence in 10 core markets in Europe and the Americas. The United States is a core market for Santander, contributing 17% to 9M 2022 underlying attributable profit, down from high levels of
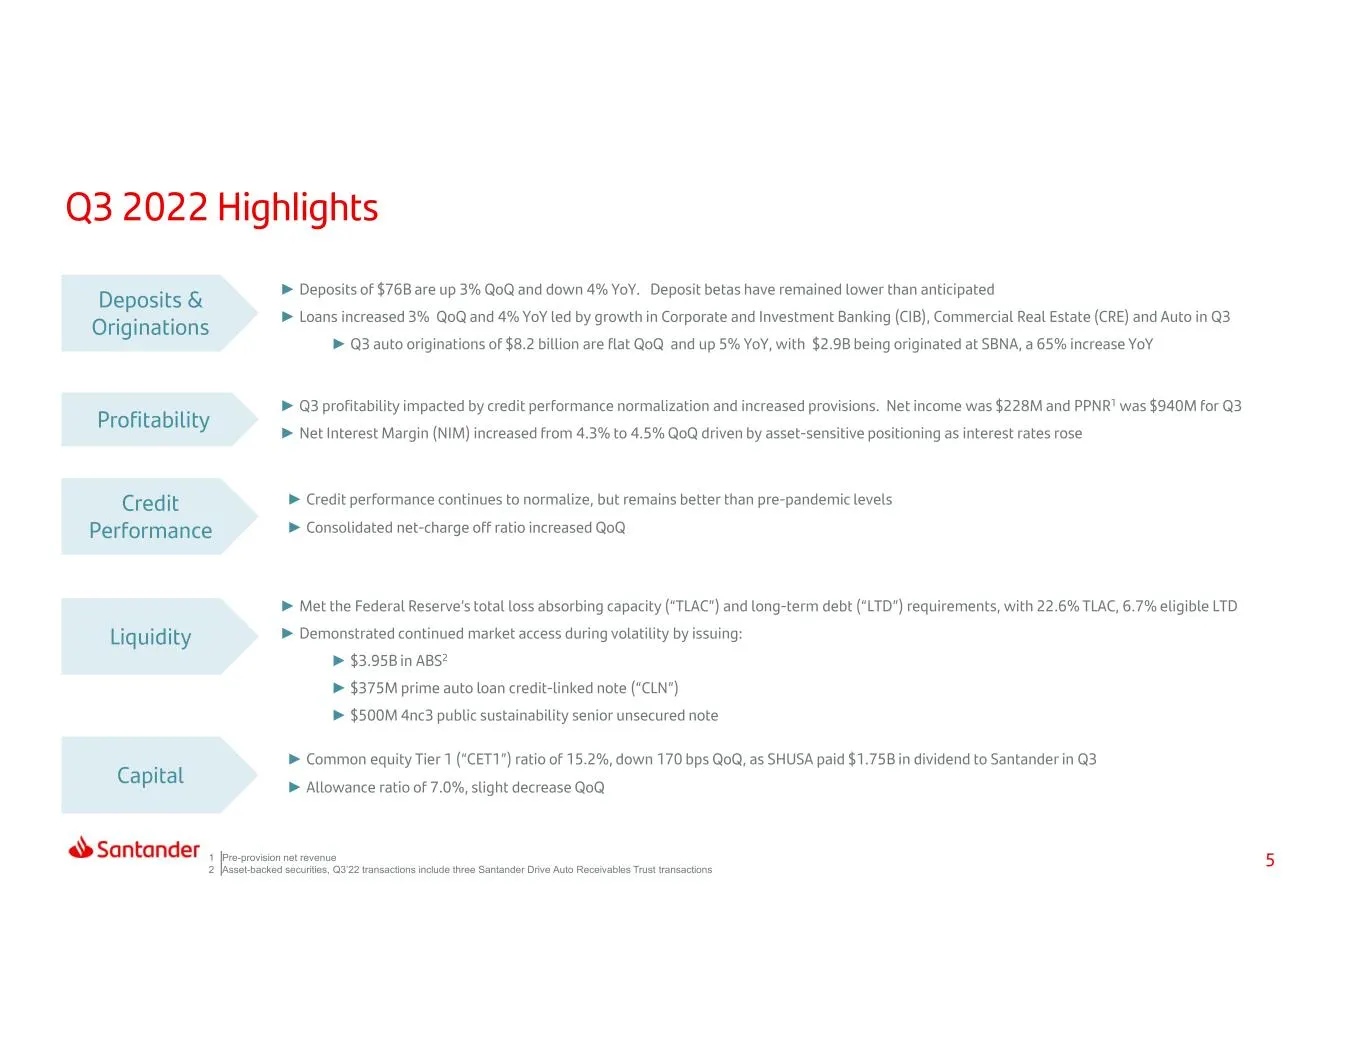
Slide 5: ► ► ► ► ► ► ► ► ► ► ► ► ► ►
► ► ► ► ► ► ► ► ► ► ► ► ► ► 1 2 Pre-provision net revenue Asset-backed securities, Q3’22 transactions include three Santander Drive Auto Receivables Trust transactions
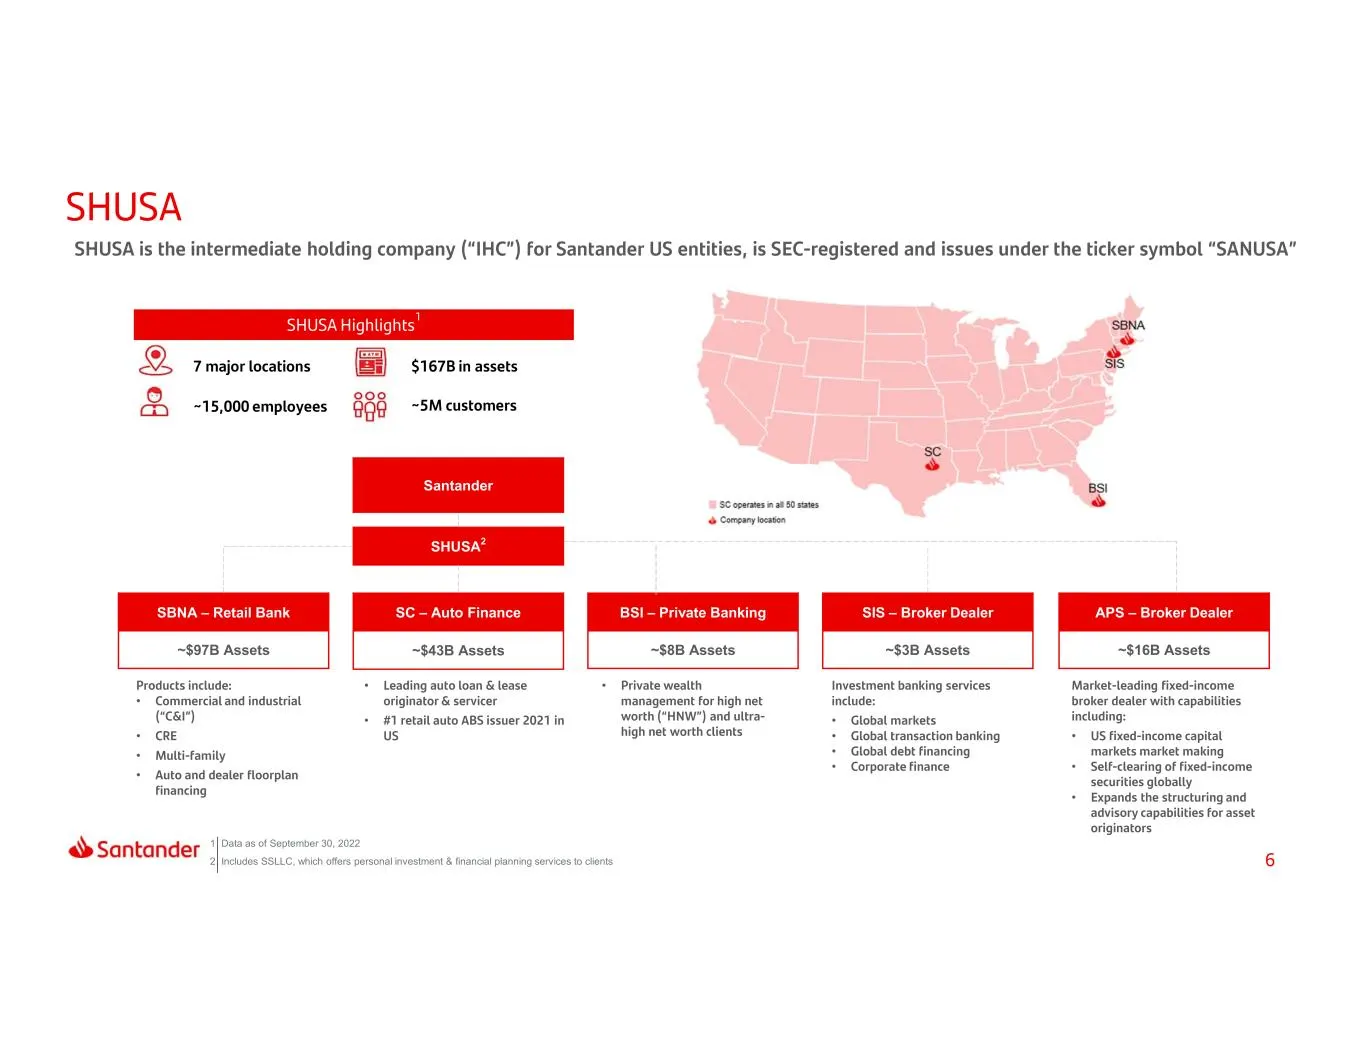
Slide 6: SHUSA structure and subsidiaries
SHUSA2 SBNA – Retail Bank ~$97B Assets SC – Auto Finance ~$43B Assets BSI – Private Banking ~$8B Assets SIS – Broker Dealer ~$3B Assets • • • • • • • • • • • 1 Data as of September 30, 2022 2 Includes SSLLC, which offers personal investment & financial planning services to clients Santander • • • AP
Slide 7: Index
Index At a Glance Results Capital & Ar i
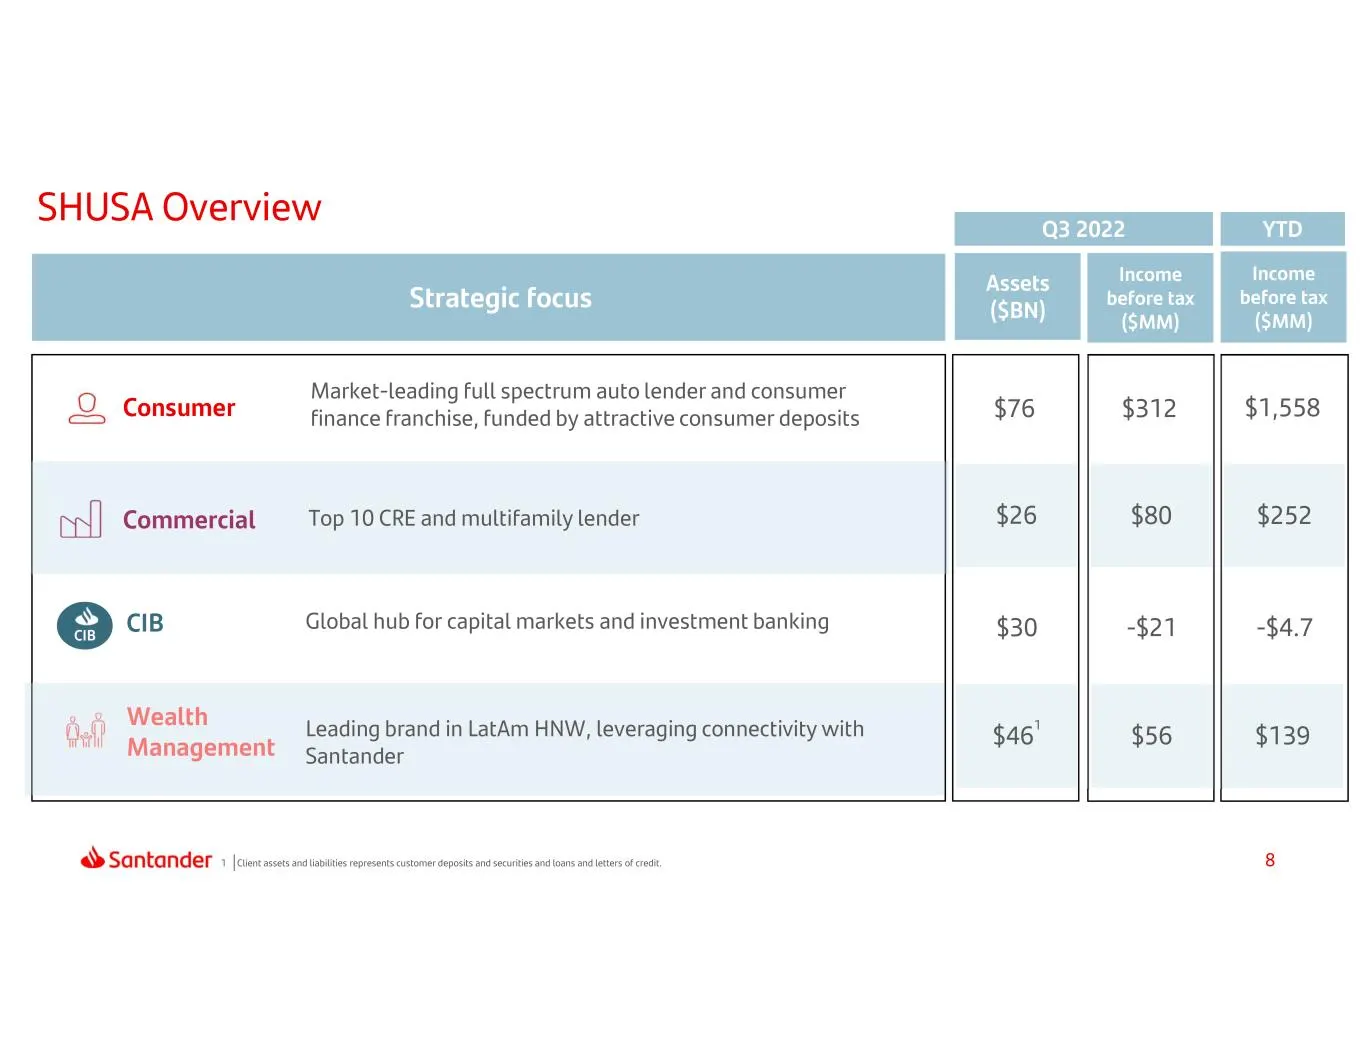
Slide 8: SHUSA strategic focus and income before tax
SHUSAvEviE a Income Income Strategic focus (Gen) before tax |} before tax ($MM) ($MM) Market-leading Full spectrum auto lender and consumer Q Consumer finance franchise, funded by attractive consumer deposits $76 $312 $1,558 ww) Commercial Top 10 CRE and multifamily lender $26 $80 $252 @ CIB Global
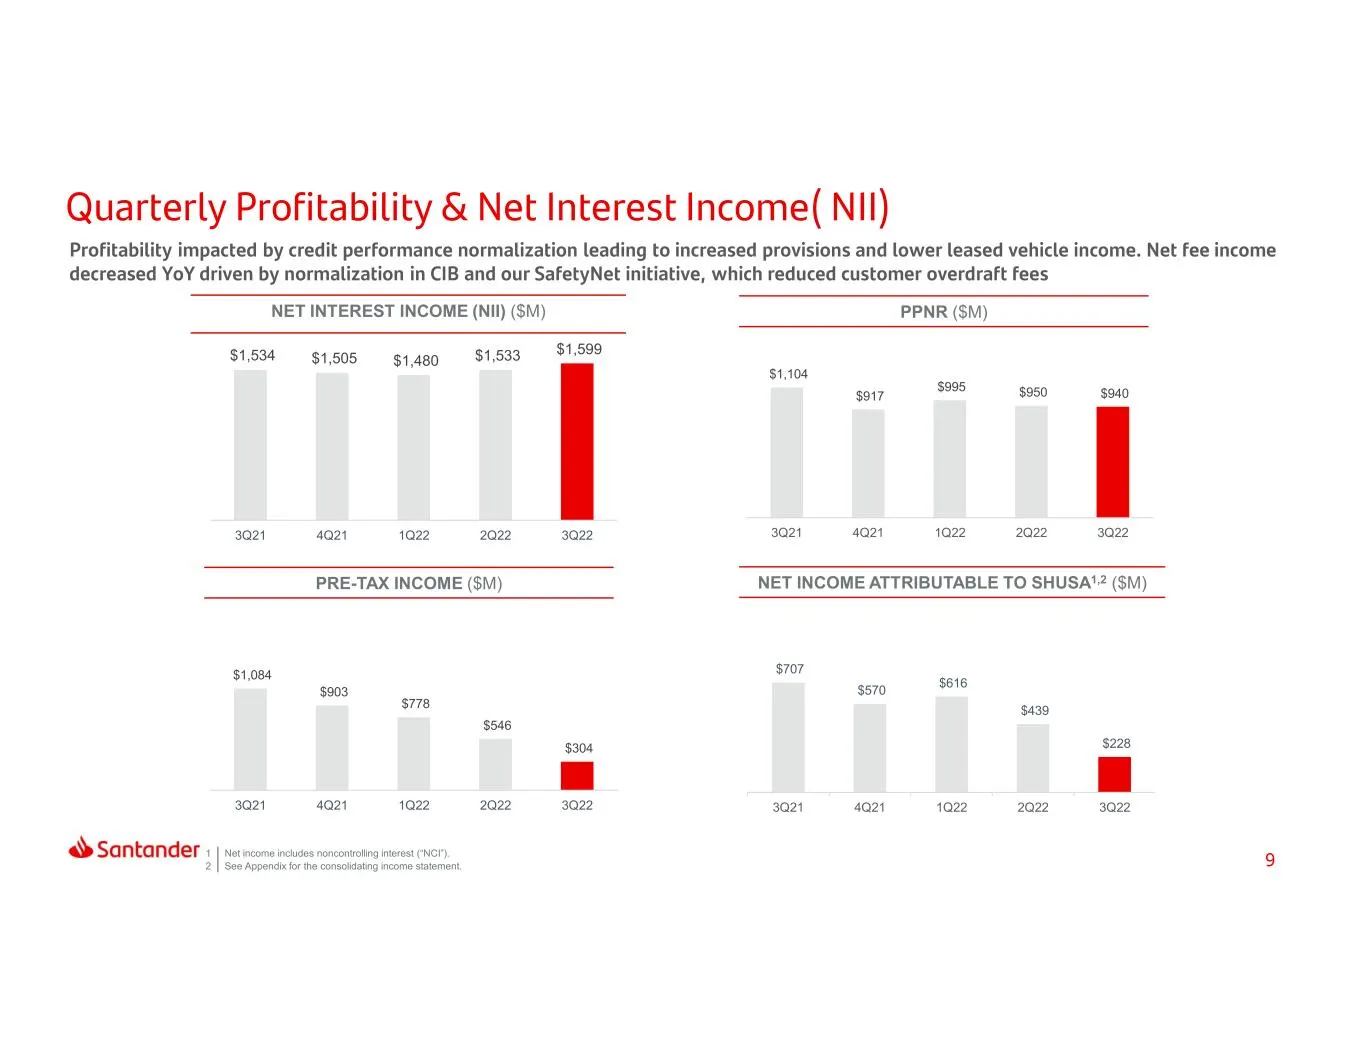
Slide 9: Net interest income, pre-tax income, net income and PPNR
NET INTEREST INCOME (NII) ($M) PRE-TAX INCOME ($M) NET INCOME ATTRIBUTABLE TO SHUSA1,2 ($M) PPNR ($M) 1 Net income includes noncontrolling interest (“NCI”). 2 See Appendix for the consolidating income statement. $1,534 $1,505 $1,480 $1,533 $1,599 3Q21 4Q21 1Q22 2Q22 3Q22 $1,084 $903 $778 $546 $304 3
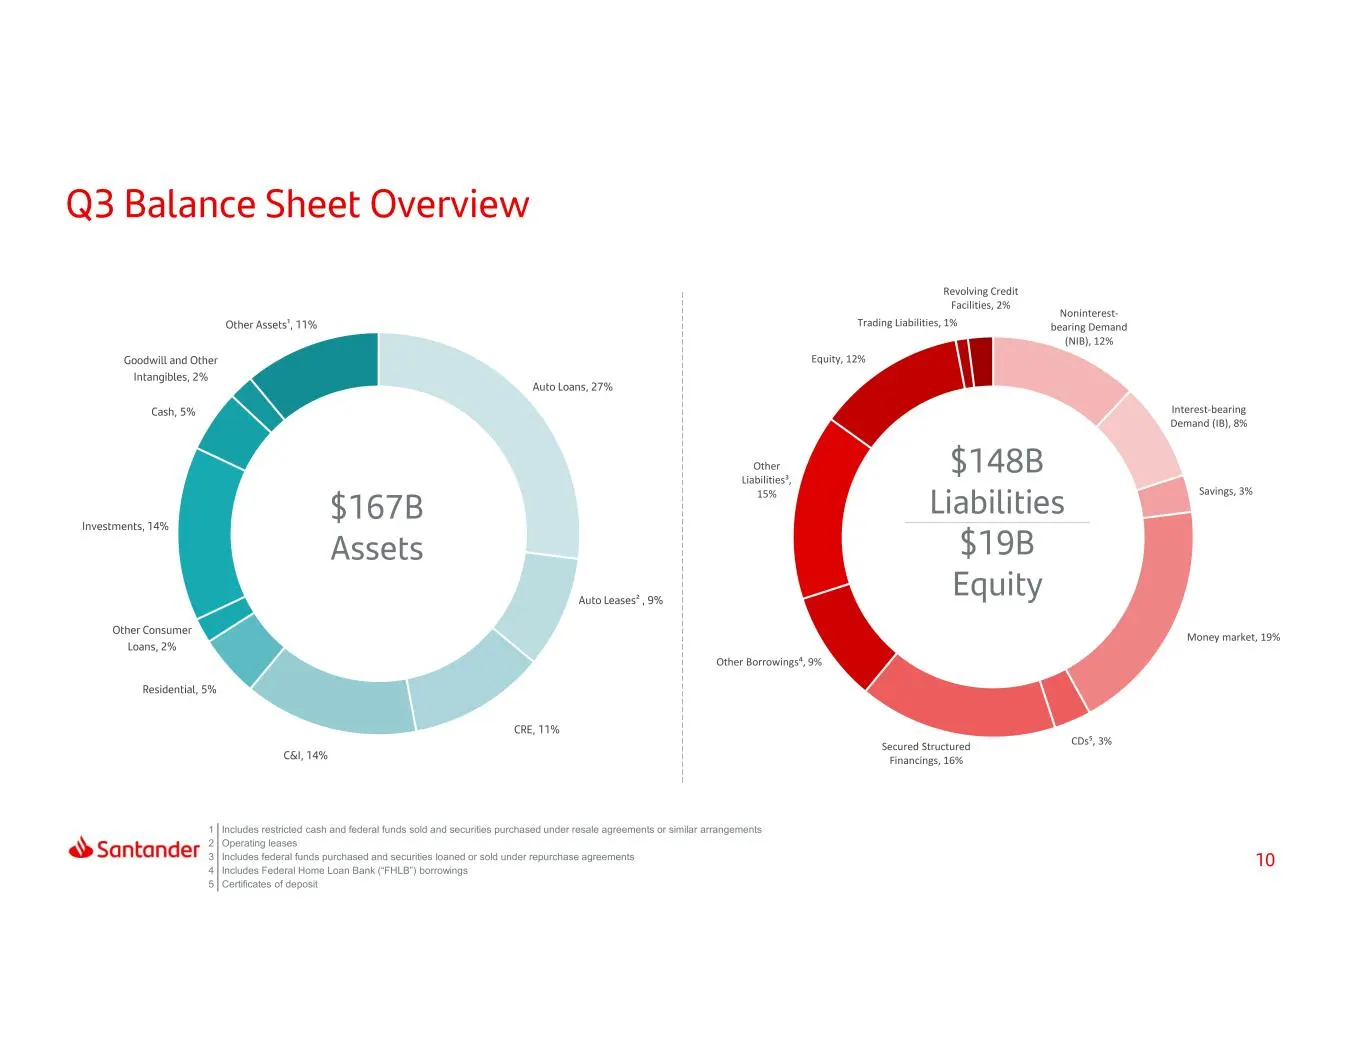
Slide 10: Liabilities and equity composition
1 Includes restricted cash and federal funds sold and securities purchased under resale agreements or similar arrangements 2 Operating leases 3 Includes federal funds purchased and securities loaned or sold under repurchase agreements 4 Includes Federal Home Loan Bank (“FHLB”) borrowings 5 Certifica
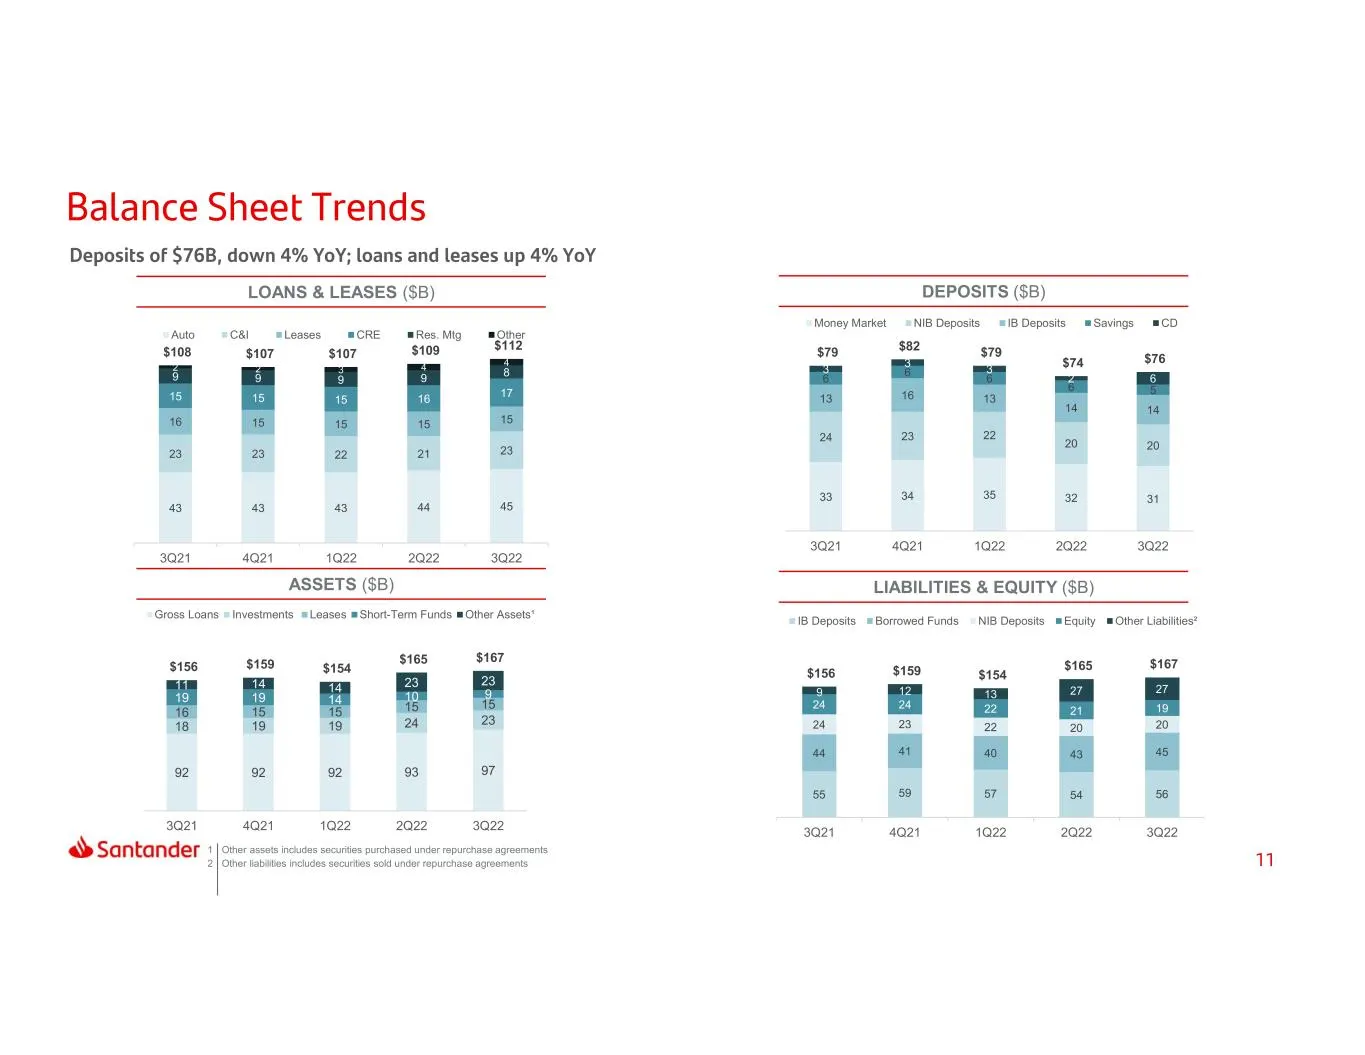
Slide 11: Loans & leases, assets, deposits, liabilities & equity
LOANS & LEASES ($B) LIABILITIES & EQUITY ($B)ASSETS ($B) DEPOSITS ($B) 1 Other assets includes securities purchased under repurchase agreements 2 Other liabilities includes securities sold under repurchase agreements 92 92 92 93 97 18 19 19 24 23 16 15 15 15 1519 19 14 10 9 11 14 14 23 23 $156 $159
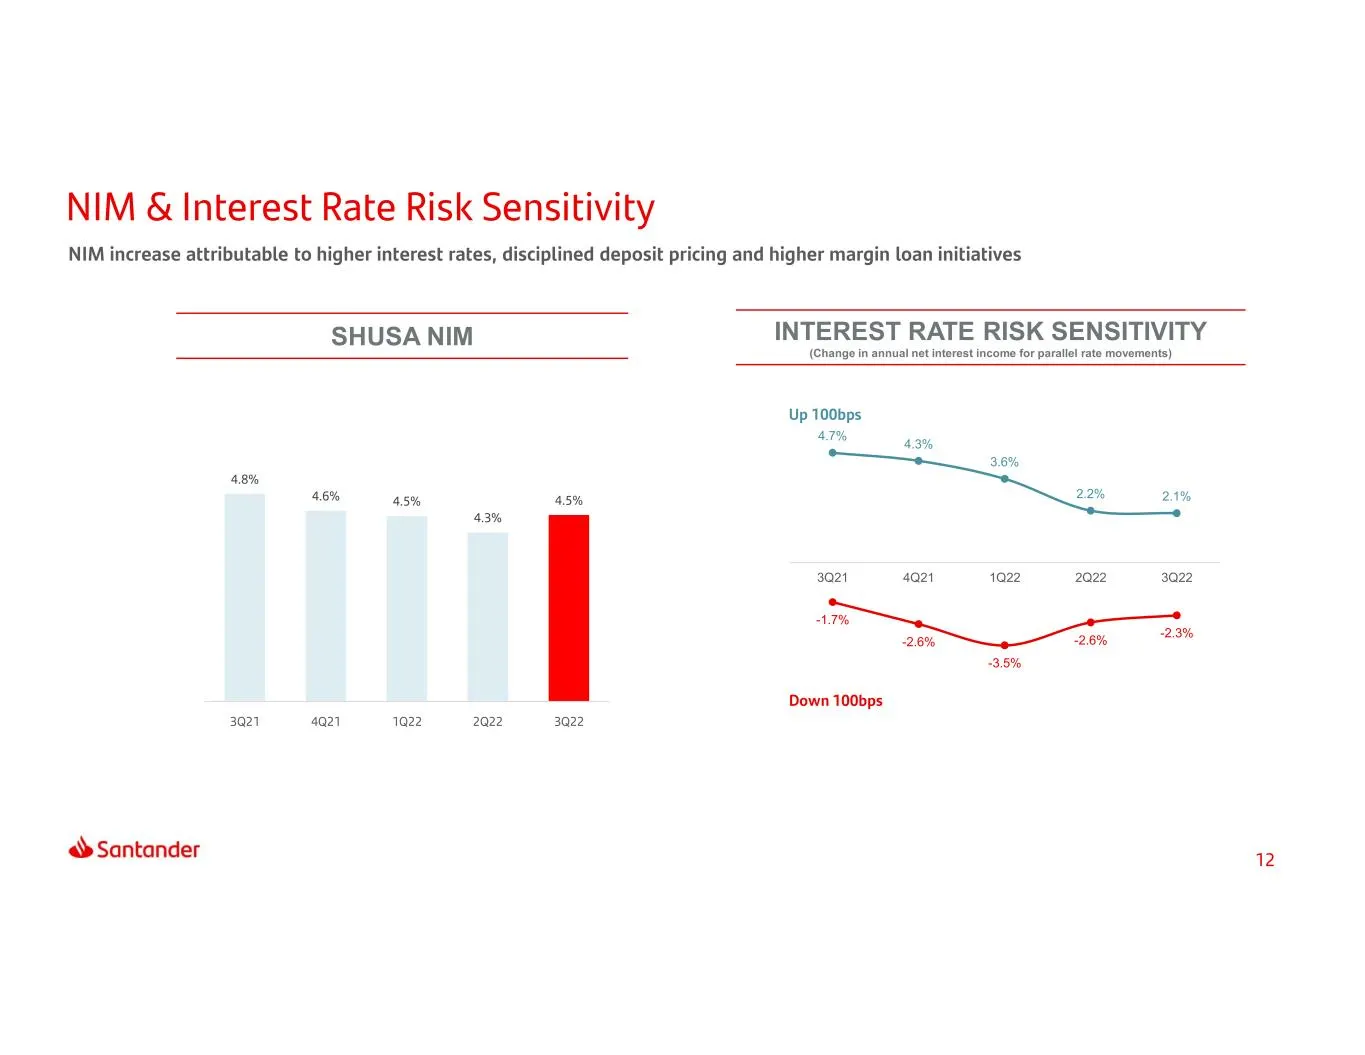
Slide 12: SHUSA NIM and interest rate risk sensitivity
SHUSA NIM INTEREST RATE RISK SENSITIVITY (Change in annual net interest income for parallel rate movements) -1.7% -2.6% -3.5% -2.6% -2.3% 4.7% 4.3% 3.6% 2.2% 2.1% 3Q21 4Q21 1Q22 2Q22 3Q22
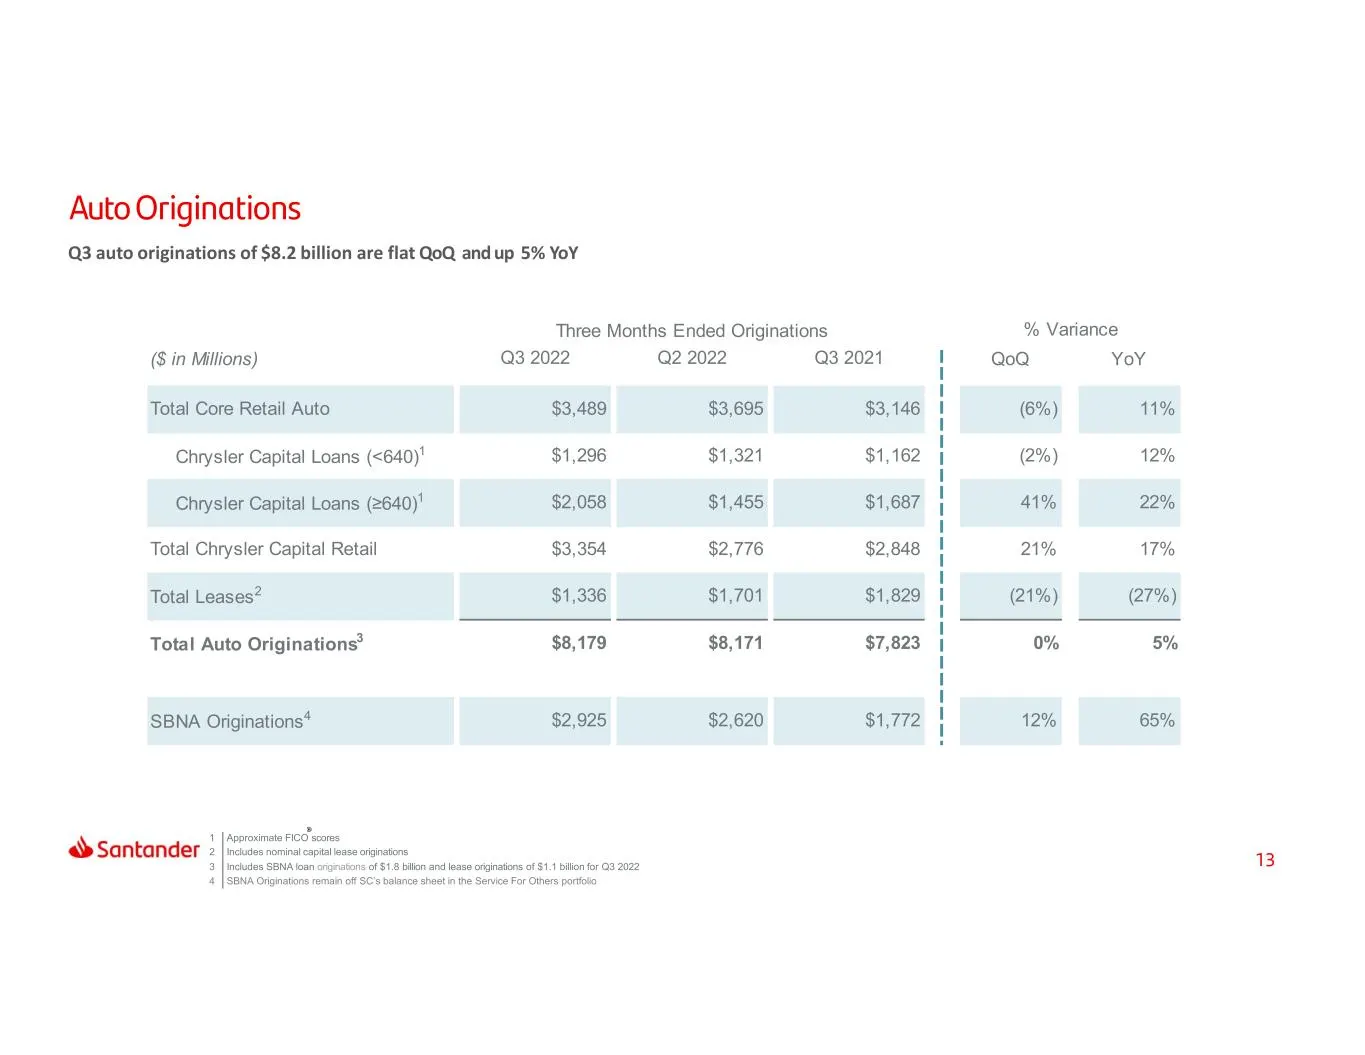
Slide 13: Auto originations
1 Approximate FICO scores 2 Includes nominal capital lease originations 3 Includes SBNA loan originations of $1.8 billion and lease originations of $1.1 billion for Q3 2022 4 SBNA Originations remain off SC’s balance sheet in the Service For Others portfolio Q3 auto originations of $8.2 billion are
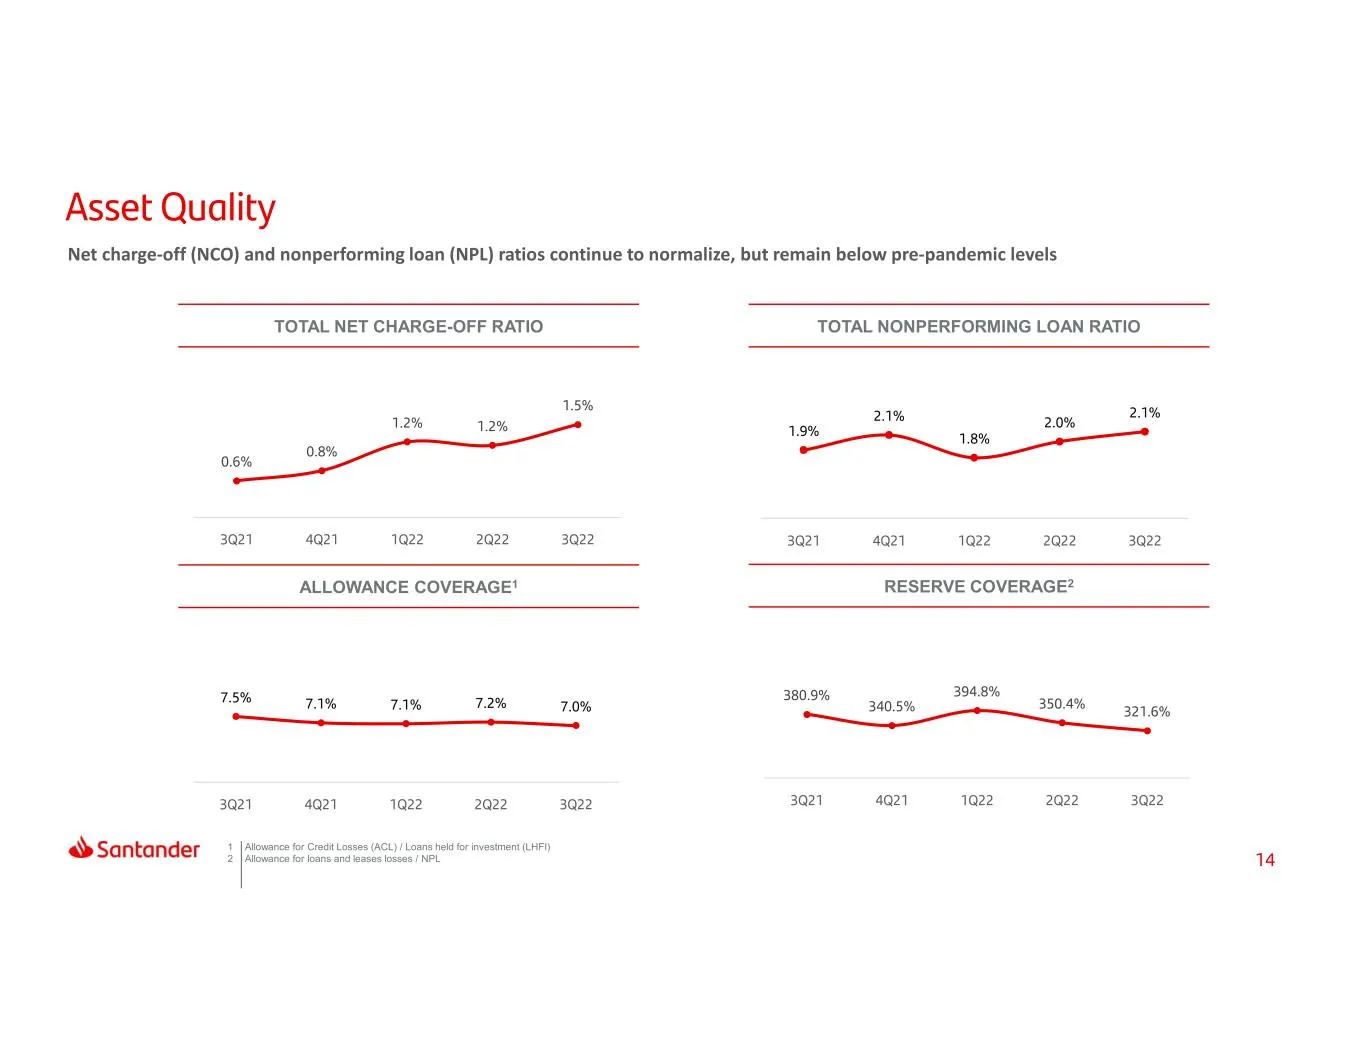
Slide 14: Net charge-off and nonperforming loan ratios
Net charge-off (NCO) and nonperforming loan (NPL) ratios continue to normalize, but remain below pre-pandemic levels TOTAL NET CHARGE-OFF RATIO ALLOWANCE COVERAGE1 RESERVE COVERAGE2 TOTAL NONPERFORMING LOAN RATIO 1 Allowance for Credit Losses (ACL) / Loans held for investment (LHFI) 2 Allowance for
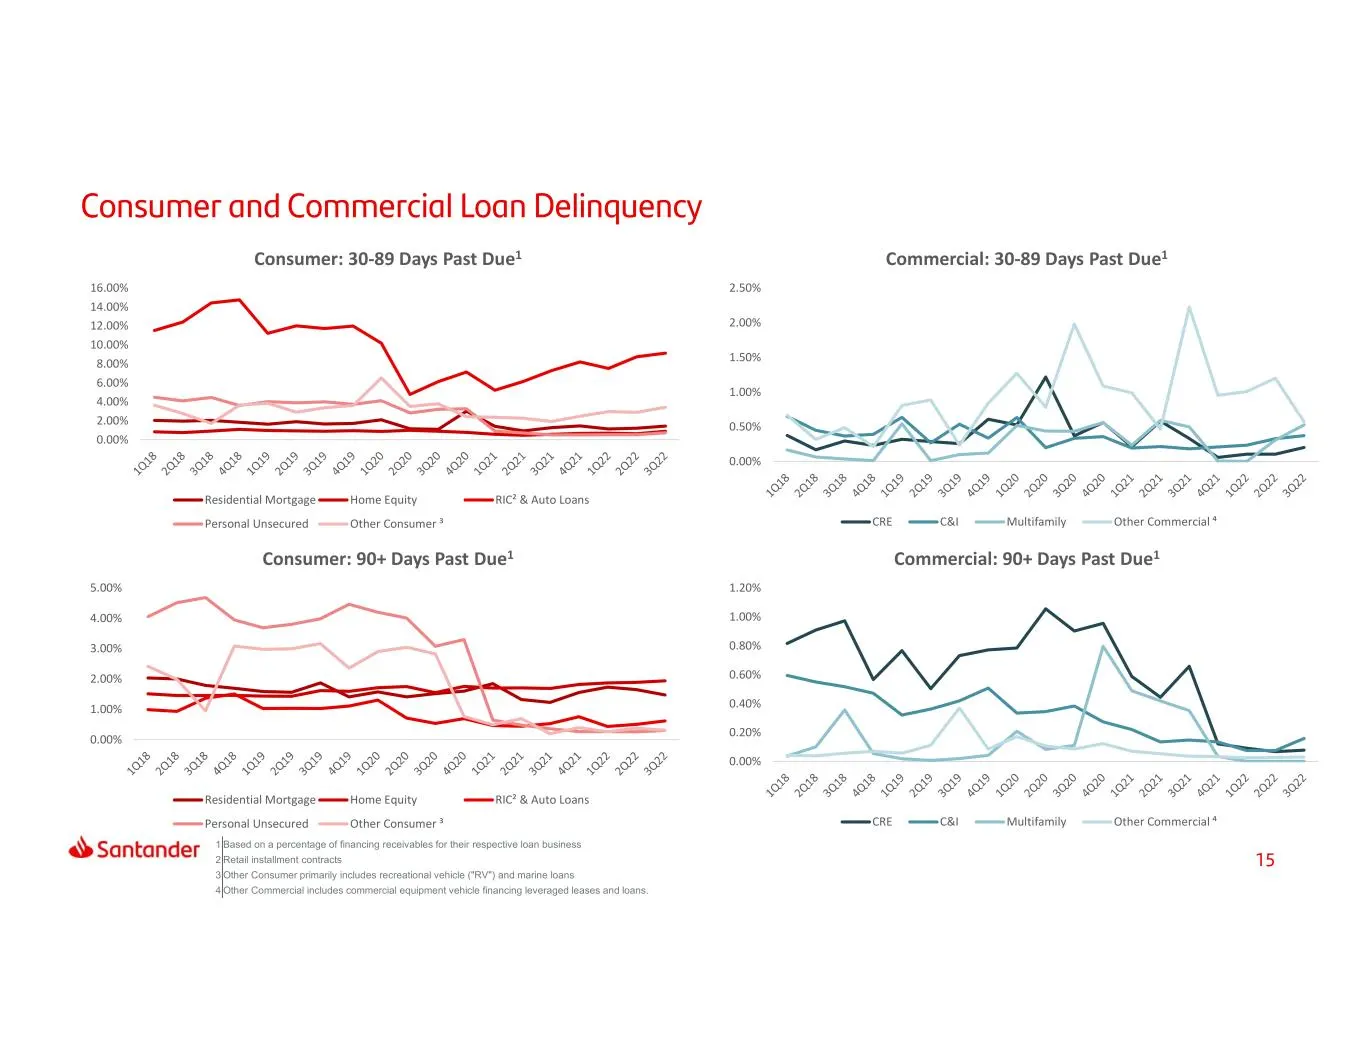
Slide 15: Delinquencies by consumer and commercial loan type
1 Based on a percentage of financing receivables for their respective loan business 2 Retail installment contracts 3 Other Consumer primarily includes recreational vehicle ("RV") and marine loans 4 Other Commercial includes commercial equipment vehicle financing leveraged leases and loans. 0.00% 2.0
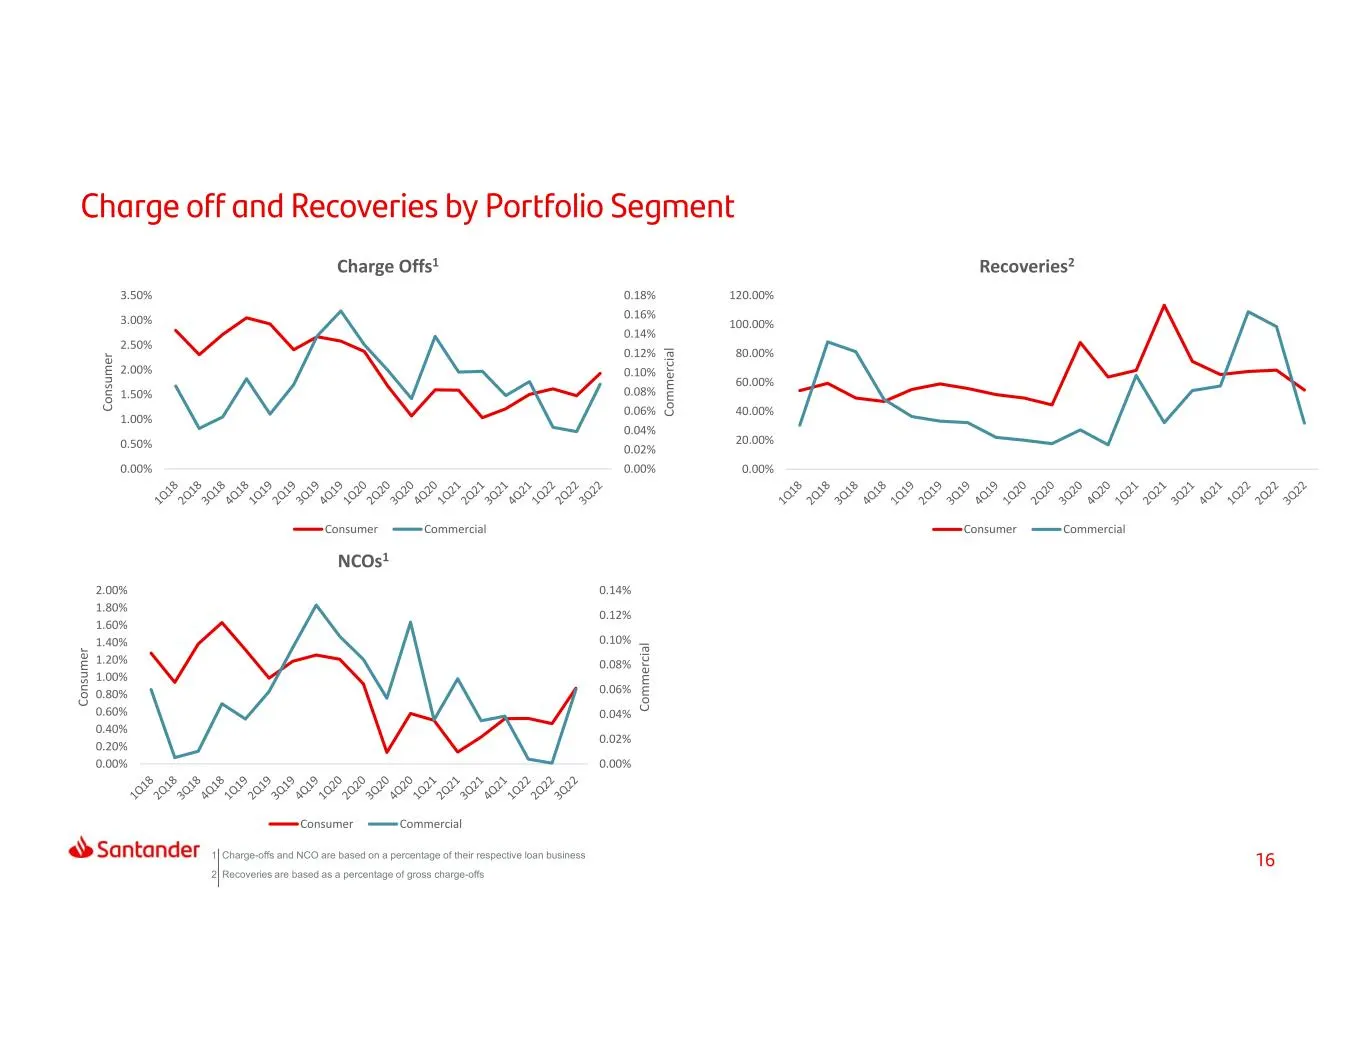
Slide 16: Charge-offs, recoveries and NCOs
1 Charge-offs and NCO are based on a percentage of their respective loan business 2 Recoveries are based as a percentage of gross charge-offs 0.00% 0.02% 0.04% 0.06% 0.08% 0.10% 0.12% 0.14% 0.16% 0.18% 0.00% 0.50% 1.00% 1.50% 2.00% 2.50% 3.00% 3.50% Co m m er ci al Co ns um er Charge Offs1 Consumer
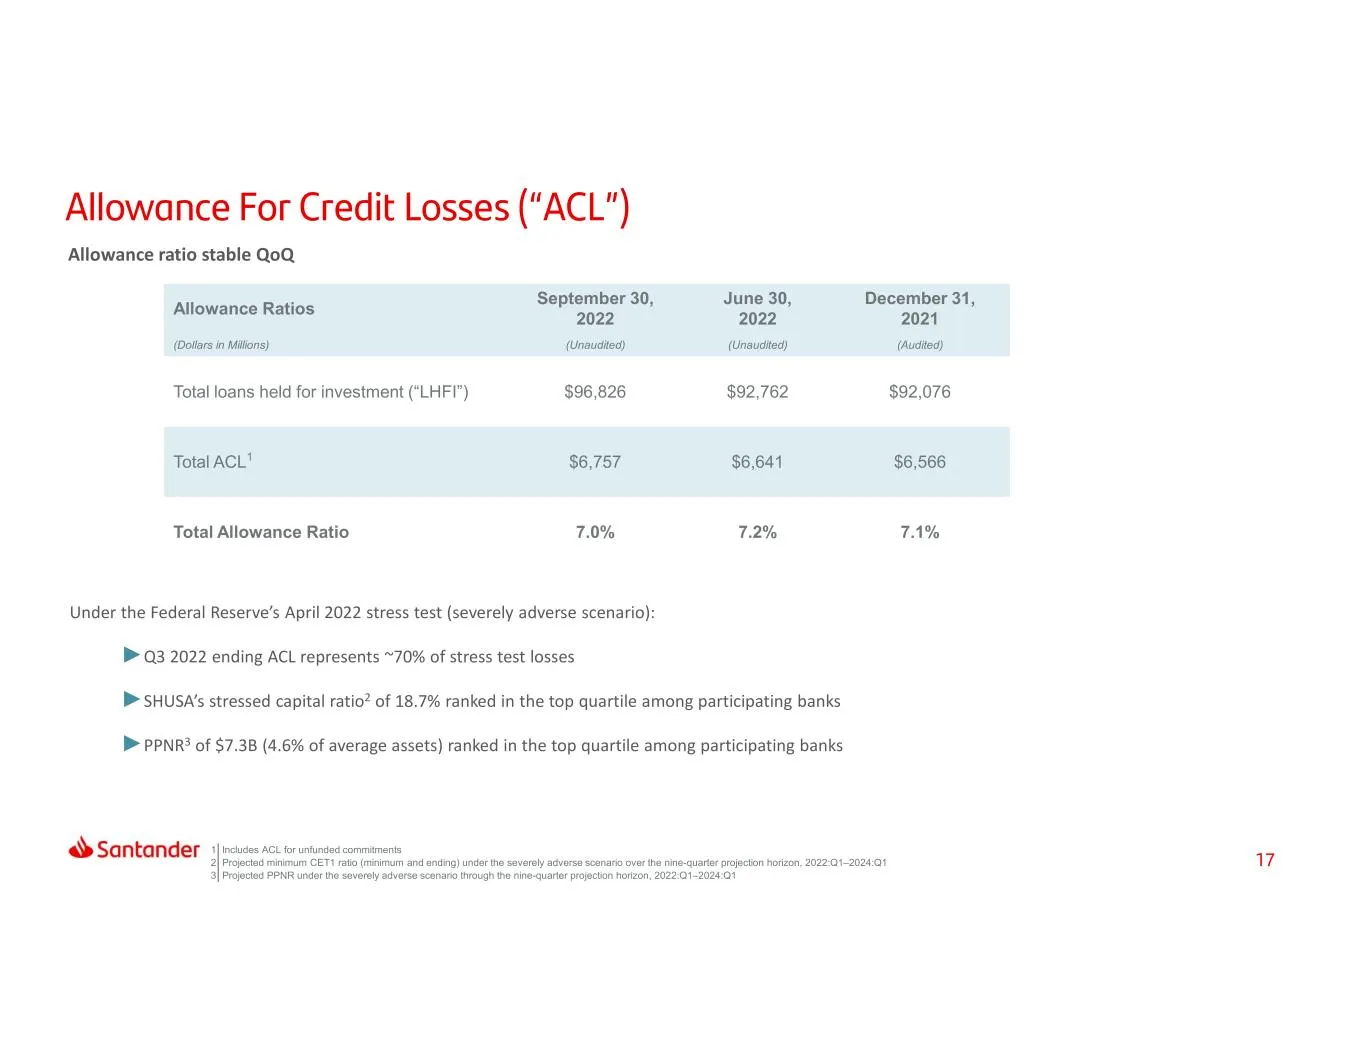
Slide 17: Allowance ratios and stress test results
Under the Federal Reserve’s April 2022 stress test (severely adverse scenario): ►Q3 2022 ending ACL represents ~70% of stress test losses ►SHUSA’s stressed capital ratio2 of 18.7% ranked in the top quartile among participating banks ►PPNR3 of $7.3B (4.6% of average assets) ranked in the top quartile
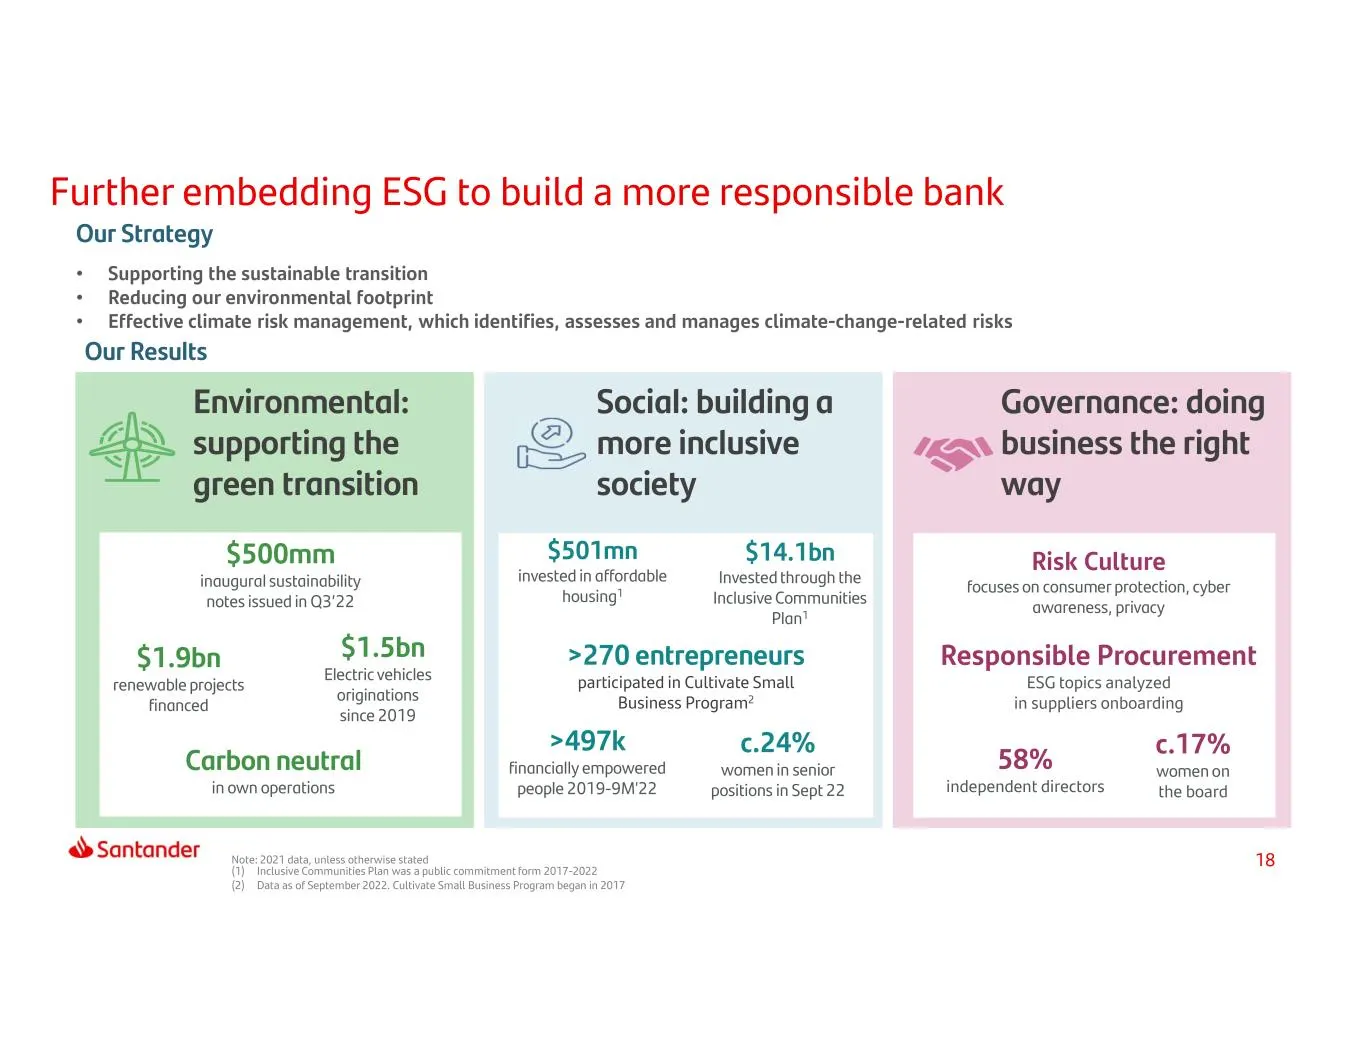
Slide 18: Further embedding ESG to build a more responsible bank
Further embedding ESG to build a more responsible bank Our Strategy Supporting the sustainable transition Reducing our environmental Footprint Effective climate risk management, which identifies, assesses and manages climate-change-related risks Our Results Environmental: s Social: building a . & .
Slide 19: Index
Index Ata Glance Results Capital & Ar Liquidity
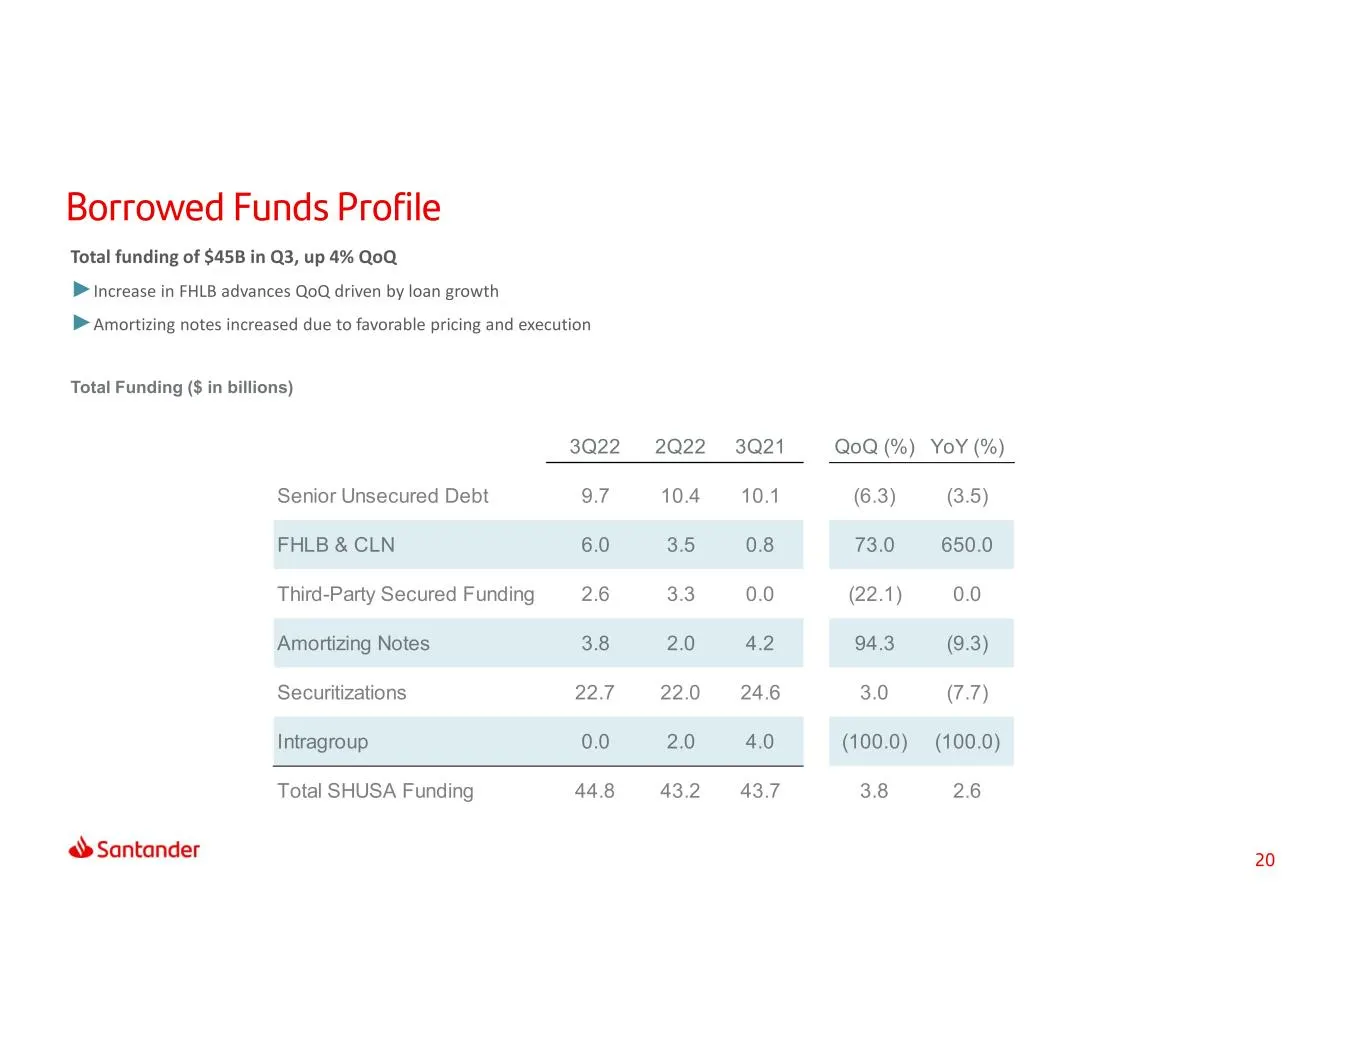
Slide 20: Total Funding
Total Funding ($ in billions) Total funding of $45B in Q3, up 4% QoQ ►Increase in FHLB advances QoQ driven by loan growth ►Amortizing notes increased due to favorable pricing and execution 3Q22 2Q22 3Q21 QoQ (%) YoY (%) Senior Unsecured Debt 9.7 10.4 10.1 (6.3) (3.5) FHLB & CLN 6.0 3.5 0.8 73.0 650.
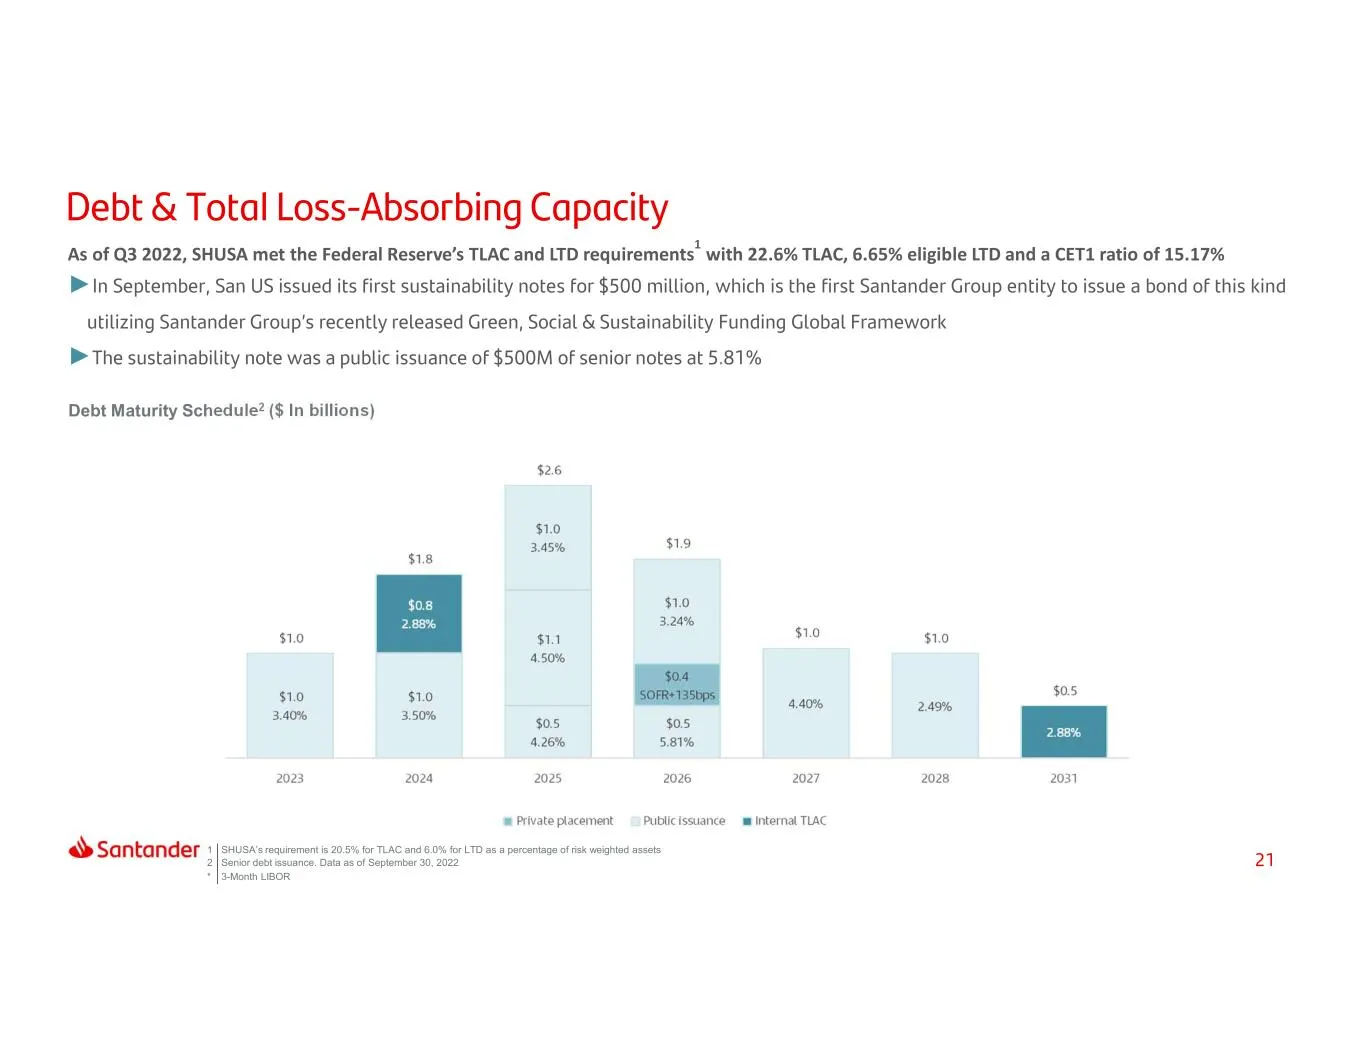
Slide 21: TLAC and LTD requirements, debt maturity schedule
1 SHUSA’s requirement is 20.5% for TLAC and 6.0% for LTD as a percentage of risk weighted assets 2 Senior debt issuance. Data as of September 30, 2022 * 3-Month LIBOR Debt Maturity Schedule2 ($ In billions) As of Q3 2022, SHUSA met the Federal Reserve’s TLAC and LTD requirements1 with 22.6% TLAC, 6.
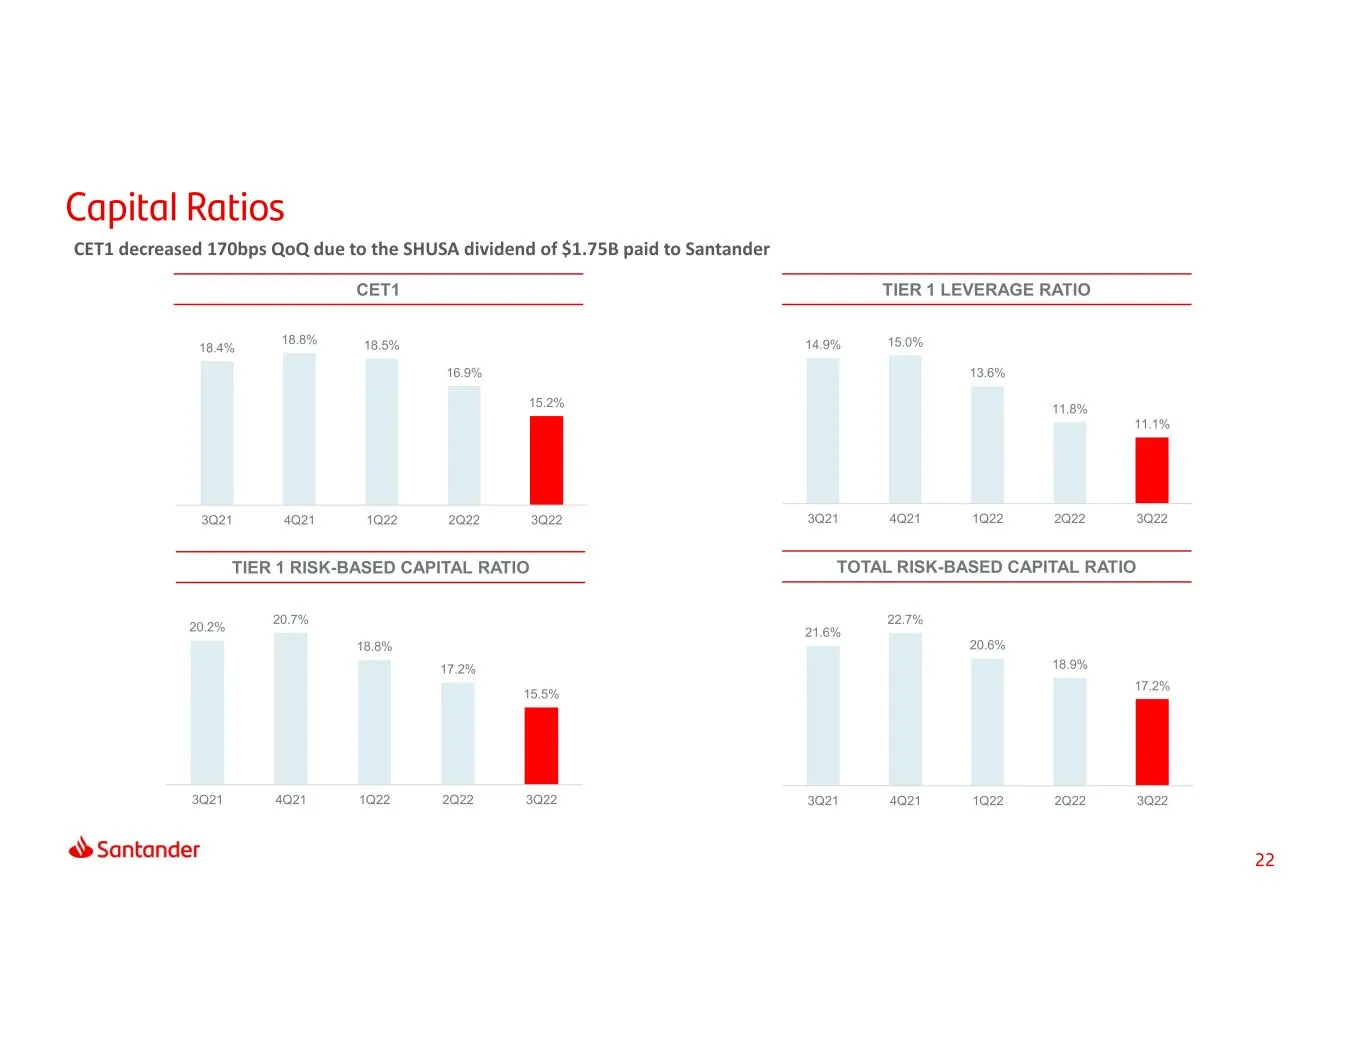
Slide 22: Capital ratios
CET1 TIER 1 RISK-BASED CAPITAL RATIO TOTAL RISK-BASED CAPITAL RATIO TIER 1 LEVERAGE RATIO CET1 decreased 170bps QoQ due to the SHUSA dividend of $1.75B paid to Santander 18.4% 18.8% 18.5% 16.9% 15.2% 3Q21 4Q21 1Q22 2Q22 3Q22 14.9% 15.0% 13.6% 11.8% 11.1% 3Q21 4Q21 1Q22 2Q22 3Q22 20.2% 20.7% 18.8% 17
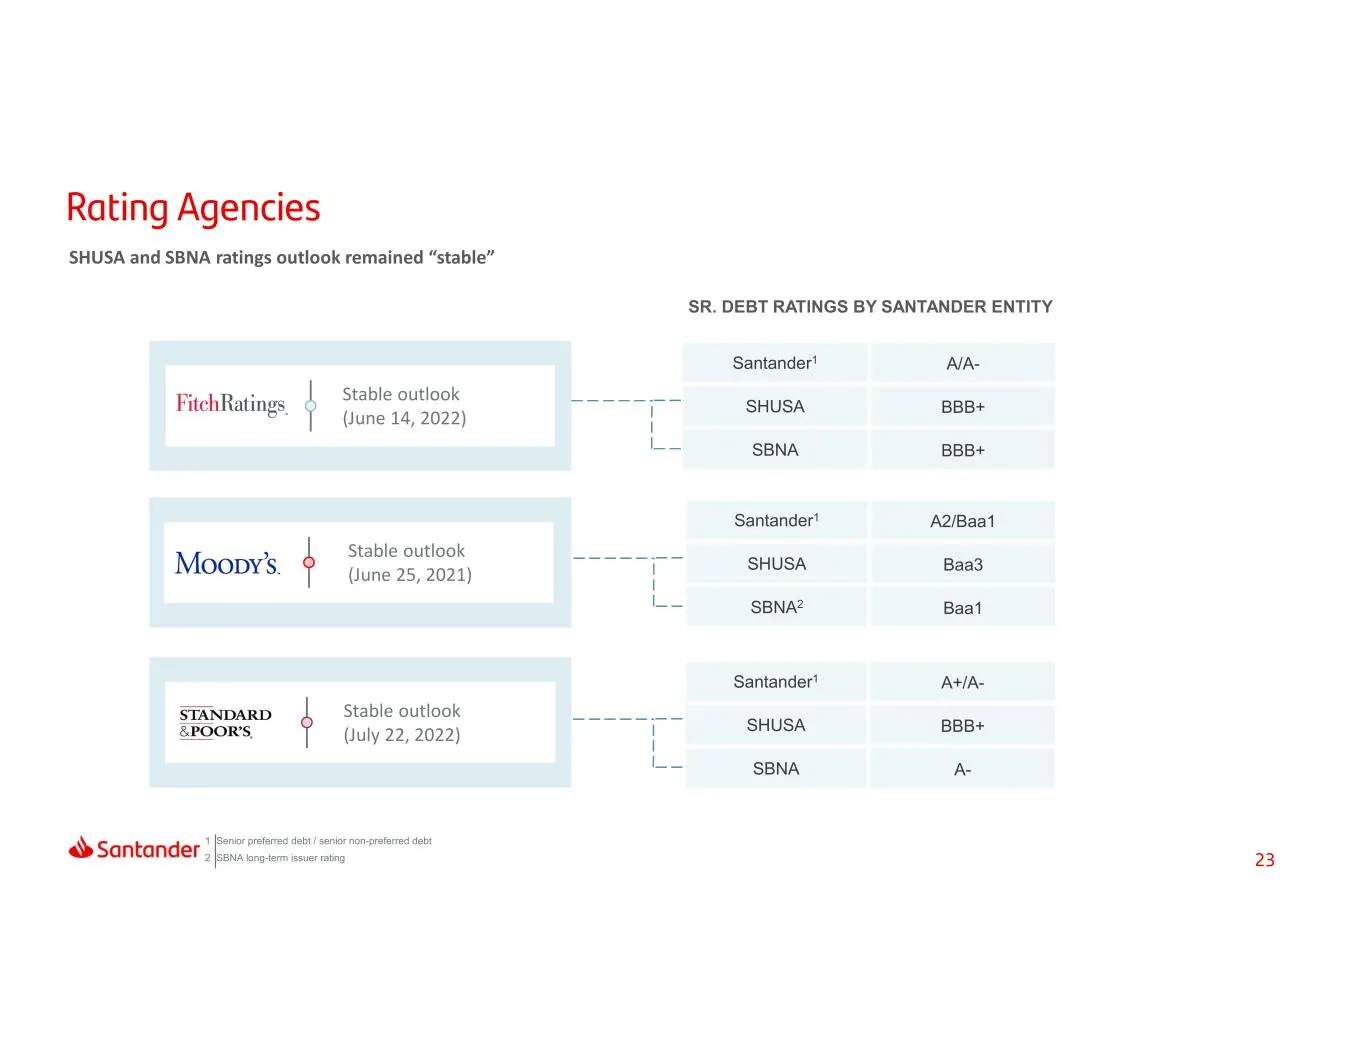
Slide 23: Senior debt ratings by Santander entity
Santander1 A2/Baa1 SHUSA Baa3 SBNA2 Baa1 Santander1 A+/A- SHUSA BBB+ SBNA A- Stable outlook (June 14, 2022) SHUSA and SBNA ratings outlook remained “stable” SR. DEBT RATINGS BY SANTANDER ENTITY Santander1 A/A- SHUSA BBB+ SBNA BBB+ Stable outlook (June 25, 2021) Stable outlook (July 22, 2022) 1 Senio
Slide 24: Index
Index At a Glance Results Capital & Appendix Liquidity
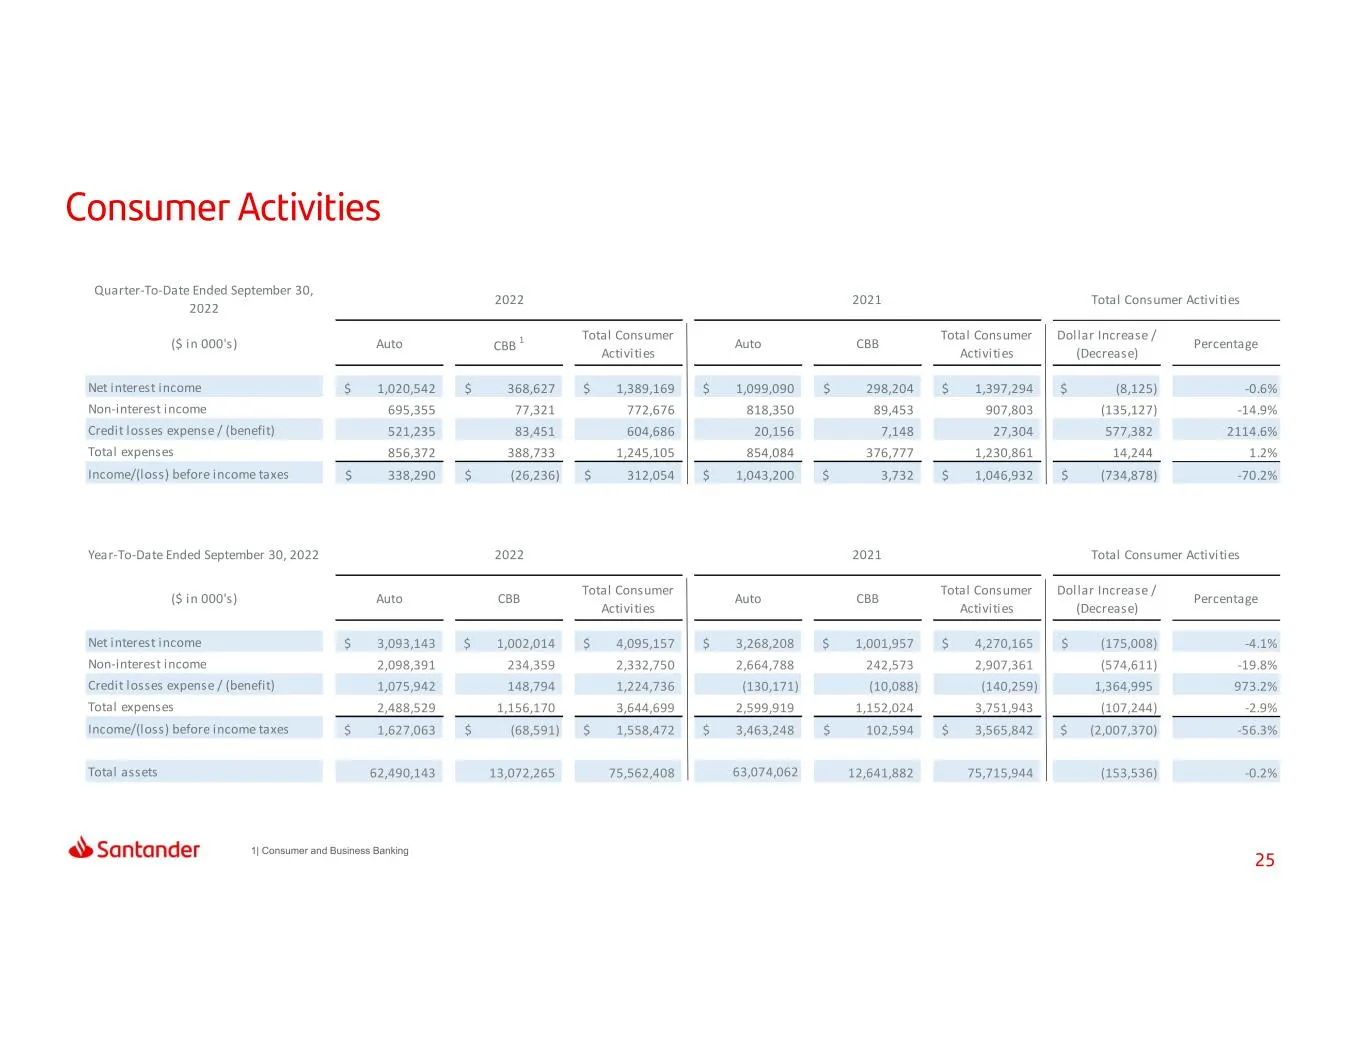
Slide 25: Consumer activities results
($ in 000's) Auto CBB Total Consumer Activities Auto CBB Total Consumer Activities Dol lar Increase / (Decrease) Percentage Net interest income 3,093,143$ 1,002,014$ 4,095,157$ 3,268,208$ 1,001,957$ 4,270,165$ (175,008)$ -4.1% Non-interest income 2,098,391 234,359 2,332,750 2,664,788 242,573 2,907,3
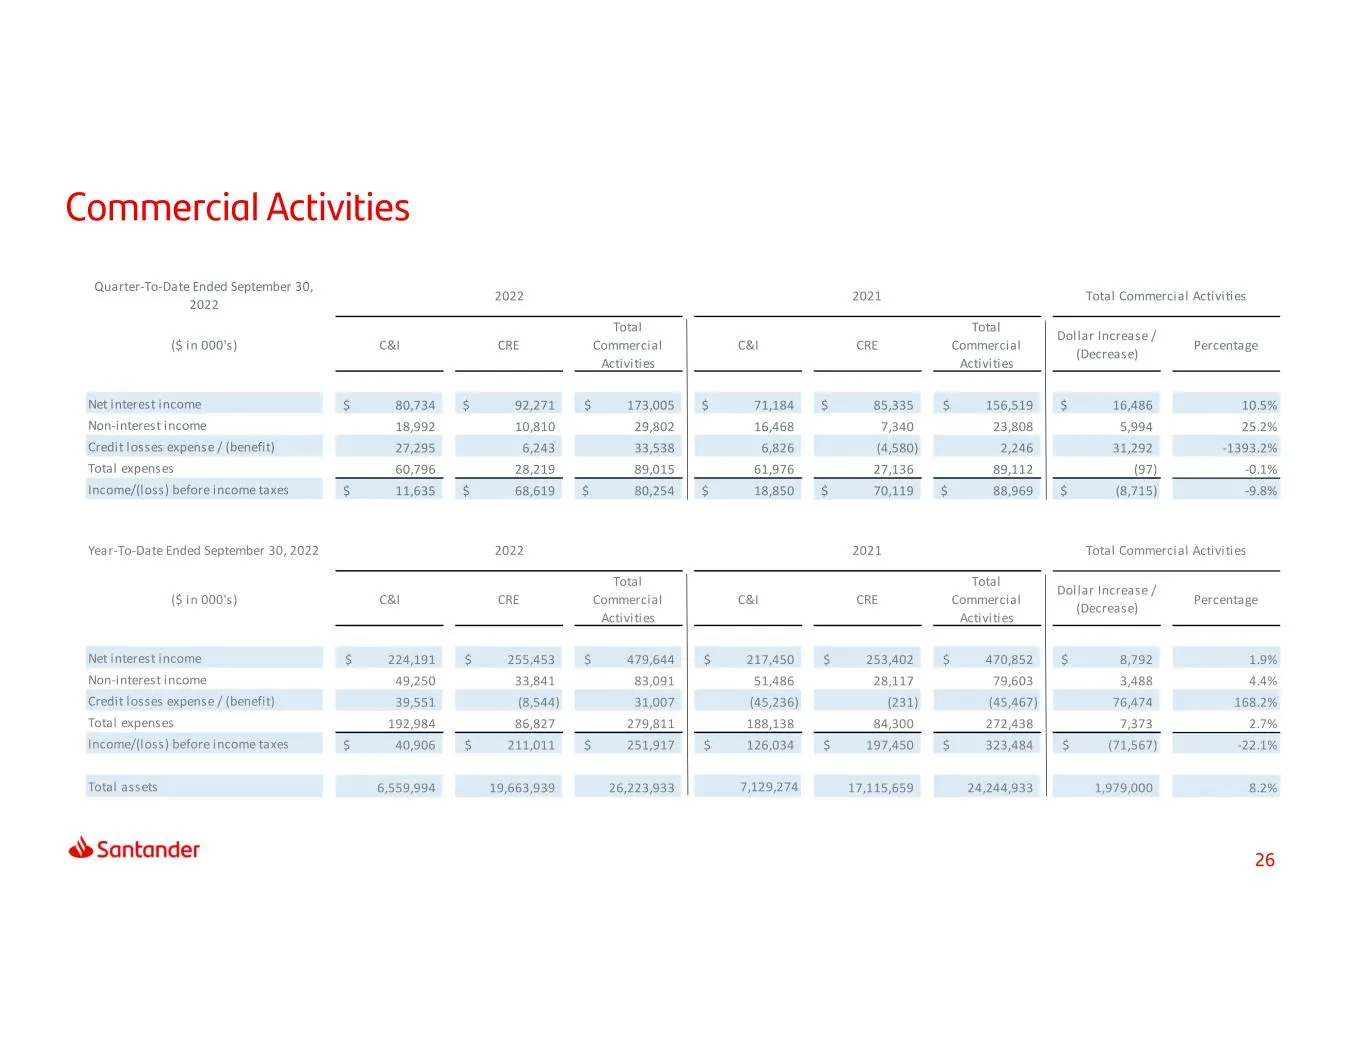
Slide 26: Commercial activities results
($ in 000's) C&I CRE Total Commercial Activities C&I CRE Total Commercial Activities Dol lar Increase / (Decrease) Percentage Net interest income 80,734$ 92,271$ 173,005$ 71,184$ 85,335$ 156,519$ 16,486$ 10.5% Non-interest income 18,992 10,810 29,802 16,468 7,340 23,808 5,994 25.2% Credit losses exp
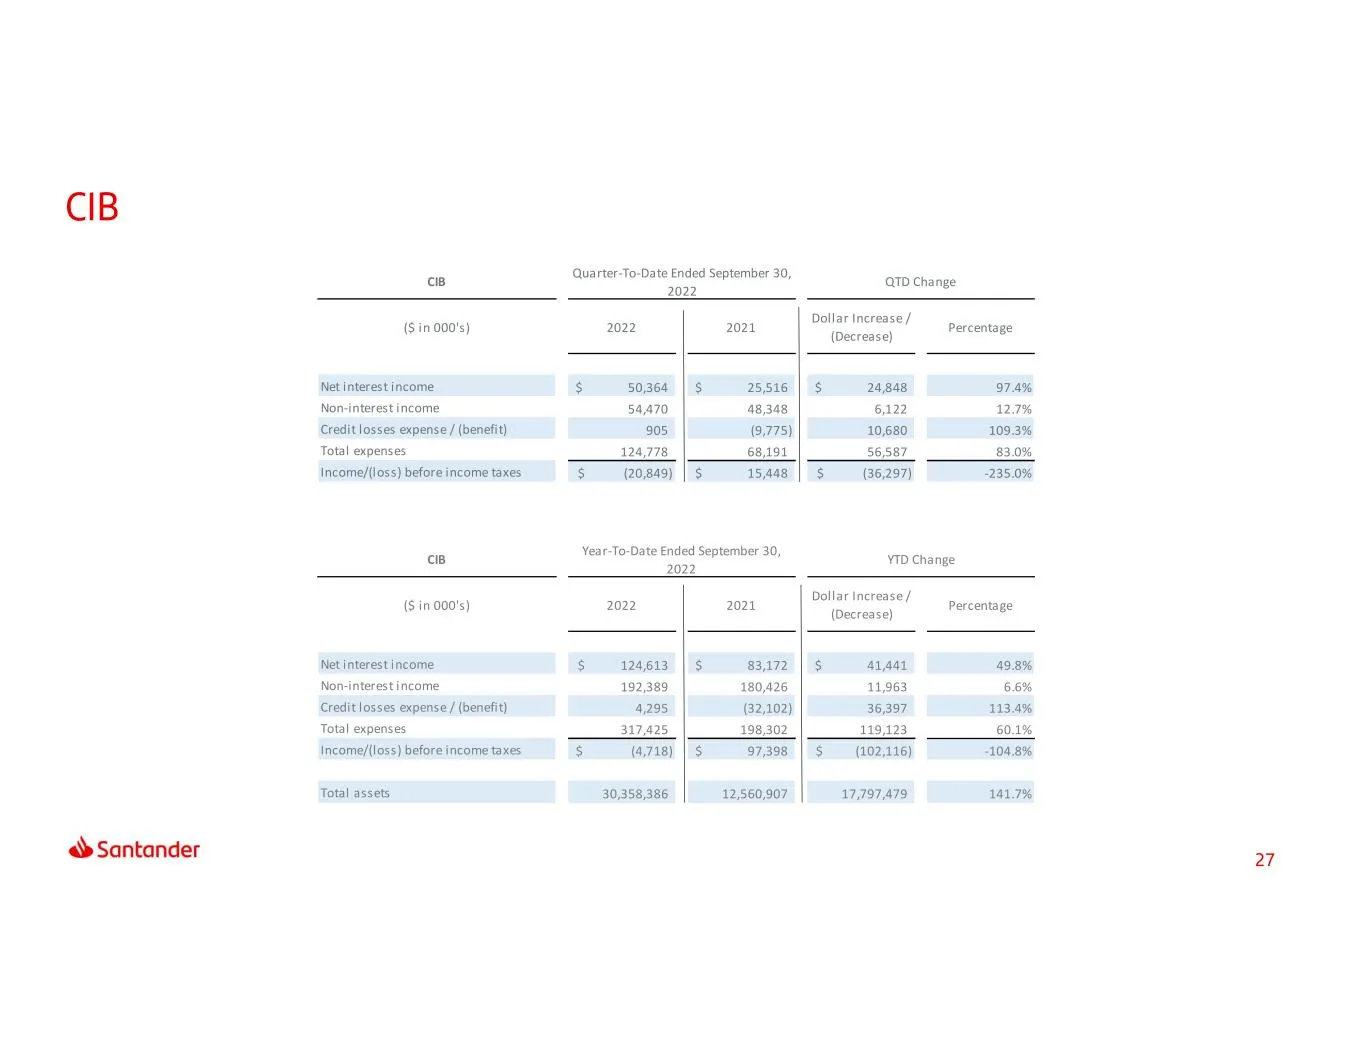
Slide 27: CIB results
CIB ($ in 000's) 2022 2021 Dollar Increase / (Decrease) Percentage Net interest income 50,364$ 25,516$ 24,848$ 97.4% Non-interest income 54,470 48,348 6,122 12.7% Credit losses expense / (benefit) 905 (9,775) 10,680 109.3% Total expenses 124,778 68,191 56,587 83.0% Income/(loss) before income taxes
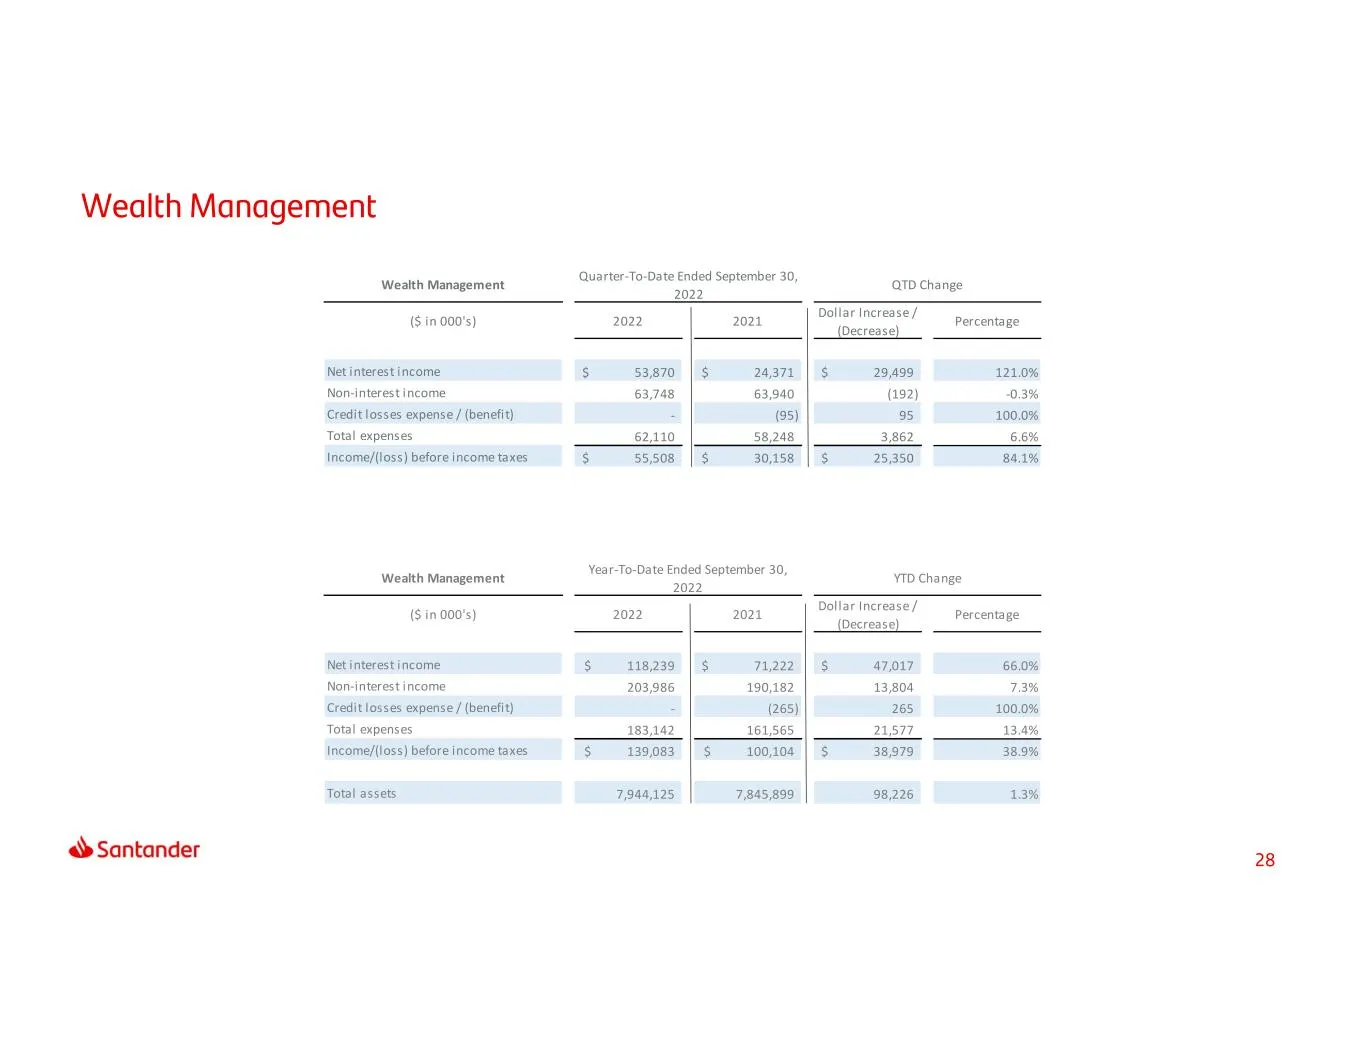
Slide 28: Wealth Management results
Wealth Management ($ in 000's) 2022 2021 Dollar Increase / (Decrease) Percentage Net interest income 53,870$ 24,371$ 29,499$ 121.0% Non-interest income 63,748 63,940 (192) -0.3% Credit losses expense / (benefit) - (95) 95 100.0% Total expenses 62,110 58,248 3,862 6.6% Income/(loss) before income tax
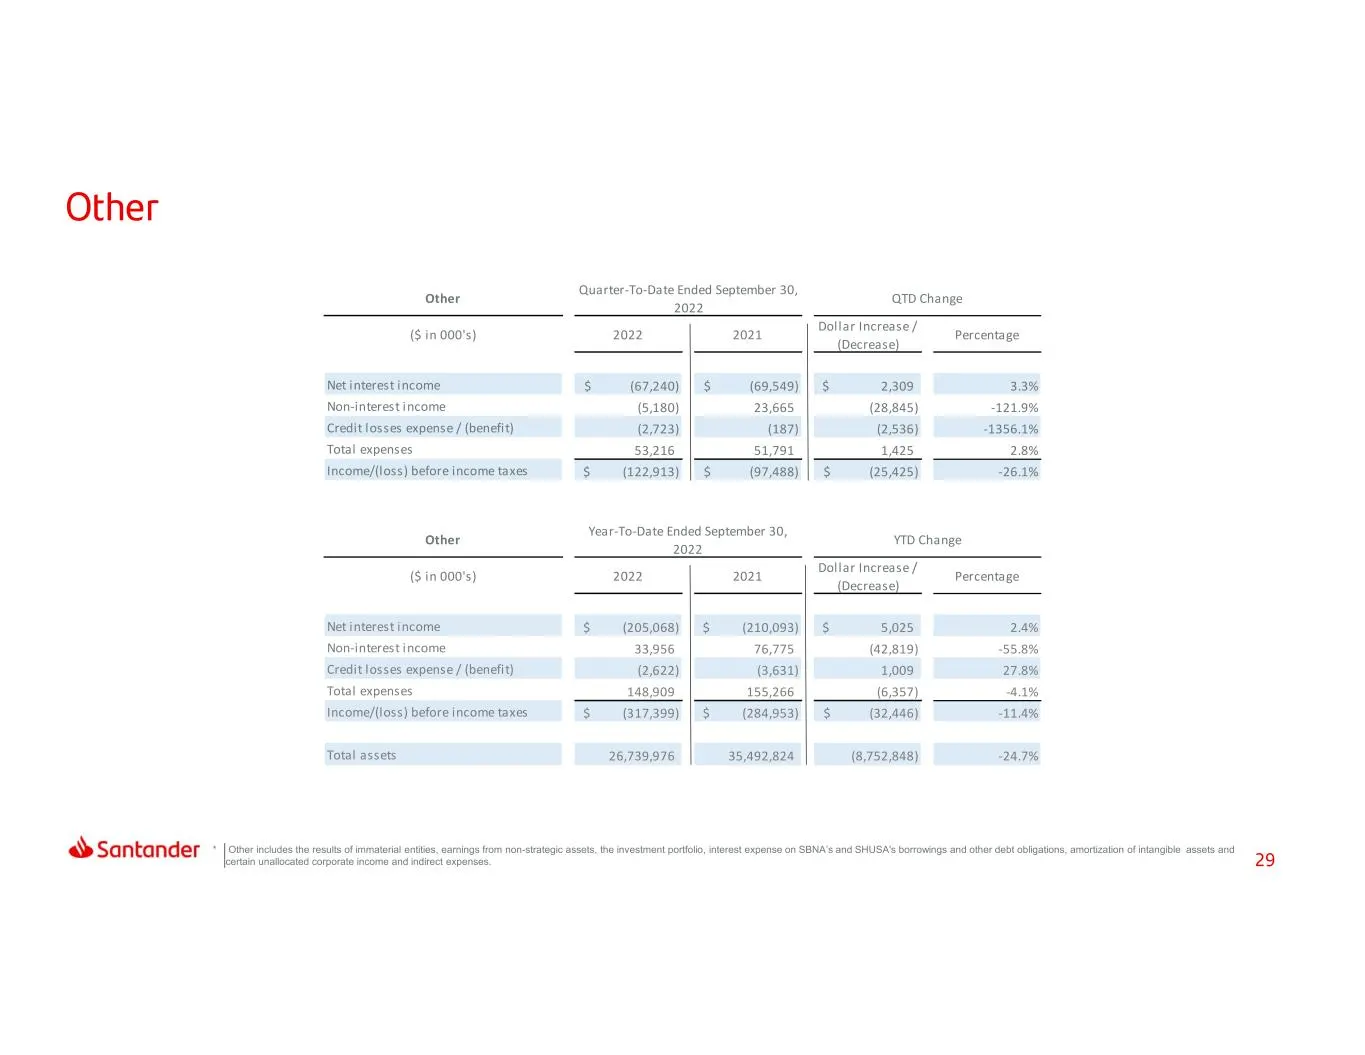
Slide 29: Other results
* Other includes the results of immaterial entities, earnings from non-strategic assets, the investment portfolio, interest expense on SBNA’s and SHUSA's borrowings and other debt obligations, amortization of intangible .assets and certain unallocated corporate income and indirect expenses. Other ($
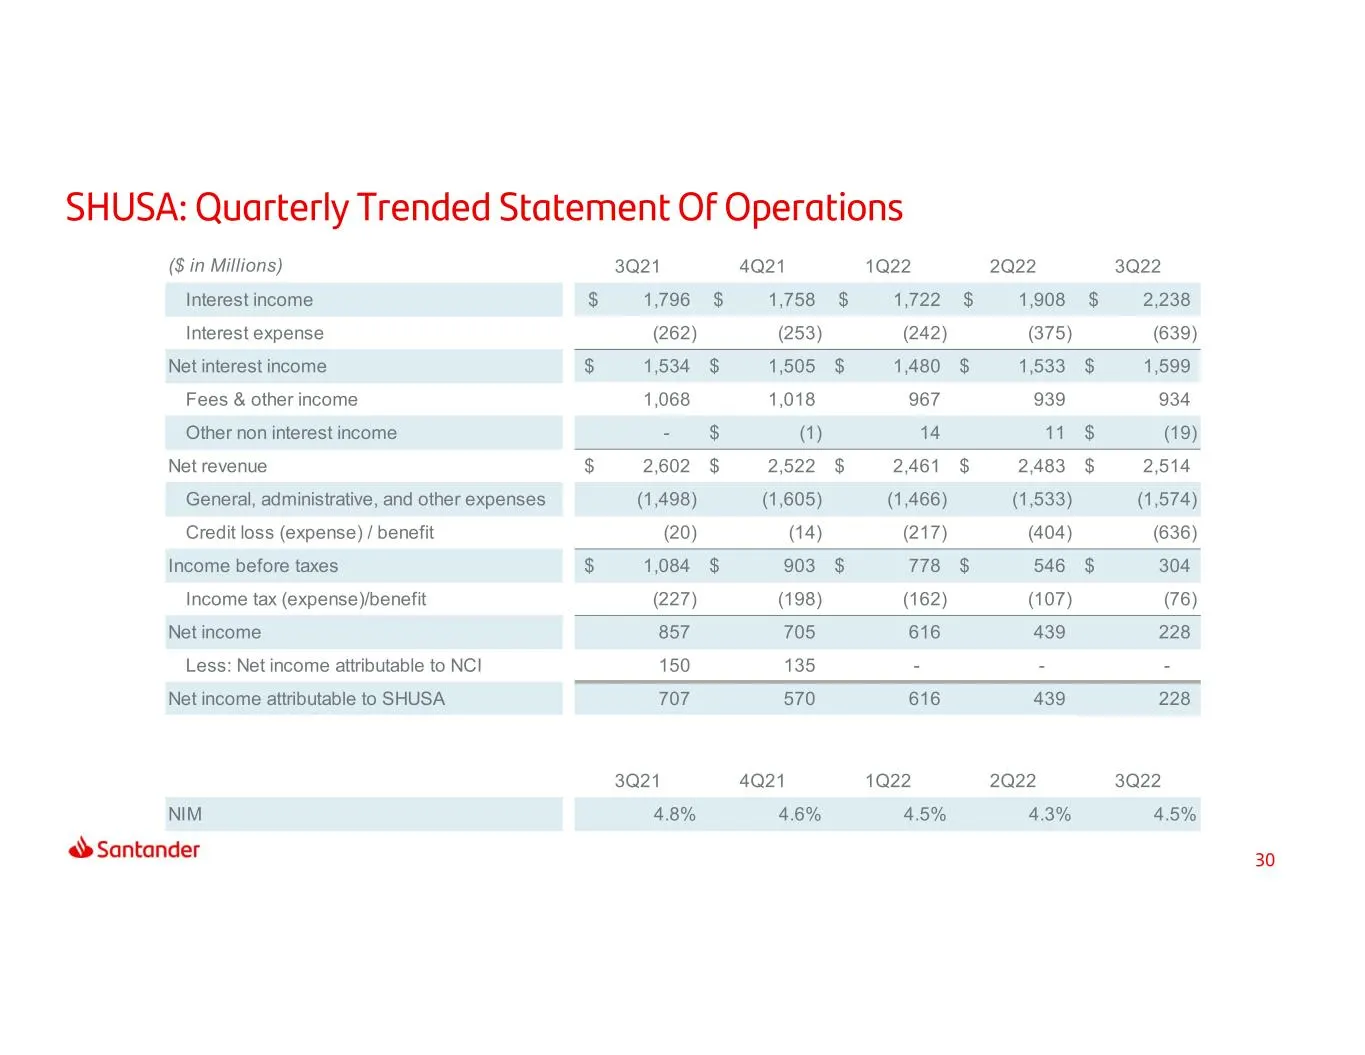
Slide 30: Consolidating income statement
($ in Millions) 3Q21 4Q21 1Q22 2Q22 3Q22 Interest income 1,796$ 1,758$ 1,722$ 1,908$ 2,238$ Interest expense (262) (253) (242) (375) (639) Net interest income 1,534$ 1,505$ 1,480$ 1,533$ 1,599$ Fees & other income 1,068 1,018 967 939 934 Other non interest income - (1)$ 14 11 (19)$ Net revenue 2,602
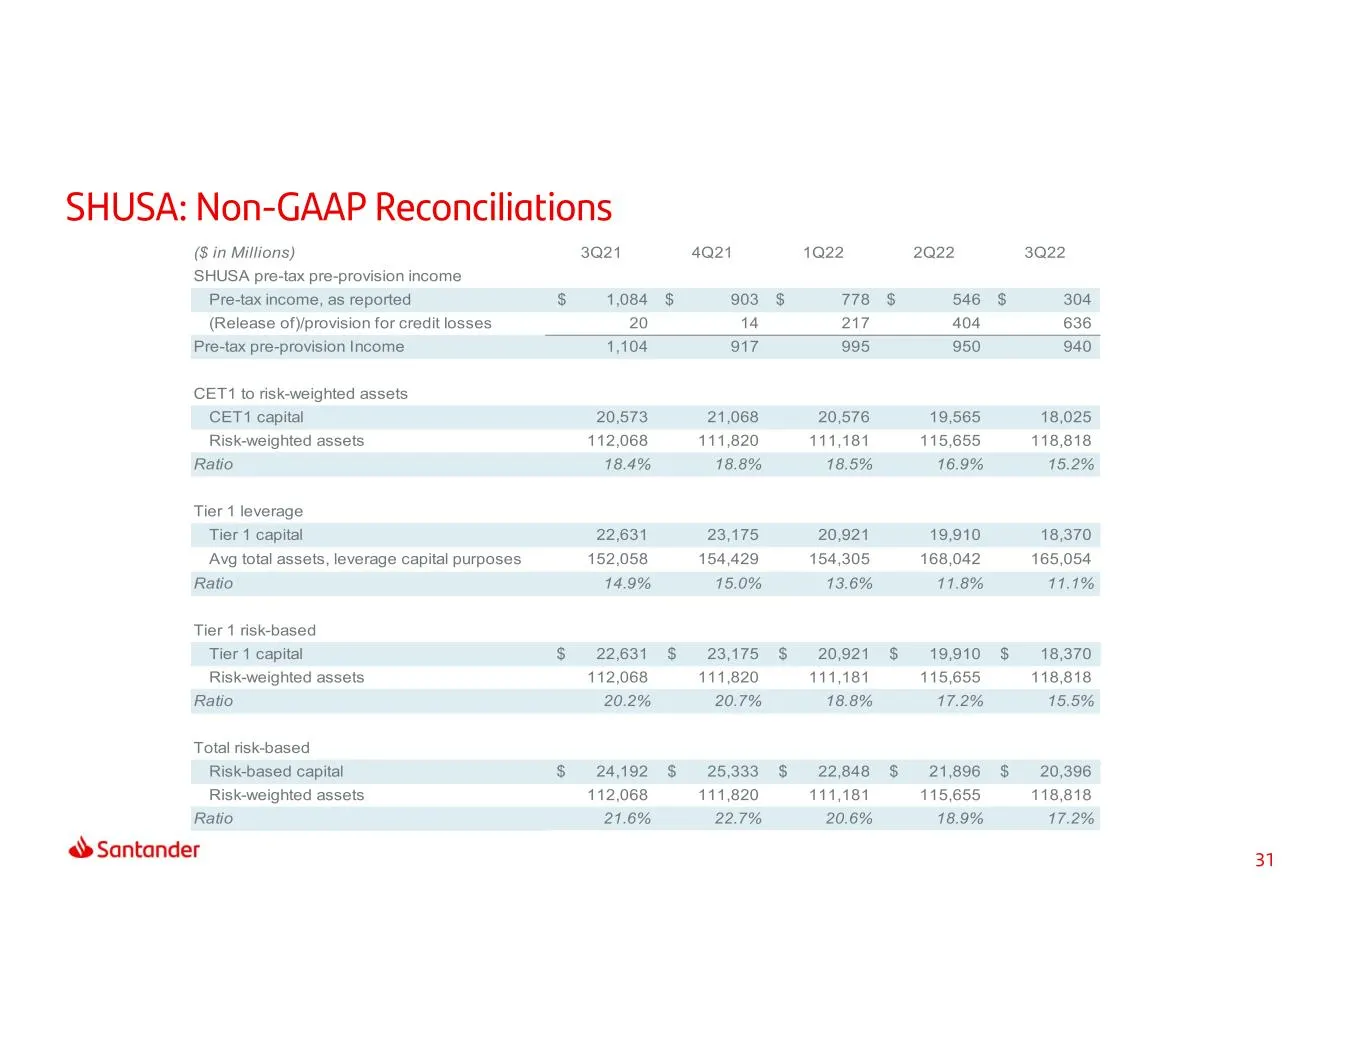
Slide 31: Pre-tax pre-provision income and capital ratio reconciliation
($ in Millions) 3Q21 4Q21 1Q22 2Q22 3Q22 SHUSA pre-tax pre-provision income Pre-tax income, as reported 1,084$ 903$ 778$ 546$ 304$ (Release of)/provision for credit losses 20 14 217 404 636 Pre-tax pre-provision Income 1,104 917 995 950 940 CET1 to risk-weighted assets CET1 capital 20,573 21,068 20,
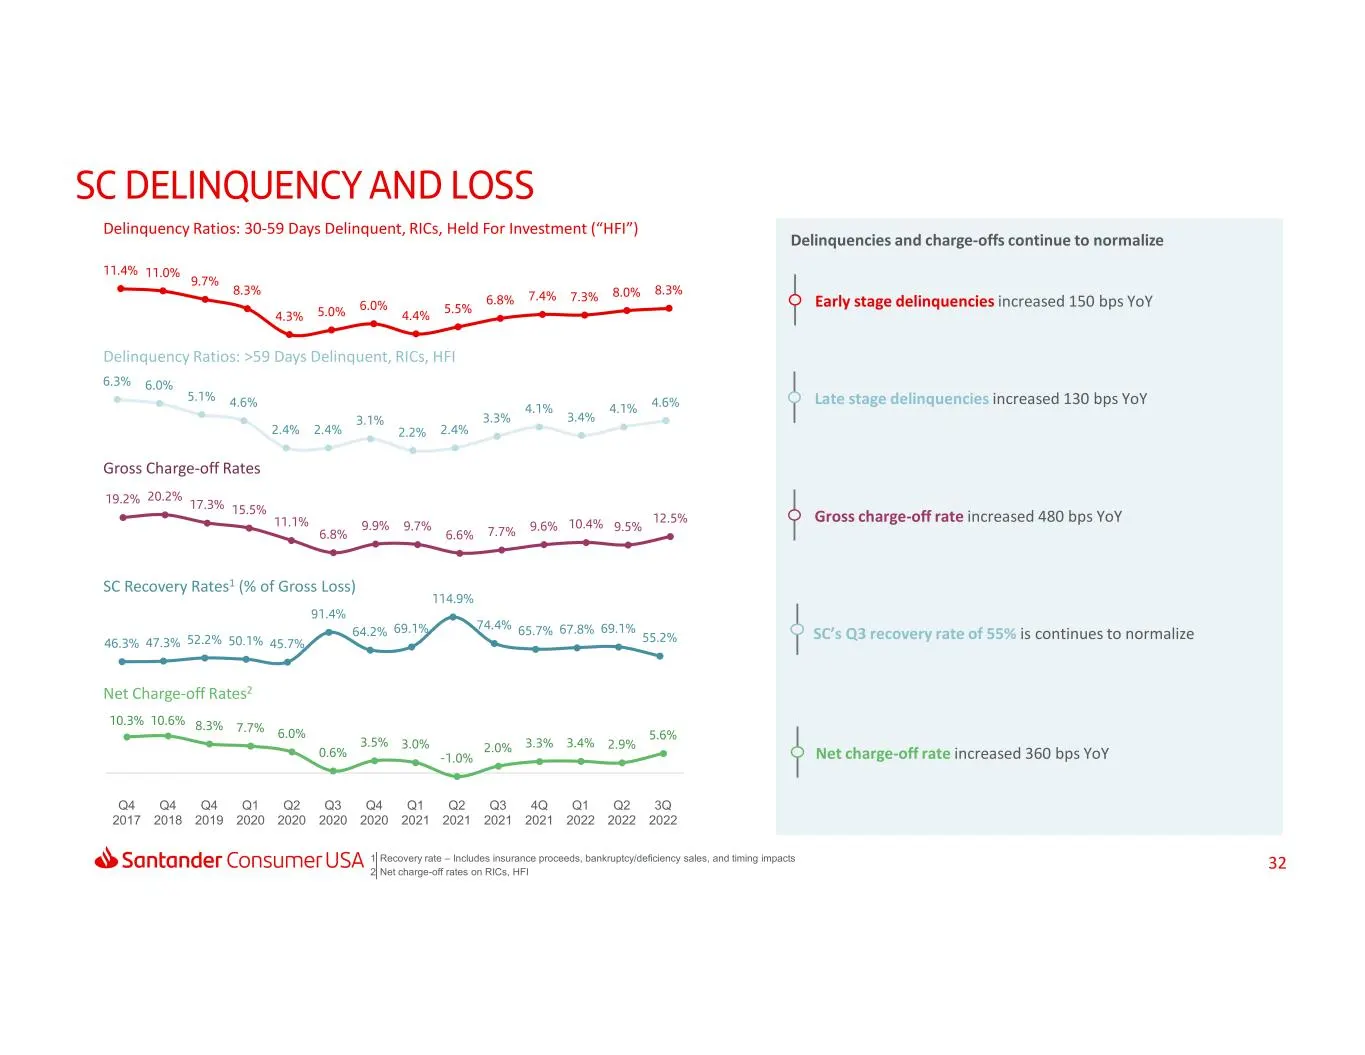
Slide 32: SC recovery rates, delinquencies and charge-off rates
32 SC Recovery Rates1 (% of Gross Loss) Net Charge-off Rates2 Late stage delinquencies increased 130 bps YoY Gross charge-off rate increased 480 bps YoY SC’s Q3 recovery rate of 55% is continues to normalize Net charge-off rate increased 360 bps YoY Early stage delinquencies increased 150 bps YoY De
Slide 33: Thank You.
Thank You. Our purpose is to help people and businesses prosper. Our culture is based on believing that everything we do should be: Simple Personal Fair. Dow Jo Sustainability Indices *) @ Santander Sustainabityindces
Source: SEC EDGAR · 8-K filed Nov 15, 2022
More decks from Santander Holdings USA Inc
 Debt Investor Presentation (August 2026)30 slides · Aug 12, 2026
 Debt Investor Presentation (August 2026)30 slides · Aug 12, 2026
 Debt Investor Presentation (June 2026)29 slides · Jun 12, 2026
 Debt Investor Presentation (June 2026)29 slides · Jun 12, 2026
 Debt Investor Presentation (March 2026)36 slides · Mar 6, 2026
 Debt Investor Presentation (March 2026)36 slides · Mar 6, 2026