Heartland Financial USA — Investor Presentation (April 2016)
51 slides from Heartland Financial USA's investor presentation, Apr 8, 2016
Slide 1: 2016 Investor Presentation
Investor Presentation Lynn B. Fuller Chairman and CEO Bryan R. McKeag Chief Financial Officer 2016 Investor Presentation Trading Symbol: HTLF www.htlf.com
Slide 2: Safe Harbor
2 Safe Harbor This presentation may contain, and future oral and written statements of the Company and its management may contain, forward-looking statements within the meaning of the Private Securities Litigation Reform Act of 1995 with respect to the financial condition, results of operations, pla
Slide 3: Agenda
3 Agenda Heartland’s growth story Key tenets of Heartland’s business model Financial Highlights
Slide 4: Tremendous Growth in Assets and Shareholder Return
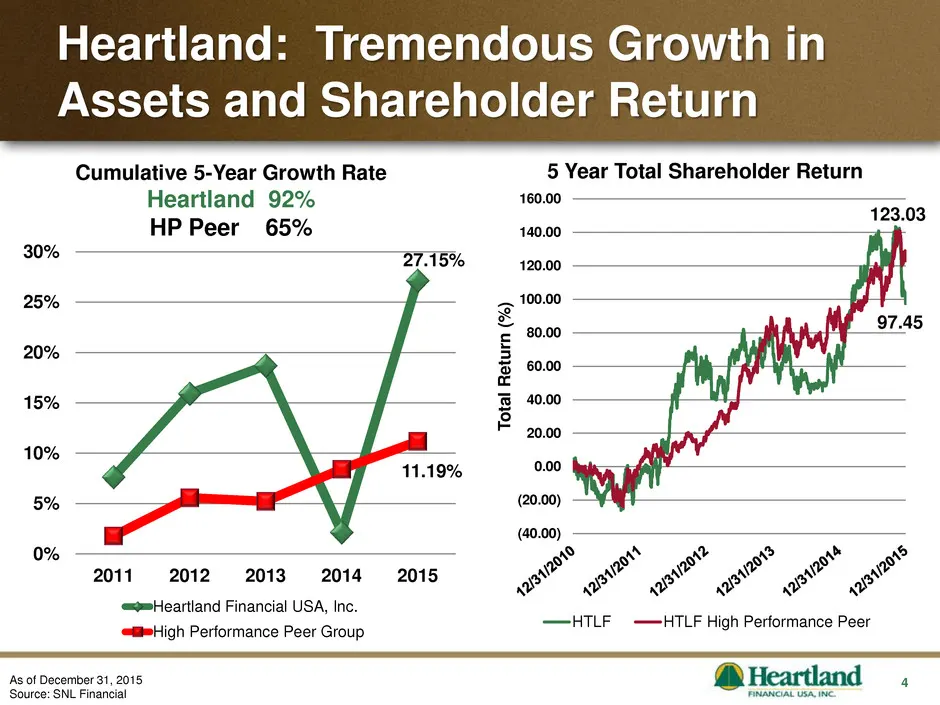
4 Heartland: Tremendous Growth in Assets and Shareholder Return As of December 31, 2015 Source: SNL Financial Cumulative 5-Year Growth Rate Heartland 92% HP Peer 65% 97.45 123.03 (40.00) (20.00) 0.00 20.00 40.00 60.00 80.00 100.00 120.00 140.00 160.00 T otal Return ( % ) 5 Year Total Shareholder Ret
Slide 5: Exceptional Performance Reflected in Stock Performance
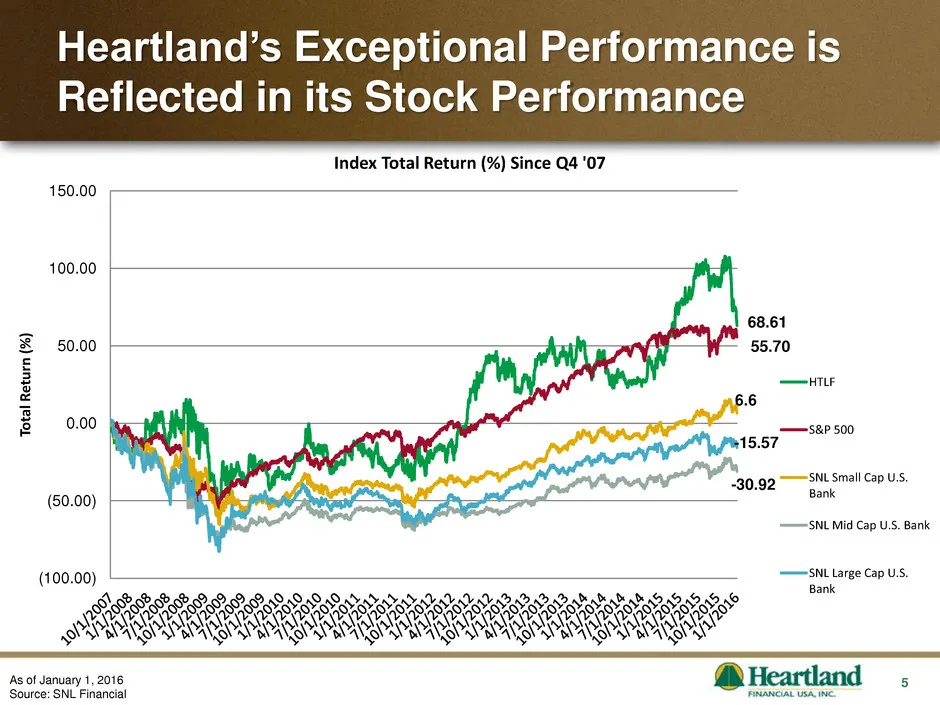
5 Heartland’s Exceptional Performance is Reflected in its Stock Performance As of January 1, 2016 Source: SNL Financial (100.00) (50.00) 0.00 50.00 100.00 150.00 To ta l R et u rn (% ) Index Total Return (%) Since Q4 '07 HTLF S&P 500 SNL Small Cap U.S. Bank SNL Mid Cap U.S. Bank SNL Large Cap U.S. B
Slide 6: $7.7 Billion in Assets: long history of growth, stability and diversity
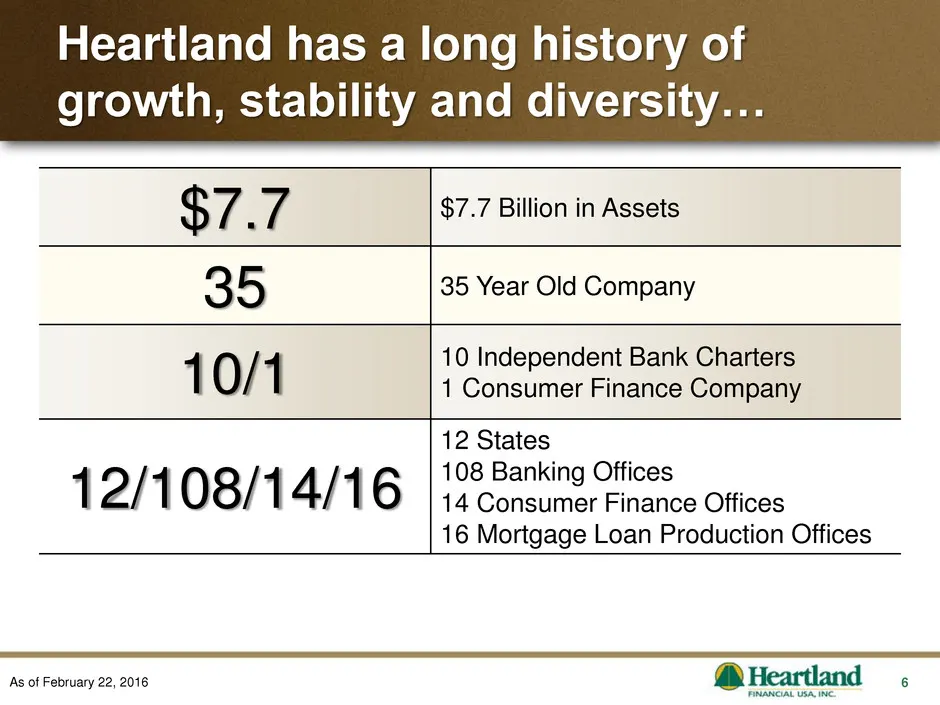
6 $7.7 $7.7 Billion in Assets 35 35 Year Old Company 10/1 10 Independent Bank Charters 1 Consumer Finance Company 12/108/14/16 12 States 108 Banking Offices 14 Consumer Finance Offices 16 Mortgage Loan Production Offices Heartland has a long history of growth, stability and diversity… As of February
Slide 7: Tremendous history of earnings
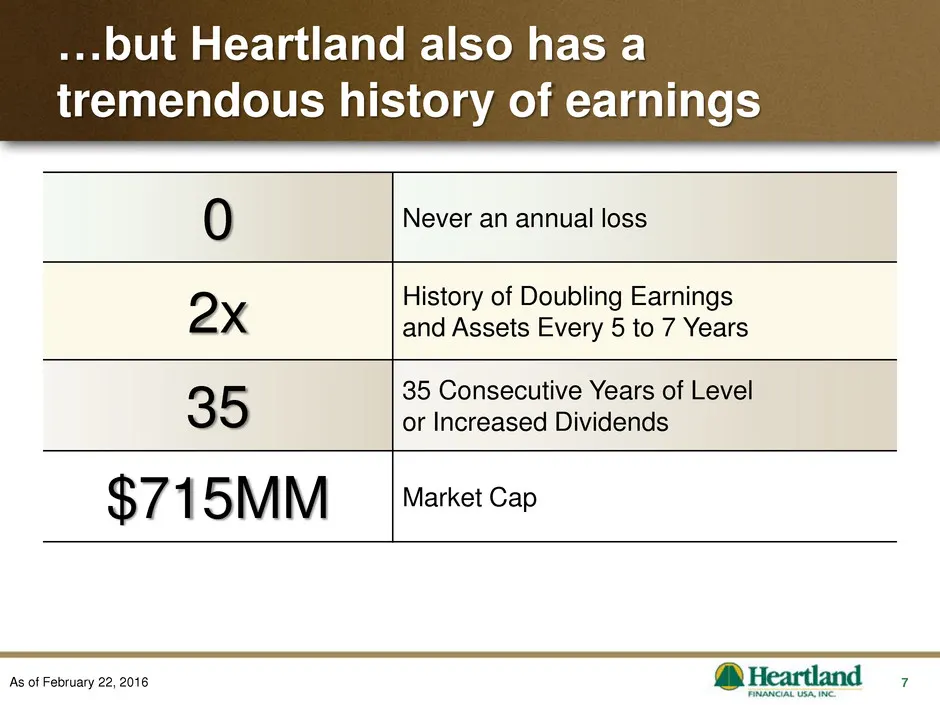
7 0 Never an annual loss 2x History of Doubling Earnings and Assets Every 5 to 7 Years 35 35 Consecutive Years of Level or Increased Dividends $715MM Market Cap …but Heartland also has a tremendous history of earnings As of February 22, 2016
Slide 8: An Expanding Franchise
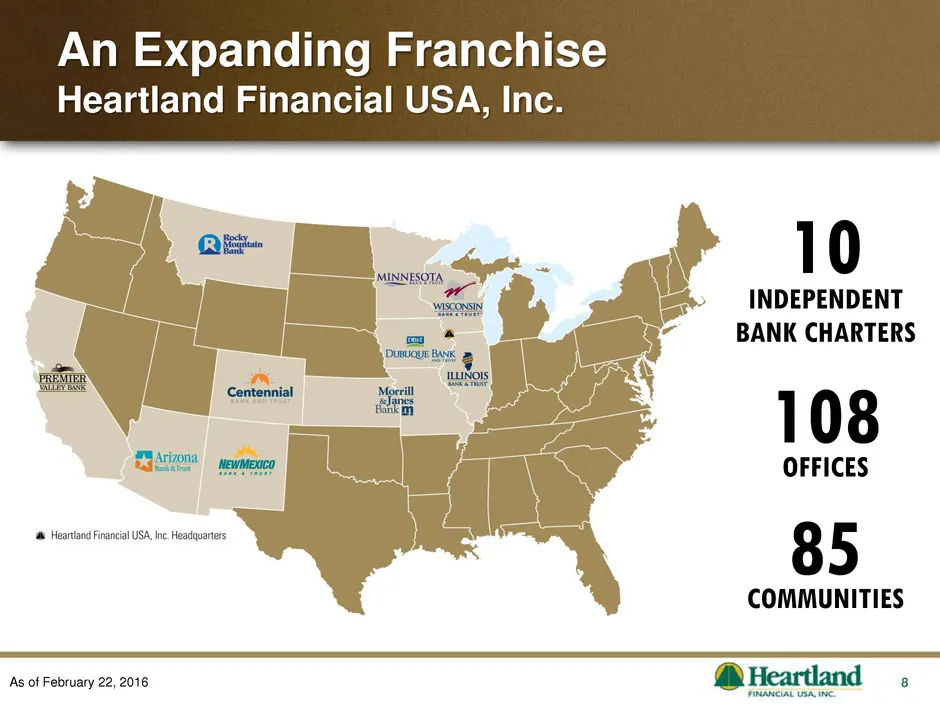
8 An Expanding Franchise Heartland Financial USA, Inc. As of February 22, 2016 10 INDEPENDENT BANK CHARTERS 108 OFFICES 85 COMMUNITIES
Slide 9: Expansion Timeline
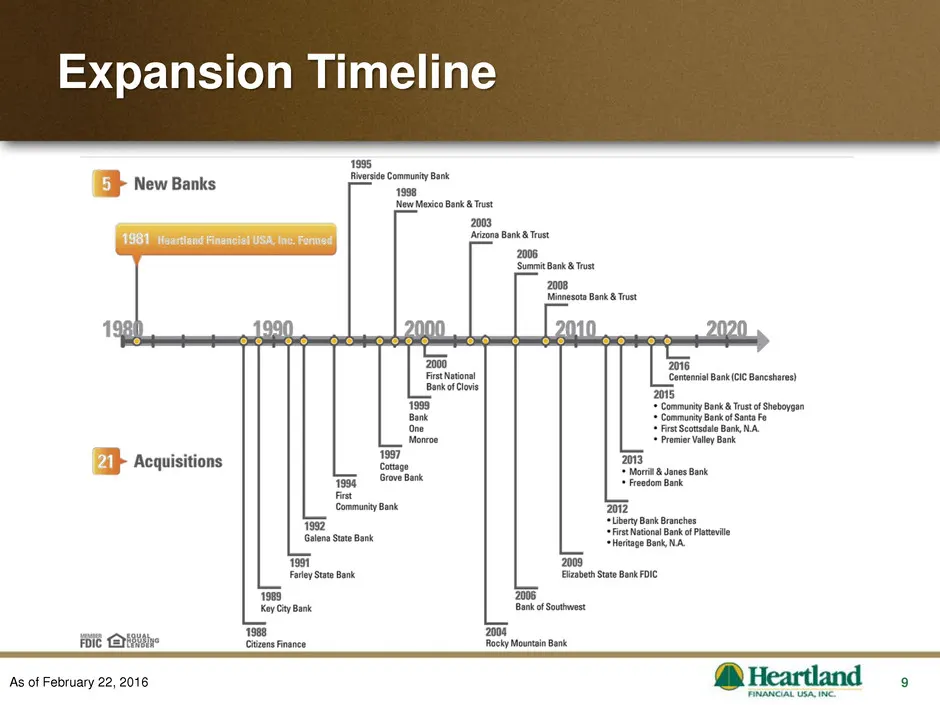
9 Expansion Timeline As of February 22, 2016
Slide 10: Bank acquisitions announced and closed since 2012
10 10 bank acquisitions announced and closed since 2012 1 acquisition closed in 2016 4 acquisitions announced and 3 closed in 2015 1 acquisition announced in 2014 and closed in 2015 2 acquisitions announced and closed in 2013 3 acquisitions announced and closed in 2012 Opportunities ab
Slide 11: Community Bank of Santa Fe
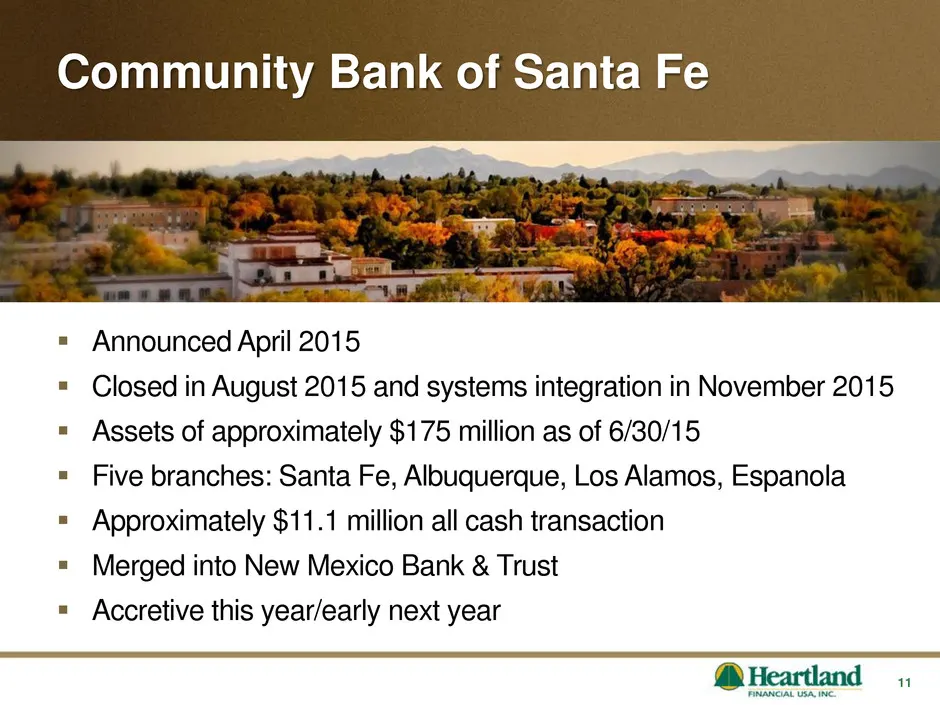
11 Community Bank of Santa Fe Announced April 2015 Closed in August 2015 and systems integration in November 2015 Assets of approximately $175 million as of 6/30/15 Five branches: Santa Fe, Albuquerque, Los Alamos, Espanola Approximately $11.1 million all cash transaction Merged into New
Slide 12: First Scottsdale Bank
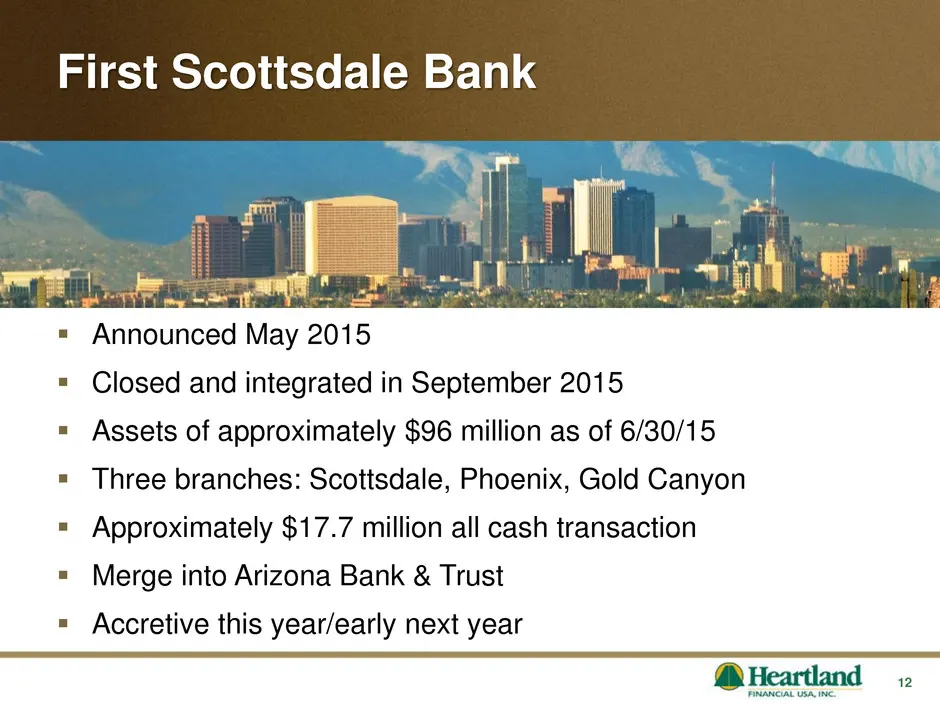
12 First Scottsdale Bank Announced May 2015 Closed and integrated in September 2015 Assets of approximately $96 million as of 6/30/15 Three branches: Scottsdale, Phoenix, Gold Canyon Approximately $17.7 million all cash transaction Merge into Arizona Bank & Trust Accretive this year/ea
Slide 13: Premier Valley Bank
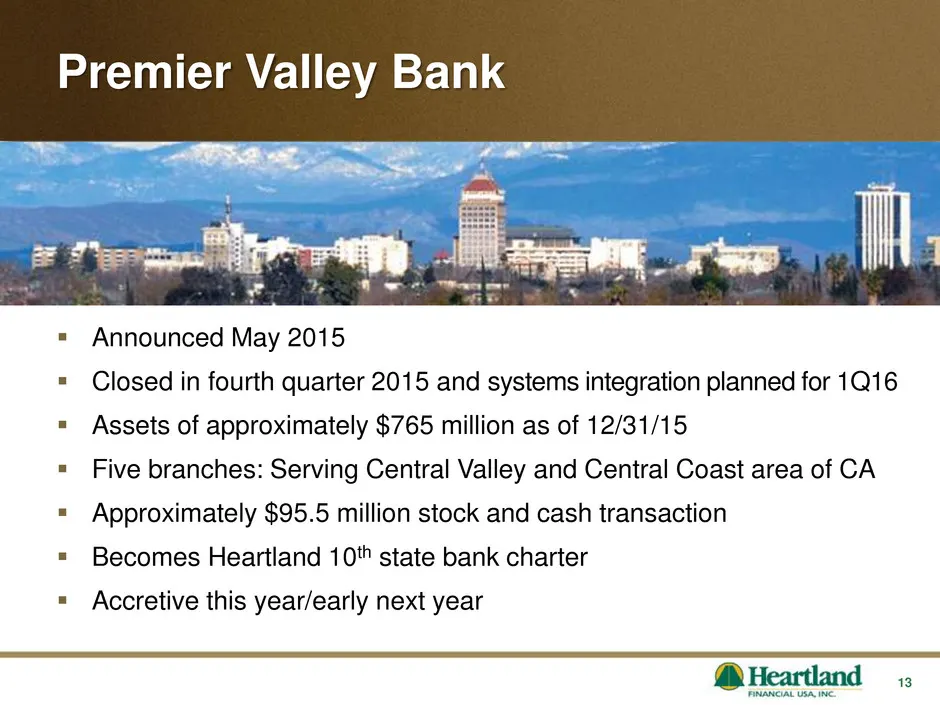
13 Premier Valley Bank Announced May 2015 Closed in fourth quarter 2015 and systems integration planned for 1Q16 Assets of approximately $765 million as of 12/31/15 Five branches: Serving Central Valley and Central Coast area of CA Approximately $95.5 million stock and cash transaction B
Slide 14: Centennial Bank (CIC Bancshares)
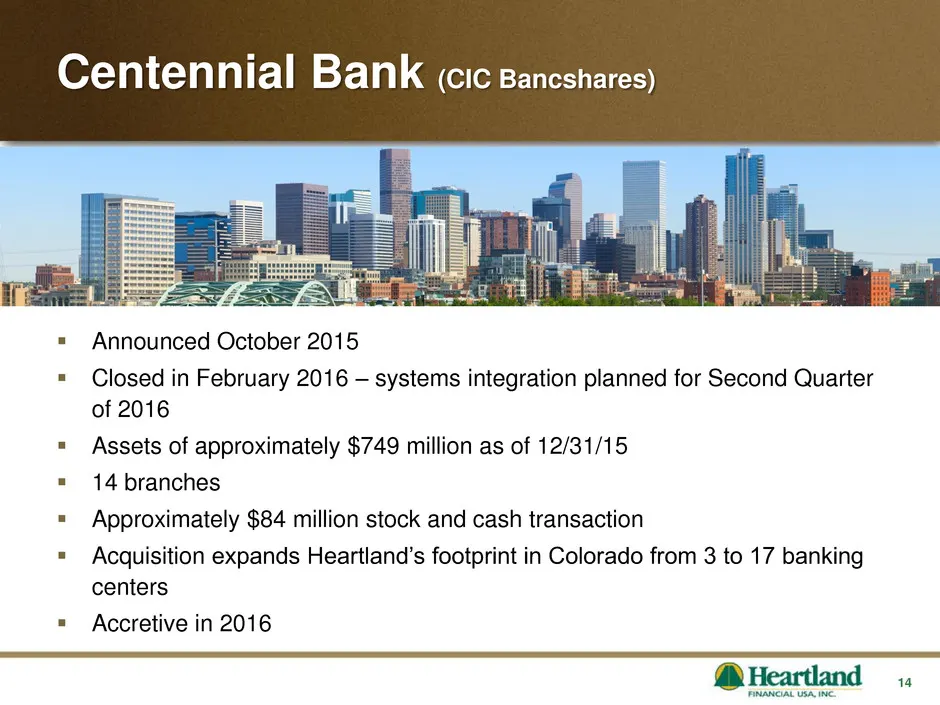
14 Centennial Bank (CIC Bancshares) Announced October 2015 Closed in February 2016 – systems integration planned for Second Quarter of 2016 Assets of approximately $749 million as of 12/31/15 14 branches Approximately $84 million stock and cash transaction Acquisition expands Heartland’s
Slide 15: Market Overview: Expanding in High Growth Markets
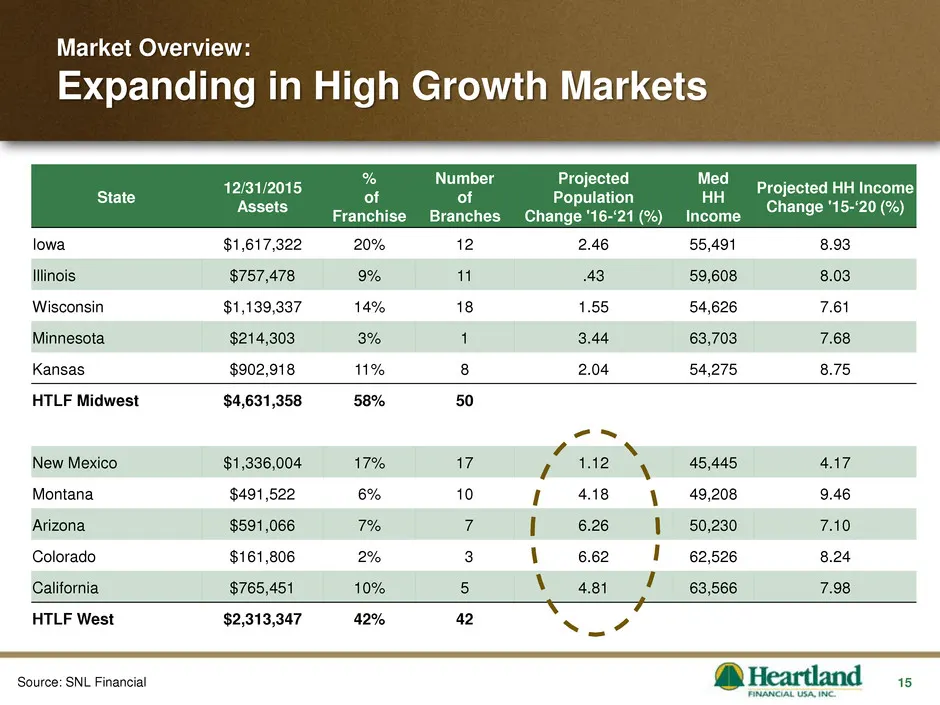
15 Market Overview: Expanding in High Growth Markets State 12/31/2015 Assets % of Franchise Number of Branches Projected Population Change '16-‘21 (%) Med HH Income Projected HH Income Change '15-‘20 (%) Iowa $1,617,322 20% 12 2.46 55,491 8.93 Illinois $757,478 9% 11 .43 59,608 8.03 Wisconsin $1,139
Slide 16: Asset and Earnings Growth
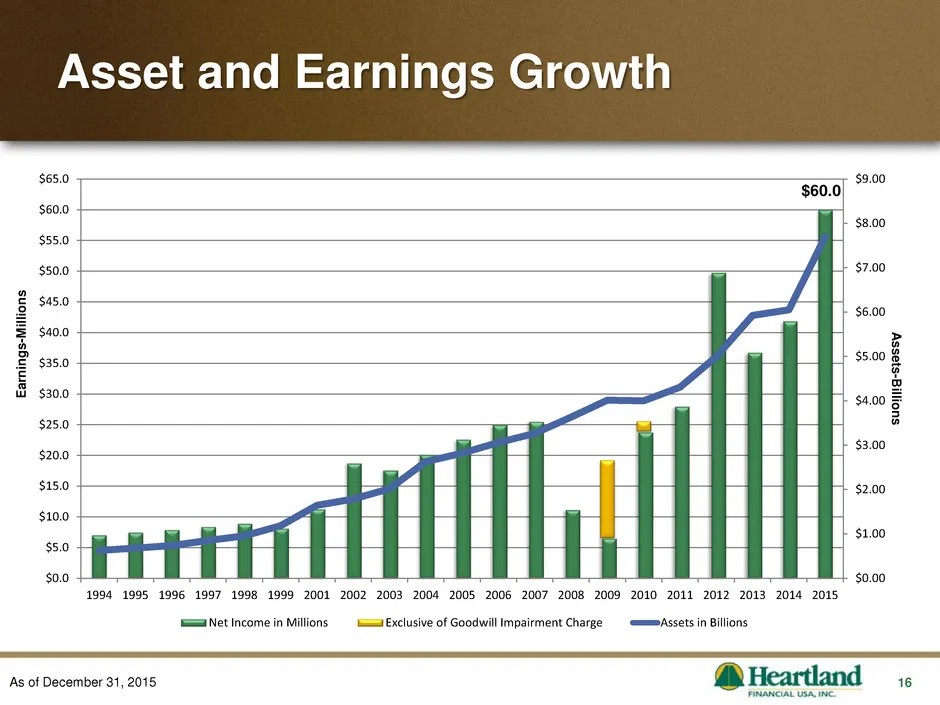
16 $60.0 $0.00 $1.00 $2.00 $3.00 $4.00 $5.00 $6.00 $7.00 $8.00 $9.00 $0.0 $5.0 $10.0 $15.0 $20.0 $25.0 $30.0 $35.0 $40.0 $45.0 $50.0 $55.0 $60.0 $65.0 1994 1995 1996 1997 1998 1999 2001 2002 2003 2004 2005 2006 2007 2008 2009 2010 2011 2012 2013 2014 2015 A s s et s -Billio n s E a rn in g s -M ill
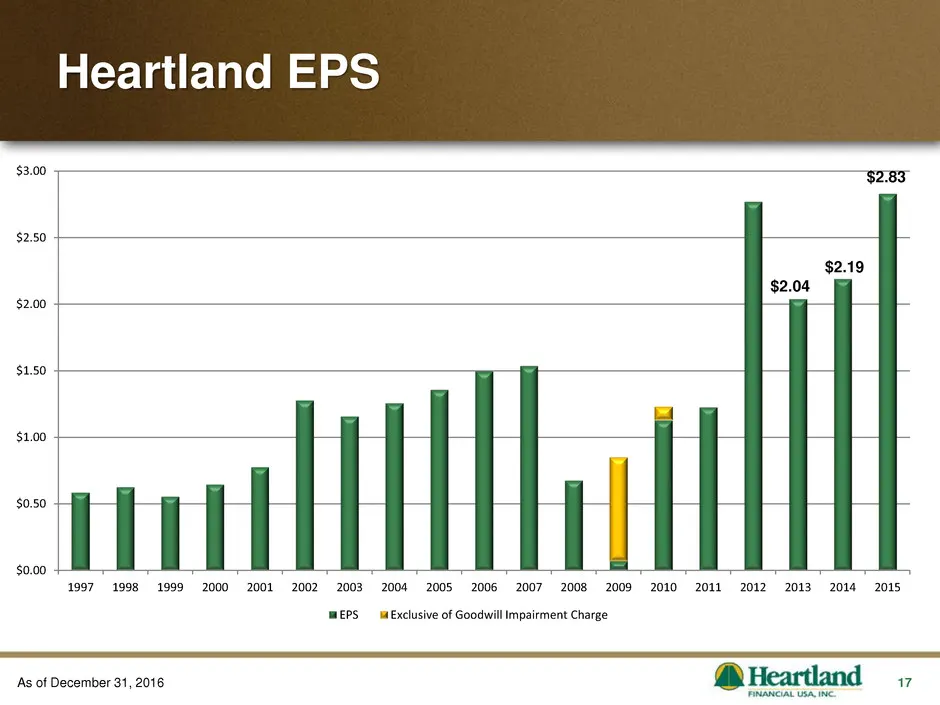
Slide 17: Heartland EPS
17 Heartland EPS As of December 31, 2016 $2.04 $2.19 $2.83 $0.00 $0.50 $1.00 $1.50 $2.00 $2.50 $3.00 1997 1998 1999 2000 2001 2002 2003 2004 2005 2006 2007 2008 2009 2010 2011 2012 2013 2014 2015 EPS Exclusive of Goodwill Impairment Charge
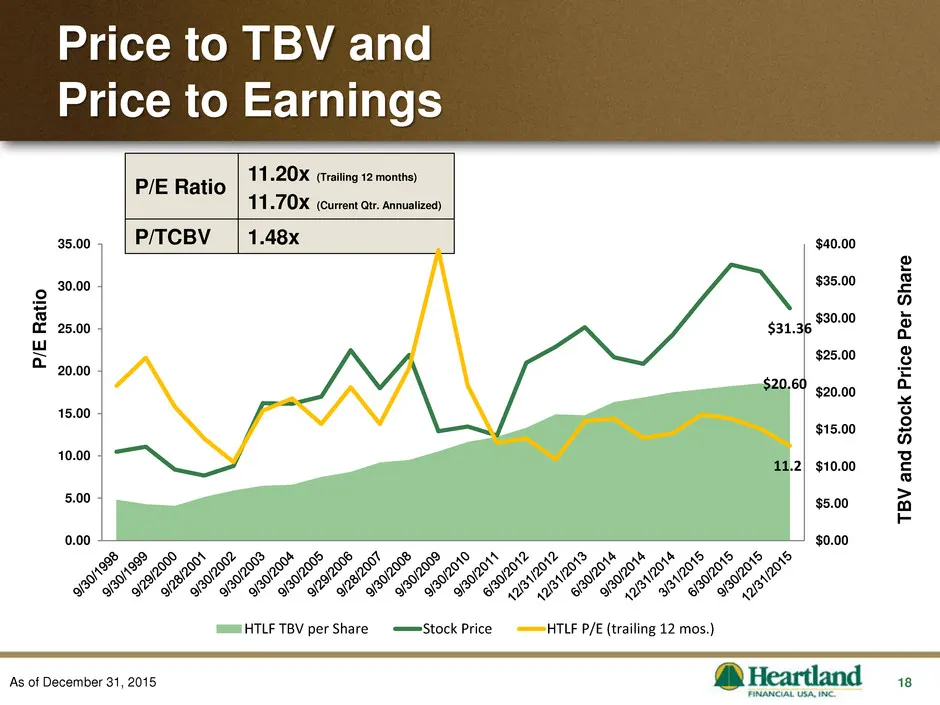
Slide 18: Price to TBV and Price to Earnings
18 Price to TBV and Price to Earnings As of December 31, 2015 T B V a n d St o ck P ri ce Pe r S h a re P/E Ratio 11.20x (Trailing 12 months) 11.70x (Current Qtr. Annualized) P/TCBV 1.48x P /E R at io $20.60 $31.36 11.2 0.00 5.00 10.00 15.00 20.00 25.00 30.00 35.00 $0.00 $5.00 $10.00 $15.00 $20.00 $
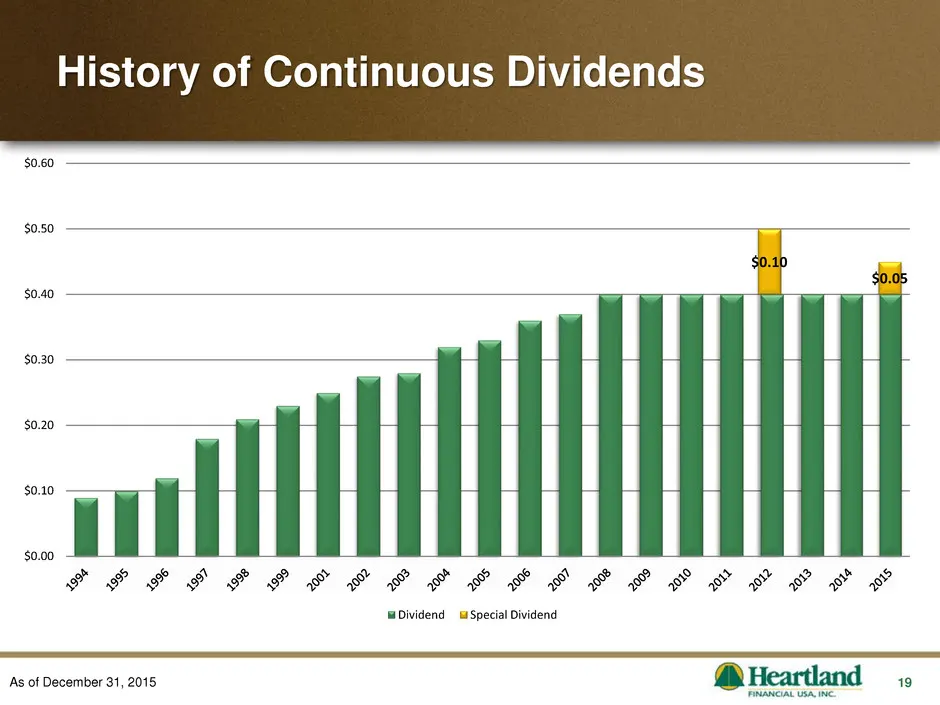
Slide 19: History of Continuous Dividends
19 History of Continuous Dividends As of December 31, 2015 $0.10 $0.05 $0.00 $0.10 $0.20 $0.30 $0.40 $0.50 $0.60 Dividend Special Dividend
Slide 20: Agenda
20 Agenda Heartland’s growth story Key tenets of Heartland’s business model Financial Highlights
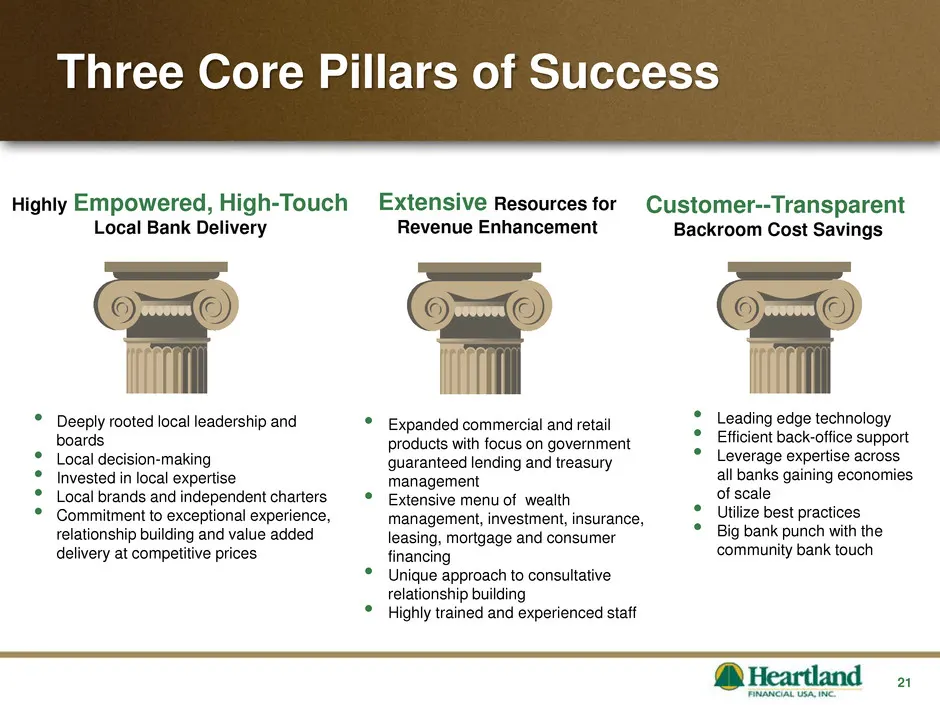
Slide 21: Three Core Pillars: Local Bank Delivery, Revenue Enhancement, Cost Savings
21 Highly Empowered, High-Touch Local Bank Delivery • Deeply rooted local leadership and boards • Local decision-making • Invested in local expertise • Local brands and independent charters • Commitment to exceptional experience, relationship building and value added delivery at competitive prices E
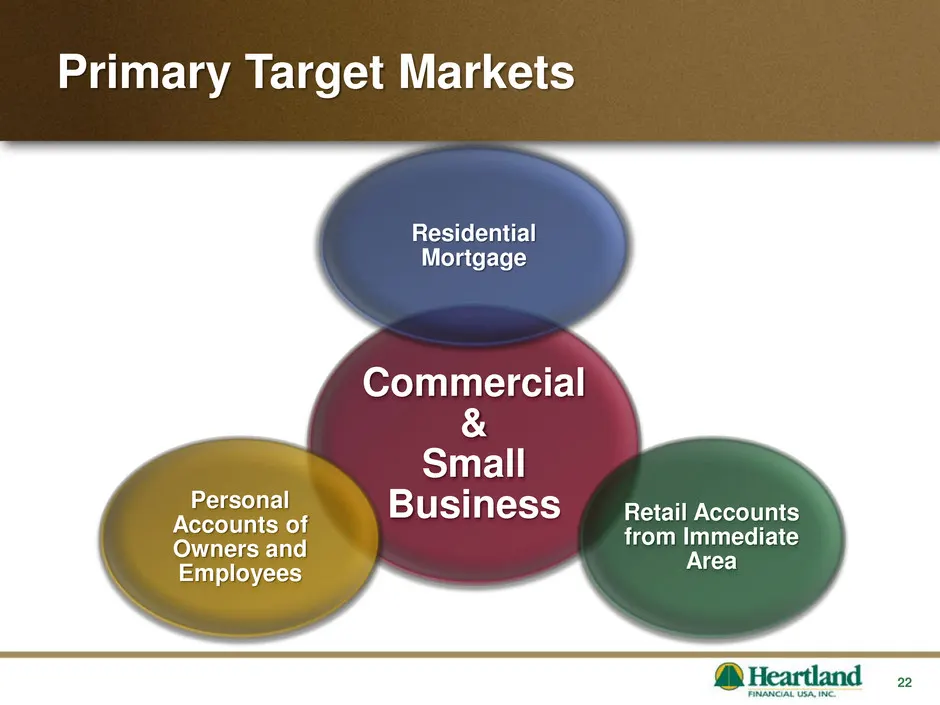
Slide 22: Primary Target Markets
22 Primary Target Markets Commercial & Small Business Residential Mortgage Retail Accounts from Immediate Area Personal Accounts of Owners and Employees
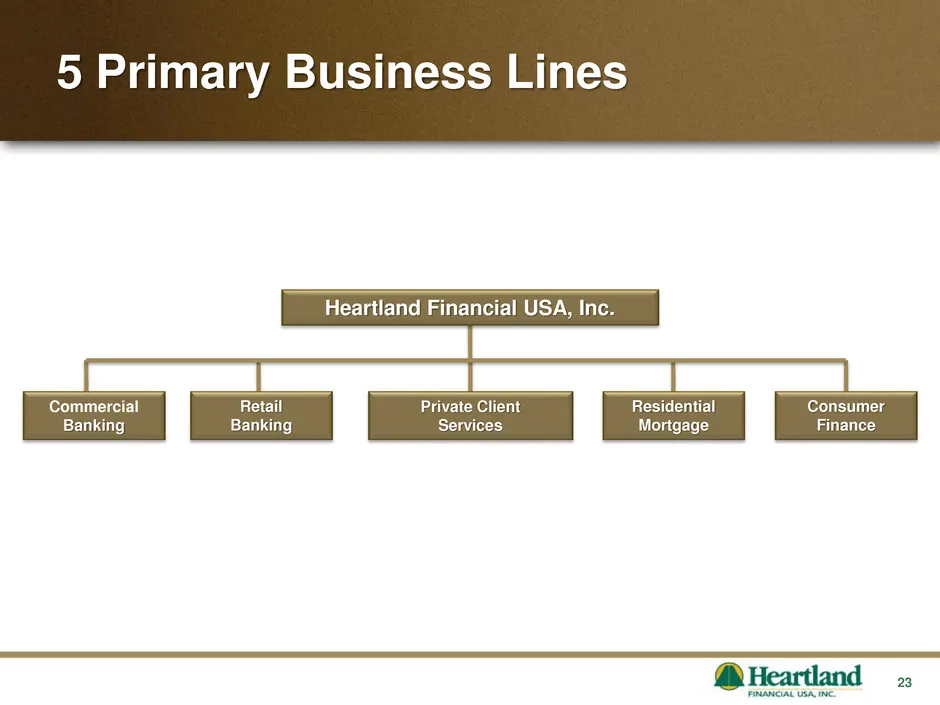
Slide 23: 5 Primary Business Lines
23 Heartland Financial USA, Inc. Commercial Banking Retail Banking Private Client Services Consumer Finance Residential Mortgage 5 Primary Business Lines
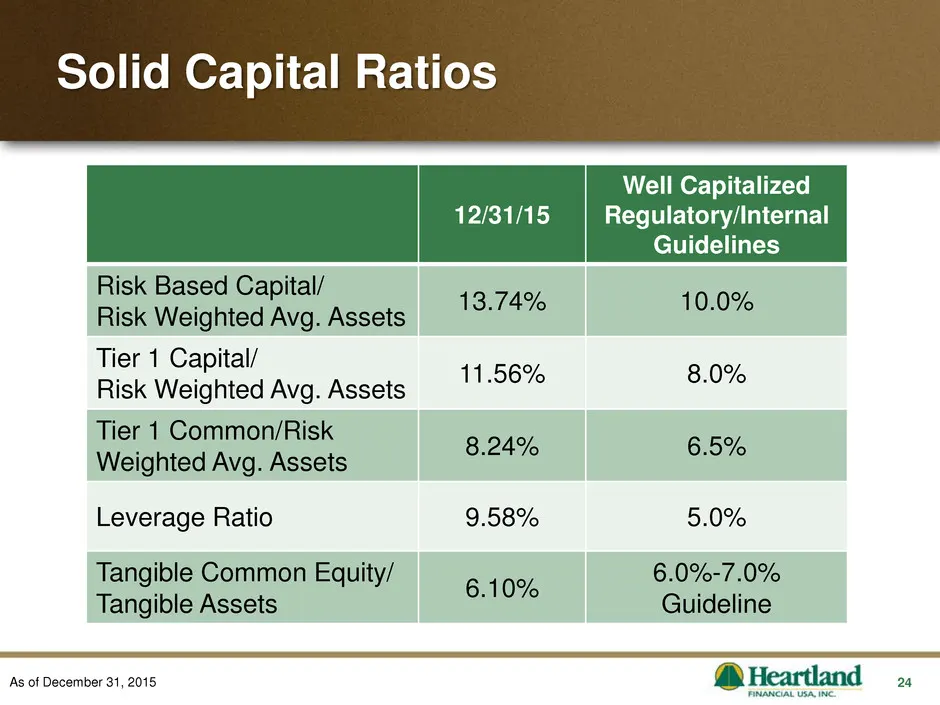
Slide 24: Solid Capital Ratios
24 Solid Capital Ratios 12/31/15 Well Capitalized Regulatory/Internal Guidelines Risk Based Capital/ Risk Weighted Avg. Assets 13.74% 10.0% Tier 1 Capital/ Risk Weighted Avg. Assets 11.56% 8.0% Tier 1 Common/Risk Weighted Avg. Assets 8.24% 6.5% Leverage Ratio 9.58% 5.0% Tangible Common Equity/ Tangi
Slide 25: Low Cost Non-Common Funding
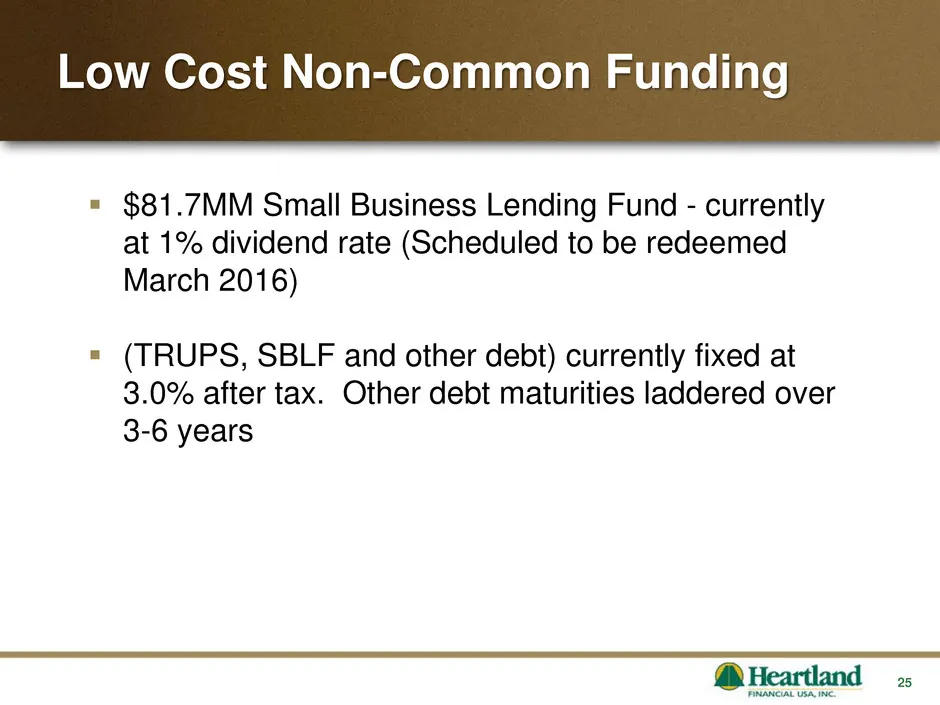
25 $81.7MM Small Business Lending Fund - currently at 1% dividend rate (Scheduled to be redeemed March 2016) (TRUPS, SBLF and other debt) currently fixed at 3.0% after tax. Other debt maturities laddered over 3-6 years Low Cost Non-Common Funding
Slide 26: HTLF core facts summary
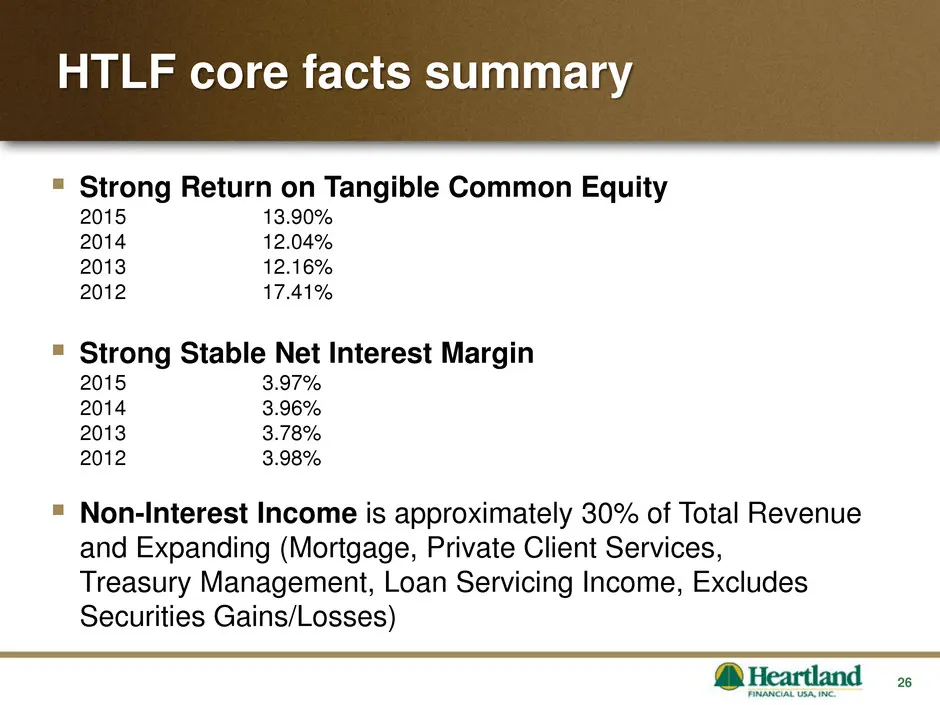
26 Strong Return on Tangible Common Equity 2015 13.90% 2014 12.04% 2013 12.16% 2012 17.41% Strong Stable Net Interest Margin 2015 3.97% 2014 3.96% 2013 3.78% 2012 3.98% Non-Interest Income is approximately 30% of Total Revenue and Expanding (Mortgage, Private Client Services, Treasury Manageme
Slide 27: HTLF core facts summary (cont.)
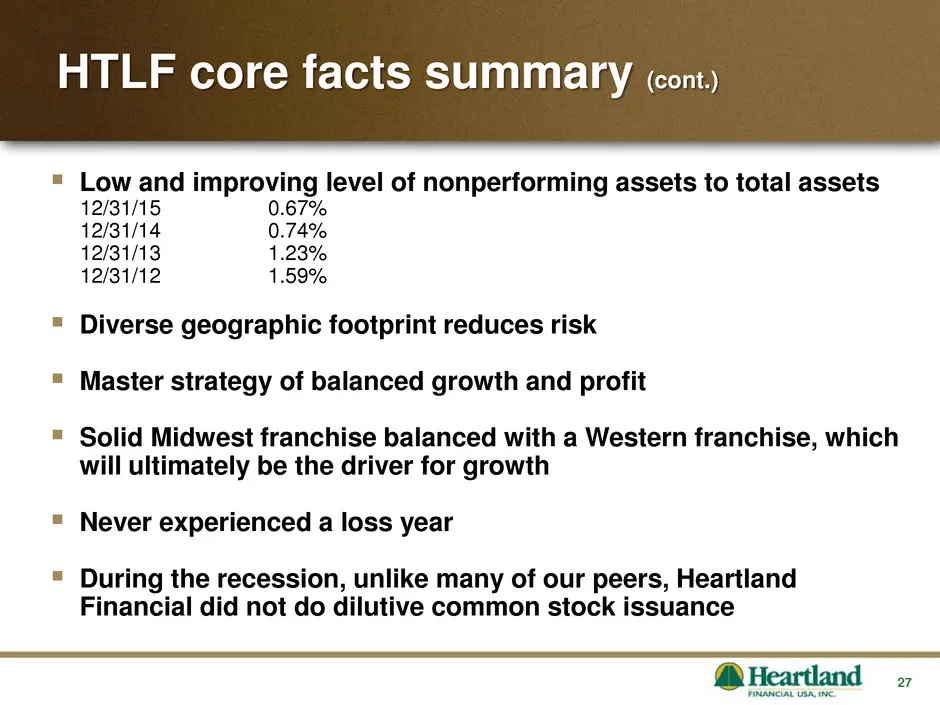
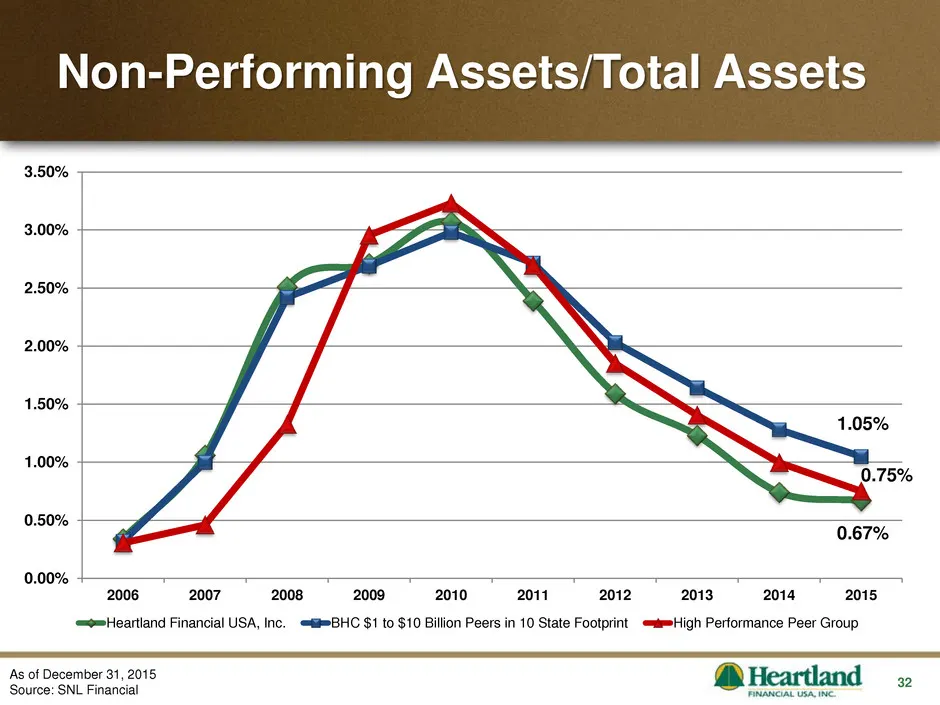
27 Low and improving level of nonperforming assets to total assets 12/31/15 0.67% 12/31/14 0.74% 12/31/13 1.23% 12/31/12 1.59% Diverse geographic footprint reduces risk Master strategy of balanced growth and profit Solid Midwest franchise balanced with a Western franchise, which will ultimat
Slide 28: Agenda
28 Agenda Heartland’s growth story Key tenets of Heartland’s business model Financial Highlights
Slide 29: Financial Performance
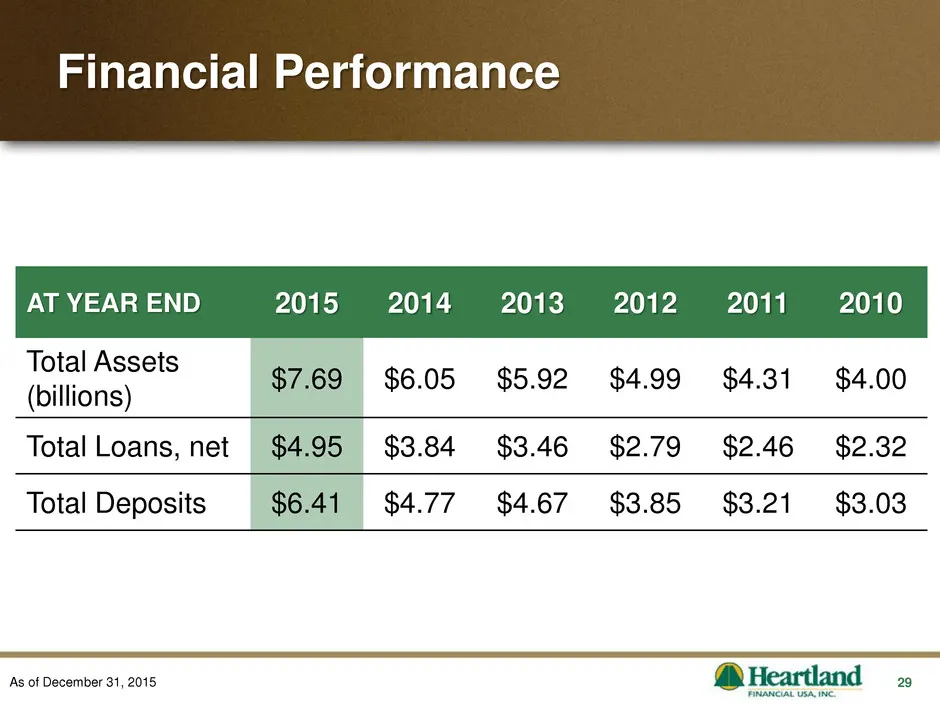
29 Financial Performance As of December 31, 2015 AT YEAR END 2015 2014 2013 2012 2011 2010 Total Assets (billions) $7.69 $6.05 $5.92 $4.99 $4.31 $4.00 Total Loans, net $4.95 $3.84 $3.46 $2.79 $2.46 $2.32 Total Deposits $6.41 $4.77 $4.67 $3.85 $3.21 $3.03
Slide 30: Loans By Category
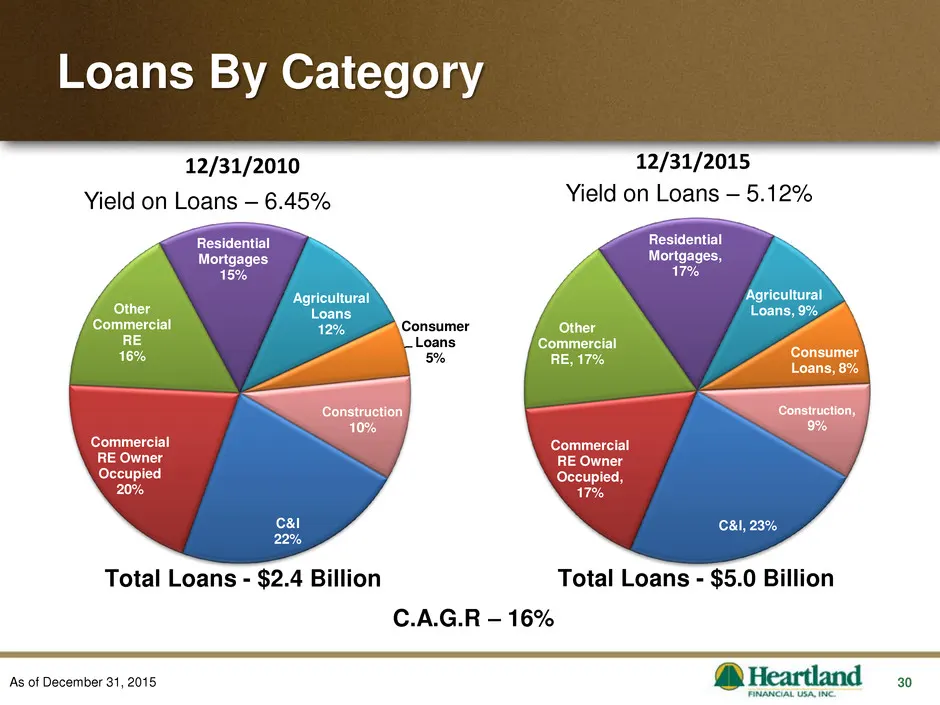
30 Loans By Category As of December 31, 2015 Yield on Loans – 6.45% C.A.G.R – 16% C&I, 23% Commercial RE Owner Occupied, 17% Other Commercial RE, 17% Residential Mortgages, 17% Agricultural Loans, 9% Consumer Loans, 8% Construction, 9% 12/31/2015 Yield on Loans – 5.12% Total Loans - $5.0 Billion C&I
Slide 31: Reducing Risk
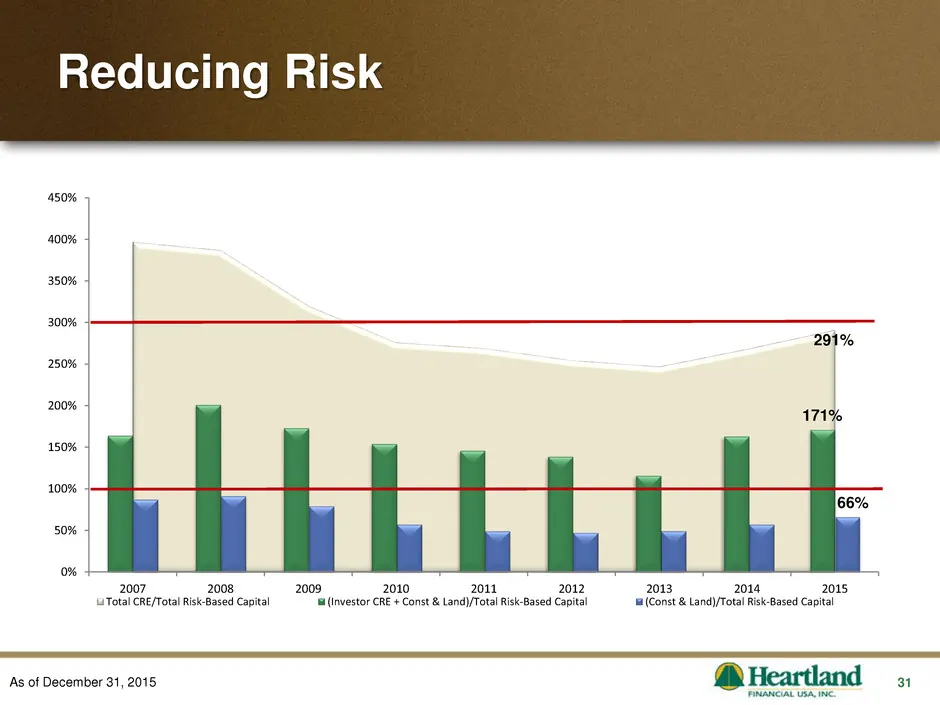
31 Reducing Risk As of December 31, 2015 291% 171% 66% 0% 50% 100% 150% 200% 250% 300% 350% 400% 450% 2007 2008 2009 2010 2011 2012 2013 2014 2015 Total CRE/Total Risk-Based Capital (Investor CRE + Const & Land)/Total Risk-Based Capital (Const & Land)/Total Risk-Based Capital
Slide 32: Non-Performing Assets/Total Assets
32 Non-Performing Assets/Total Assets As of December 31, 2015 Source: SNL Financial 0.67% 1.05% 0.75% 0.00% 0.50% 1.00% 1.50% 2.00% 2.50% 3.00% 3.50% 2006 2007 2008 2009 2010 2011 2012 2013 2014 2015 Heartland Financial USA, Inc. BHC $1 to $10 Billion Peers in 10 State Footprint High Performance Pee
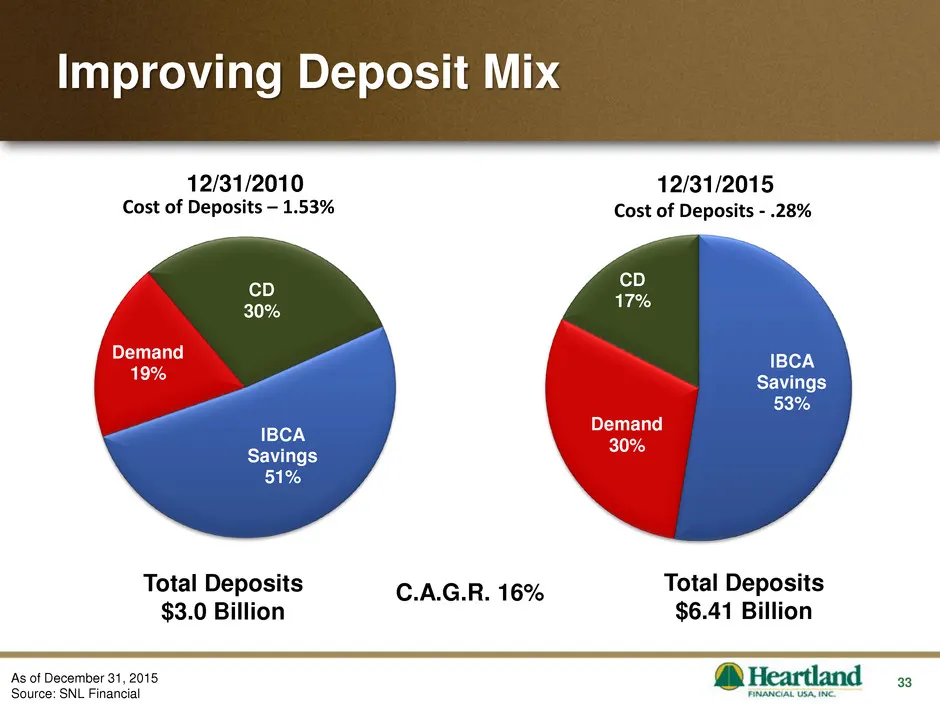
Slide 33: Improving Deposit Mix
33 As of December 31, 2015 Source: SNL Financial Improving Deposit Mix Total Deposits $3.0 Billion Total Deposits $6.41 Billion C.A.G.R. 16% Cost of Deposits – 1.53% 12/31/2015 Cost of Deposits - .28% IBCA Savings 51% Demand 19% CD 30% 12/31/2010 IBCA Savings 53% Demand 30% CD 17%
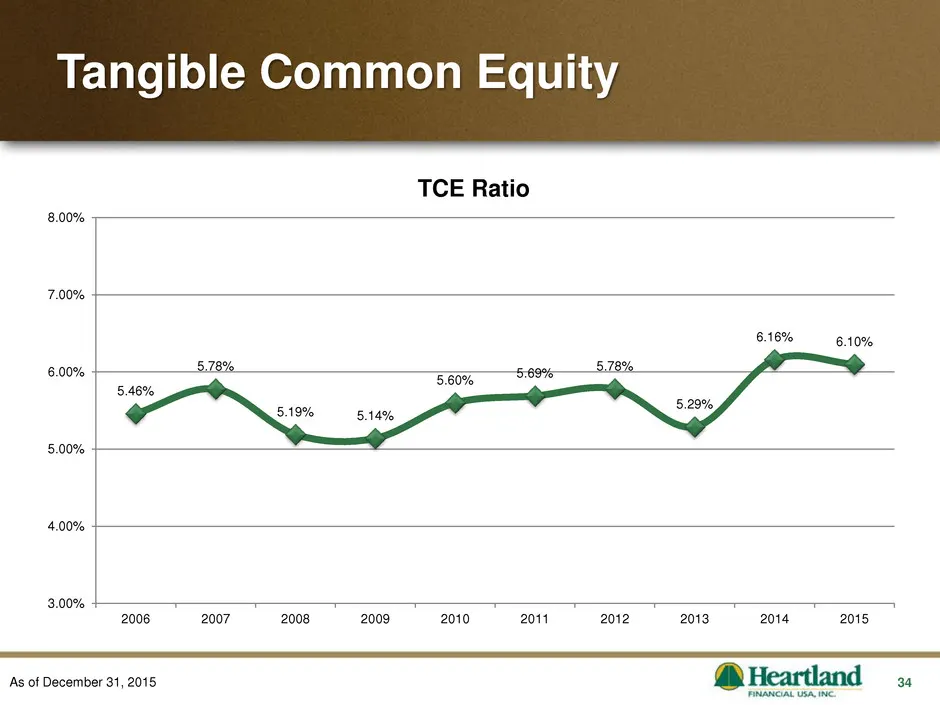
Slide 34: Tangible Common Equity Ratio
34 5.46% 5.78% 5.19% 5.14% 5.60% 5.69% 5.78% 5.29% 6.16% 6.10% 3.00% 4.00% 5.00% 6.00% 7.00% 8.00% 2006 2007 2008 2009 2010 2011 2012 2013 2014 2015 TCE Ratio Tangible Common Equity As of December 31, 2015
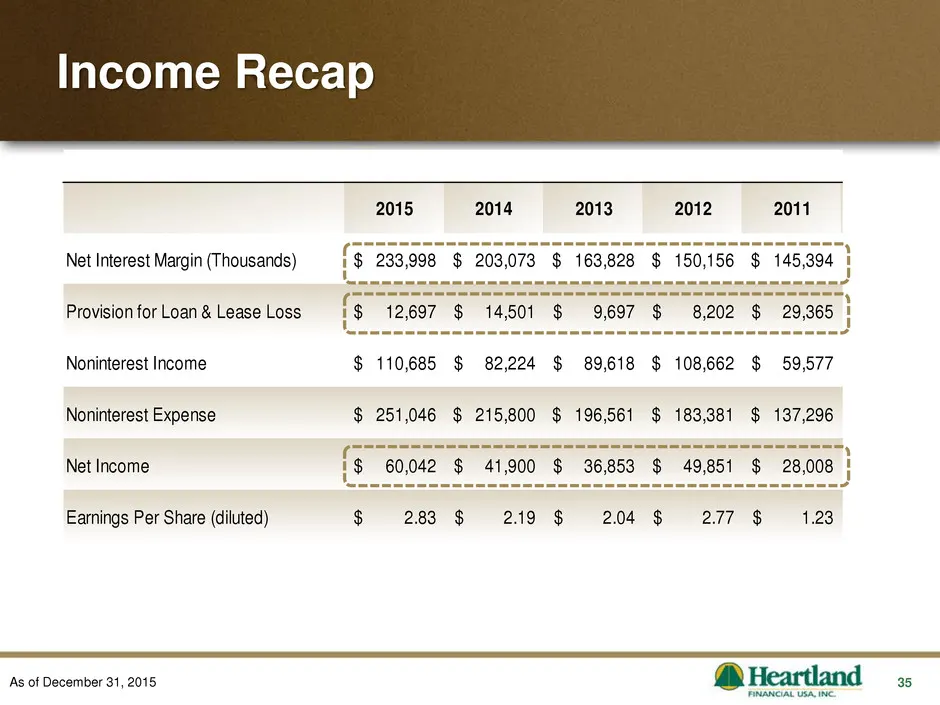
Slide 35: Income Recap
35 As of December 31, 2015 Income Recap 2015 2014 2013 2012 2011 Net Interest Margin (Thousands) 233,998$ 203,073$ 163,828$ 150,156$ 145,394$ Provision for Loan & Lease Loss 12,697$ 14,501$ 9,697$ 8,202$ 29,365$ Noninterest Income 110,685$ 82,224$ 89,618$ 108,662$ 59,577$ Noninterest Expense 251,046
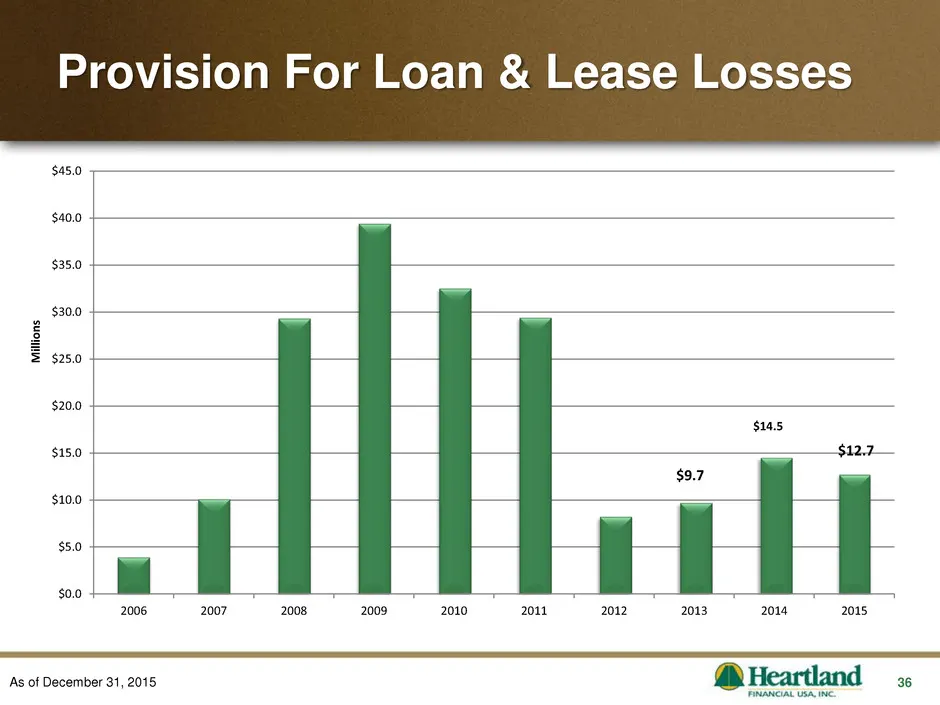
Slide 36: Provision For Loan & Lease Losses
36 Provision For Loan & Lease Losses As of December 31, 2015 $9.7 $14.5 $12.7 $0.0 $5.0 $10.0 $15.0 $20.0 $25.0 $30.0 $35.0 $40.0 $45.0 2006 2007 2008 2009 2010 2011 2012 2013 2014 2015 M ill io n s
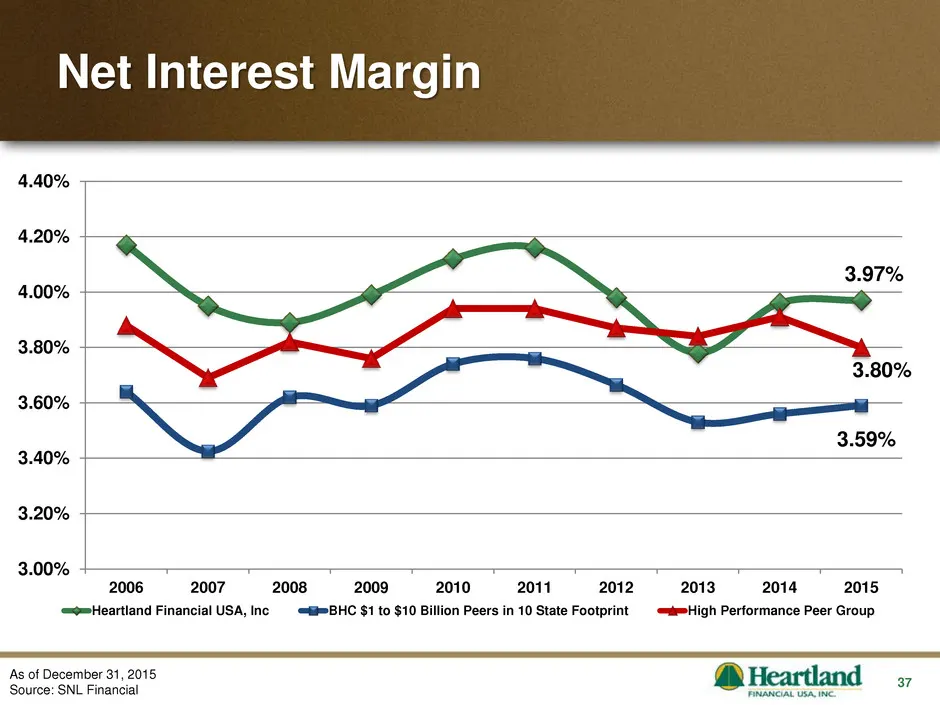
Slide 37: Net Interest Margin
37 Net Interest Margin As of December 31, 2015 Source: SNL Financial 3.97% 3.59% 3.80% 3.00% 3.20% 3.40% 3.60% 3.80% 4.00% 4.20% 4.40% 2006 2007 2008 2009 2010 2011 2012 2013 2014 2015 Heartland Financial USA, Inc BHC $1 to $10 Billion Peers in 10 State Footprint High Performance Peer Group
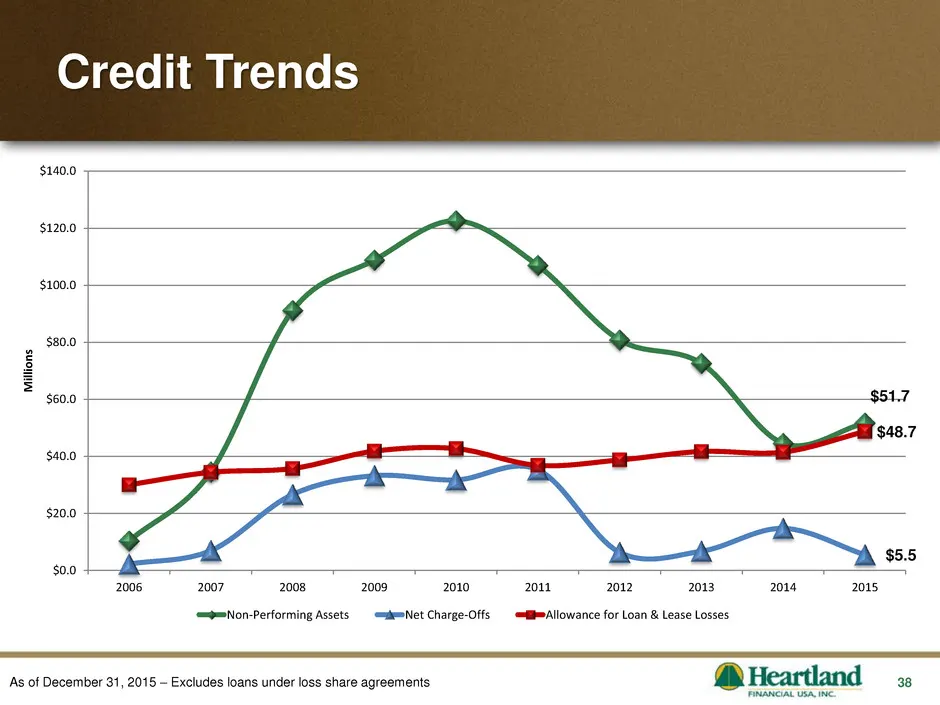
Slide 38: Credit Trends
38 Credit Trends As of December 31, 2015 – Excludes loans under loss share agreements $51.7 $5.5 $48.7 $0.0 $20.0 $40.0 $60.0 $80.0 $100.0 $120.0 $140.0 2006 2007 2008 2009 2010 2011 2012 2013 2014 2015 M ill io n s Non-Performing Assets Net Charge-Offs Allowance for Loan & Lease Losses
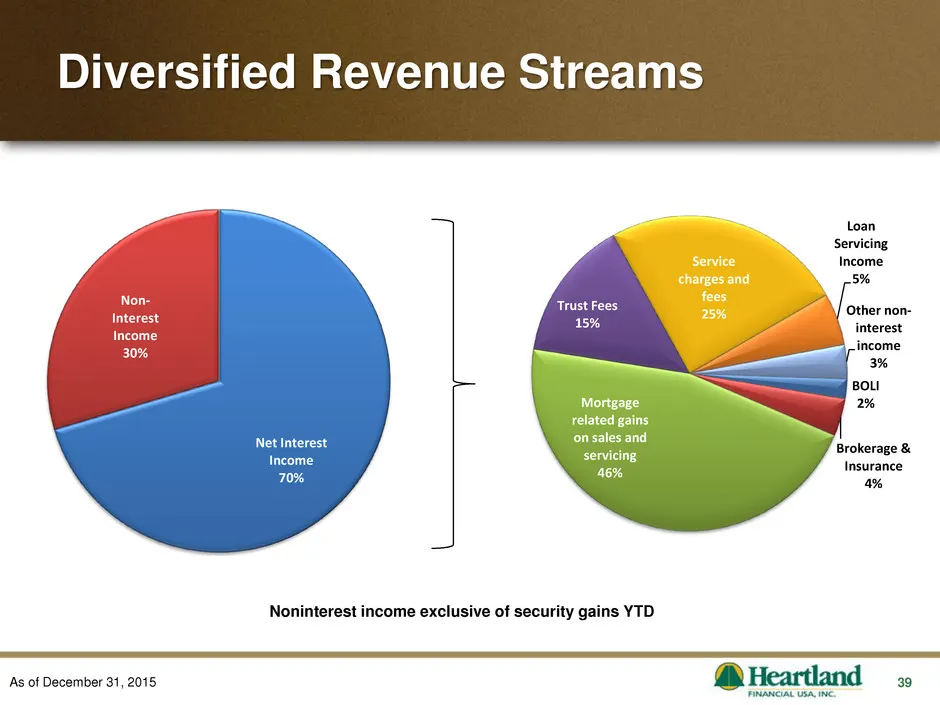
Slide 39: Diversified Revenue Streams
39 Diversified Revenue Streams As of December 31, 2015 Noninterest income exclusive of security gains YTD Net Interest Income 70% Non- Interest Income 30% BOLI 2% Brokerage & Insurance 4% Mortgage related gains on sales and servicing 46% Trust Fees 15% Service charges and fees 25% Loan Servicing Inc
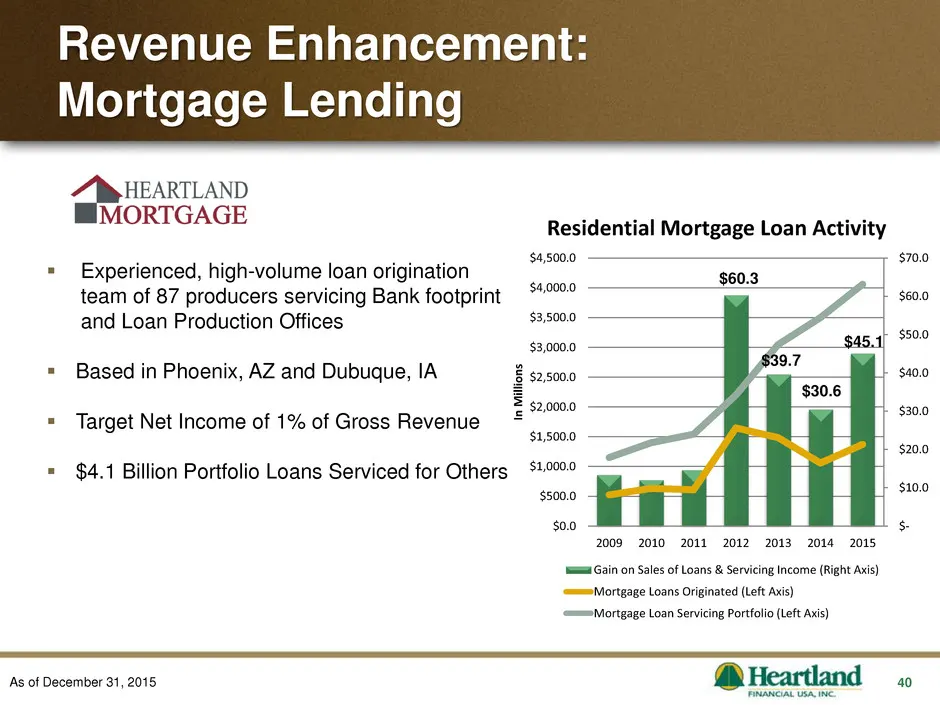
Slide 40: Revenue Enhancement: Mortgage Lending
40 Revenue Enhancement: Mortgage Lending As of December 31, 2015 Experienced, high-volume loan origination team of 87 producers servicing Bank footprint and Loan Production Offices Based in Phoenix, AZ and Dubuque, IA Target Net Income of 1% of Gross Revenue $4.1 Billion Portfolio Loans Serv
Slide 41: Revenue Enhancement: Private Client Services
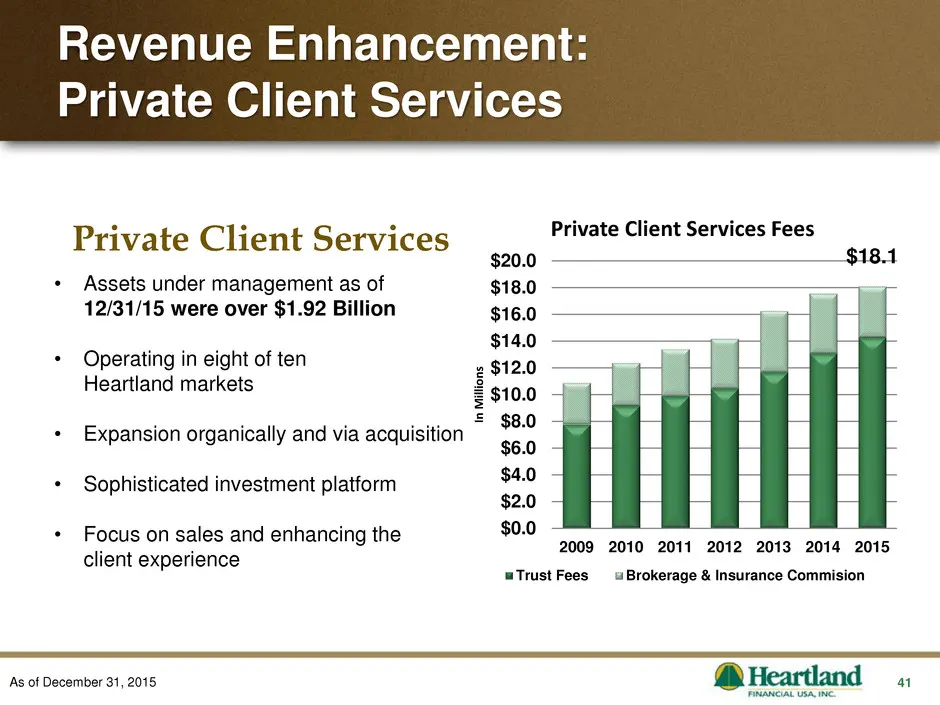
41 • Assets under management as of 12/31/15 were over $1.92 Billion • Operating in eight of ten Heartland markets • Expansion organically and via acquisition • Sophisticated investment platform • Focus on sales and enhancing the client experience Private Client Services Revenue Enhancement: Private
Slide 42: Revenue Enhancement: Treasury Management
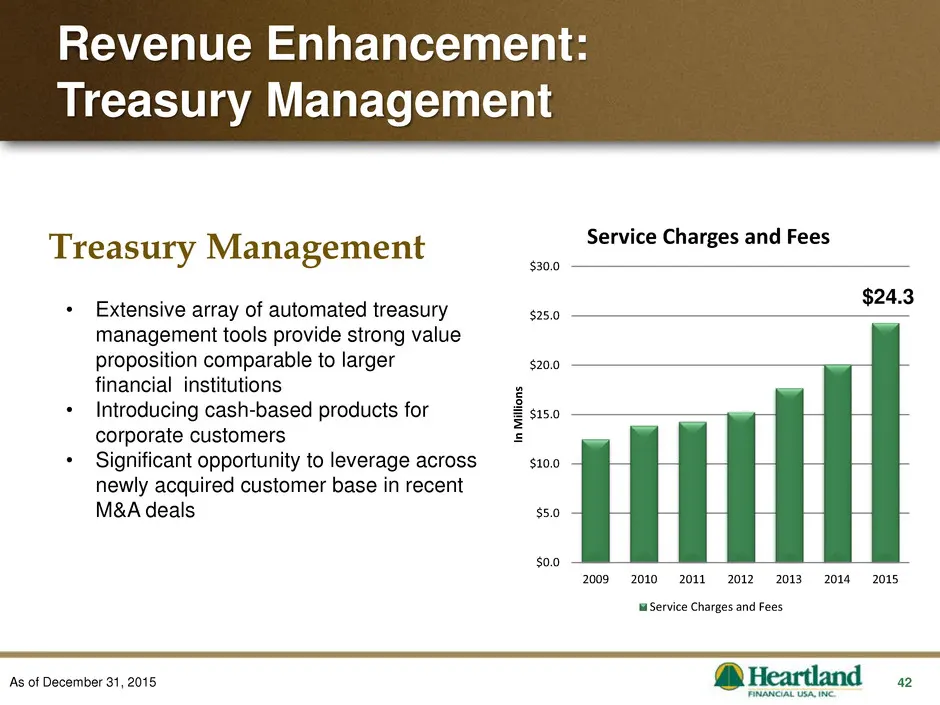
42 Treasury Management • Extensive array of automated treasury management tools provide strong value proposition comparable to larger financial institutions • Introducing cash-based products for corporate customers • Significant opportunity to leverage across newly acquired customer base in recent M
Slide 43: Net Income
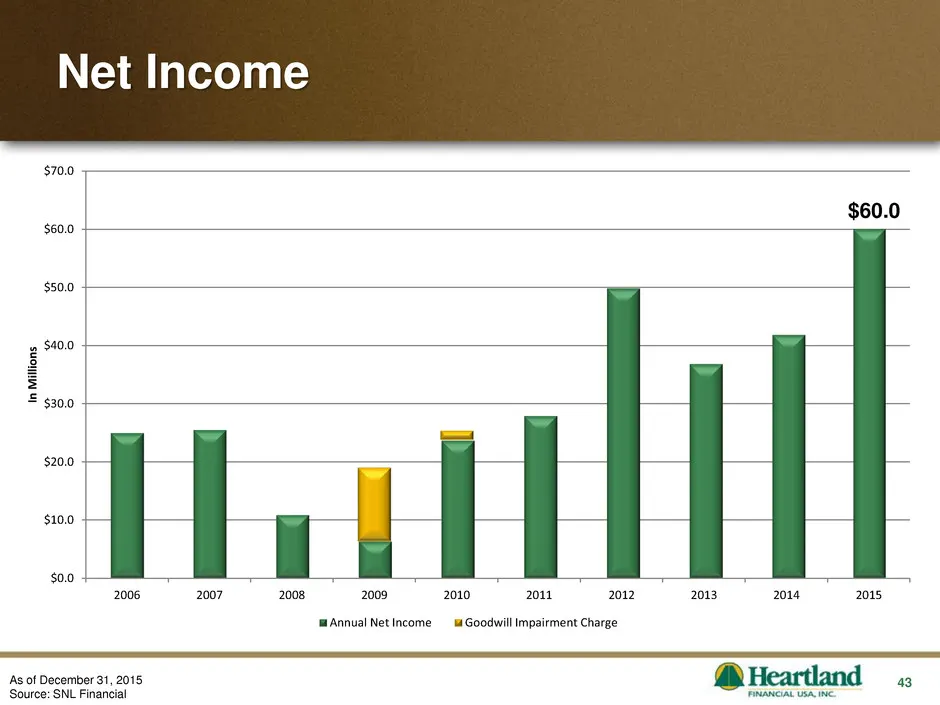
43 Net Income As of December 31, 2015 Source: SNL Financial $60.0 $0.0 $10.0 $20.0 $30.0 $40.0 $50.0 $60.0 $70.0 2006 2007 2008 2009 2010 2011 2012 2013 2014 2015 In M ill io n s Annual Net Income Goodwill Impairment Charge
Slide 44: Efficiency Ratio
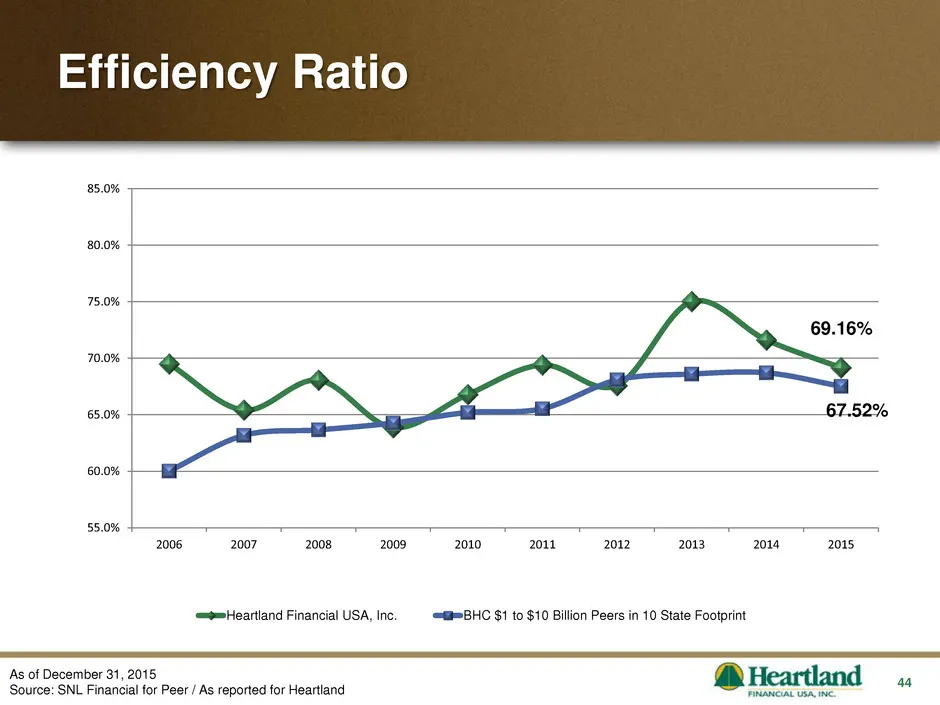
44 69.16% 67.52% 55.0% 60.0% 65.0% 70.0% 75.0% 80.0% 85.0% 2006 2007 2008 2009 2010 2011 2012 2013 2014 2015 Heartland Financial USA, Inc. BHC $1 to $10 Billion Peers in 10 State Footprint Efficiency Ratio As of December 31, 2015 Source: SNL Financial for Peer / As reported for Heartland
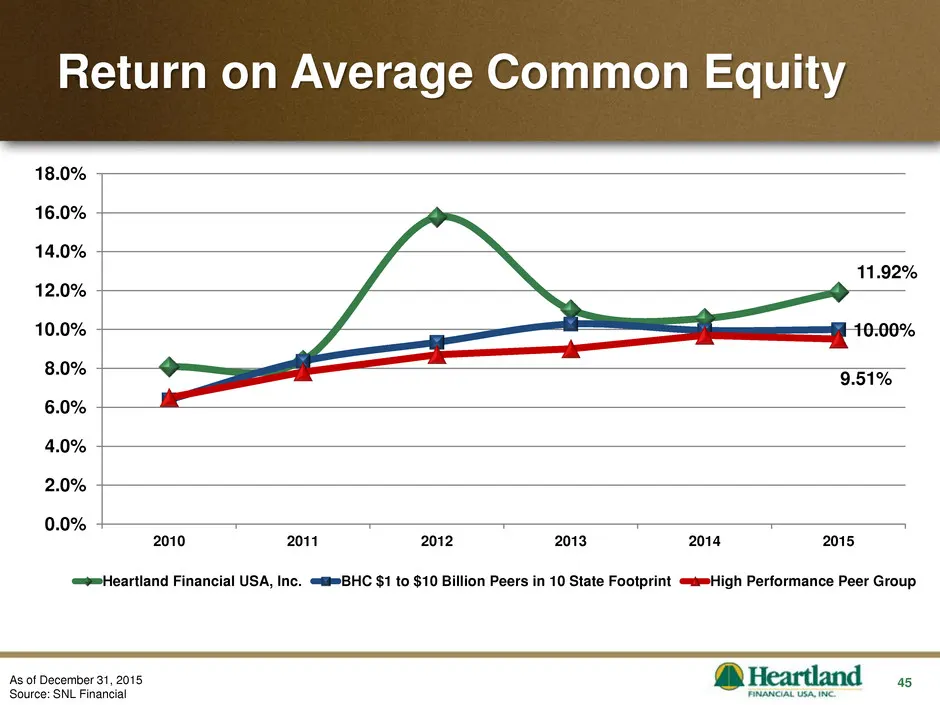
Slide 45: Return on Average Common Equity
45 Return on Average Common Equity As of December 31, 2015 Source: SNL Financial 11.92% 10.00% 9.51% 0.0% 2.0% 4.0% 6.0% 8.0% 10.0% 12.0% 14.0% 16.0% 18.0% 2010 2011 2012 2013 2014 2015 Heartland Financial USA, Inc. BHC $1 to $10 Billion Peers in 10 State Footprint High Performance Peer Group
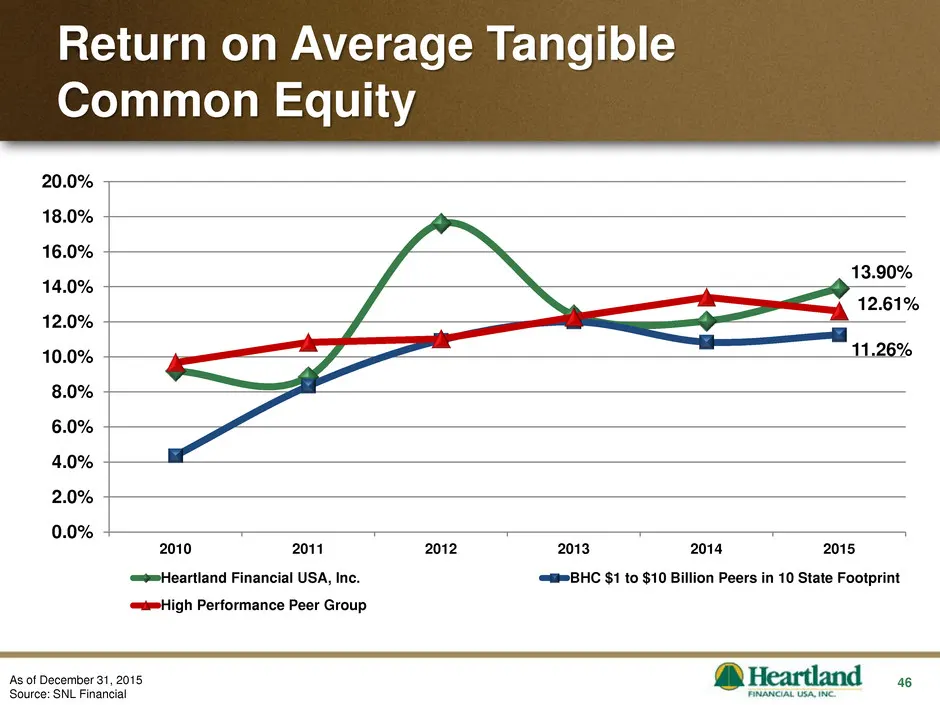
Slide 46: Return on Average Tangible Common Equity
46 Return on Average Tangible Common Equity As of December 31, 2015 Source: SNL Financial 13.90% 11.26% 12.61% 0.0% 2.0% 4.0% 6.0% 8.0% 10.0% 12.0% 14.0% 16.0% 18.0% 20.0% 2010 2011 2012 2013 2014 2015 Heartland Financial USA, Inc. BHC $1 to $10 Billion Peers in 10 State Footprint High Performance P
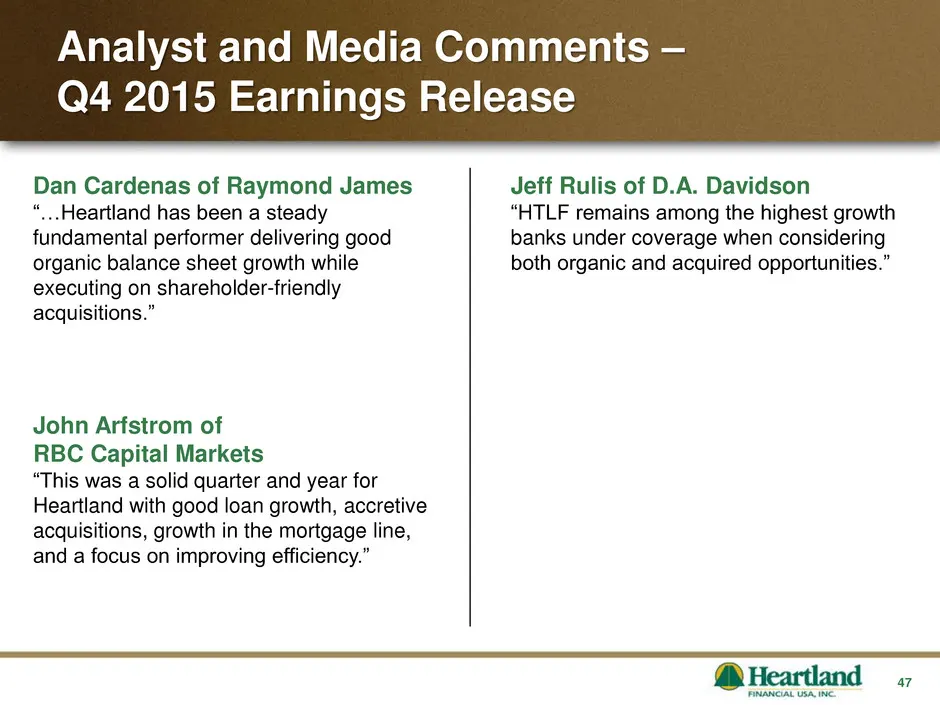
Slide 47: Analyst and Media Comments – Q4 2015 Earnings Release
47 Analyst and Media Comments – Q4 2015 Earnings Release Dan Cardenas of Raymond James “…Heartland has been a steady fundamental performer delivering good organic balance sheet growth while executing on shareholder-friendly acquisitions.” John Arfstrom of RBC Capital Markets “This was a solid quarte
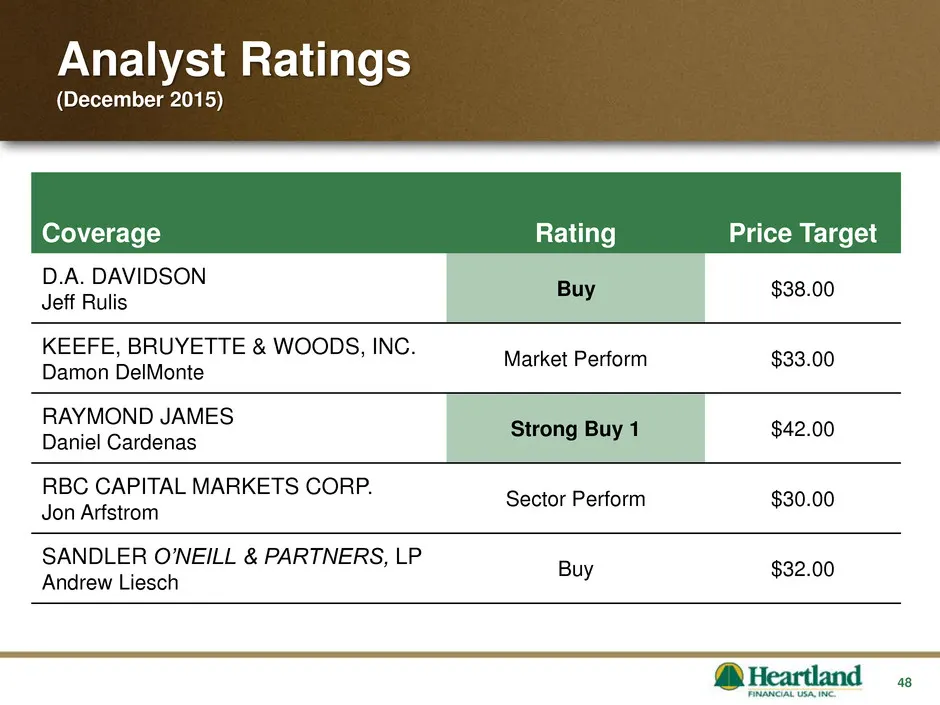
Slide 48: Analyst Ratings (December 2015)
48 Analyst Ratings (December 2015) Coverage Rating Price Target D.A. DAVIDSON Jeff Rulis Buy $38.00 KEEFE, BRUYETTE & WOODS, INC. Damon DelMonte Market Perform $33.00 RAYMOND JAMES Daniel Cardenas Strong Buy 1 $42.00 RBC CAPITAL MARKETS CORP. Jon Arfstrom Sector Perform $30.00 SANDLER O’NEILL & PART
Slide 49: Investment Summary
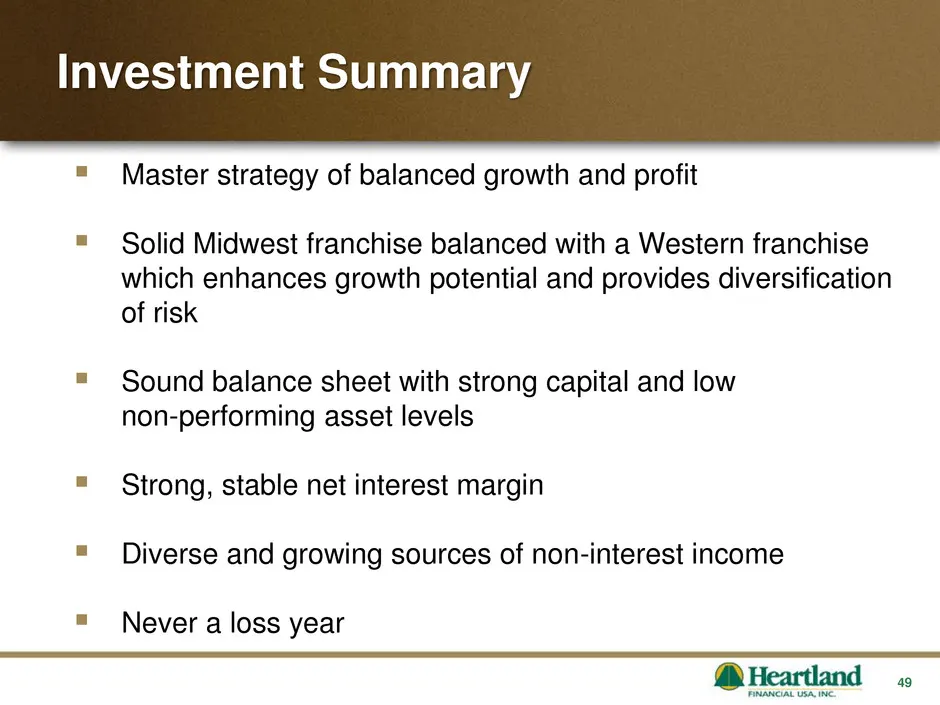
49 Master strategy of balanced growth and profit Solid Midwest franchise balanced with a Western franchise which enhances growth potential and provides diversification of risk Sound balance sheet with strong capital and low non-performing asset levels Strong, stable net interest margin Div
Slide 50: Contact Information
Contact Information LYNN. FULLER BRYAN R. McKEAG Some DAecuTWE Vice PRESENT MHeartland So os ‘CHIE FINANCIAL OFICER ia 39-2105, PHONE: (563) 589-1994 Peace Glin cor Tock 702100 AX S69) SO 1931 foe da vce Poche Br he 1398 CENTRALAVENUE DUBUQUE IOWA 52001, 1398 CENTRALAVENUE PO.BOX78 _DUBUQUE.1A 52004
Slide 51: Mission Statement
Mission Statement: Through excellence In customer service and Respect for the individual, EVERYONE PROFITS Trading Symbol: HTLF www.htlf.com
Source: SEC EDGAR · 8-K filed Apr 8, 2016
More decks from Heartland Financial USA Inc
 Merger or Acquisition (July 2024)6 slides · Jul 31, 2024
 Merger or Acquisition (May 2024)6 slides · May 2, 2024
 Merger or Acquisition (May 2024)27 slides · May 2, 2024
 Q4 2023 Earnings Presentation54 slides · Feb 13, 2024
 Q4 2023 Earnings Presentation35 slides · Jan 29, 2024
 Q3 2023 Earnings Presentation55 slides · Nov 15, 2023