Heartland Financial USA — Q4 2023 Earnings Presentation
35 slides from Heartland Financial USA's earnings presentation, Jan 29, 2024
Slide 1: 4th Quarter 2023 Financial Data
4th Quarter 2023 Financial Data
Slide 2: Safe Harbor
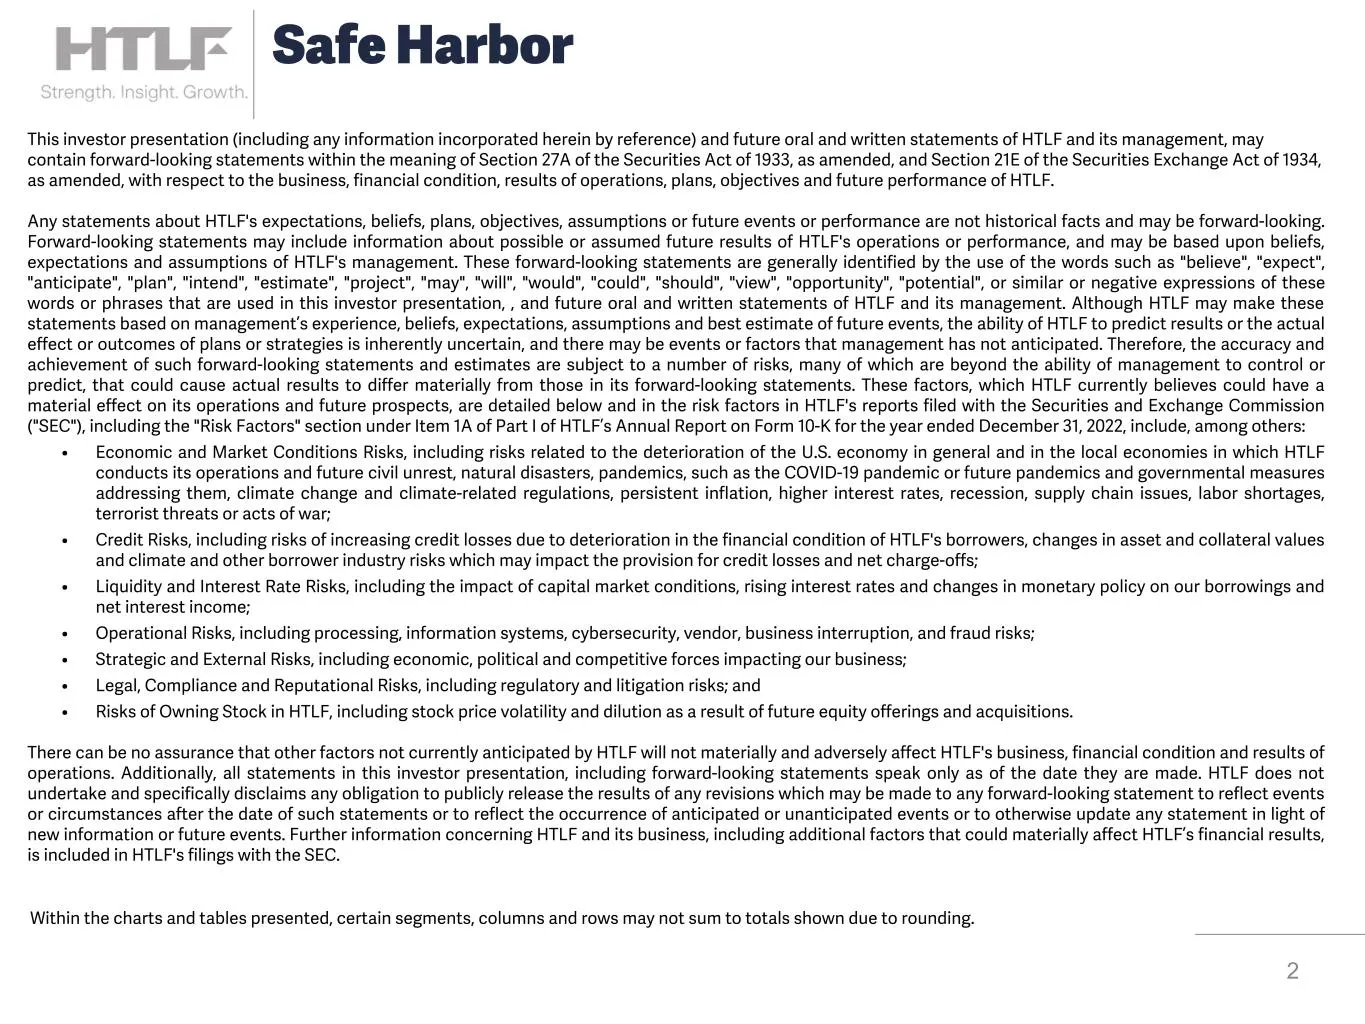
2 Safe Harbor Within the charts and tables presented, certain segments, columns and rows may not sum to totals shown due to rounding. This investor presentation (including any information incorporated herein by reference) and future oral and written statements of HTLF and its management, may contain
Slide 3: HTLF Vision Statement
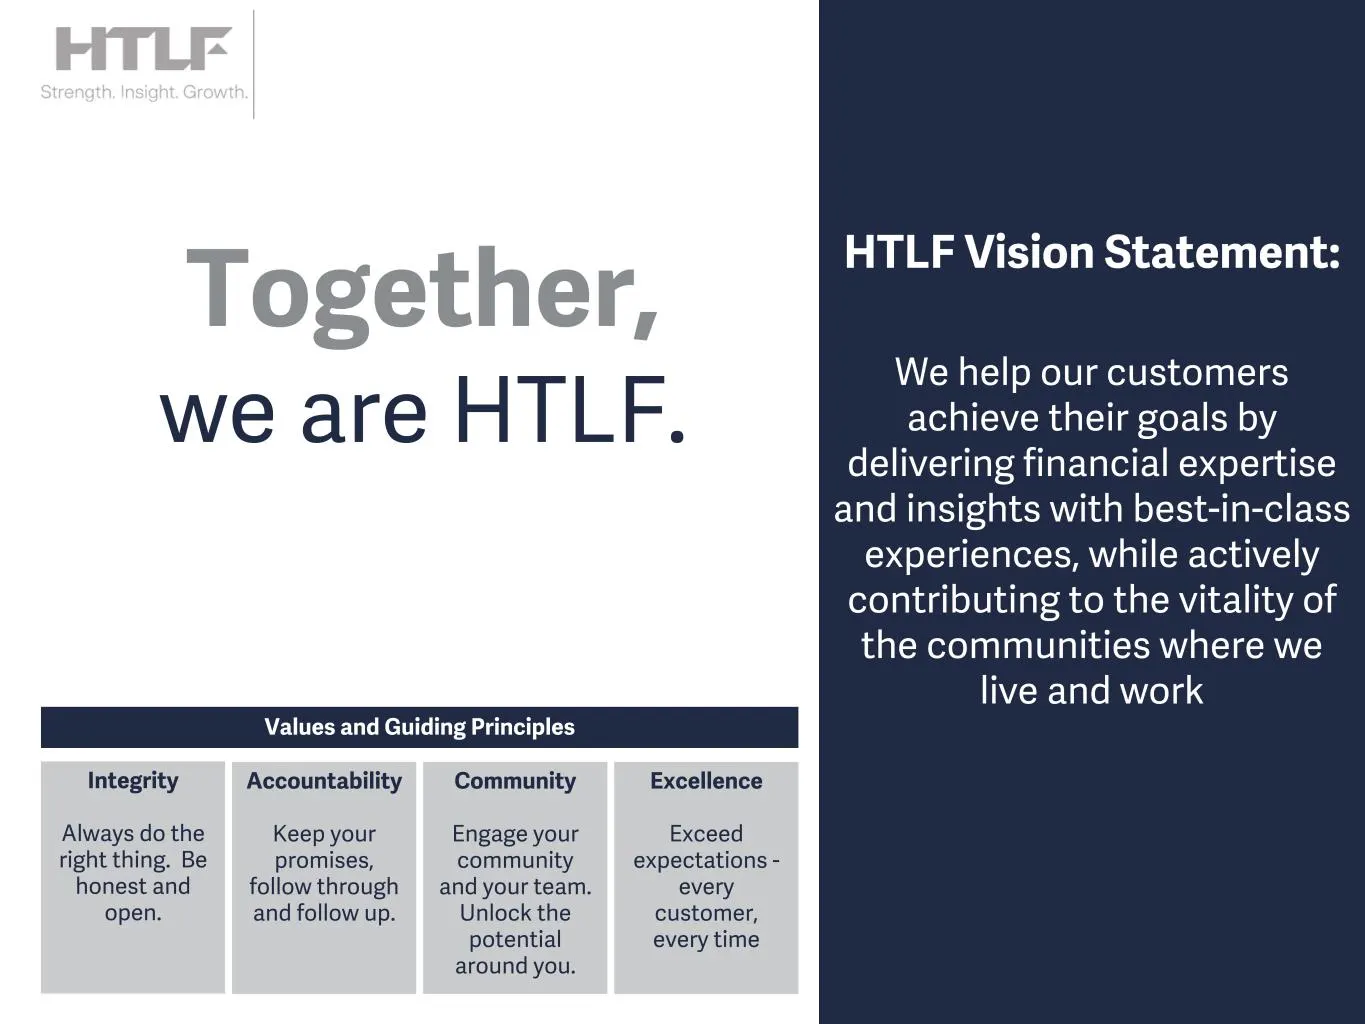
3 HTLF Vision Statement: We help our customers achieve their goals by delivering financial expertise and insights with best-in-class experiences, while actively contributing to the vitality of the communities where we live and work Values and Guiding Principles Integrity Always do the right thing. B
Slide 4: HTLF Highlights: 4Q 2023 and FY 2023
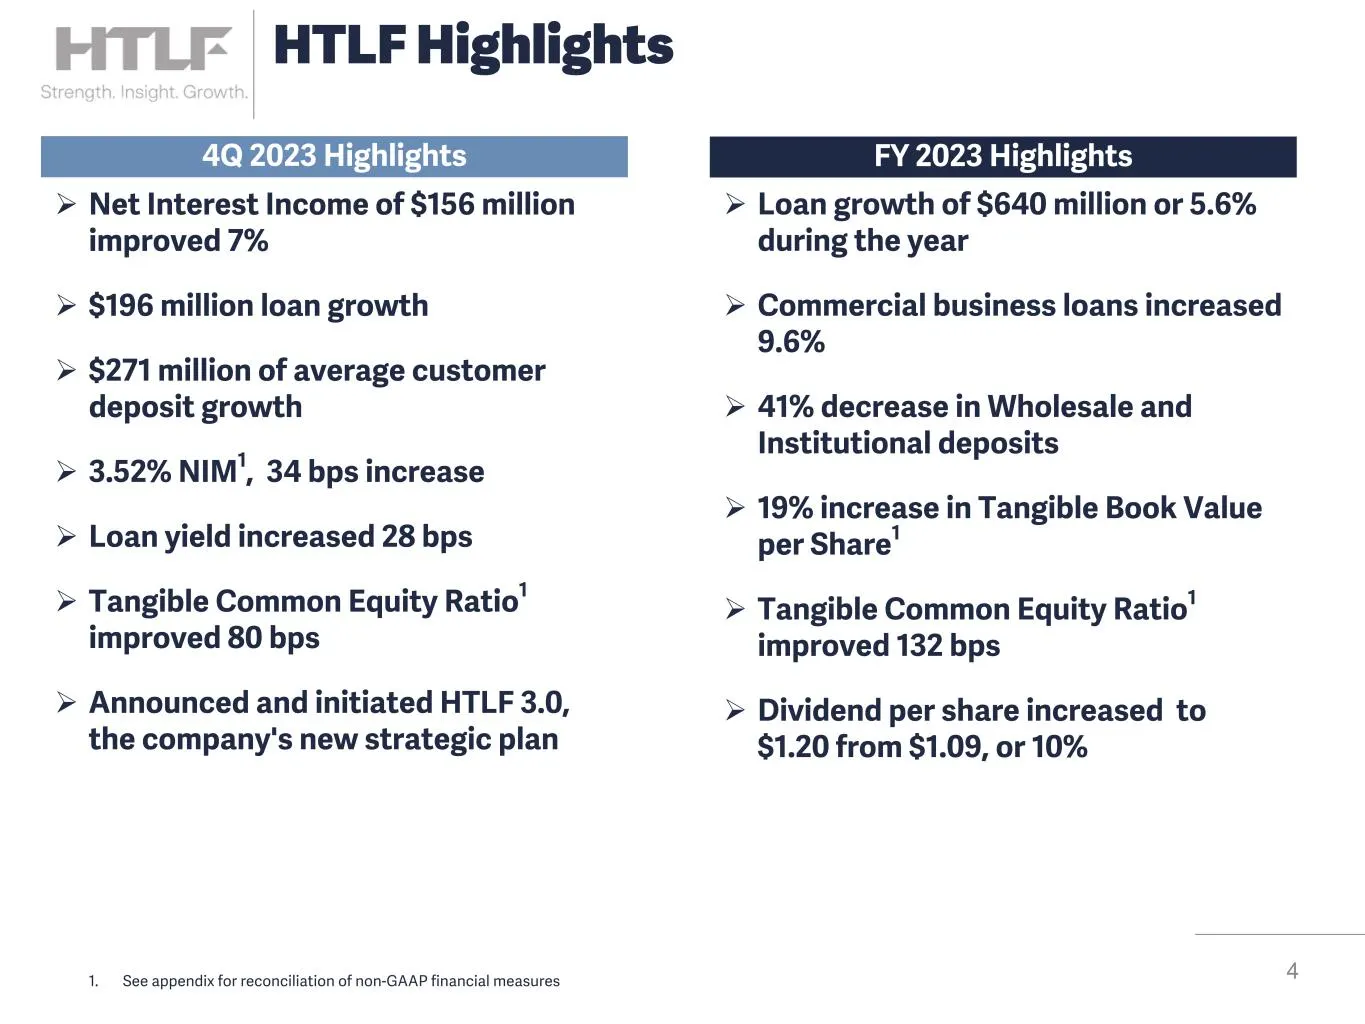
4 HTLF Highlights 1. See appendix for reconciliation of non-GAAP financial measures 4Q 2023 Highlights FY 2023 Highlights Ø Loan growth of $640 million or 5.6% during the year Ø Commercial business loans increased 9.6% Ø 41% decrease in Wholesale and Institutional deposits Ø 19% increase in Tangible
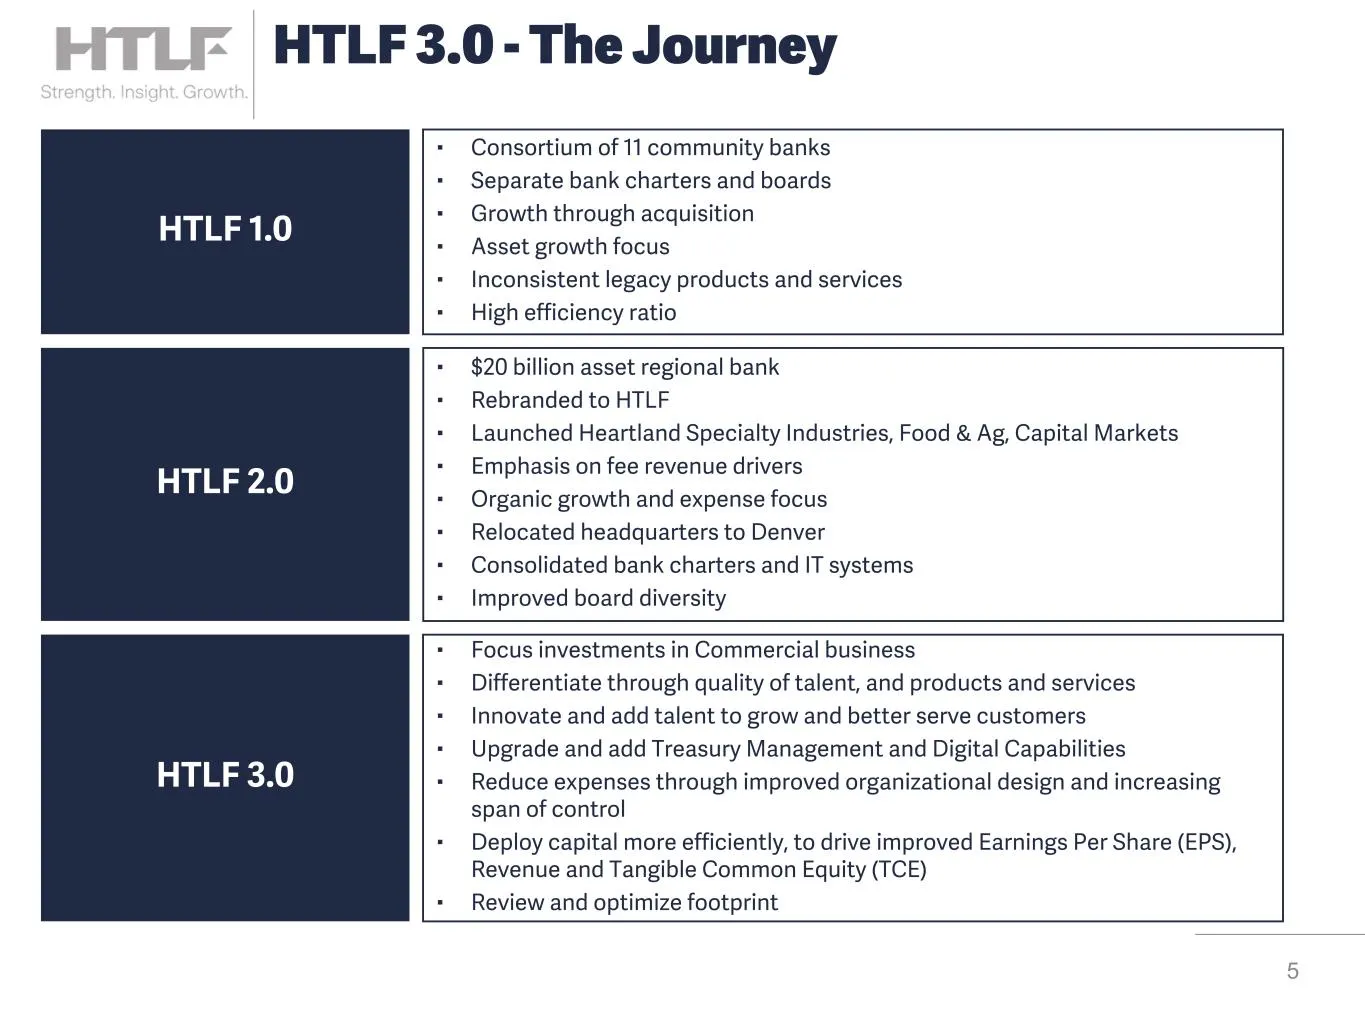
Slide 5: HTLF 3.0 - The Journey
5 HTLF 3.0 - The Journey ▪ Consortium of 11 community banks ▪ Separate bank charters and boards ▪ Growth through acquisition ▪ Asset growth focus ▪ Inconsistent legacy products and services ▪ High efficiency ratio ▪ Focus investments in Commercial business ▪ Differentiate through quality of talent,
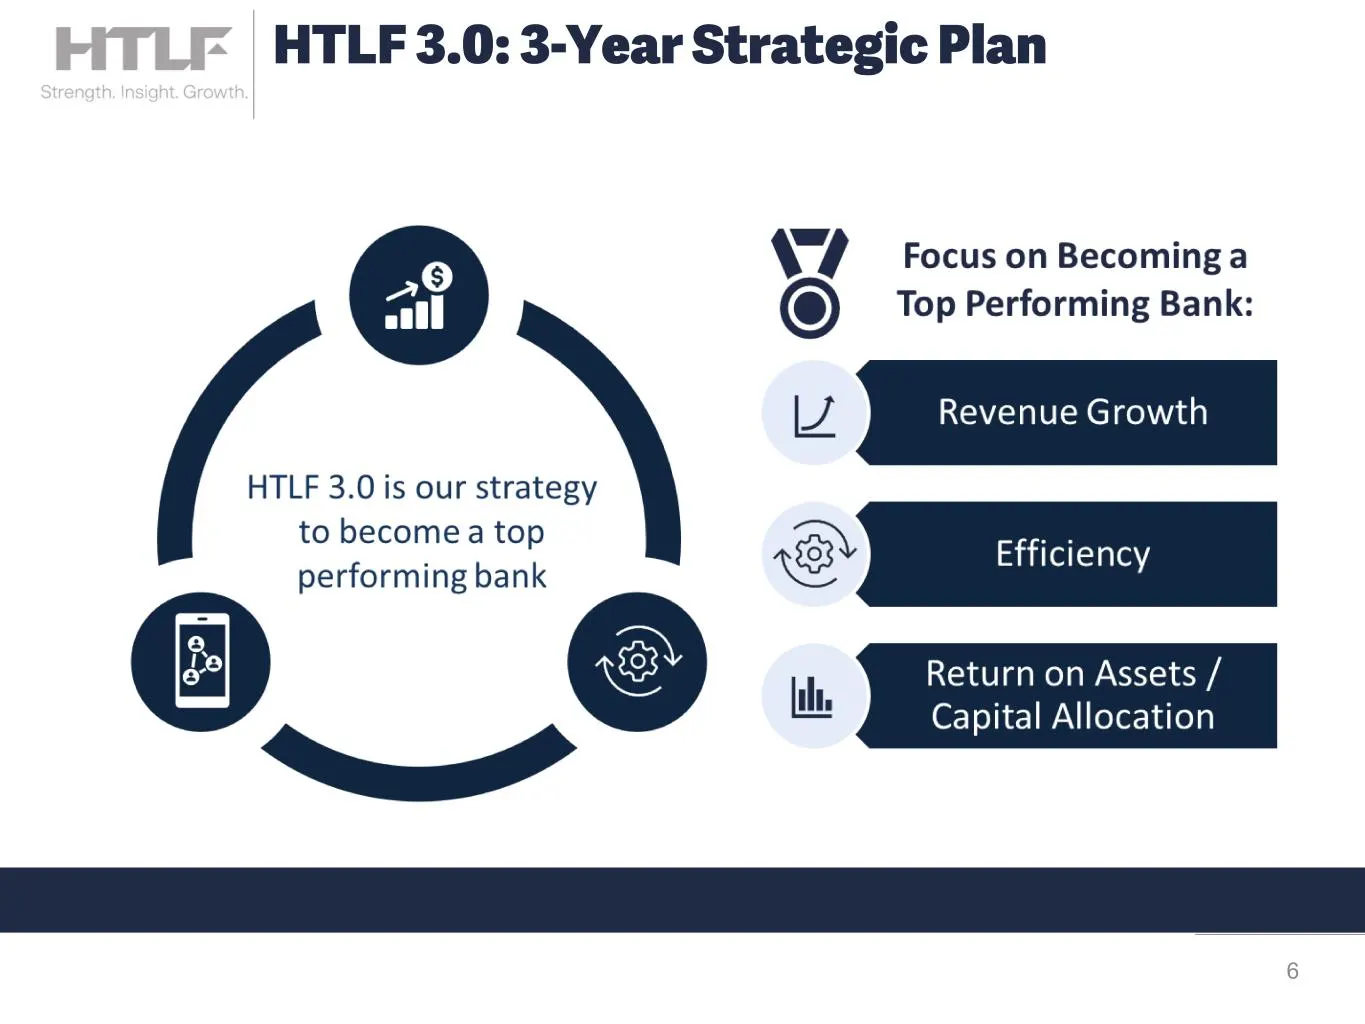
Slide 6: HTLF 3.0: 3-Year Strategic Plan
6 HTLF 3.0: 3-Year Strategic Plan
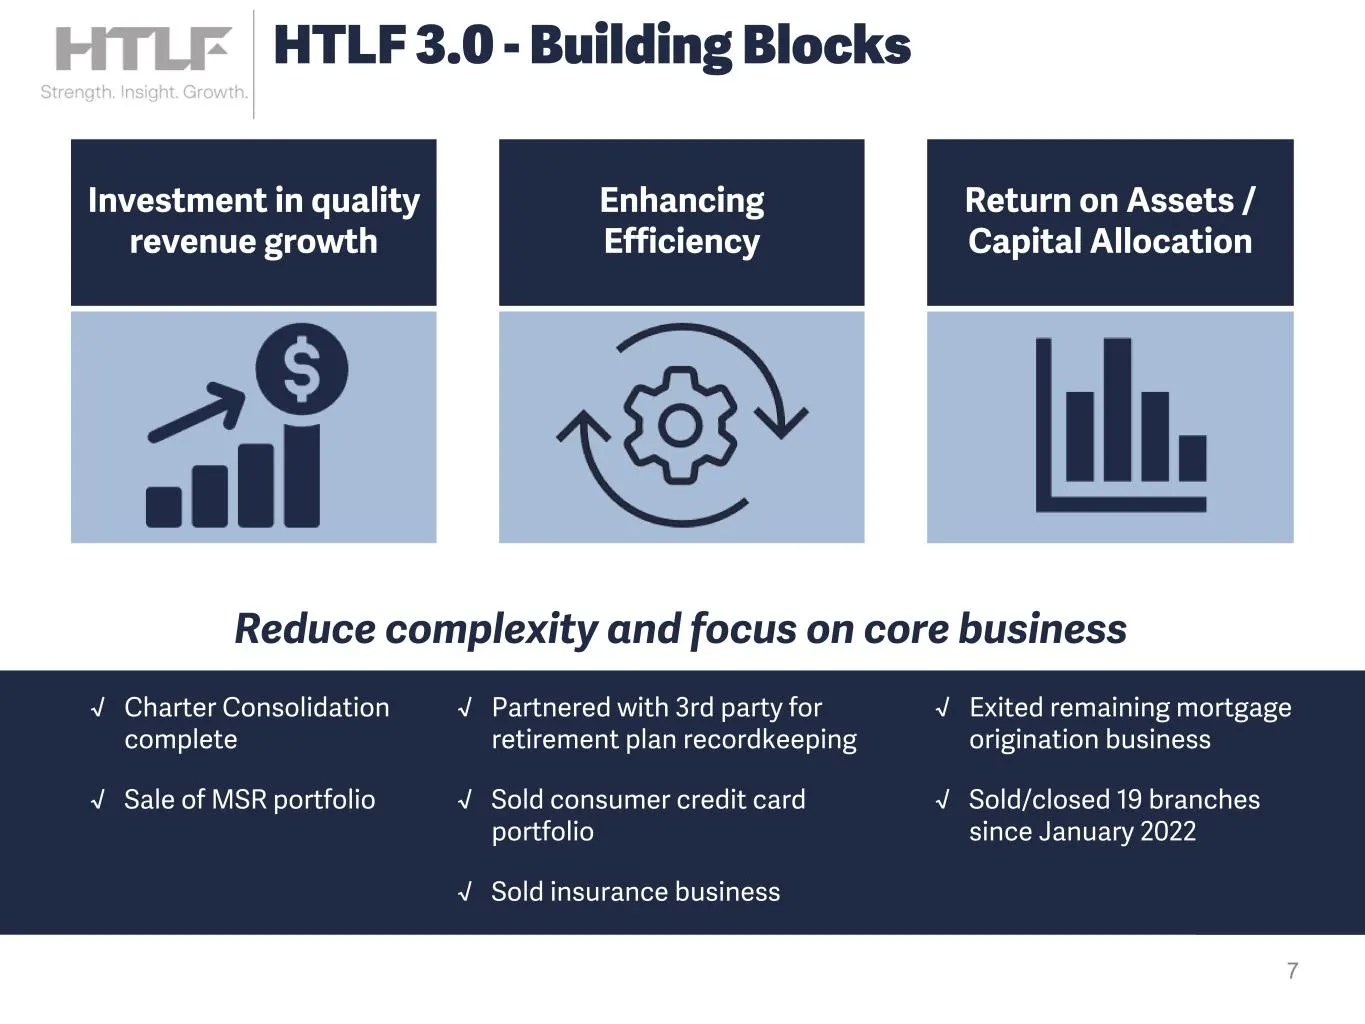
Slide 7: HTLF 3.0 - Building Blocks
7 HTLF 3.0 - Building Blocks Reduce complexity and focus on core business √ Charter Consolidation complete √ Sale of MSR portfolio √ Exited remaining mortgage origination business √ Sold/closed 19 branches since January 2022 √ Partnered with 3rd party for retirement plan recordkeeping √ Sold consume
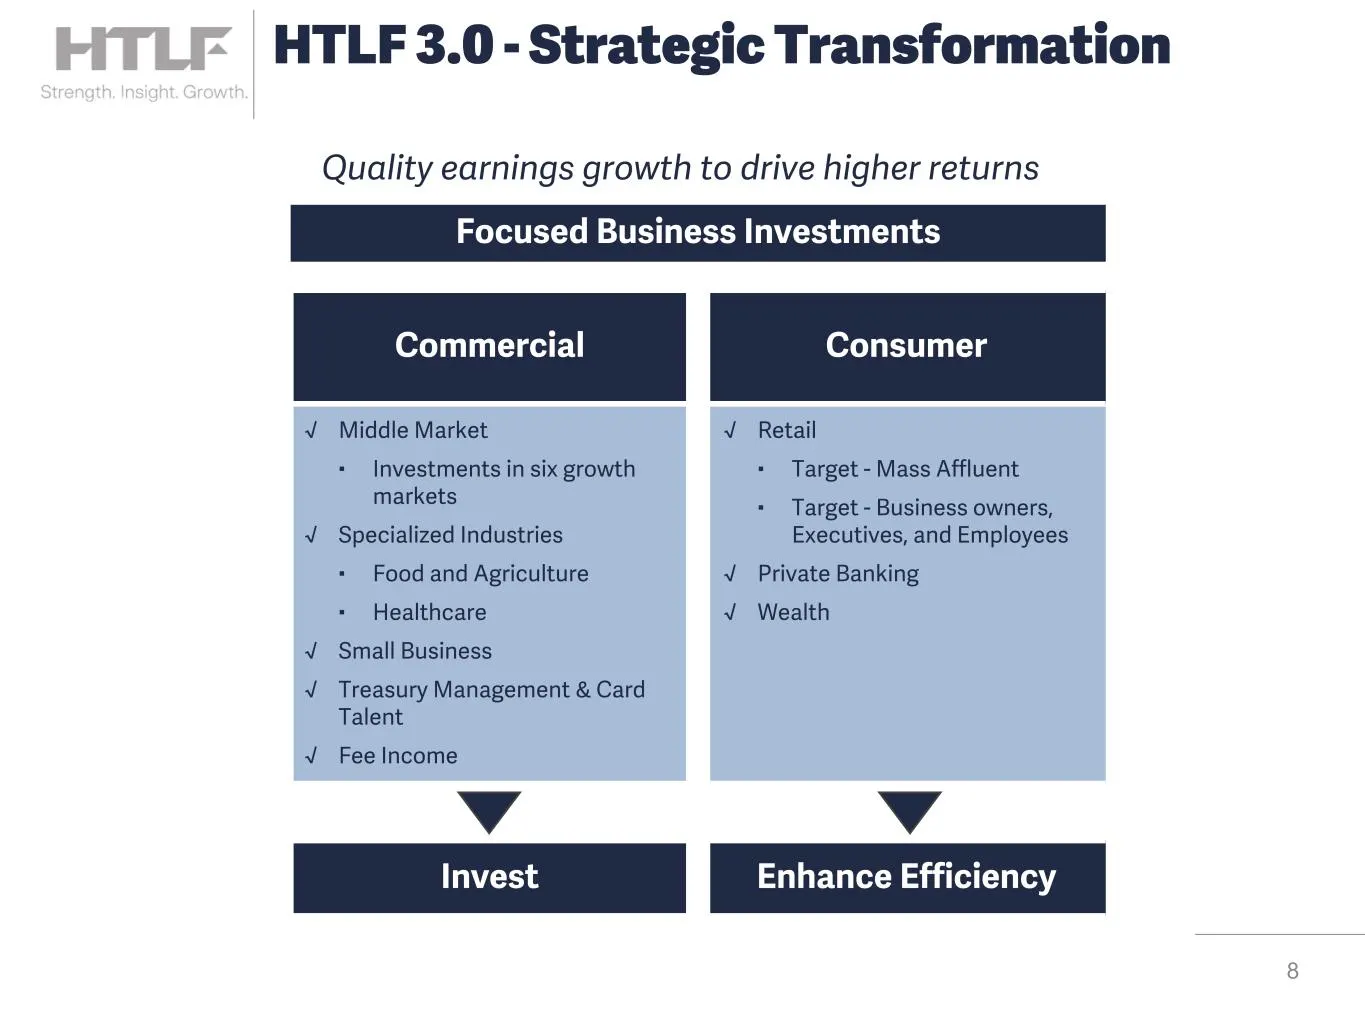
Slide 8: HTLF 3.0 - Strategic Transformation
Focused Business Investments Commercial Consumer Invest Enhance Efficiency 8 HTLF 3.0 - Strategic Transformation √ Retail ▪ Target - Mass Affluent ▪ Target - Business owners, Executives, and Employees √ Private Banking √ Wealth √ Middle Market ▪ Investments in six growth markets √ Specialized Indust
Slide 9: HTLF 3.0 - Initiatives
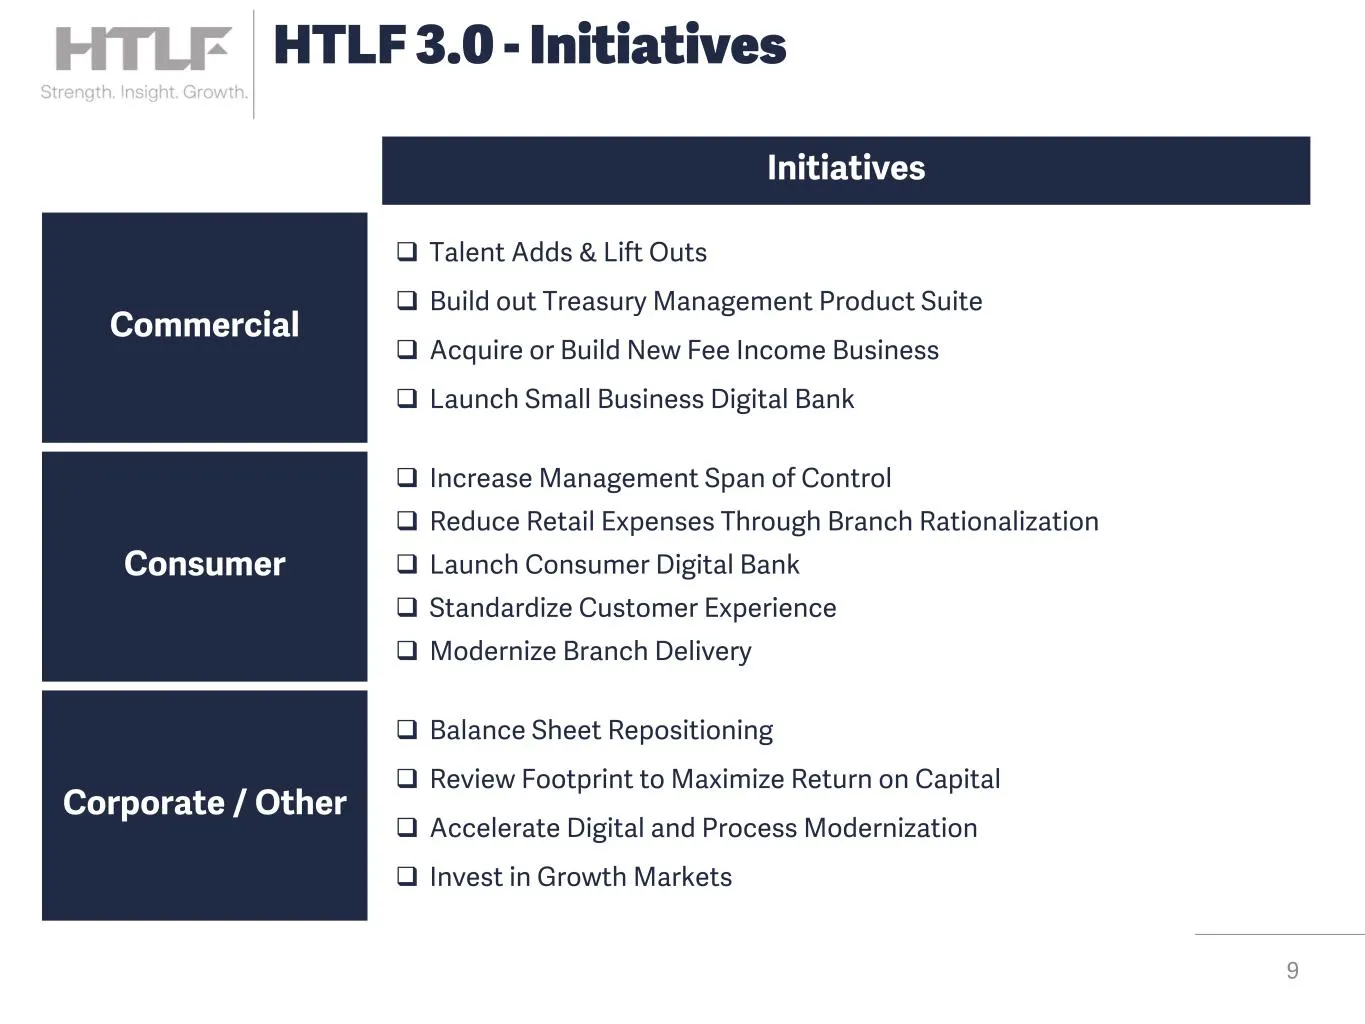
9 HTLF 3.0 - Initiatives Commercial Corporate / Other Consumer q Talent Adds & Lift Outs q Build out Treasury Management Product Suite q Acquire or Build New Fee Income Business q Launch Small Business Digital Bank q Balance Sheet Repositioning q Review Footprint to Maximize Return on Capital q Acce
Slide 10: HTLF 3.0 Actions in Motion
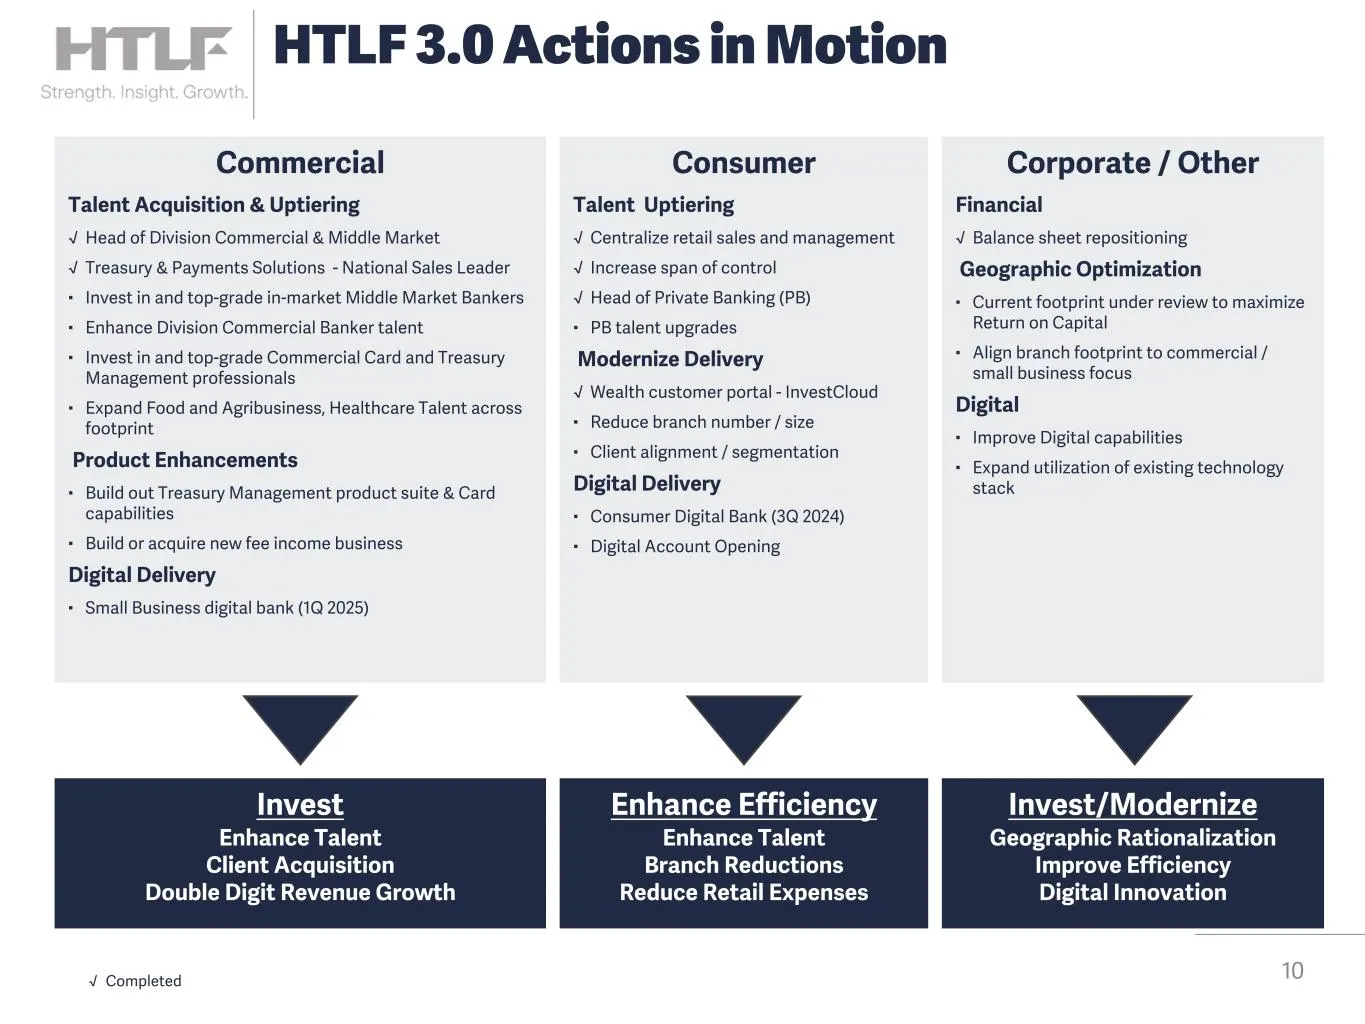
10 HTLF 3.0 Actions in Motion Commercial Talent Acquisition & Uptiering √ Head of Division Commercial & Middle Market √ Treasury & Payments Solutions - National Sales Leader ▪ Invest in and top-grade in-market Middle Market Bankers ▪ Enhance Division Commercial Banker talent ▪ Invest in and top-grad
Slide 11: HTLF 3.0 is Well Underway
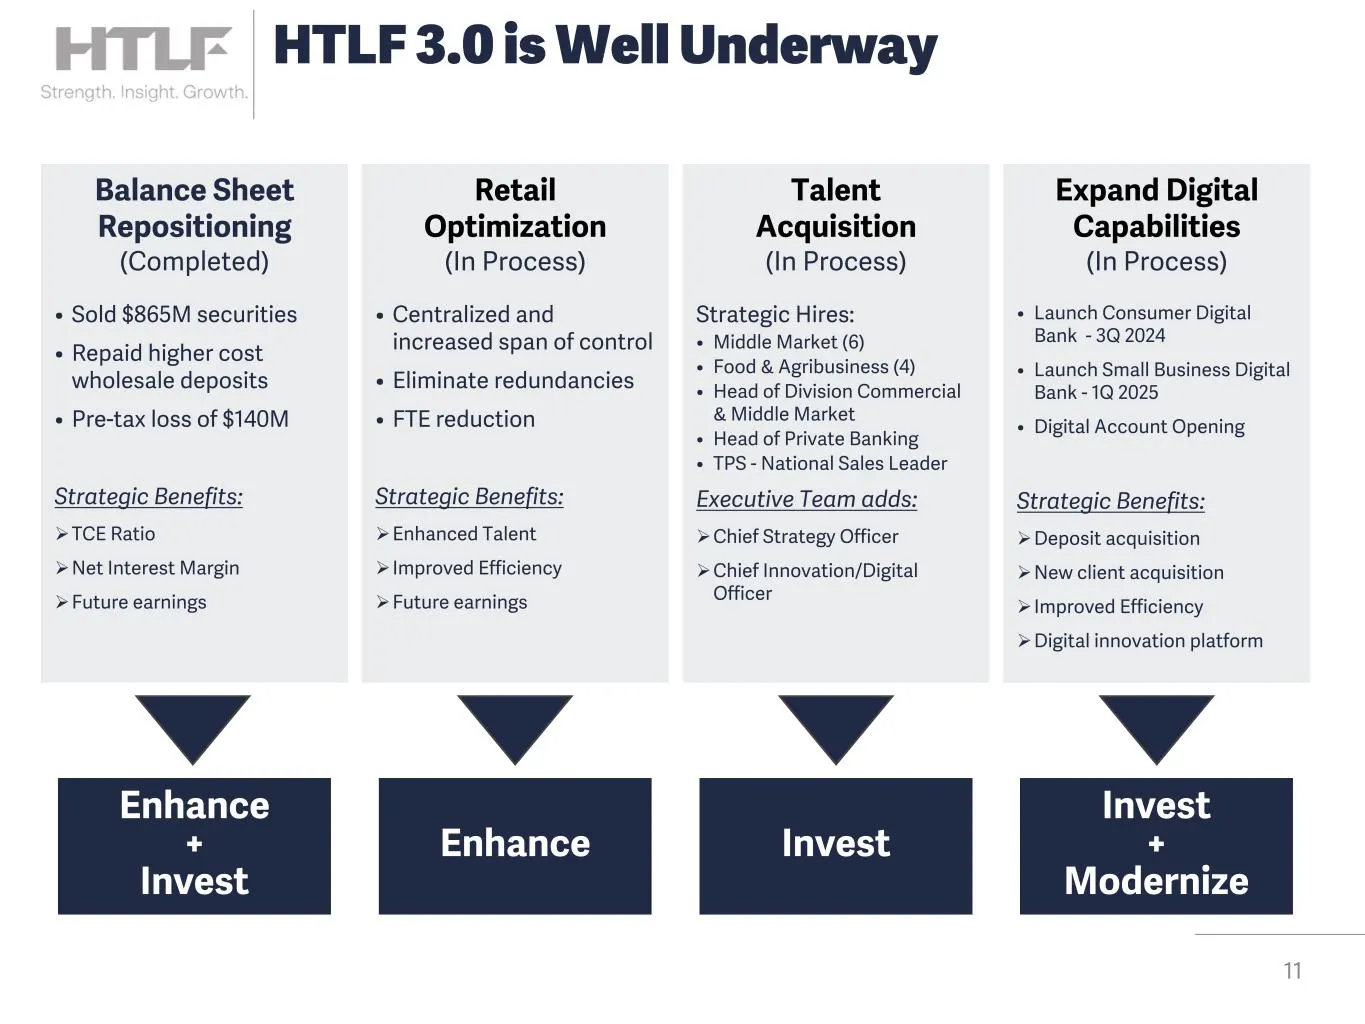
11 HTLF 3.0 is Well Underway Balance Sheet Repositioning (Completed) • Sold $865M securities • Repaid higher cost wholesale deposits • Pre-tax loss of $140M Strategic Benefits: ØTCE Ratio ØNet Interest Margin ØFuture earnings Retail Optimization (In Process) • Centralized and increased span of contr
Slide 12: HTLF 3.0: Strategic Targets
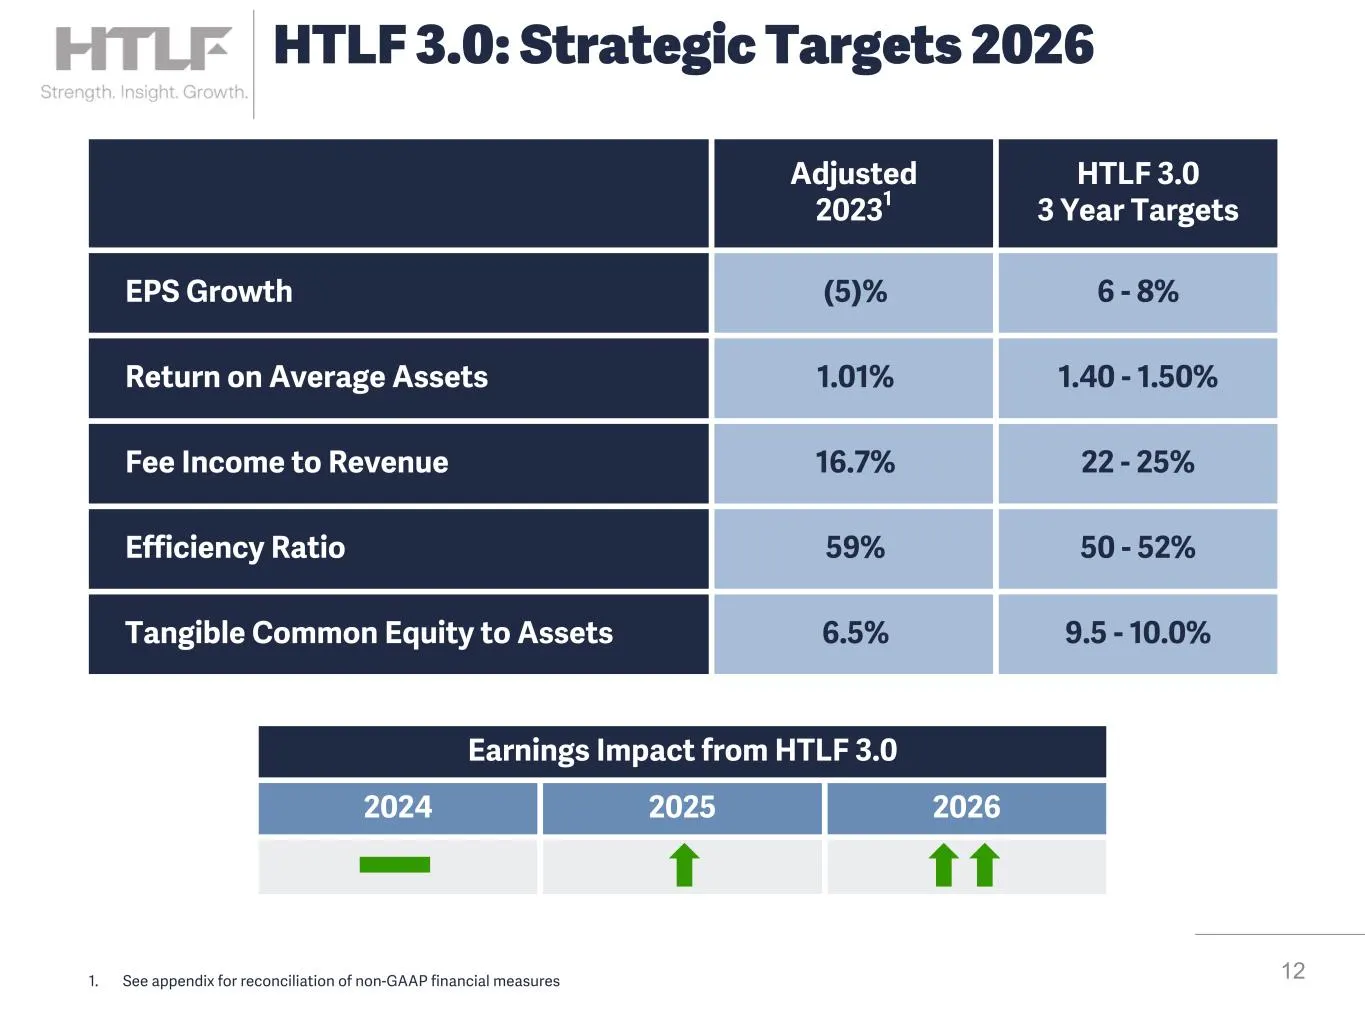
12 HTLF 3.0: Strategic Targets 2026 Adjusted 20231 HTLF 3.0 3 Year Targets EPS Growth (5)% 6 - 8% Return on Average Assets 1.01% 1.40 - 1.50% Fee Income to Revenue 16.7% 22 - 25% Efficiency Ratio 59% 50 - 52% Tangible Common Equity to Assets 6.5% 9.5 - 10.0% 1. See appendix for reconciliation of non
Slide 13: Adjusted Earnings Detail
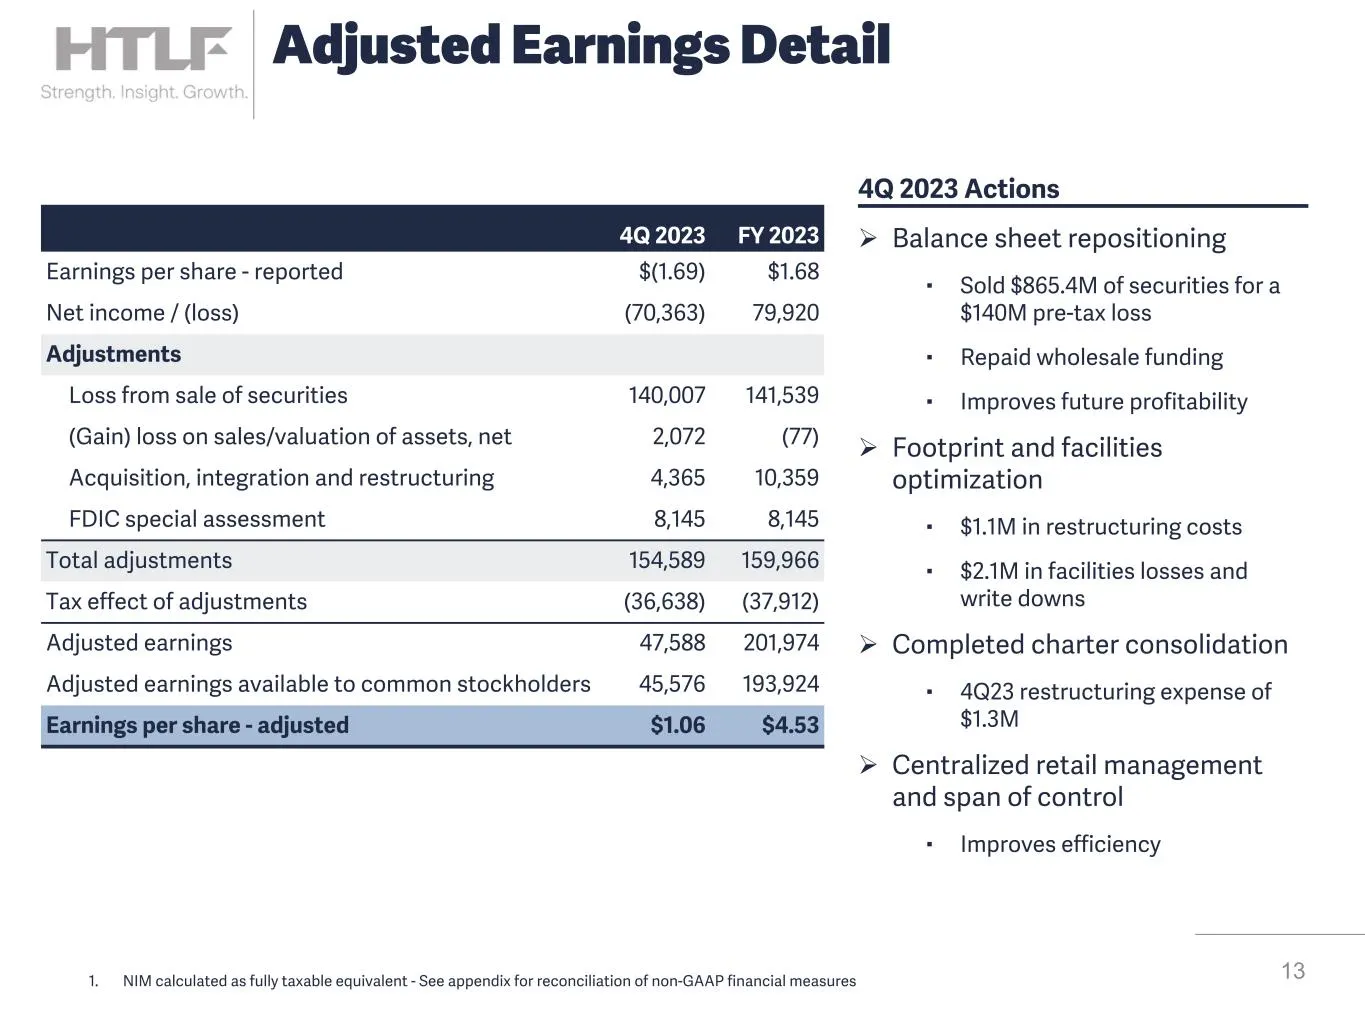
13 Adjusted Earnings Detail 1. NIM calculated as fully taxable equivalent - See appendix for reconciliation of non-GAAP financial measures 4Q 2023 FY 2023 Earnings per share - reported $(1.69) $1.68 Net income / (loss) (70,363) 79,920 Adjustments Loss from sale of securities 140,007 141,539 (Gain) l
Slide 14: Increasing Dividends to Shareholders
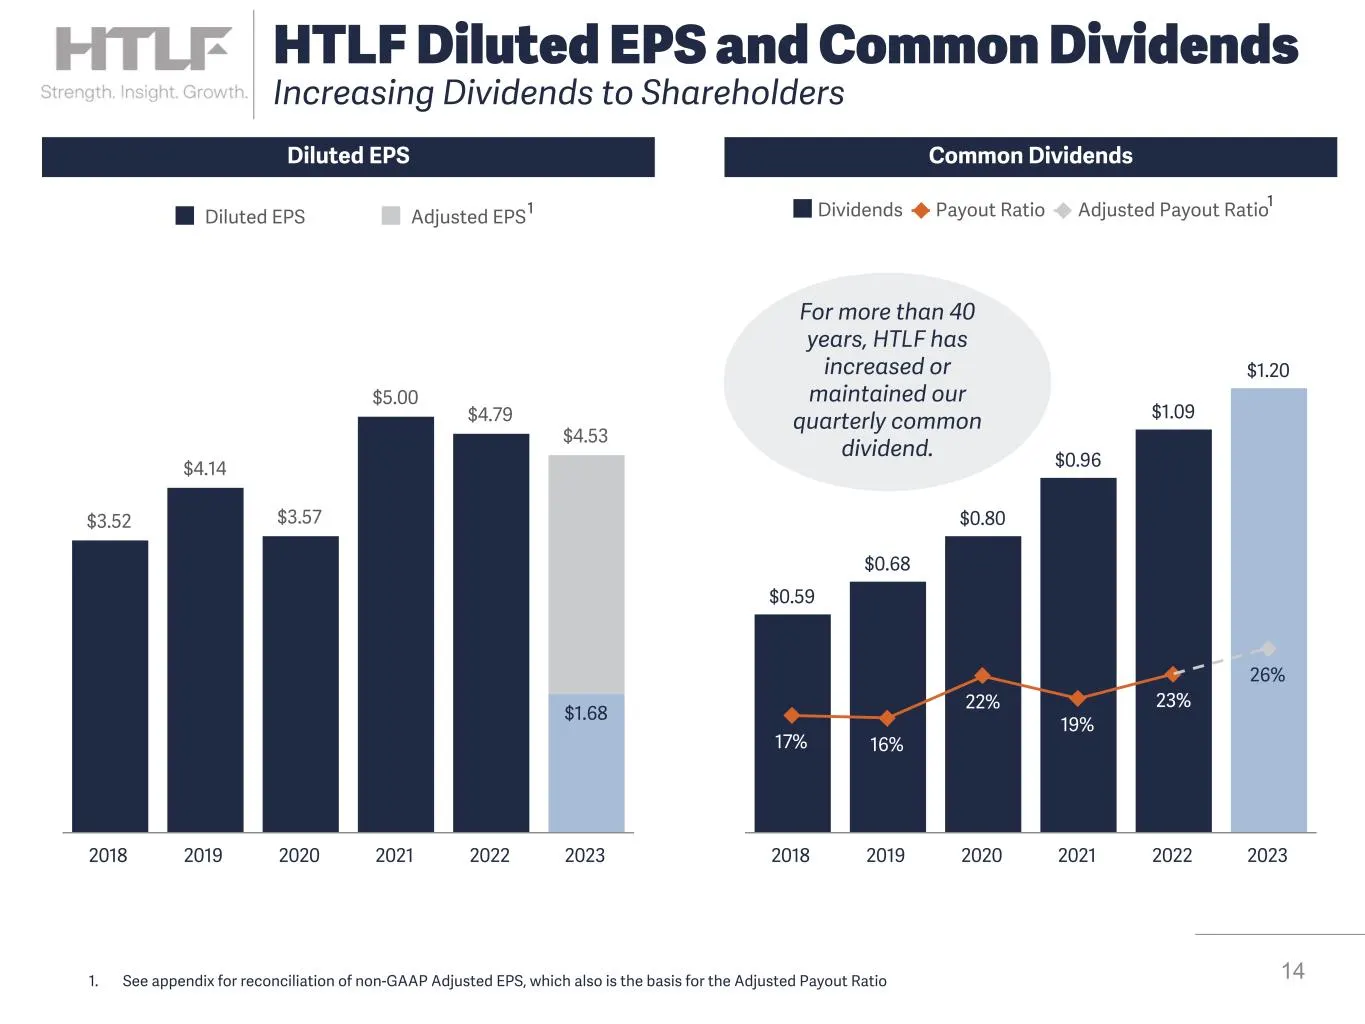
$0.59 $0.68 $0.80 $0.96 $1.09 $1.20 17% 16% 22% 19% 23% 26% Dividends Payout Ratio Adjusted Payout Ratio 2018 2019 2020 2021 2022 2023 $3.52 $4.14 $3.57 $5.00 $4.79 $4.53 $3.52 $4.14 $3.57 $5.00 $4.79 $1.68 Diluted EPS Adjusted EPS 2018 2019 2020 2021 2022 2023 14 HTLF Diluted EPS and Common Dividen
Slide 15: Profitability Summary
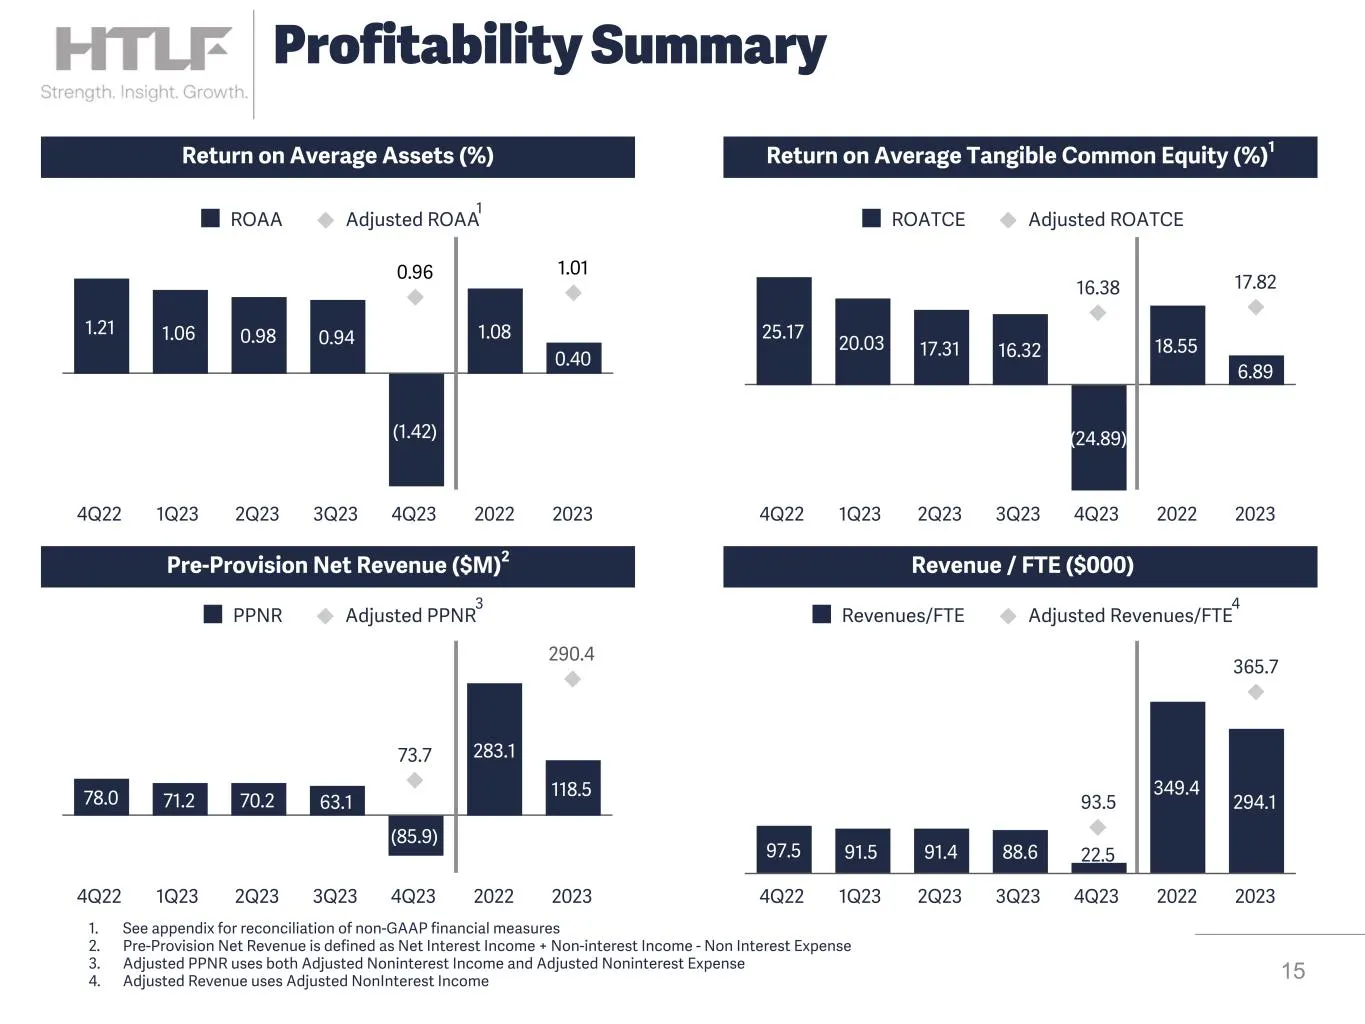
Return on Average Assets (%) Return on Average Tangible Common Equity (%)1 Pre-Provision Net Revenue ($M)2 Revenue / FTE ($000) 1.21 1.06 0.98 0.94 (1.42) 1.08 0.40 0.96 1.01 ROAA Adjusted ROAA 4Q22 1Q23 2Q23 3Q23 4Q23 2022 2023 97.5 91.5 91.4 88.6 22.5 349.4 294.193.5 365.7 Revenues/FTE Adjusted Re
Slide 16: Net Interest Margin Breakdown
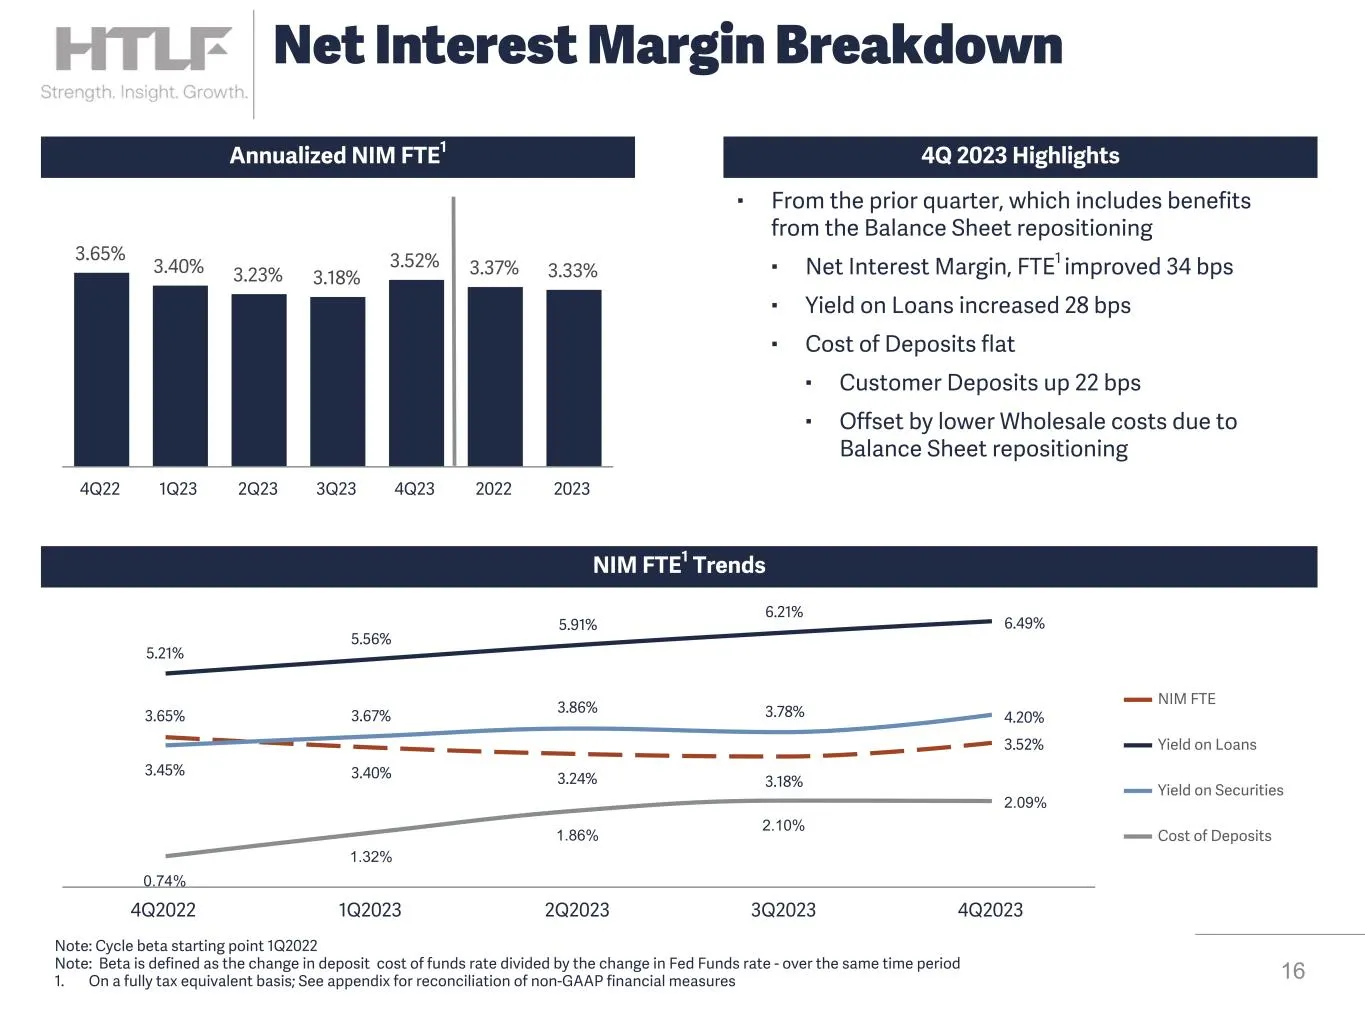
3.65% 3.40% 3.23% 3.18% 3.52% 3.37% 3.33% 4Q22 1Q23 2Q23 3Q23 4Q23 2022 2023 16 Net Interest Margin Breakdown NIM FTE1 Trends Annualized NIM FTE1 3.65% 3.40% 3.24% 3.18% 3.52% 5.21% 5.56% 5.91% 6.21% 6.49% 3.45% 3.67% 3.86% 3.78% 4.20% 0.74% 1.32% 1.86% 2.10% 2.09% NIM FTE Yield on Loans Yield on Se
Slide 17: 4Q2023 Cost of Funds & Betas
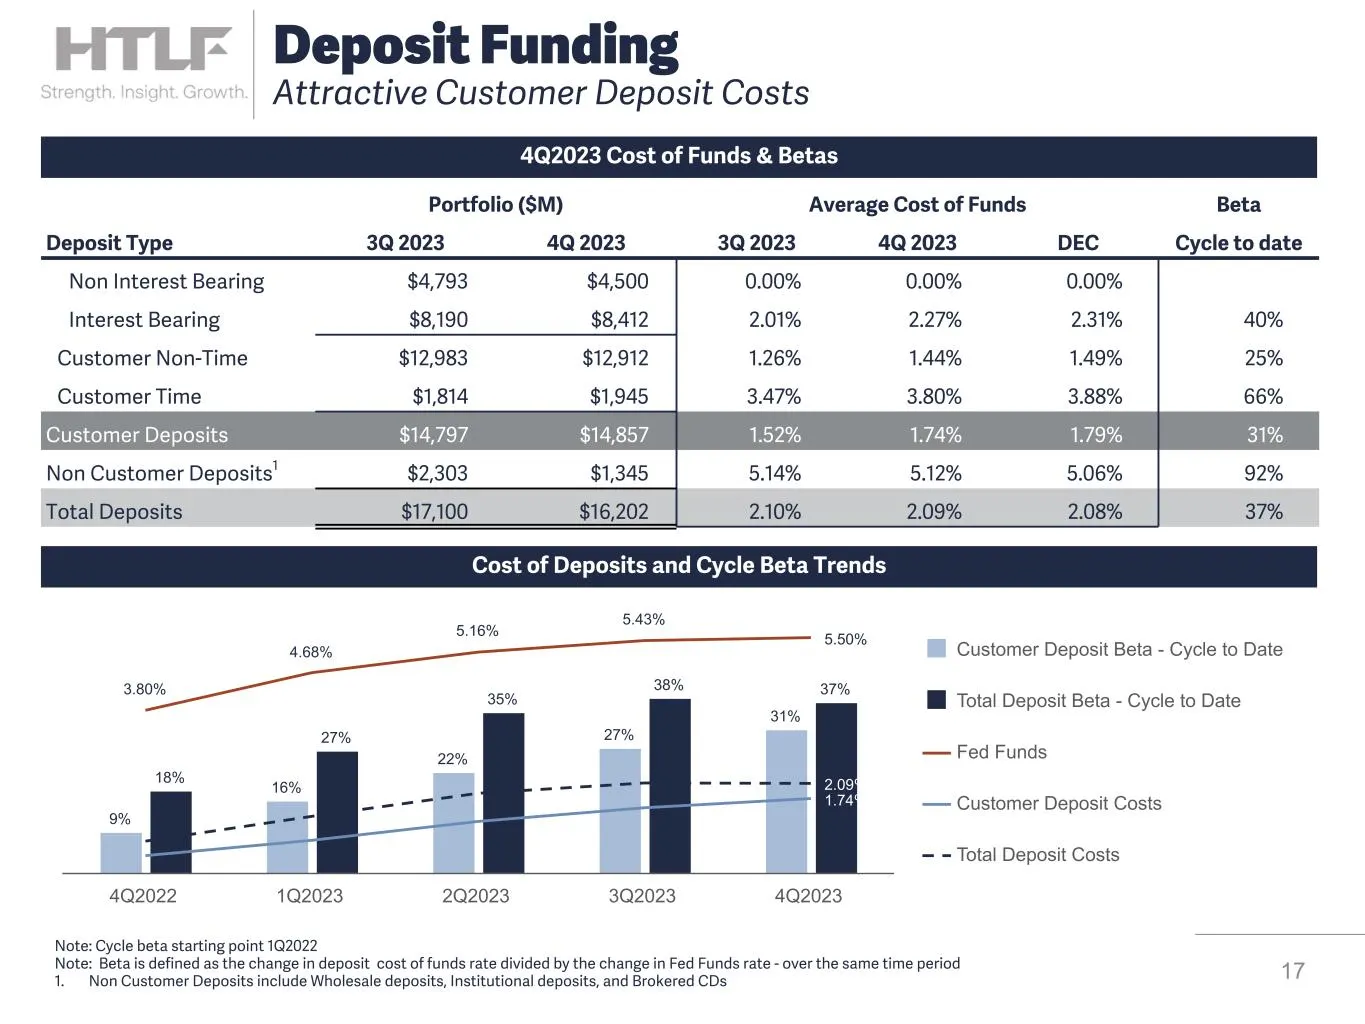
4Q2023 Cost of Funds & Betas 17 Deposit Funding Attractive Customer Deposit Costs Portfolio ($M) Average Cost of Funds Beta Deposit Type 3Q 2023 4Q 2023 3Q 2023 4Q 2023 DEC Cycle to date Non Interest Bearing $4,793 $4,500 0.00 % 0.00 % 0.00 % Interest Bearing $8,190 $8,412 2.01 % 2.27 % 2.31 % 40 %
Slide 18: 4Q 2023 Noninterest Income Breakdown
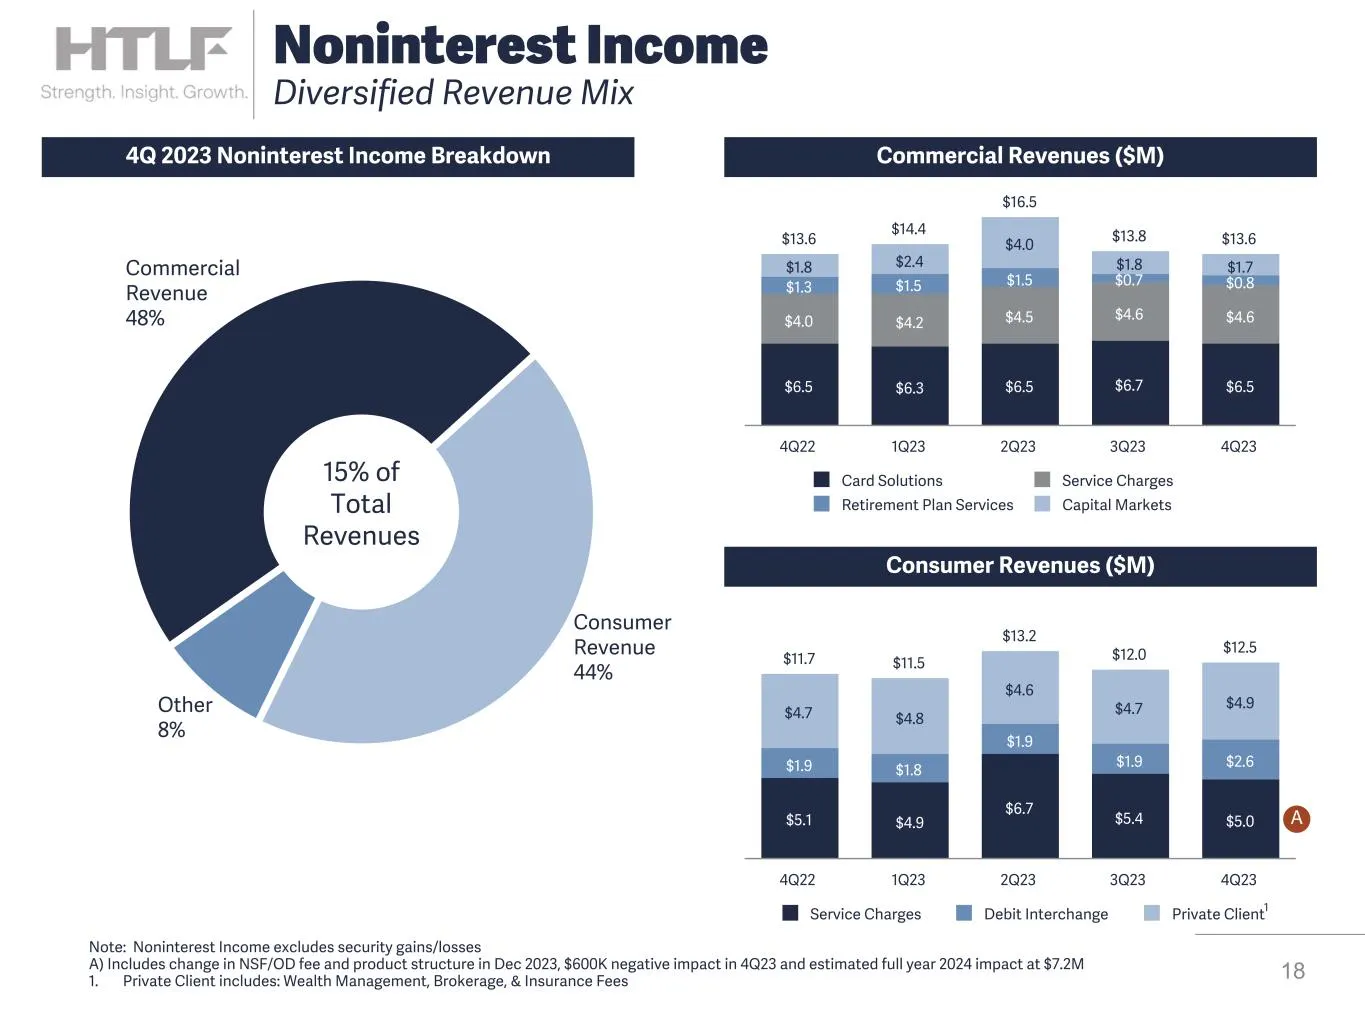
Commercial Revenue 48% Consumer Revenue 44% Other 8% 18 Noninterest Income Diversified Revenue Mix $13.6 $14.4 $16.5 $13.8 $13.6 $6.5 $6.3 $6.5 $6.7 $6.5 $4.0 $4.2 $4.5 $4.6 $4.6 $1.3 $1.5 $1.5 $0.7 $0.8 $1.8 $2.4 $4.0 $1.8 $1.7 Card Solutions Service Charges Retirement Plan Services Capital Markets
Slide 19: Operating Efficiency Improving Core Costs
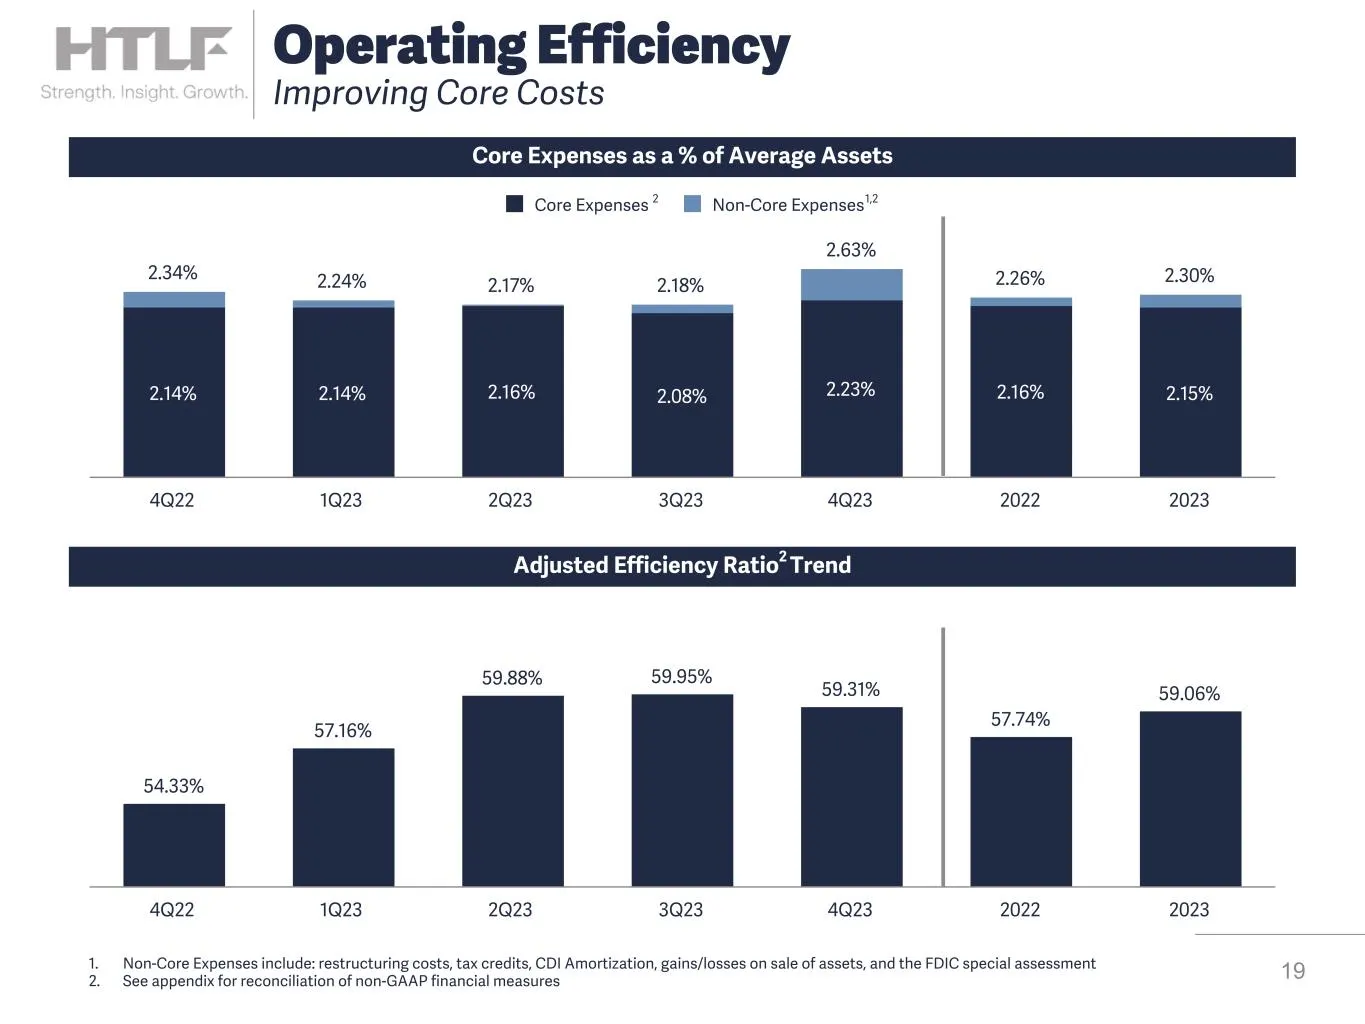
2.34% 2.24% 2.17% 2.18% 2.63% 2.26% 2.30% 2.14% 2.14% 2.16% 2.08% 2.23% 2.16% 2.15% Core Expenses Non-Core Expenses 4Q22 1Q23 2Q23 3Q23 4Q23 2022 2023 54.33% 57.16% 59.88% 59.95% 59.31% 57.74% 59.06% 4Q22 1Q23 2Q23 3Q23 4Q23 2022 2023 1. Non-Core Expenses include: restructuring costs, tax credits, C
Slide 20: Highly Liquid Balance Sheet
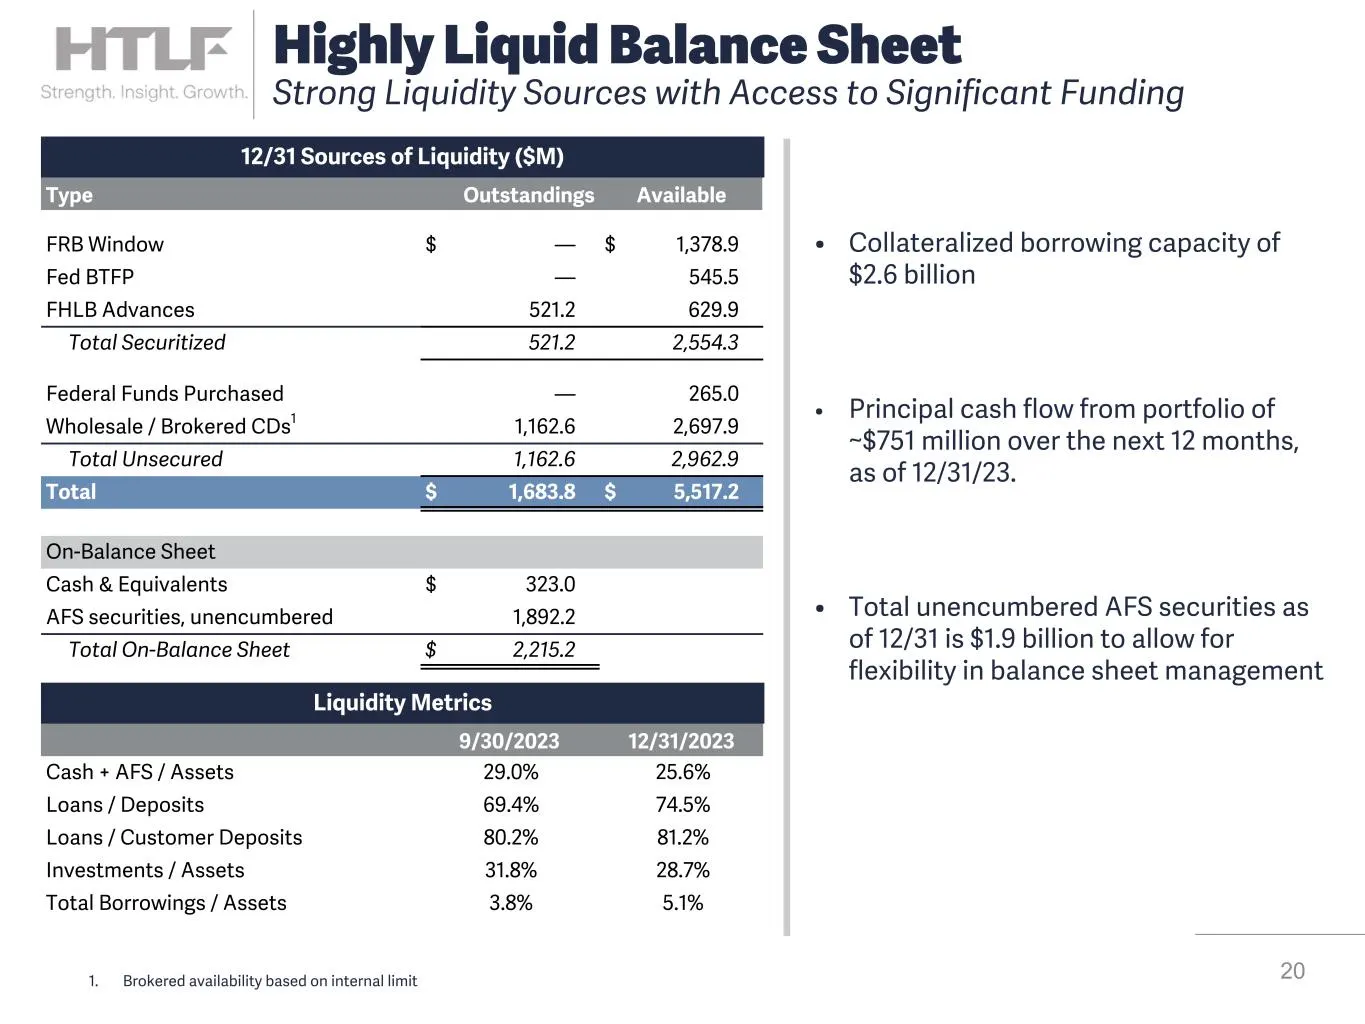
• Collateralized borrowing capacity of $2.6 billion • Principal cash flow from portfolio of ~$751 million over the next 12 months, as of 12/31/23. • Total unencumbered AFS securities as of 12/31 is $1.9 billion to allow for flexibility in balance sheet management 20 12/31 Sources of Liquidity ($M) H
Slide 21: Investment Portfolio
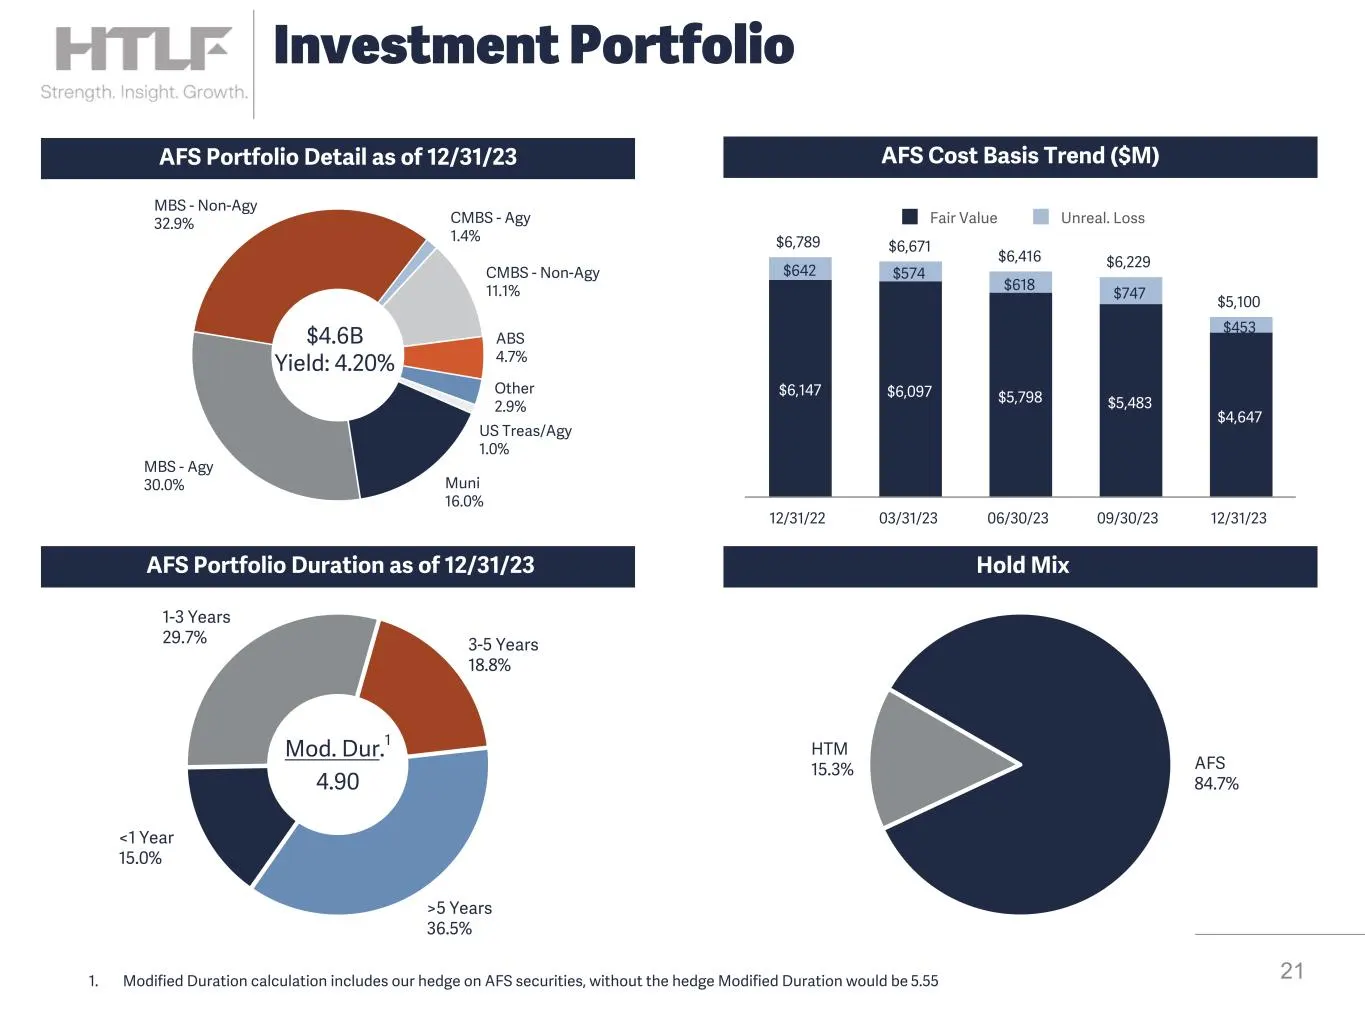
US Treas/Agy 1.0% Muni 16.0% MBS - Agy 30.0% MBS - Non-Agy 32.9% CMBS - Agy 1.4% CMBS - Non-Agy 11.1% ABS 4.7% Other 2.9% 21 Investment Portfolio AFS Portfolio Detail as of 12/31/23 $4.6B Yield: 4.20% <1 Year 15.0% 1-3 Years 29.7% 3-5 Years 18.8% >5 Years 36.5% AFS Portfolio Duration as of 12/31/23
Slide 22: Diversified Loan Portfolio Across both Product and Footprint
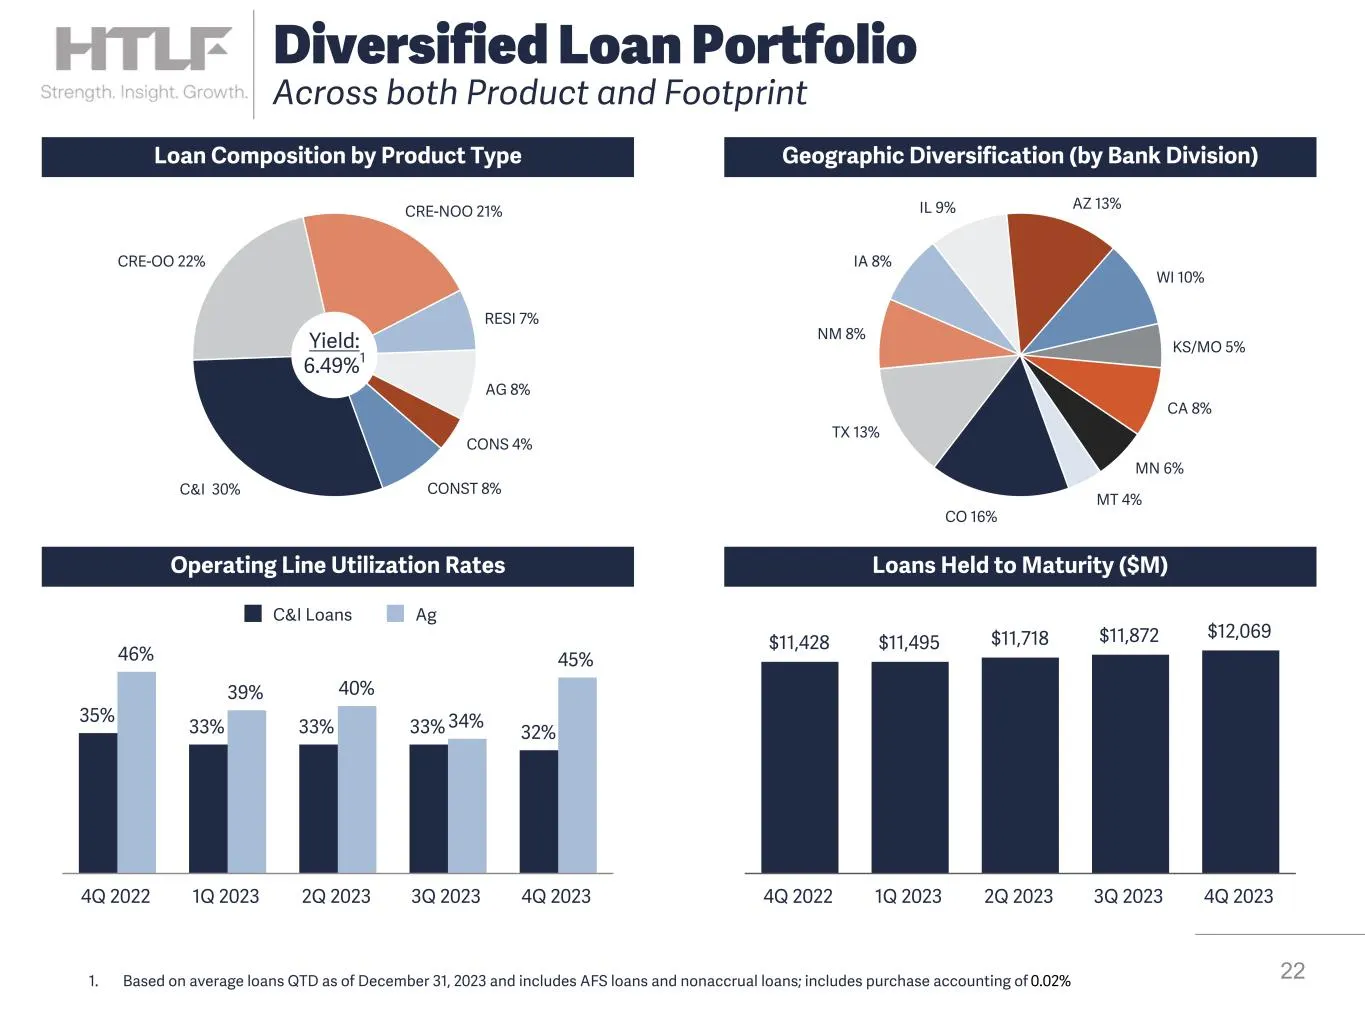
Loan Composition by Product Type Geographic Diversification (by Bank Division) Loans Held to Maturity ($M)Operating Line Utilization Rates C&I 30% CRE-OO 22% CRE-NOO 21% RESI 7% AG 8% CONS 4% CONST 8% Yield: 6.49%1 CO 16% TX 13% NM 8% IA 8% IL 9% AZ 13% WI 10% KS/MO 5% CA 8% MN 6% MT 4% 35% 33% 33%
Slide 23: Diversified and Stable Deposit Base
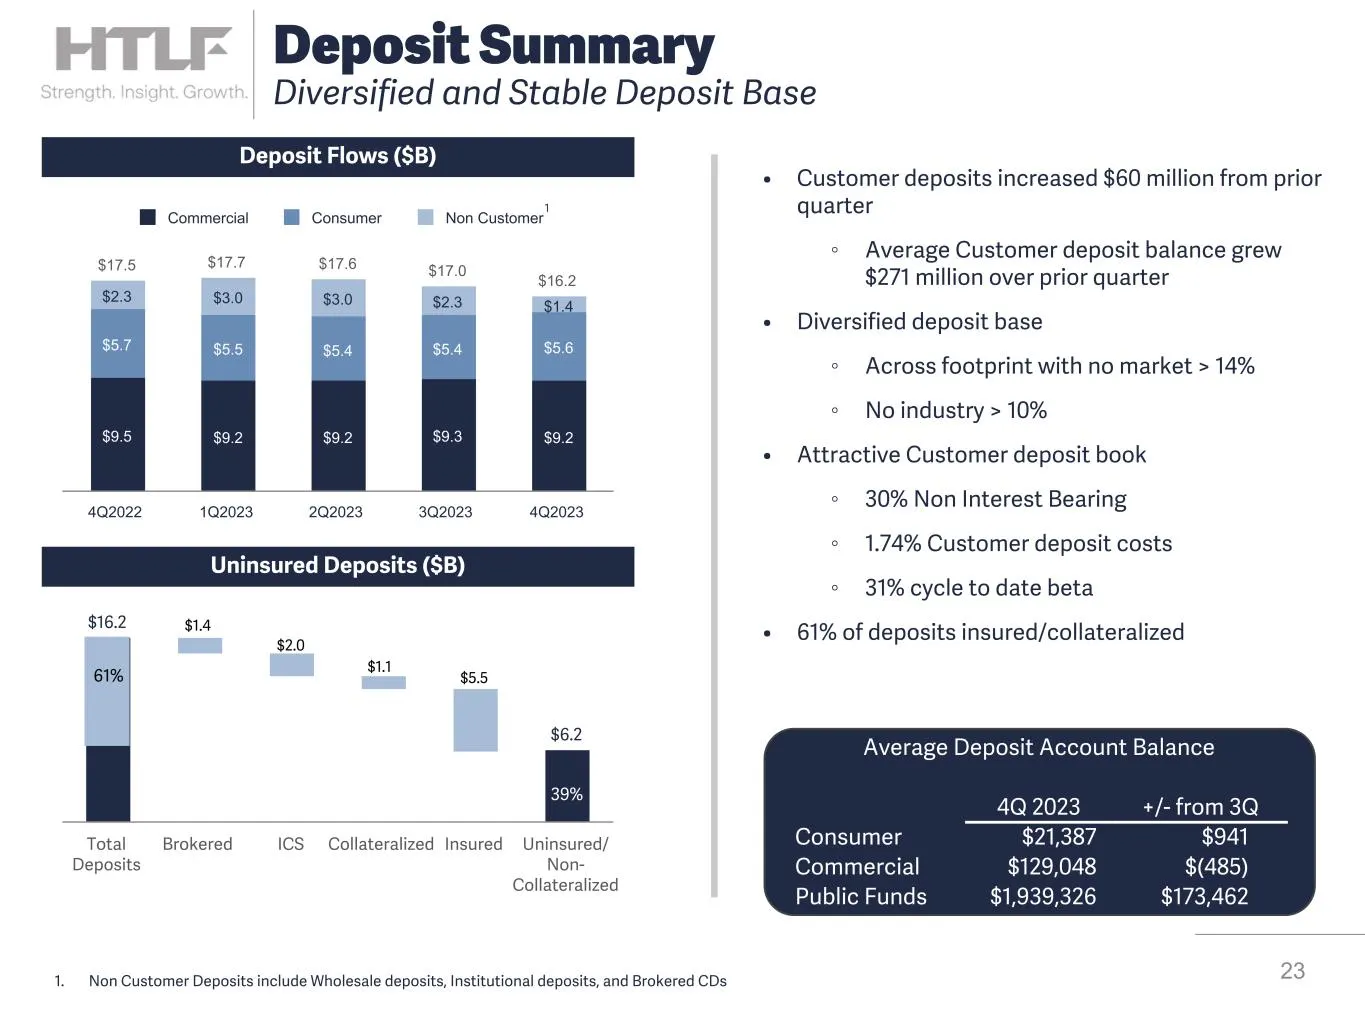
$16.2 $6.2 39% Total Deposits Brokered ICS Collateralized Insured Uninsured/ Non- Collateralized $17.5 $17.7 $17.6 $17.0 $16.2 $9.5 $9.2 $9.2 $9.3 $9.2 $5.7 $5.5 $5.4 $5.4 $5.6 $2.3 $3.0 $3.0 $2.3 $1.4 Commercial Consumer Non Customer 4Q2022 1Q2023 2Q2023 3Q2023 4Q2023 Deposit Flows ($B) 23 Deposit
Slide 24: Healthy Deposit Mix
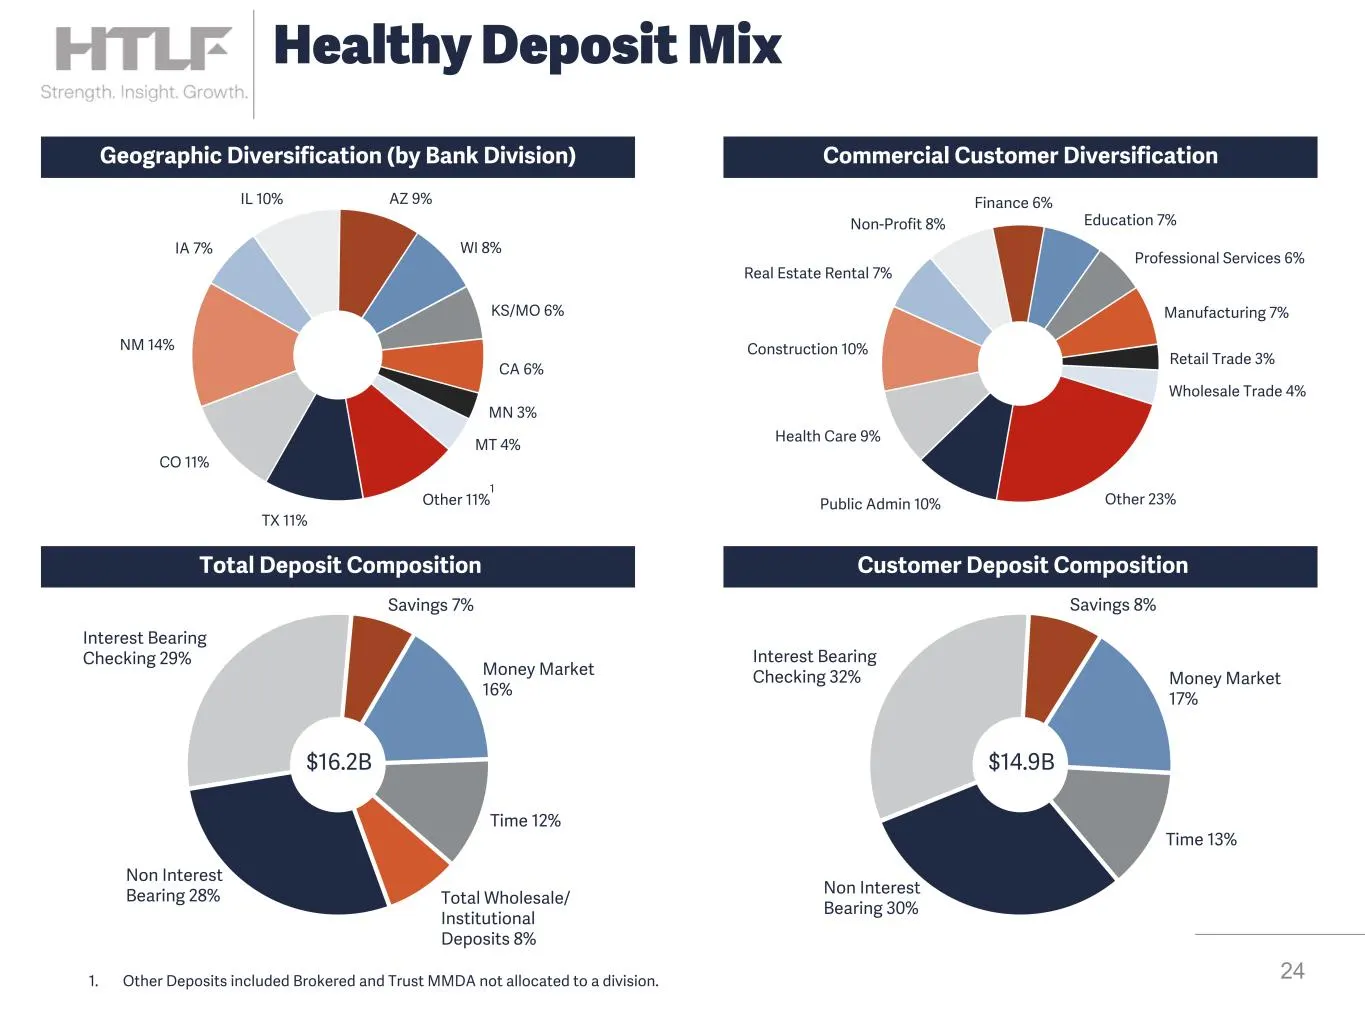
Non Interest Bearing 28% Interest Bearing Checking 29% Savings 7% Money Market 16% Time 12% Total Wholesale/ Institutional Deposits 8% Geographic Diversification (by Bank Division) Commercial Customer Diversification 24 Healthy Deposit Mix Total Deposit Composition Public Admin 10% Health Care 9% Co
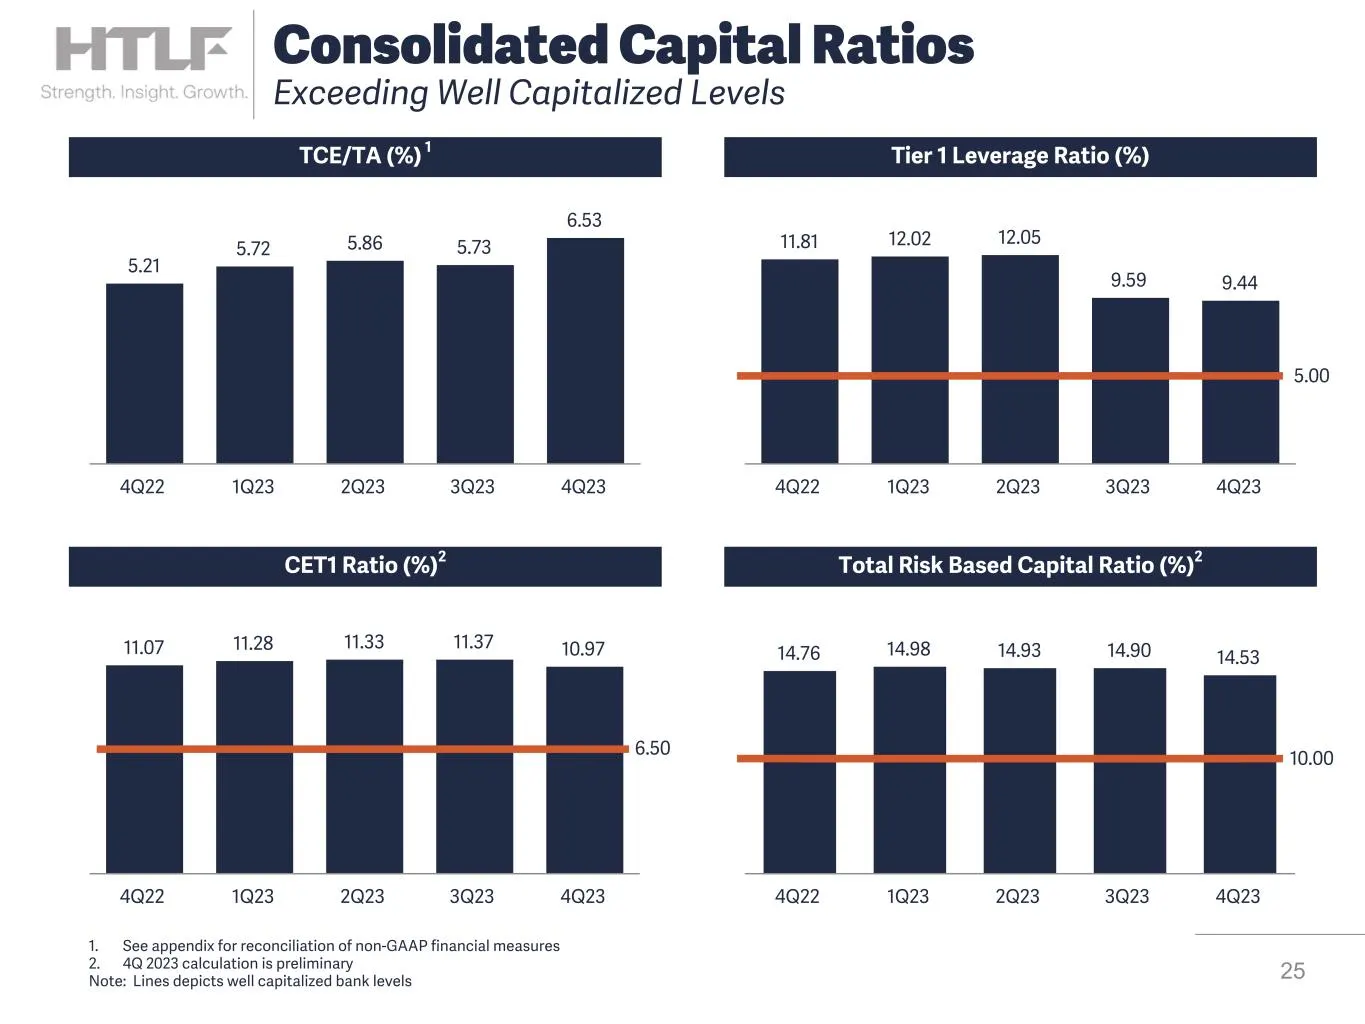
Slide 25: Consolidated Capital Ratios Exceeding Well Capitalized Levels
11.07 11.28 11.33 11.37 10.97 4Q22 1Q23 2Q23 3Q23 4Q23 6.50 TCE/TA (%) 1 Tier 1 Leverage Ratio (%) CET1 Ratio (%)2 Total Risk Based Capital Ratio (%)2 5.21 5.72 5.86 5.73 6.53 4Q22 1Q23 2Q23 3Q23 4Q23 11.81 12.02 12.05 9.59 9.44 5.00 5.00 4Q22 1Q23 2Q23 3Q23 4Q23 14.76 14.98 14.93 14.90 14.53 4Q22 1
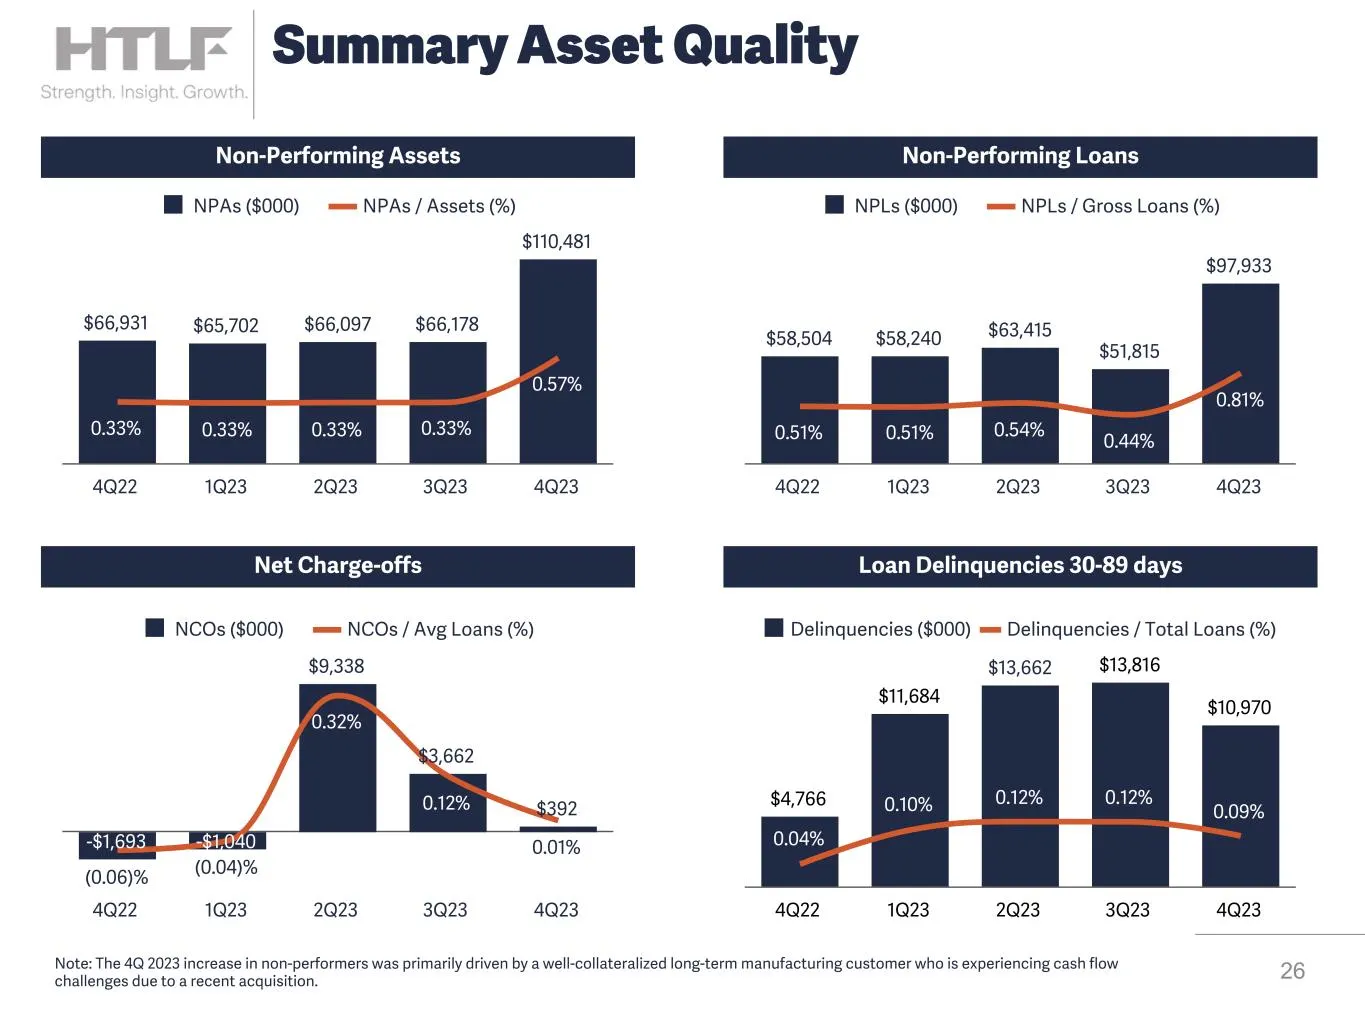
Slide 26: Summary Asset Quality
$4,766 $11,684 $13,662 $13,816 $10,970 0.04% 0.10% 0.12% 0.12% 0.09% Delinquencies ($000) Delinquencies / Total Loans (%) 4Q22 1Q23 2Q23 3Q23 4Q23 Non-Performing Assets Non-Performing Loans Net Charge-offs Loan Delinquencies 30-89 days $66,931 $65,702 $66,097 $66,178 $110,481 0.33% 0.33% 0.33% 0.33%
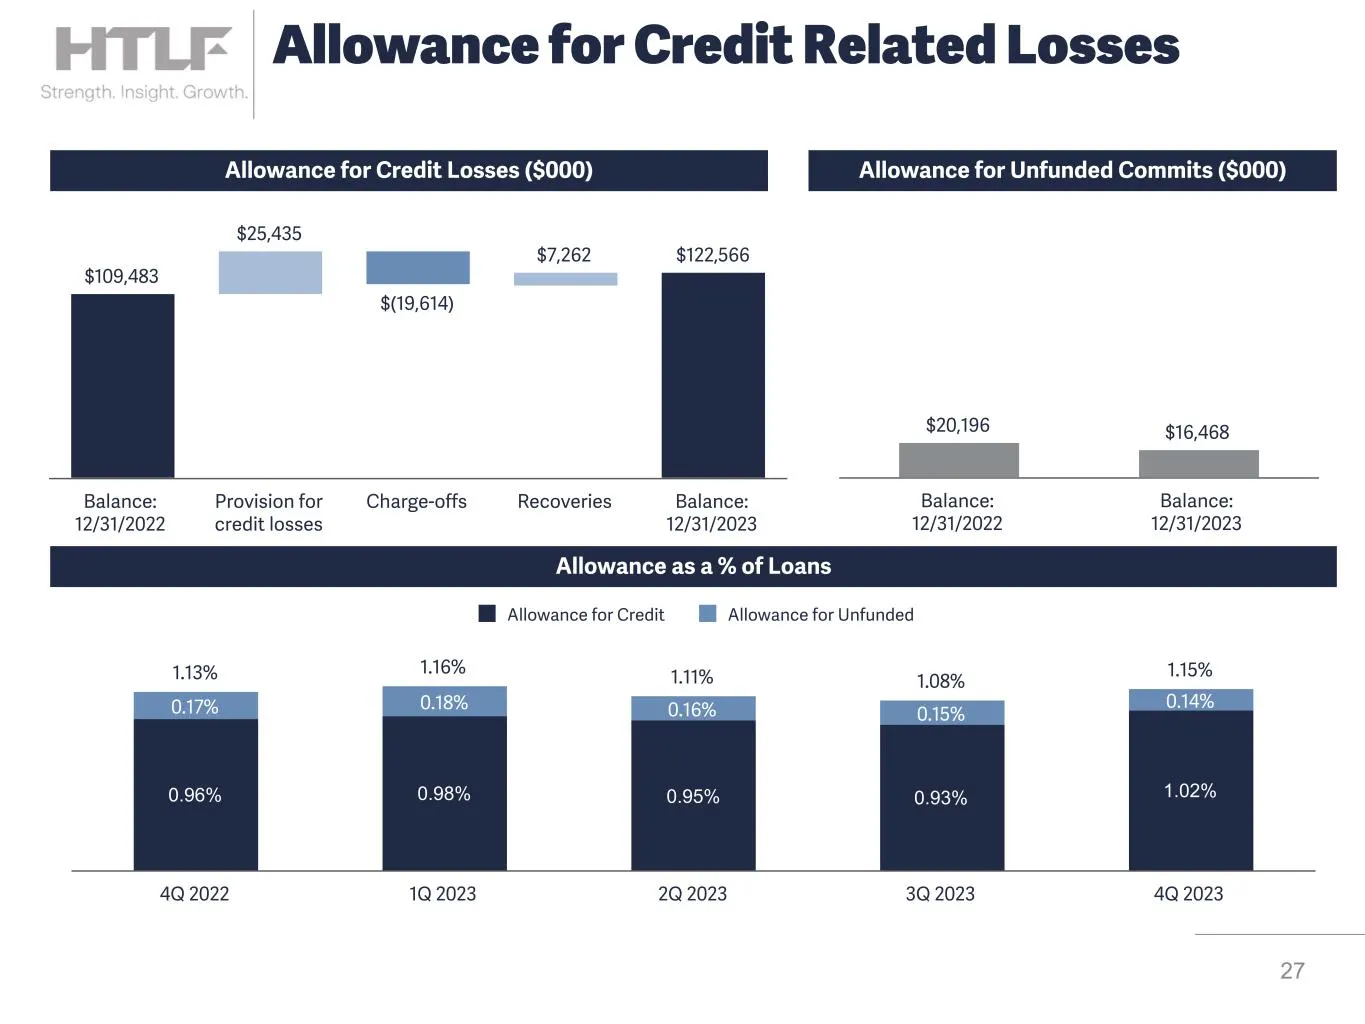
Slide 27: Allowance for Credit Related Losses
1.13% 1.16% 1.11% 1.08% 1.15% 0.96% 0.98% 0.95% 0.93% 1.02% 0.17% 0.18% 0.16% 0.15% 0.14% Allowance for Credit Allowance for Unfunded 4Q 2022 1Q 2023 2Q 2023 3Q 2023 4Q 2023 $20,196 $16,468 Balance: 12/31/2022 Balance: 12/31/2023 Allowance as a % of Loans Allowance for Credit Losses ($000) Allowance
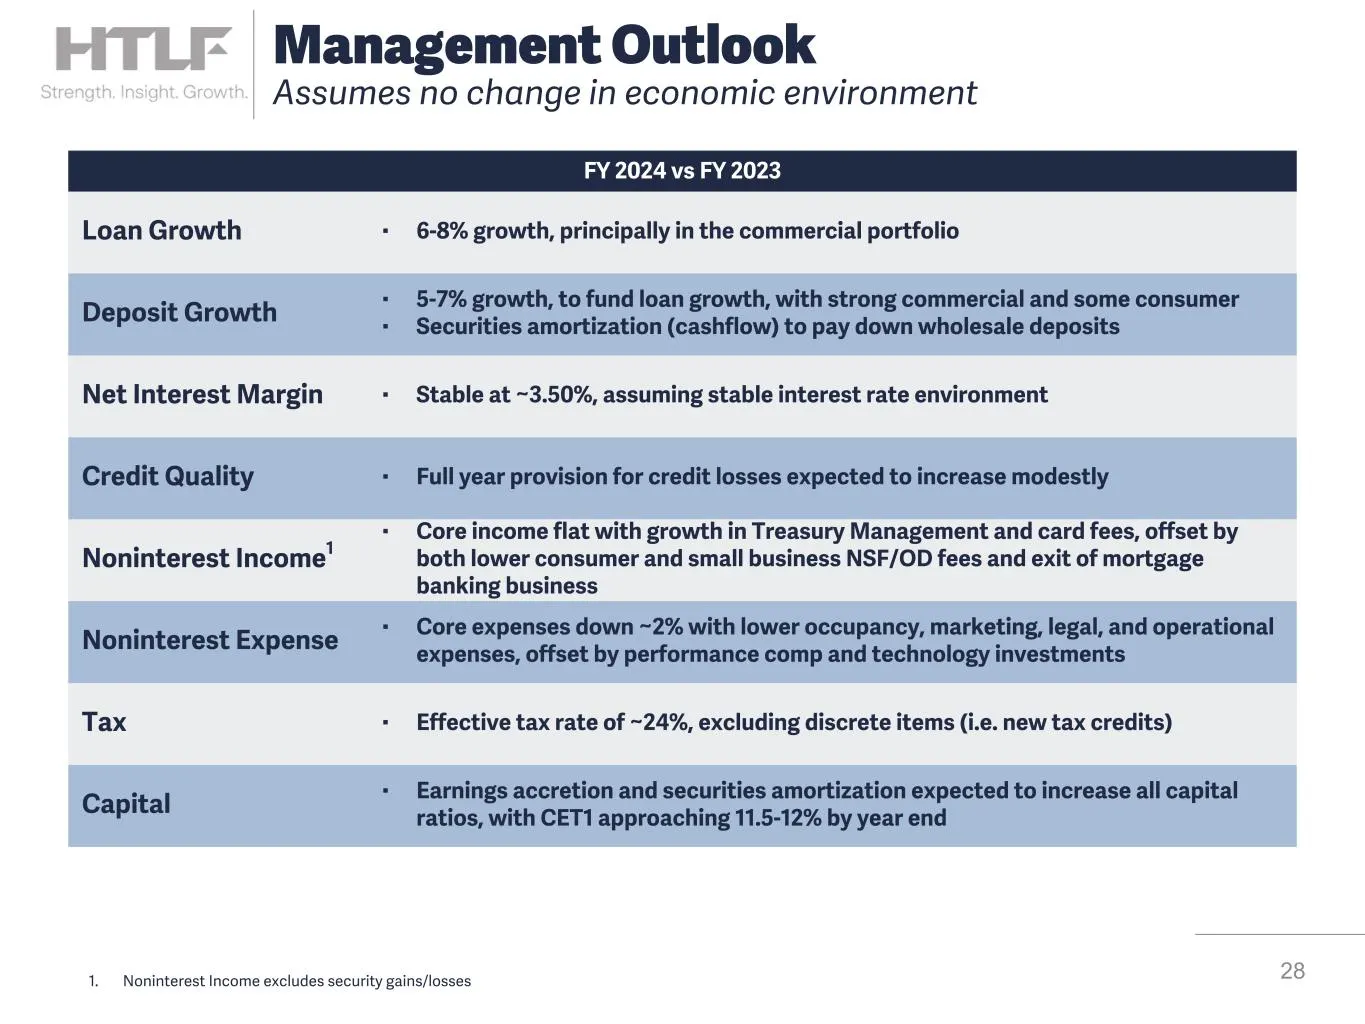
Slide 28: Management Outlook
28 Management Outlook Assumes no change in economic environment FY 2024 vs FY 2023 Loan Growth Deposit Growth ▪ 6-8% growth, principally in the commercial portfolio ▪ 5-7% growth, to fund loan growth, with strong commercial and some consumer ▪ Securities amortization (cashflow) to pay down wholesale
Slide 29: Contact Information
LITLE Contact Information FTLF HTLF 563.587.4164 [email protected] Strength. Bruce K. Lee Strength. Kevin Thompson Insight President and CEO Insight EVP, Chief Financial Officer Growth. 303.365.3850 office Growth. 303.365.3813 office [email protected] [email protected] Strength. Michael G. Flood, CFA Str

Slide 30: i Bank of
i Bank of Py Atizona Qy Bake os she Pes Barksis ILLINOIS aes aciisonotirreunx CITYWIDE BANKS, elise ee Es Rocky MINNESOTA Sota PREMIER GQ fieeeeain WISCONSIN SS eemavnrom -NEWMEXICO ire nank Bank ___ BANK & TRUST" TAC 2 amen emereTrerl scent HT Bank acleen tiie + Together We Are
Slide 31: Non-GAAP Reconciliations
31 Non-GAAP Reconciliations
Slide 32: Reconciliation of Tangible Book Value Per Common Share
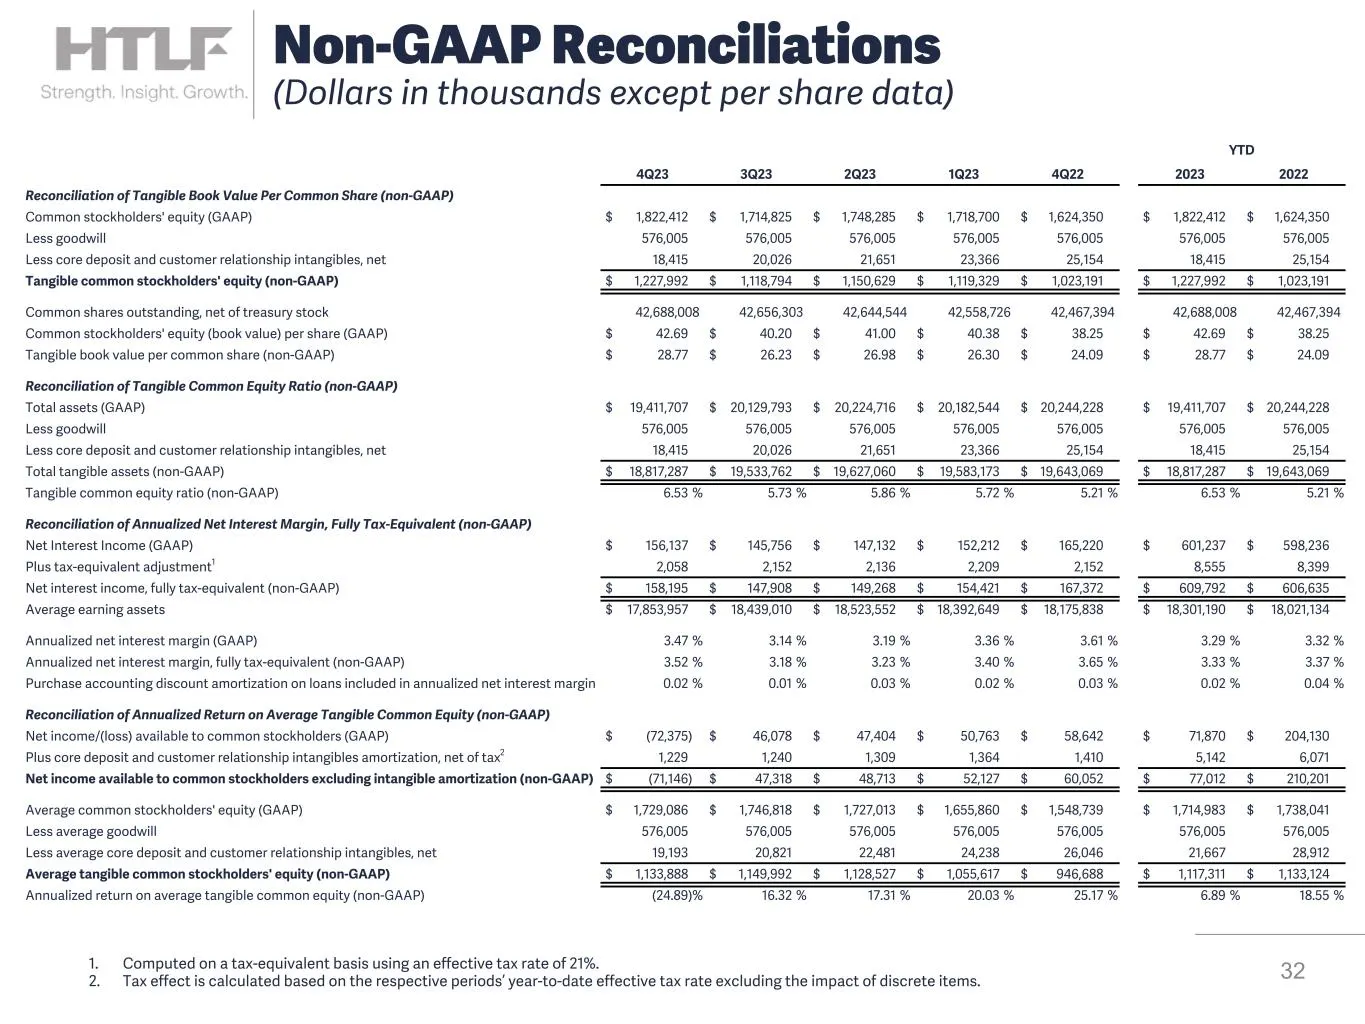
YTD 4Q23 3Q23 2Q23 1Q23 4Q22 2023 2022 Reconciliation of Tangible Book Value Per Common Share (non-GAAP) Common stockholders' equity (GAAP) $ 1,822,412 $ 1,714,825 $ 1,748,285 $ 1,718,700 $ 1,624,350 $ 1,822,412 $ 1,624,350 Less goodwill 576,005 576,005 576,005 576,005 576,005 576,005 576,005 Less c
Slide 33: Reconciliation of Non-GAAP Measure-Efficiency Ratio
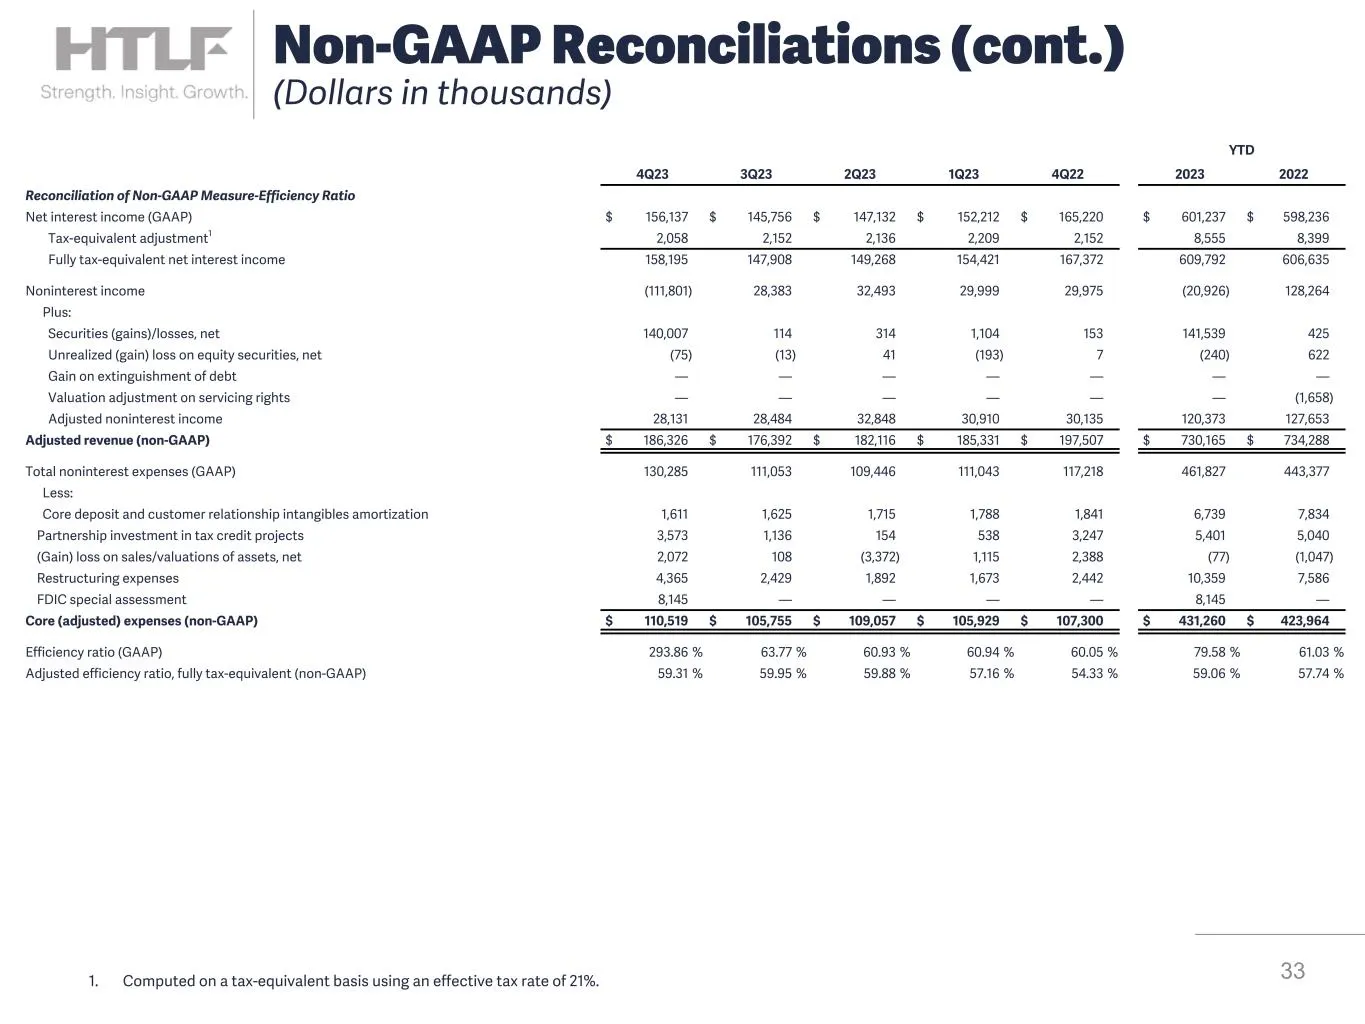
YTD 4Q23 3Q23 2Q23 1Q23 4Q22 2023 2022 Reconciliation of Non-GAAP Measure-Efficiency Ratio Net interest income (GAAP) $ 156,137 $ 145,756 $ 147,132 $ 152,212 $ 165,220 $ 601,237 $ 598,236 Tax-equivalent adjustment1 2,058 2,152 2,136 2,209 2,152 8,555 8,399 Fully tax-equivalent net interest income 15
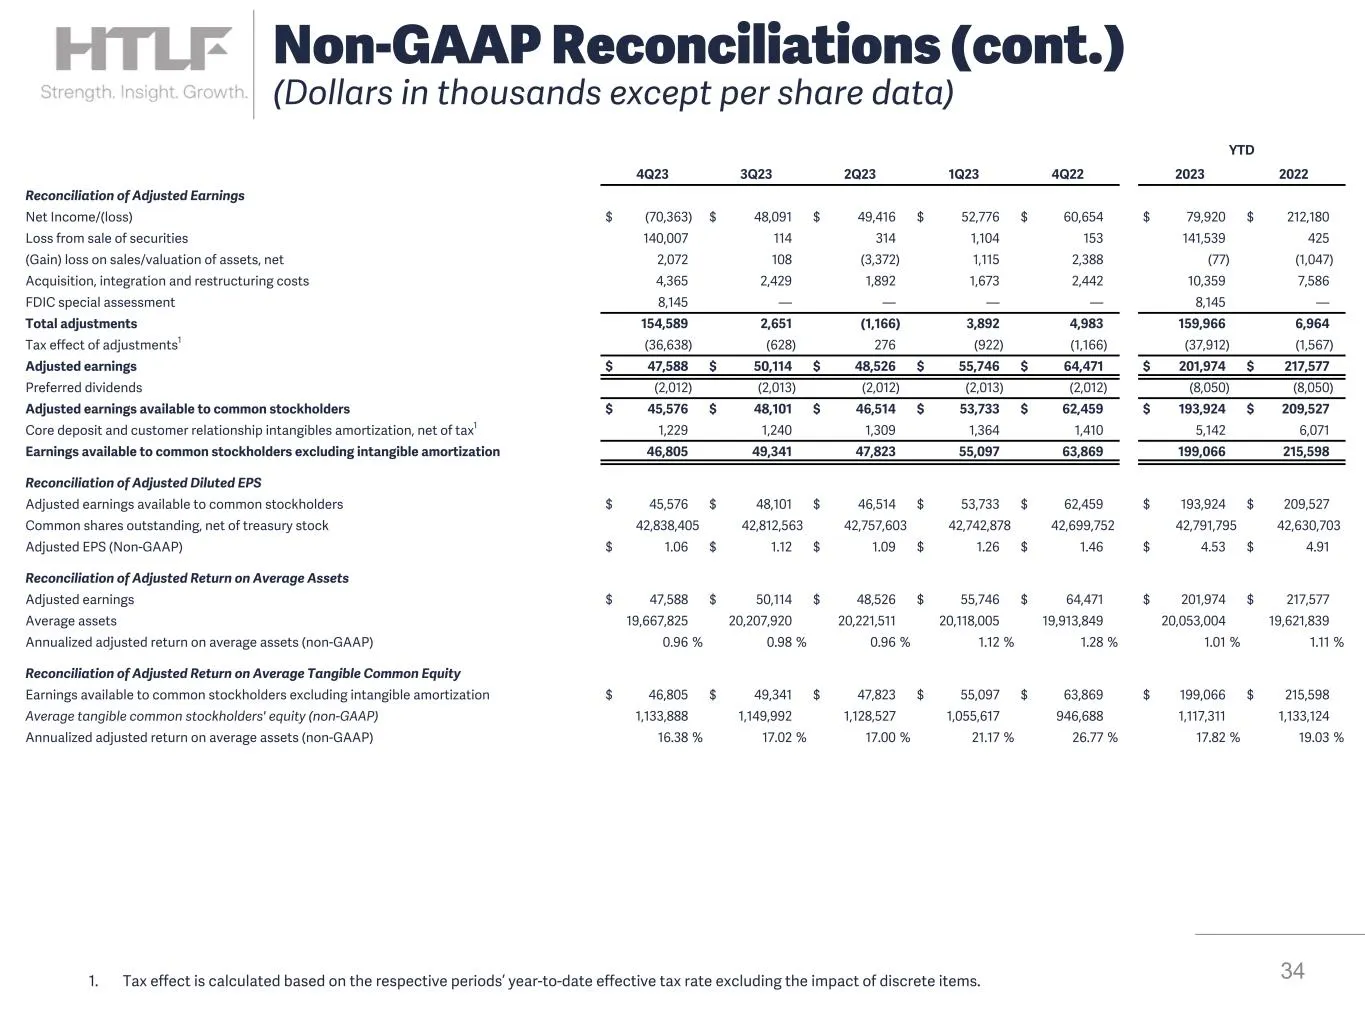
Slide 34: Reconciliation of Adjusted Earnings
YTD 4Q23 3Q23 2Q23 1Q23 4Q22 2023 2022 Reconciliation of Adjusted Earnings Net Income/(loss) $ (70,363) $ 48,091 $ 49,416 $ 52,776 $ 60,654 $ 79,920 $ 212,180 Loss from sale of securities 140,007 114 314 1,104 153 141,539 425 (Gain) loss on sales/valuation of assets, net 2,072 108 (3,372) 1,115 2,38

Slide 35: i Bank of
i Bank of Py Atizona Qy Bake os she Pes Barksis ILLINOIS aes aciisonotirreunx CITYWIDE BANKS, elise ee Es Rocky MINNESOTA Sota PREMIER GQ fieeeeain WISCONSIN SS eemavnrom -NEWMEXICO ire nank Bank ___ BANK & TRUST" TAC 2 amen emereTrerl scent HT Bank acleen tiie + Together We Are
Source: SEC EDGAR · 8-K filed Jan 29, 2024
More decks from Heartland Financial USA Inc
 Merger or Acquisition (July 2024)6 slides · Jul 31, 2024
 Merger or Acquisition (May 2024)6 slides · May 2, 2024
 Merger or Acquisition (May 2024)27 slides · May 2, 2024
 Q4 2023 Earnings Presentation54 slides · Feb 13, 2024
 Q3 2023 Earnings Presentation55 slides · Nov 15, 2023
 Q3 2023 Earnings Presentation35 slides · Oct 30, 2023