Heartland Financial USA — Q3 2023 Earnings Presentation
35 slides from Heartland Financial USA's earnings presentation, Oct 30, 2023

Slide 1: 3rd Quarter 2023 Financial Data
3rd Quarter 2023 Financial Data
Slide 2: Safe Harbor
2 Safe Harbor Within the charts and tables presented, certain segments, columns and rows may not sum to totals shown due to rounding. This investor presentation (including any information incorporated herein by reference) and future oral and written statements of HTLF and its management, may contain
Slide 3: Table of Contents
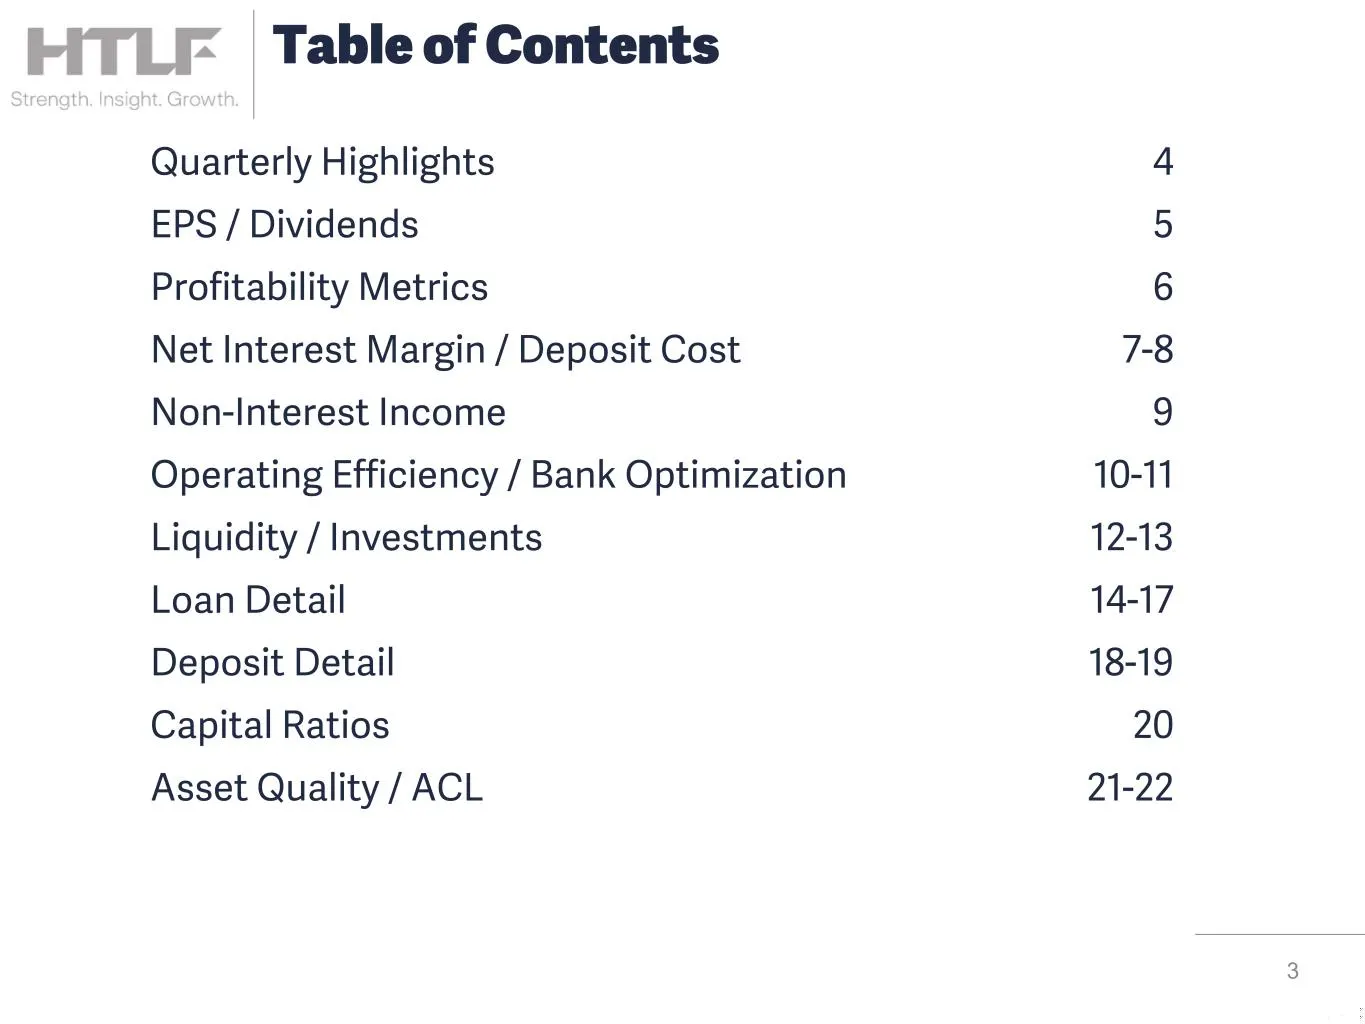
3 Table of Contents Quarterly Highlights 4 EPS / Dividends 5 Profitability Metrics 6 Net Interest Margin / Deposit Cost 7-8 Non-Interest Income 9 Operating Efficiency / Bank Optimization 10-11 Liquidity / Investments 12-13 Loan Detail 14-17 Deposit Detail 18-19 Capital Ratios 20 Asset Quality / ACL
Slide 4: 3Q 2023 Highlights
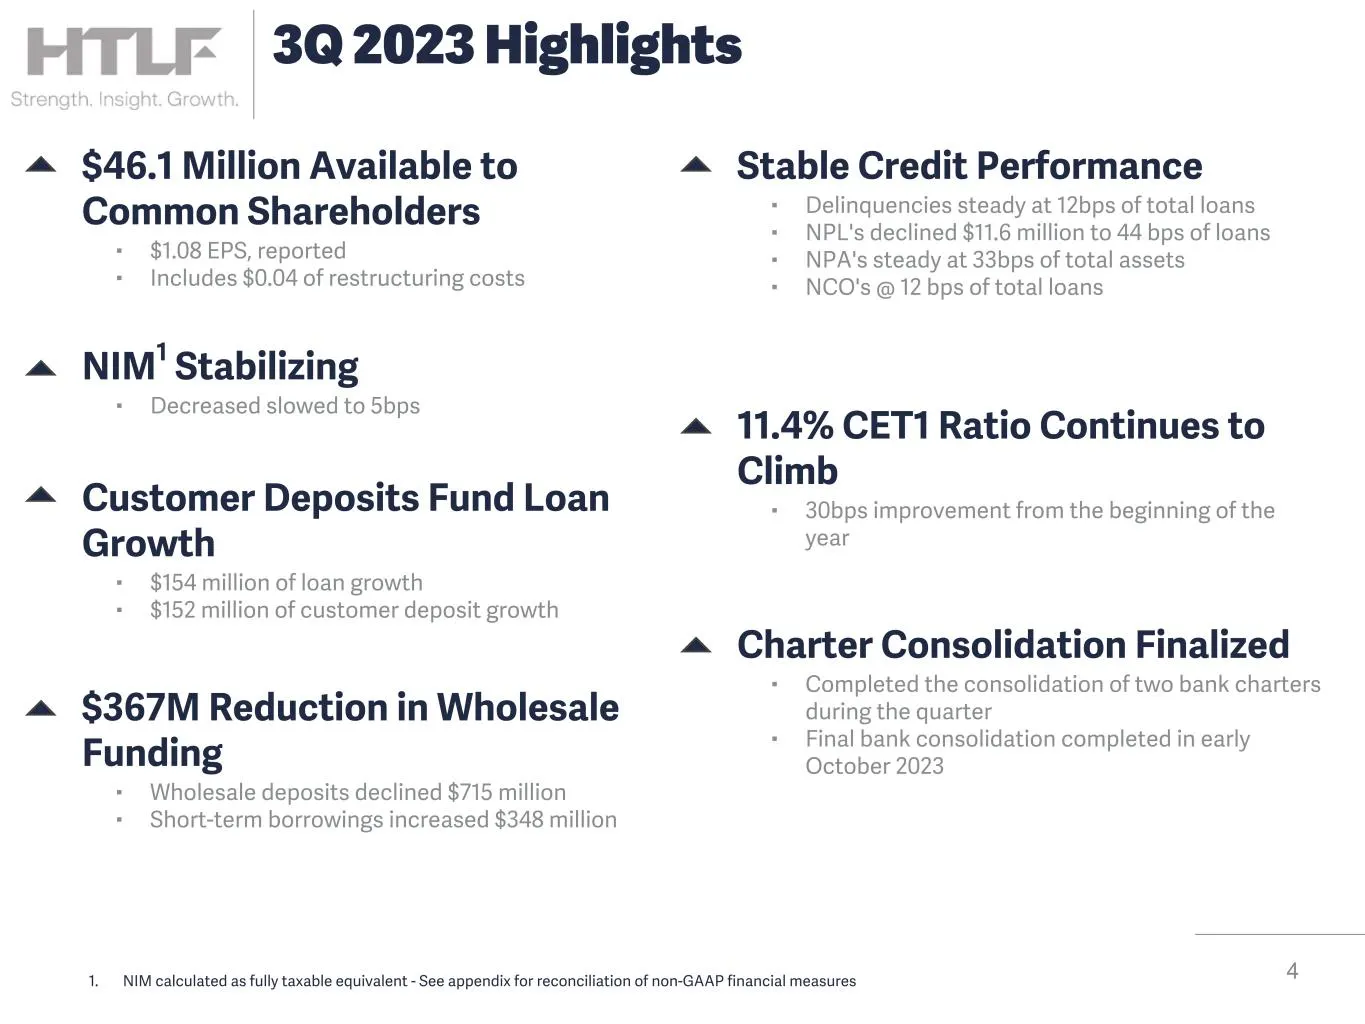
4 3Q 2023 Highlights 11.4% CET1 Ratio Continues to Climb ▪ 30bps improvement from the beginning of the year $46.1 Million Available to Common Shareholders ▪ $1.08 EPS, reported ▪ Includes $0.04 of restructuring costs Customer Deposits Fund Loan Growth ▪ $154 million of loan growth ▪ $152 million of
Slide 5: Diluted EPS and Common Dividends
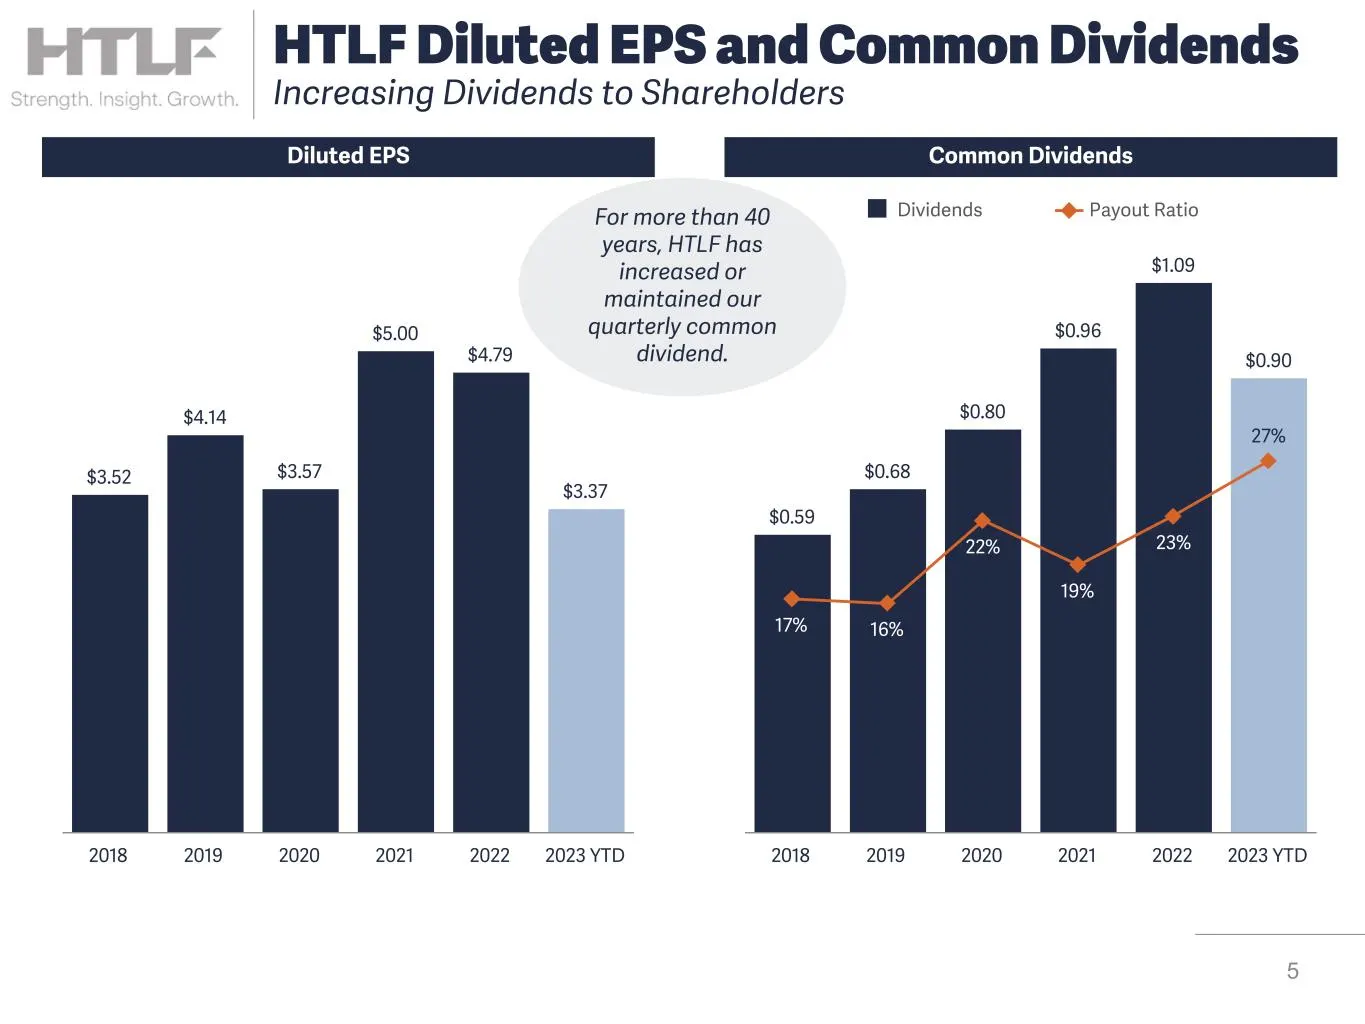
$0.59 $0.68 $0.80 $0.96 $1.09 $0.90 17% 16% 22% 19% 23% 27% Dividends Payout Ratio 2018 2019 2020 2021 2022 2023 YTD $3.52 $4.14 $3.57 $5.00 $4.79 $3.37 2018 2019 2020 2021 2022 2023 YTD 5 HTLF Diluted EPS and Common Dividends Increasing Dividends to Shareholders Diluted EPS Common Dividends For mor
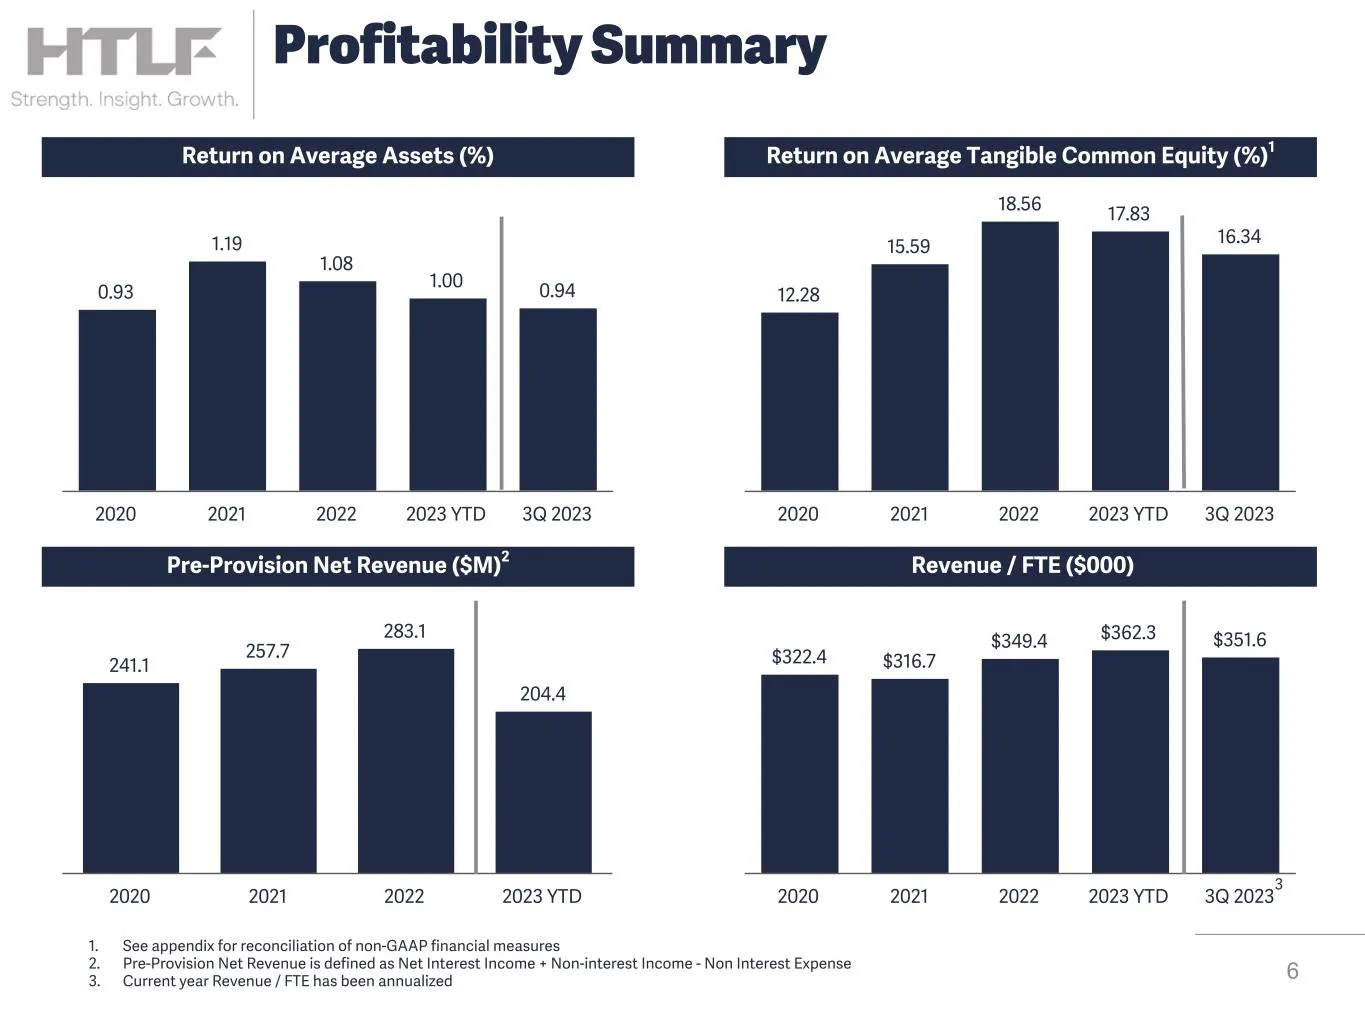
Slide 6: Profitability Summary
Return on Average Assets (%) Return on Average Tangible Common Equity (%)1 Pre-Provision Net Revenue ($M)2 Revenue / FTE ($000) 0.93 1.19 1.08 1.00 0.94 2020 2021 2022 2023 YTD 3Q 2023 $322.4 $316.7 $349.4 $362.3 $351.6 2020 2021 2022 2023 YTD 3Q 2023 241.1 257.7 283.1 204.4 2020 2021 2022 2023 YTD
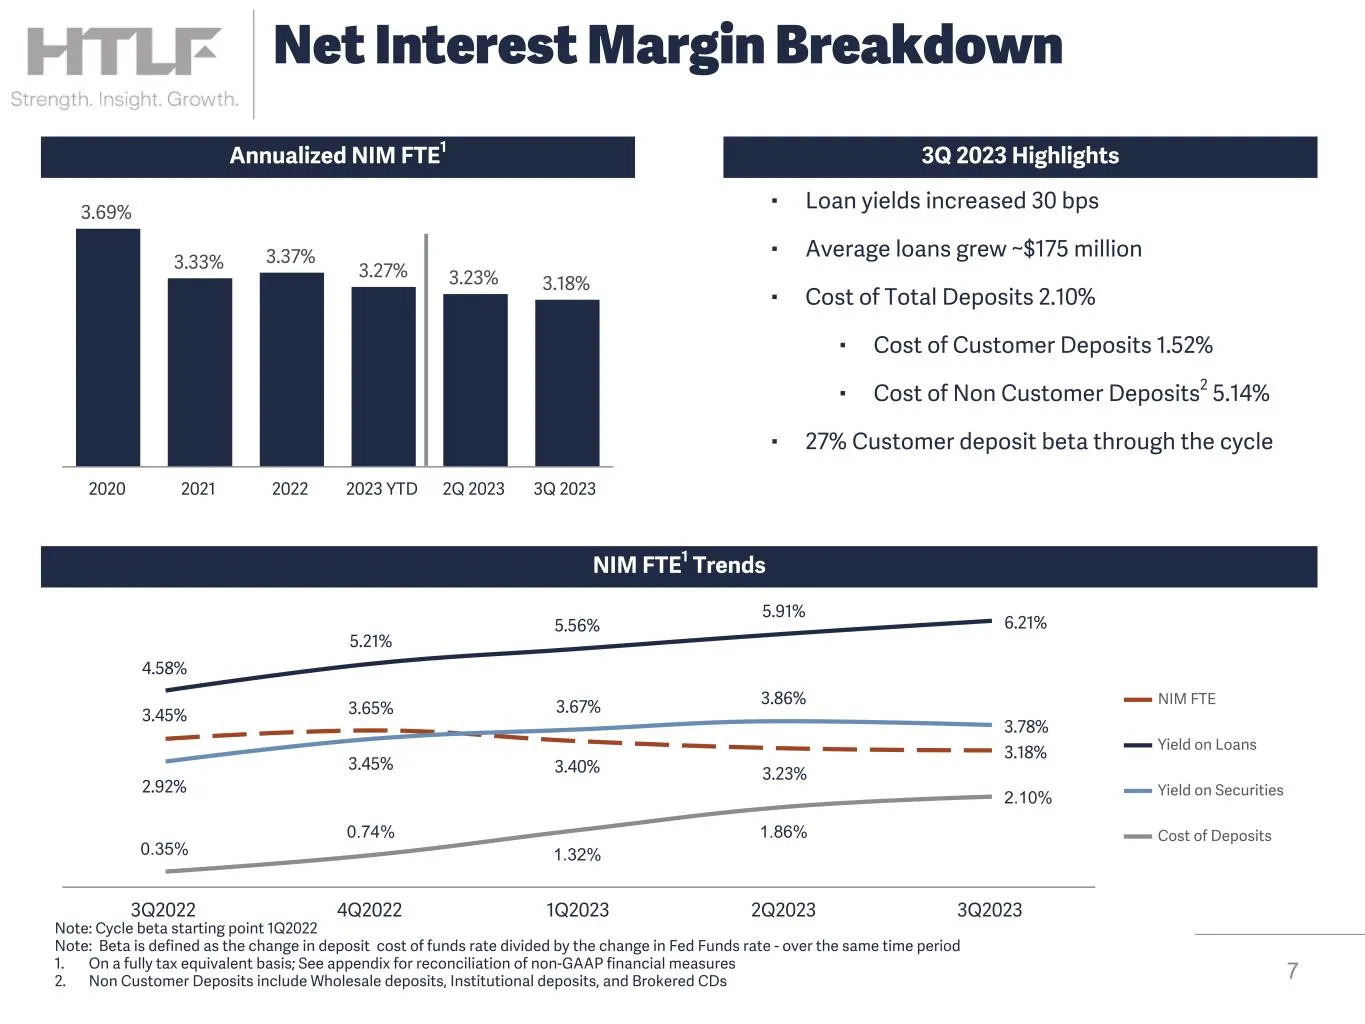
Slide 7: Net Interest Margin Breakdown
3.69% 3.33% 3.37% 3.27% 3.23% 3.18% 2020 2021 2022 2023 YTD 2Q 2023 3Q 2023 7 Net Interest Margin Breakdown NIM FTE1 Trends Annualized NIM FTE1 3.45% 3.65% 3.40% 3.23% 3.18% 4.58% 5.21% 5.56% 5.91% 6.21% 2.92% 3.45% 3.67% 3.86% 3.78% 0.35% 0.74% 1.32% 1.86% 2.10% NIM FTE Yield on Loans Yield on Secu
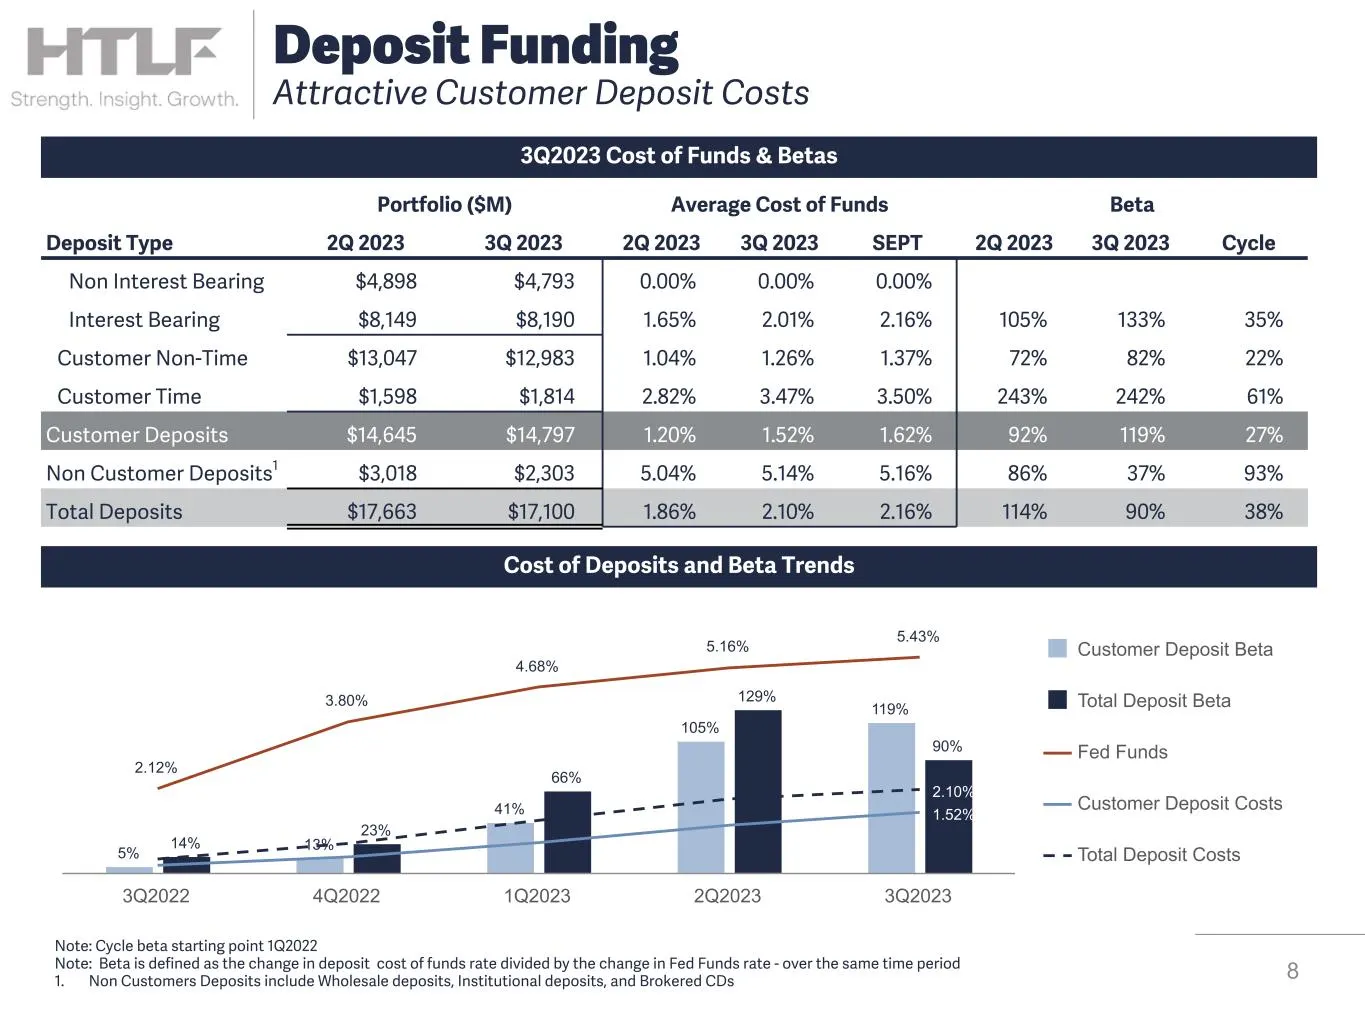
Slide 8: 3Q2023 Cost of Funds & Betas
3Q2023 Cost of Funds & Betas 8 Deposit Funding Attractive Customer Deposit Costs Portfolio ($M) Average Cost of Funds Beta Deposit Type 2Q 2023 3Q 2023 2Q 2023 3Q 2023 SEPT 2Q 2023 3Q 2023 Cycle Non Interest Bearing $4,898 $4,793 0.00 % 0.00 % 0.00 % Interest Bearing $8,149 $8,190 1.65 % 2.01 % 2.16
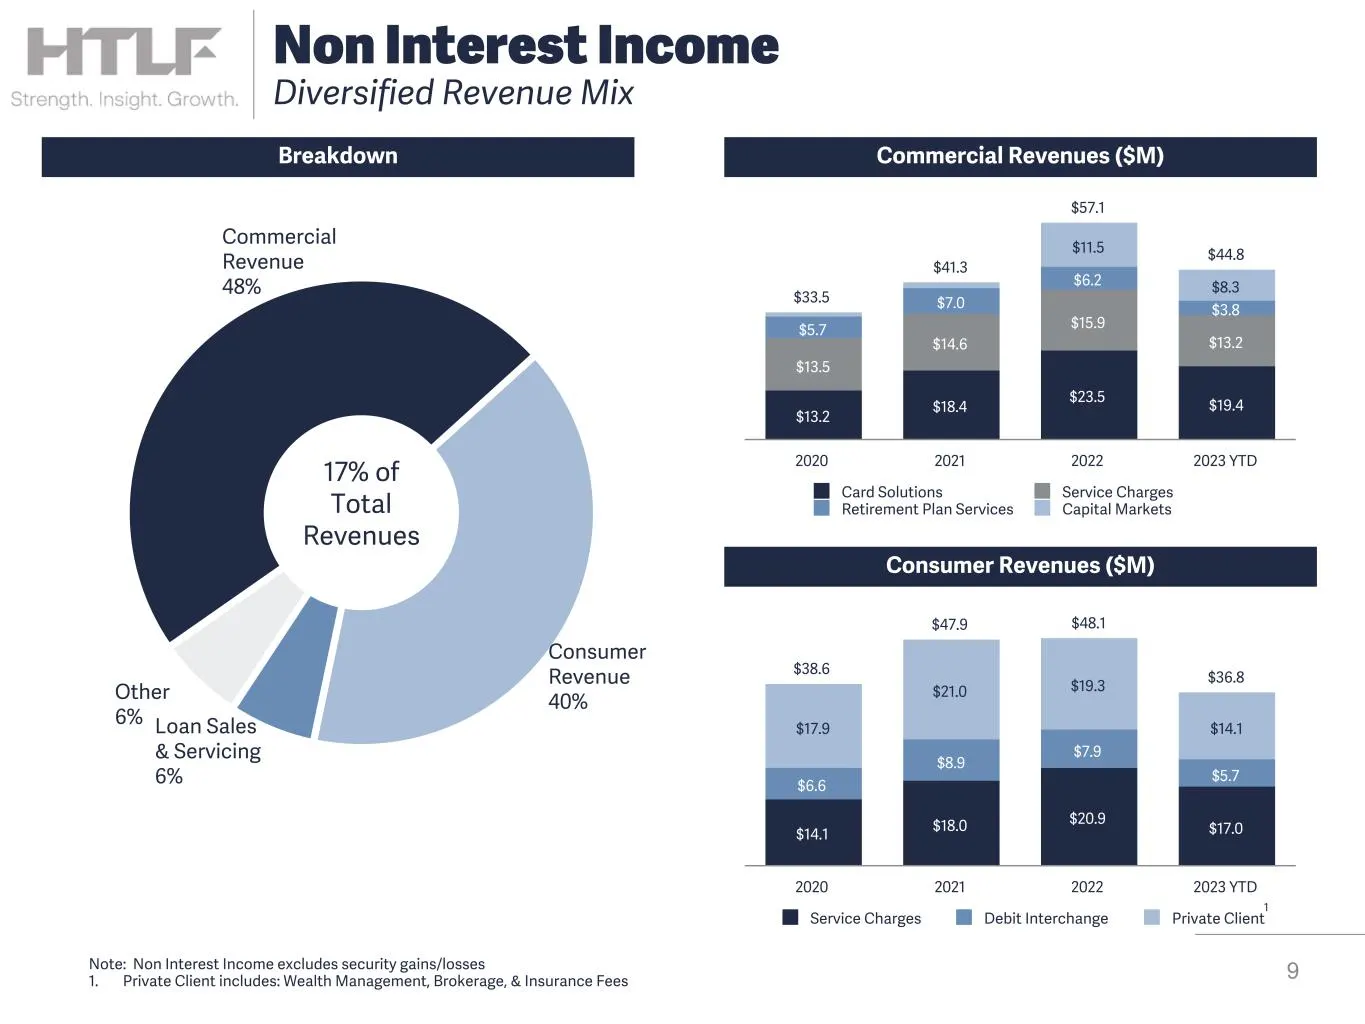
Slide 9: Non Interest Income
Commercial Revenue 48% Consumer Revenue 40% Loan Sales & Servicing 6% Other 6% 9 Non Interest Income Diversified Revenue Mix $33.5 $41.3 $57.1 $44.8 $13.2 $18.4 $23.5 $19.4 $13.5 $14.6 $15.9 $13.2 $5.7 $7.0 $6.2 $3.8 $11.5 $8.3 Card Solutions Service Charges Retirement Plan Services Capital Markets
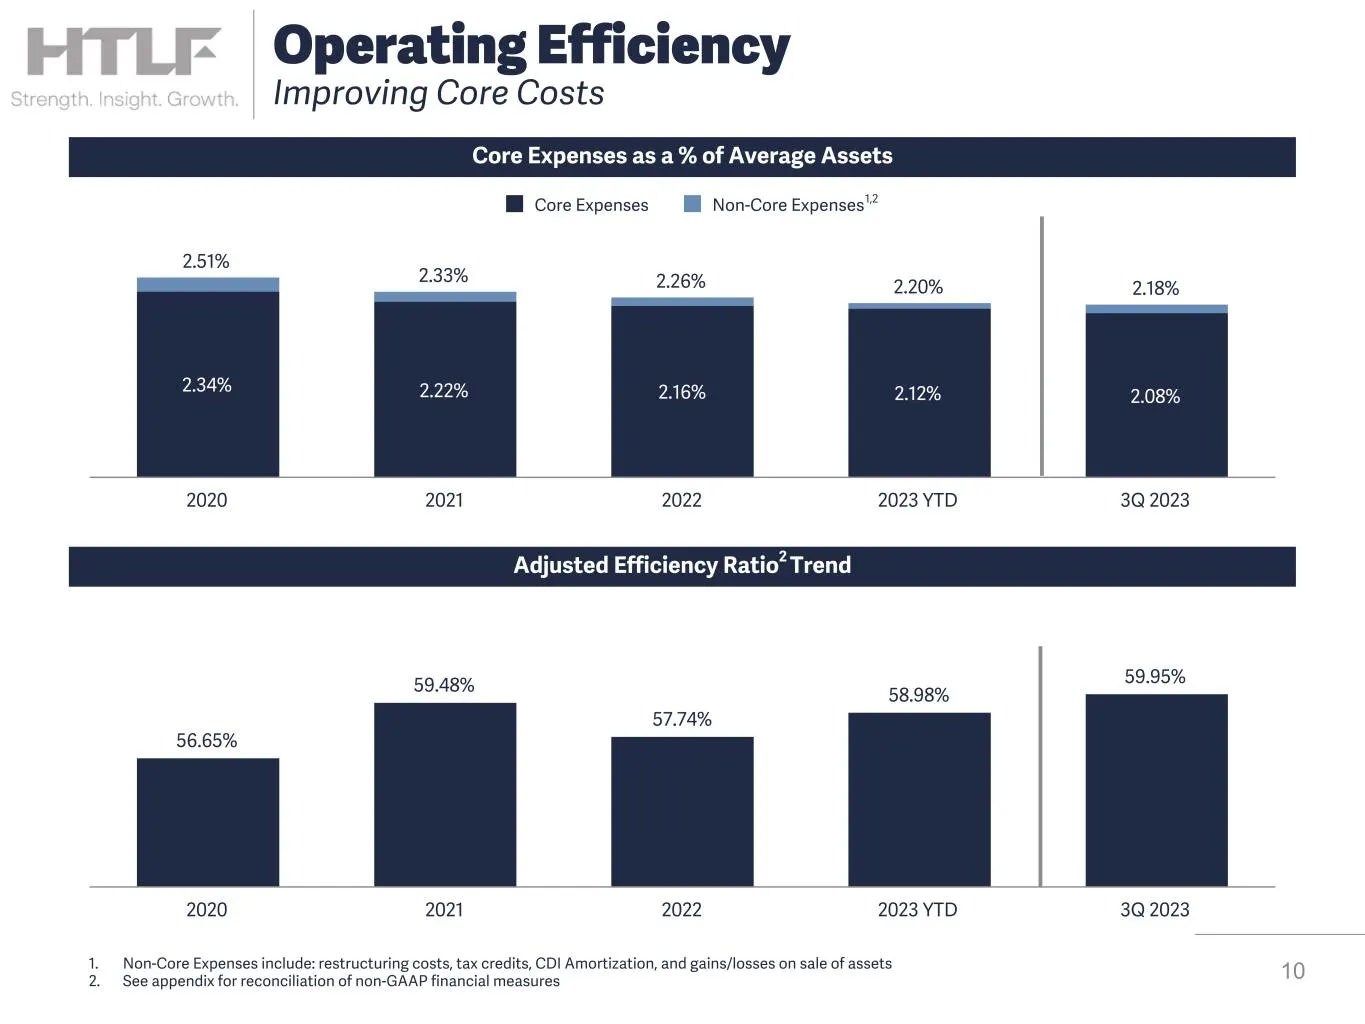
Slide 10: Operating Efficiency Improving Core Costs
2.51% 2.33% 2.26% 2.20% 2.18% 2.34% 2.22% 2.16% 2.12% 2.08% Core Expenses Non-Core Expenses 2020 2021 2022 2023 YTD 3Q 2023 56.65% 59.48% 57.74% 58.98% 59.95% 2020 2021 2022 2023 YTD 3Q 2023 1. Non-Core Expenses include: restructuring costs, tax credits, CDI Amortization, and gains/losses on sale of
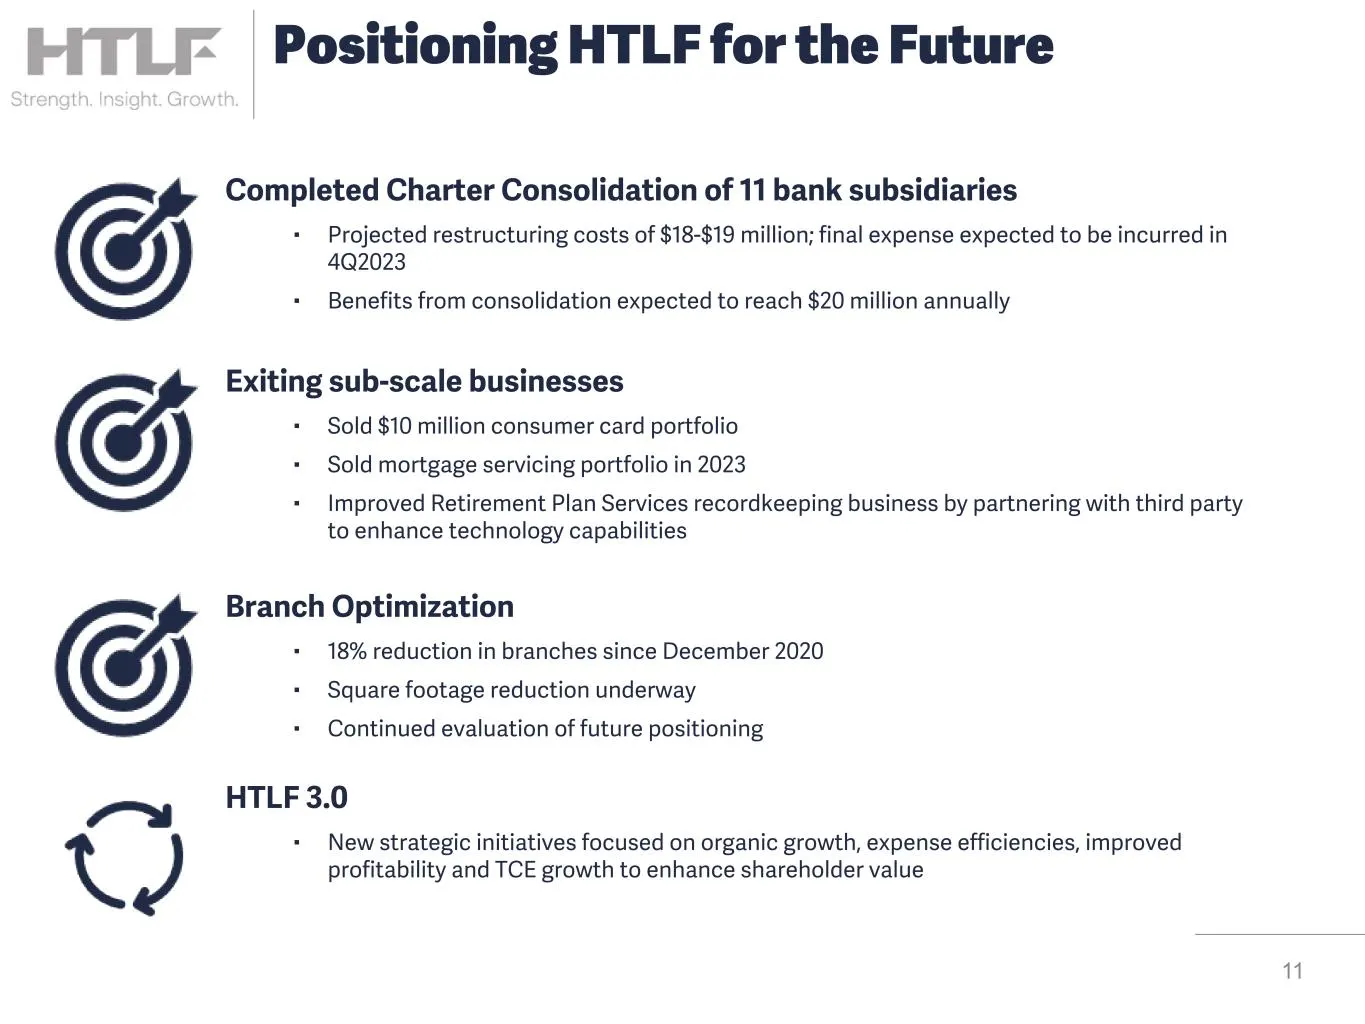
Slide 11: Positioning HTLF for the Future
11 Positioning HTLF for the Future Completed Charter Consolidation of 11 bank subsidiaries ▪ Projected restructuring costs of $18-$19 million; final expense expected to be incurred in 4Q2023 ▪ Benefits from consolidation expected to reach $20 million annually Exiting sub-scale businesses ▪ Sold $10
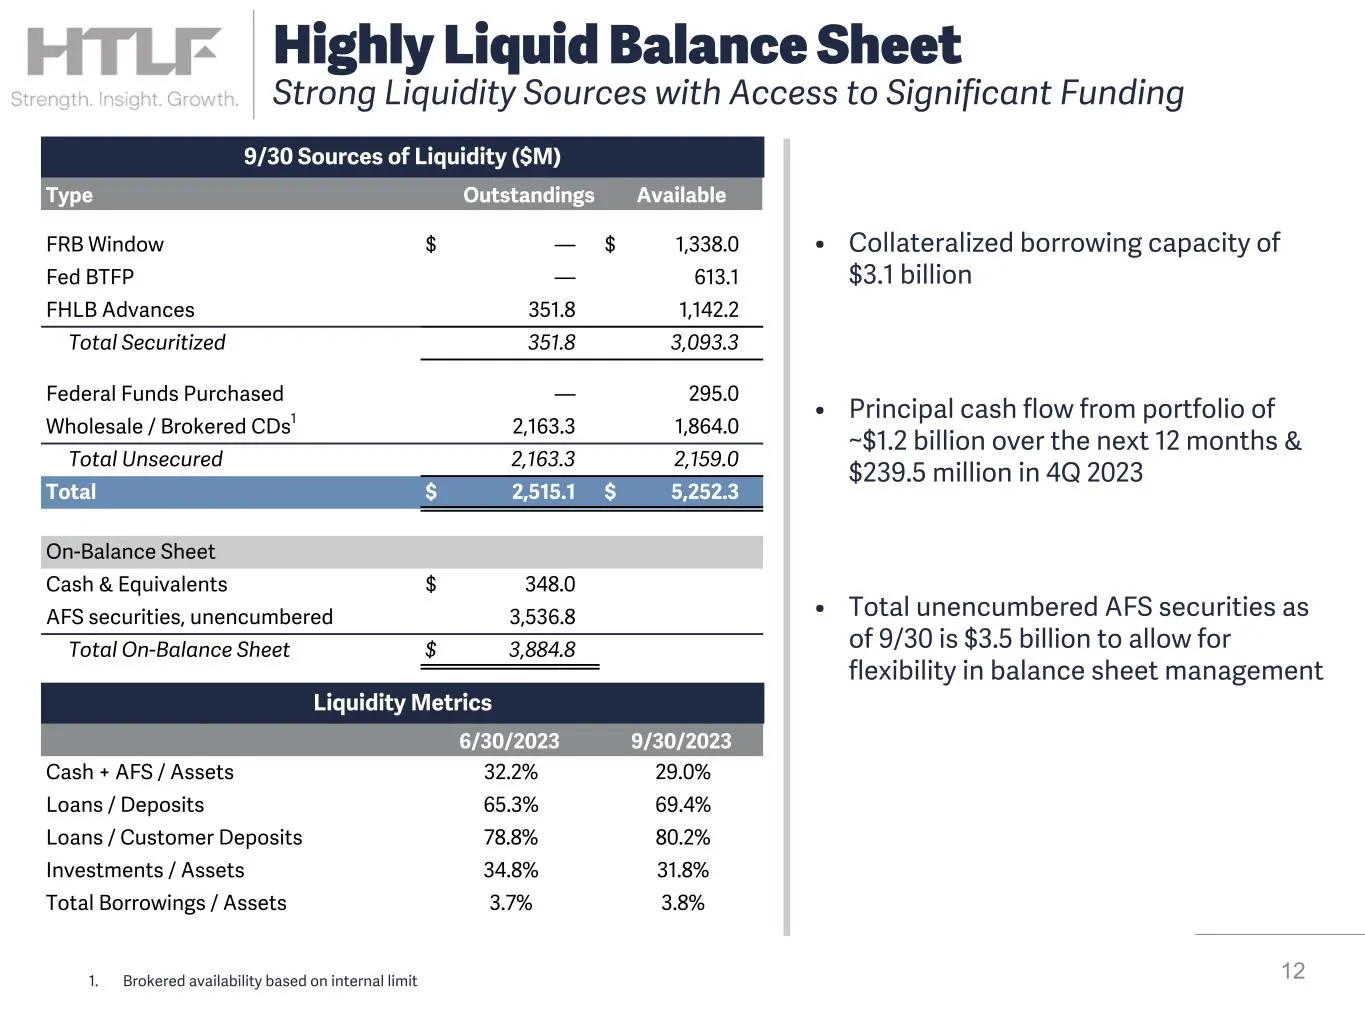
Slide 12: Highly Liquid Balance Sheet
• Collateralized borrowing capacity of $3.1 billion • Principal cash flow from portfolio of ~$1.2 billion over the next 12 months & $239.5 million in 4Q 2023 • Total unencumbered AFS securities as of 9/30 is $3.5 billion to allow for flexibility in balance sheet management 12 9/30 Sources of Liquidi
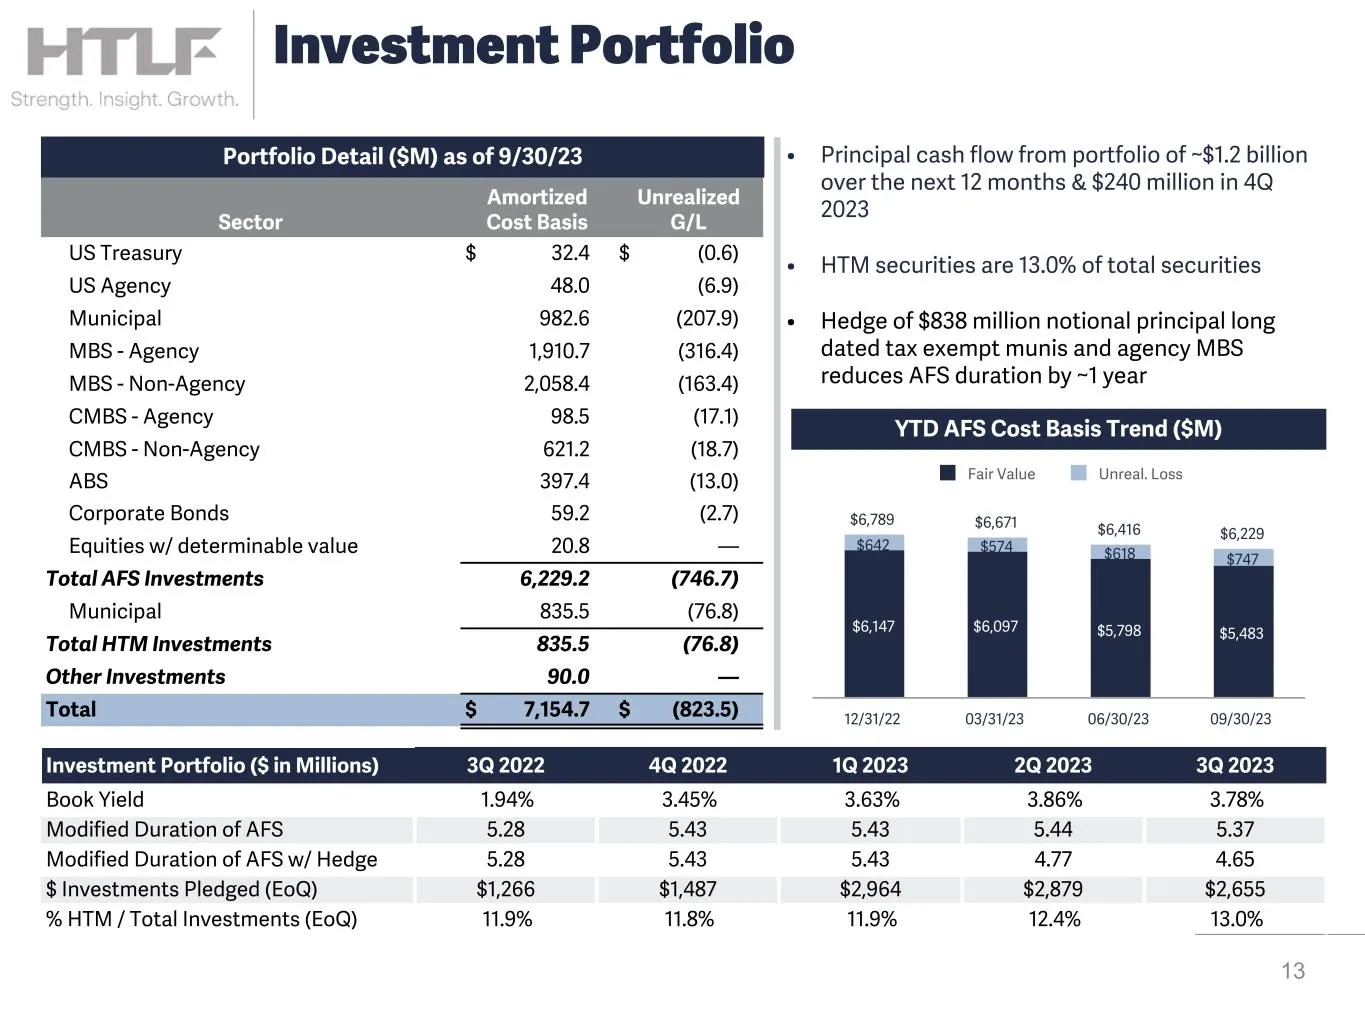
Slide 13: Investment Portfolio
Sector Amortized Cost Basis Unrealized G/L US Treasury $ 32.4 $ (0.6) US Agency 48.0 (6.9) Municipal 982.6 (207.9) MBS - Agency 1,910.7 (316.4) MBS - Non-Agency 2,058.4 (163.4) CMBS - Agency 98.5 (17.1) CMBS - Non-Agency 621.2 (18.7) ABS 397.4 (13.0) Corporate Bonds 59.2 (2.7) Equities w/ determinab
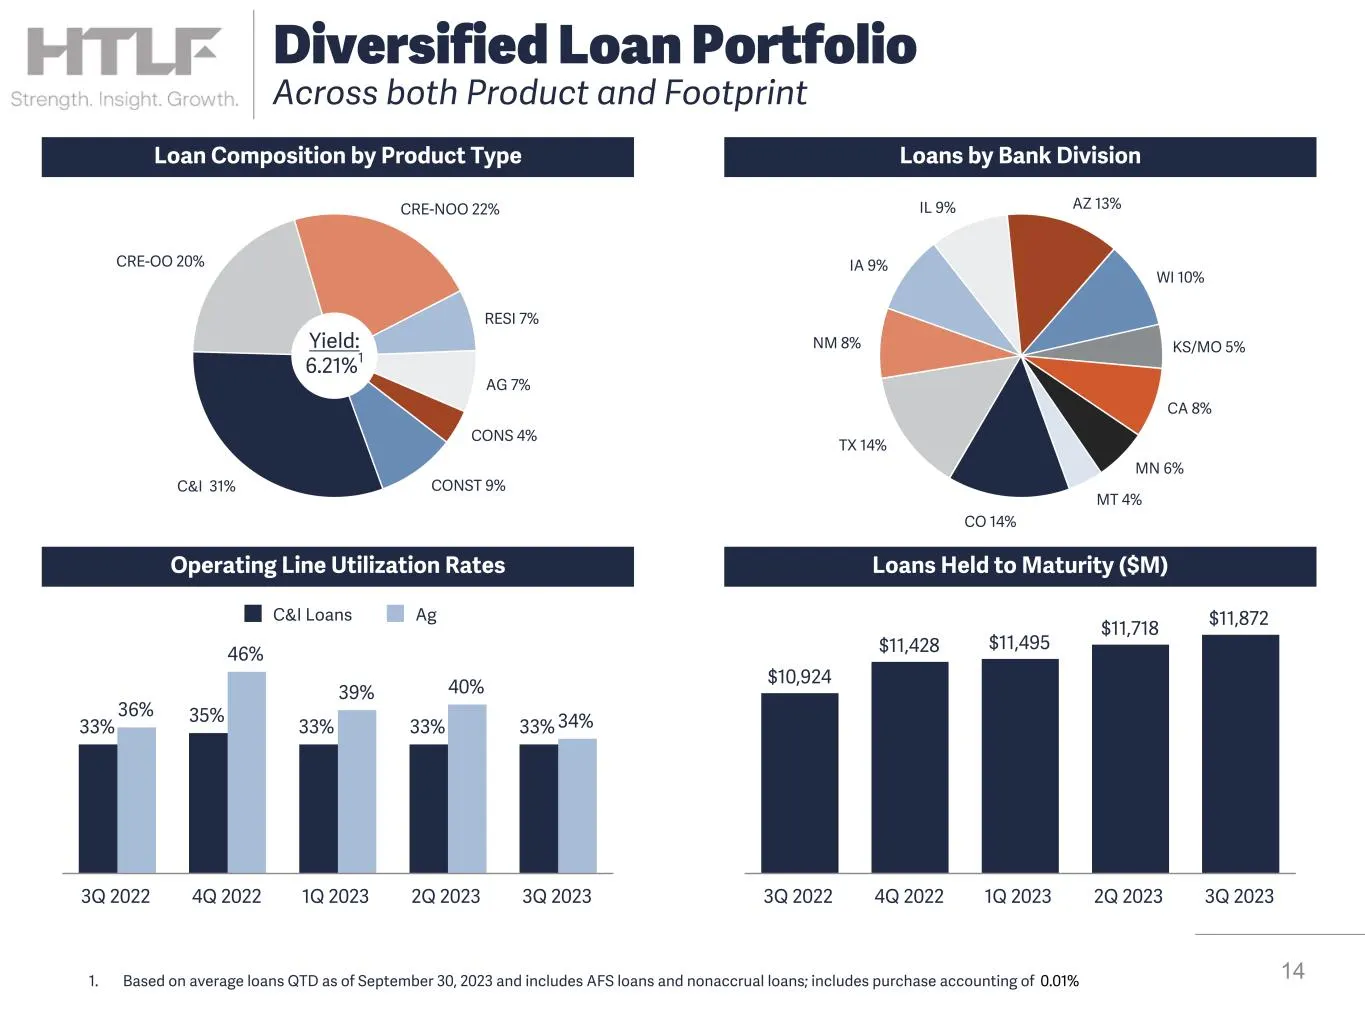
Slide 14: Diversified Loan Portfolio Across Product and Footprint
Loan Composition by Product Type Loans by Bank Division Loans Held to Maturity ($M)Operating Line Utilization Rates C&I 31% CRE-OO 20% CRE-NOO 22% RESI 7% AG 7% CONS 4% CONST 9% Yield: 6.21%1 CO 14% TX 14% NM 8% IA 9% IL 9% AZ 13% WI 10% KS/MO 5% CA 8% MN 6% MT 4% 33% 35% 33% 33% 33% 36% 46% 39% 40%
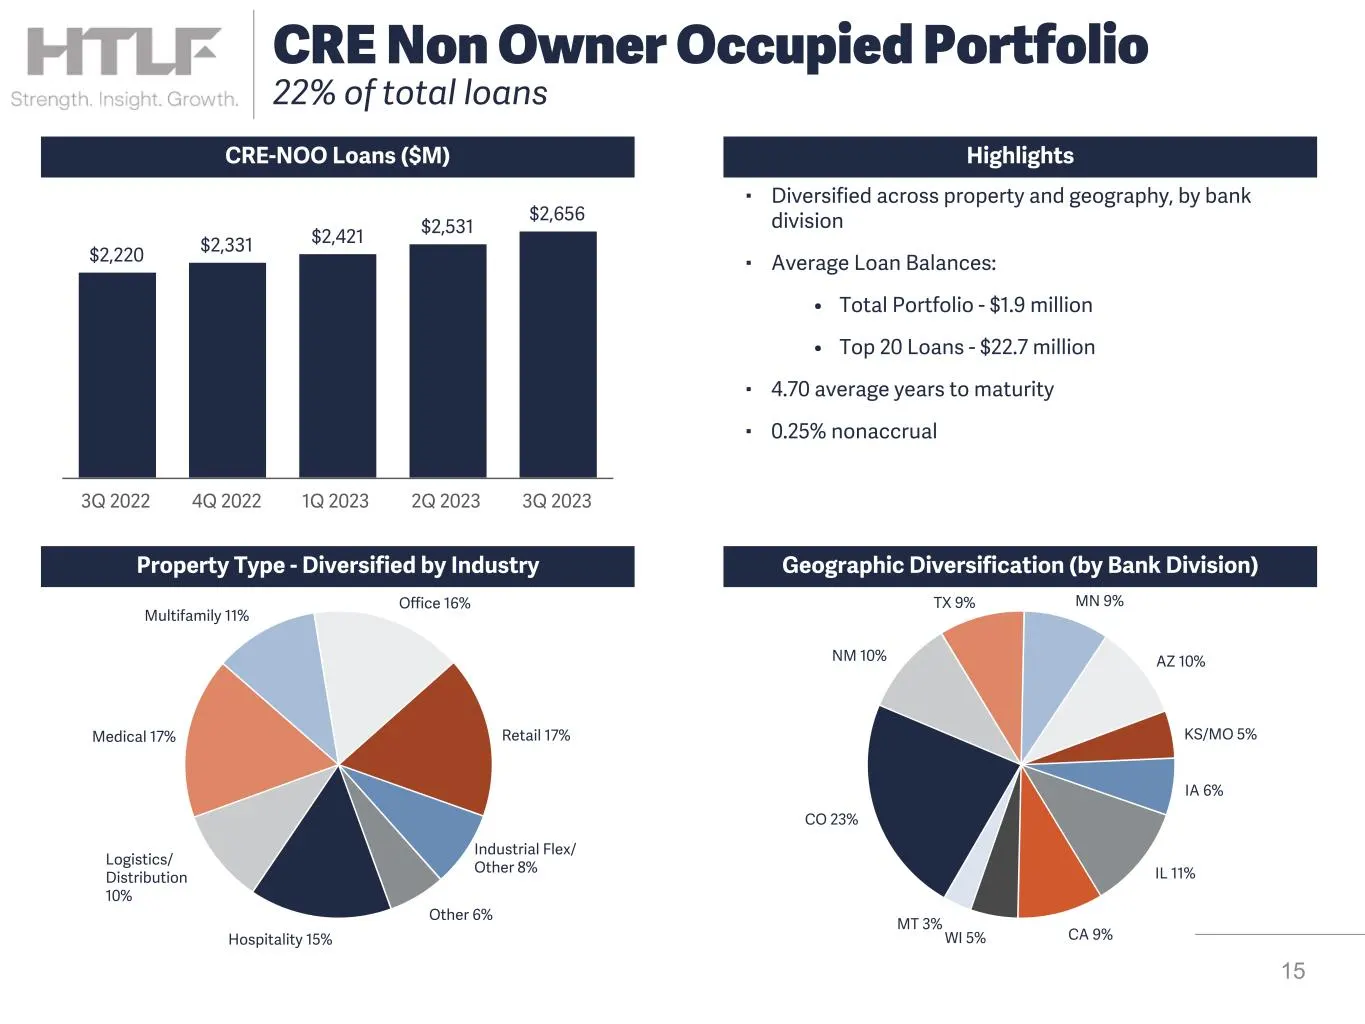
Slide 15: CRE Non Owner Occupied Portfolio
Highlights Hospitality 15% Logistics/ Distribution 10% Medical 17% Multifamily 11% Office 16% Retail 17% Industrial Flex/ Other 8% Other 6% CO 23% NM 10% TX 9% MN 9% AZ 10% KS/MO 5% IA 6% IL 11% CA 9%WI 5% MT 3% ▪ Diversified across property and geography, by bank division ▪ Average Loan Balances: •
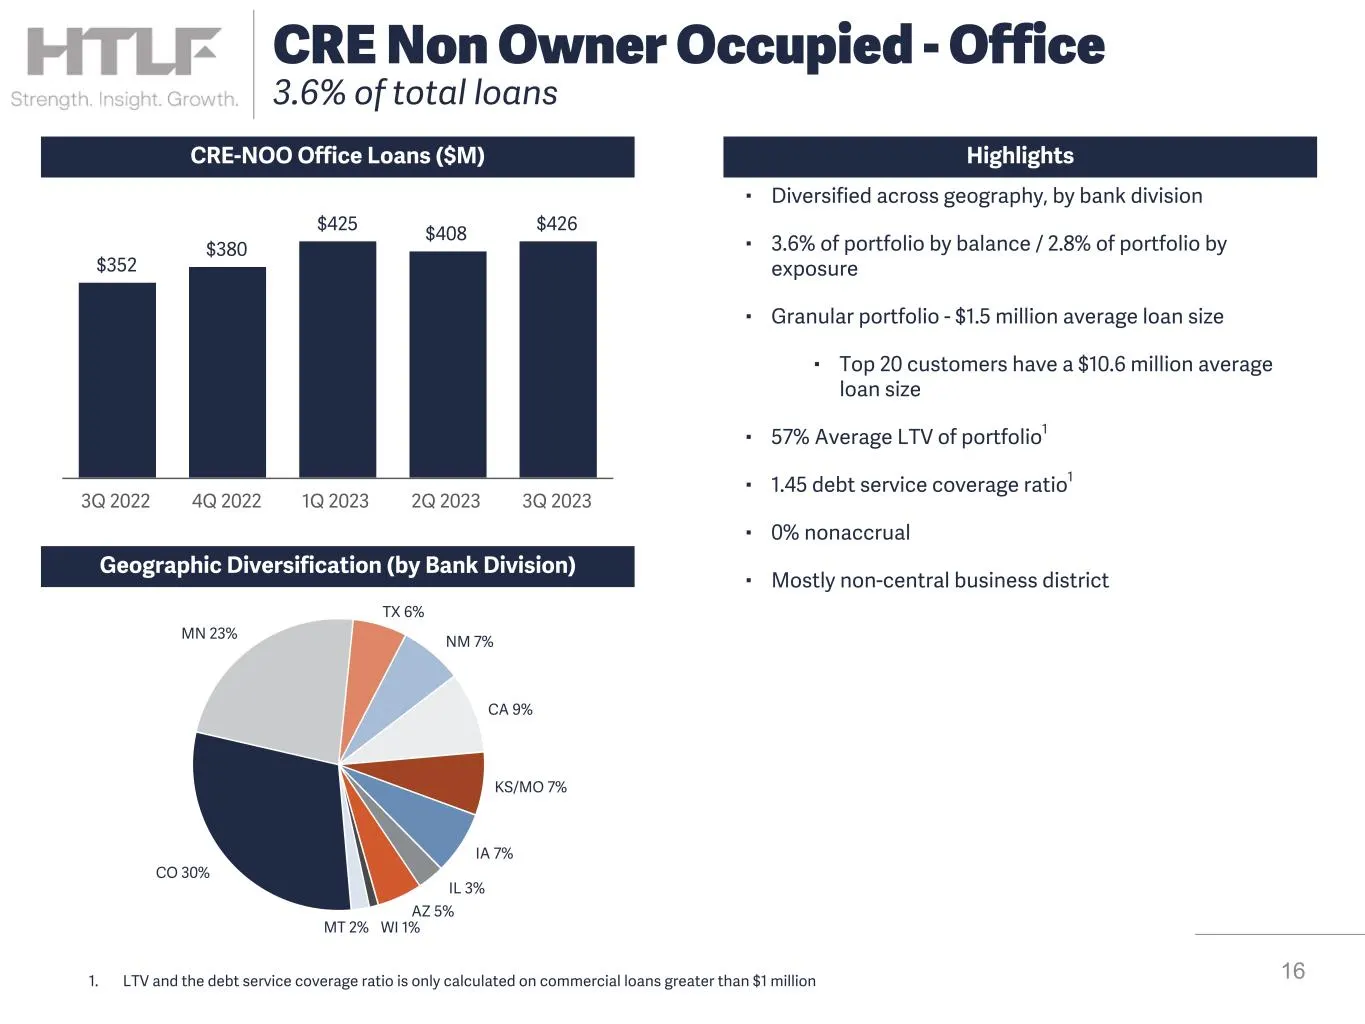
Slide 16: CRE Non Owner Occupied - Office
CRE-NOO Office Loans ($M) Geographic Diversification (by Bank Division) $352 $380 $425 $408 $426 3Q 2022 4Q 2022 1Q 2023 2Q 2023 3Q 2023 16 CRE Non Owner Occupied - Office 3.6% of total loans Highlights 1. LTV and the debt service coverage ratio is only calculated on commercial loans greater than $1
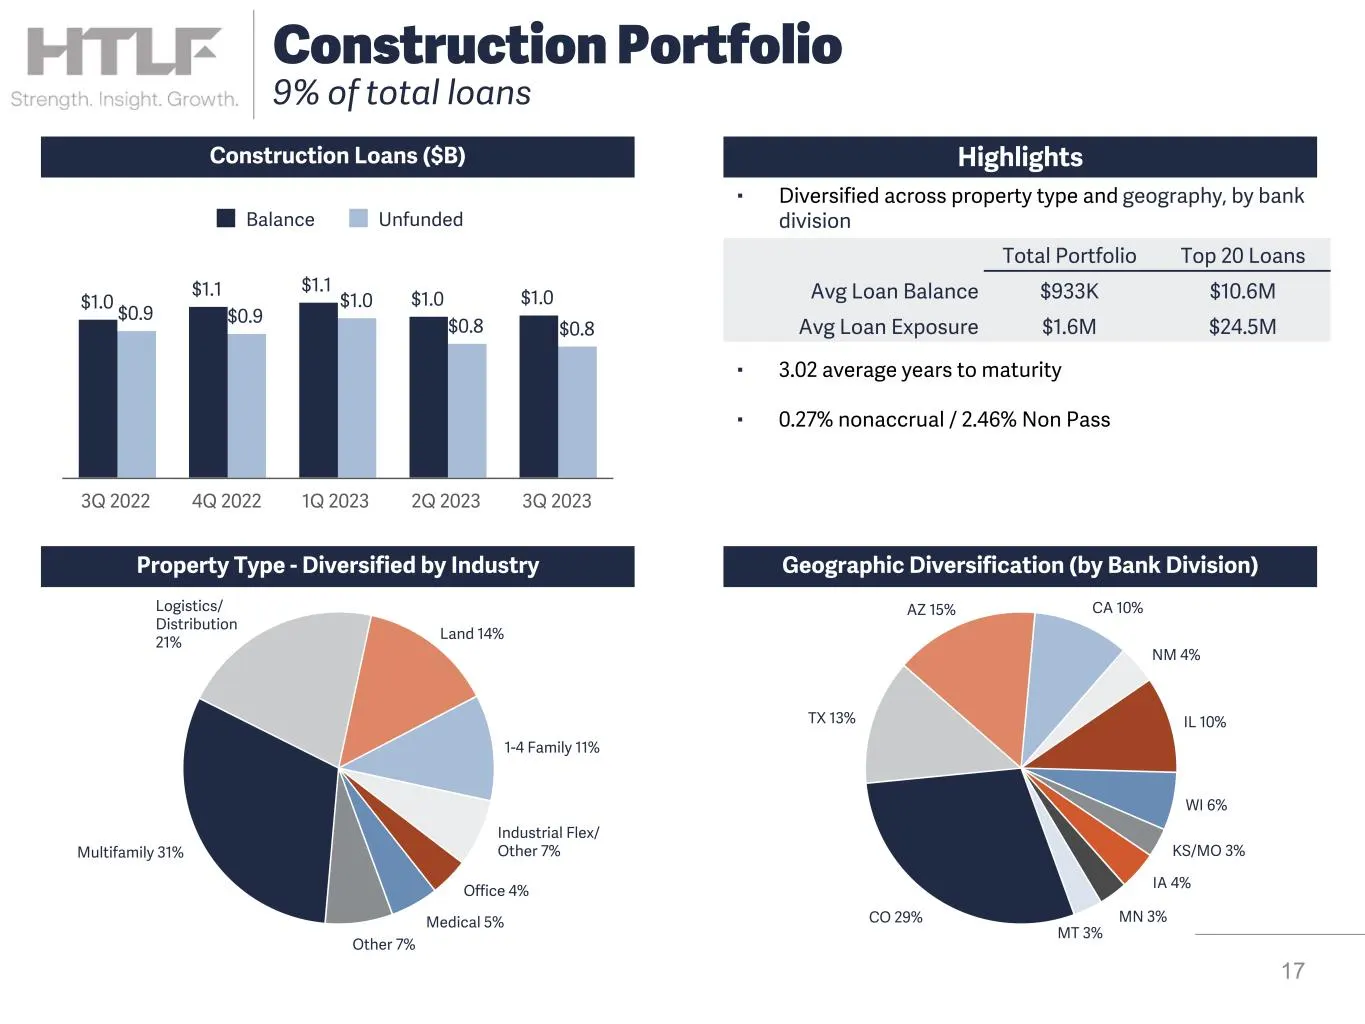
Slide 17: Construction Portfolio
17 Construction Portfolio 9% of total loans CO 29% TX 13% AZ 15% CA 10% NM 4% IL 10% WI 6% KS/MO 3% IA 4% MN 3% MT 3% Multifamily 31% Logistics/ Distribution 21% Land 14% 1-4 Family 11% Industrial Flex/ Other 7% Office 4% Medical 5% Other 7% ▪ Diversified across property type and geography, by bank
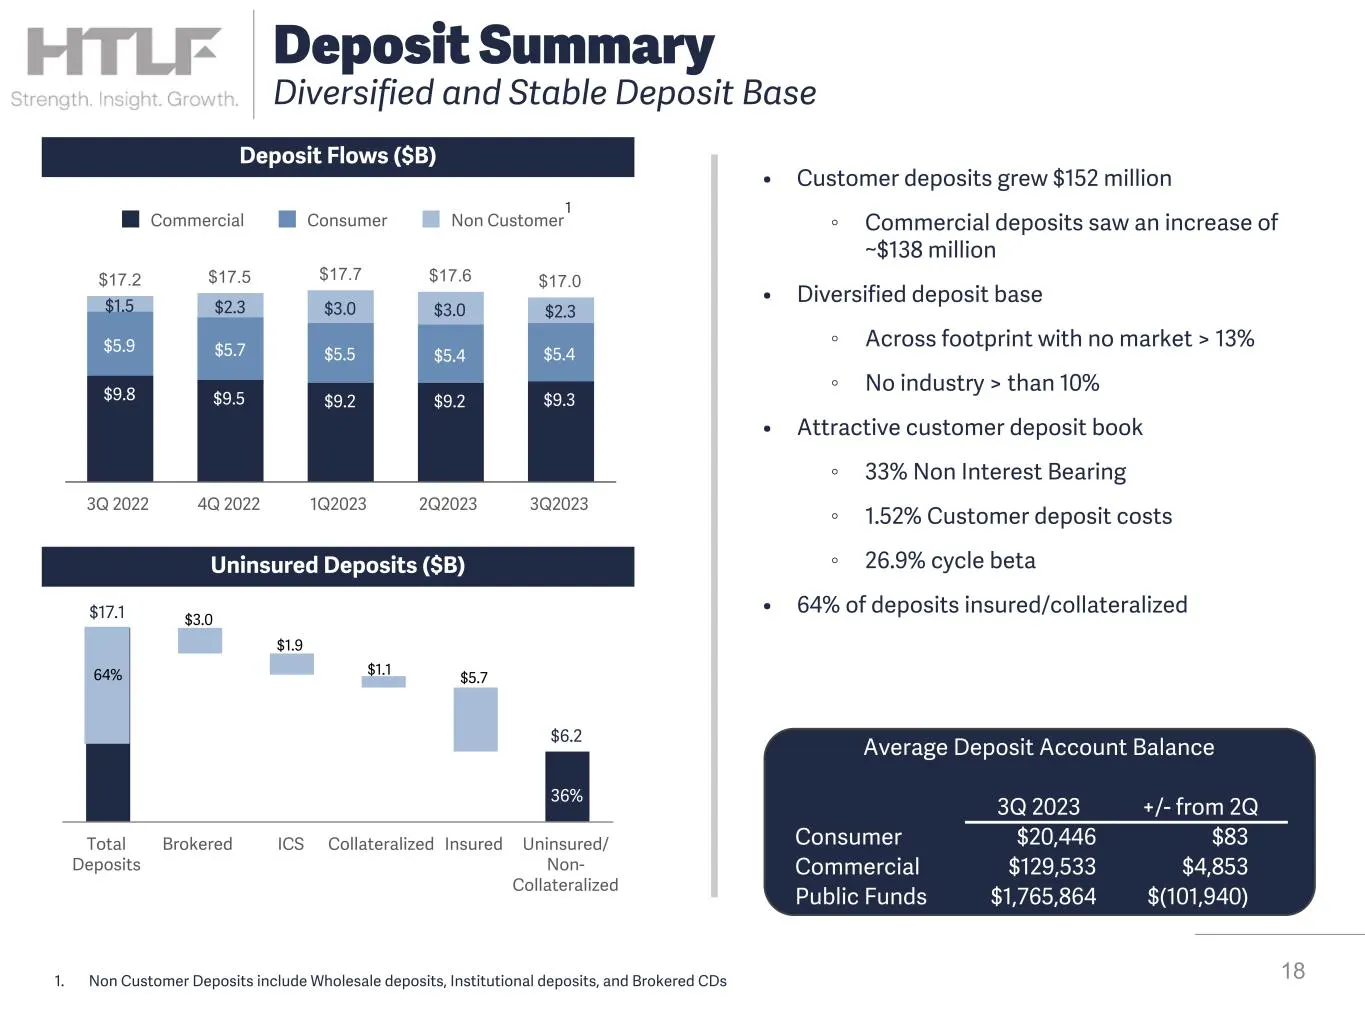
Slide 18: Diversified and Stable Deposit Base
Deposit Flows ($B) 18 Deposit Summary Diversified and Stable Deposit Base Uninsured Deposits ($B) $17.1 $6.2 36% Total Deposits Brokered ICS Collateralized Insured Uninsured/ Non- Collateralized $3.0 64% $1.9 $1.1 $5.7 $17.2 $17.5 $17.7 $17.6 $17.0 $9.8 $9.5 $9.2 $9.2 $9.3 $5.9 $5.7 $5.5 $5.4 $5.4 $
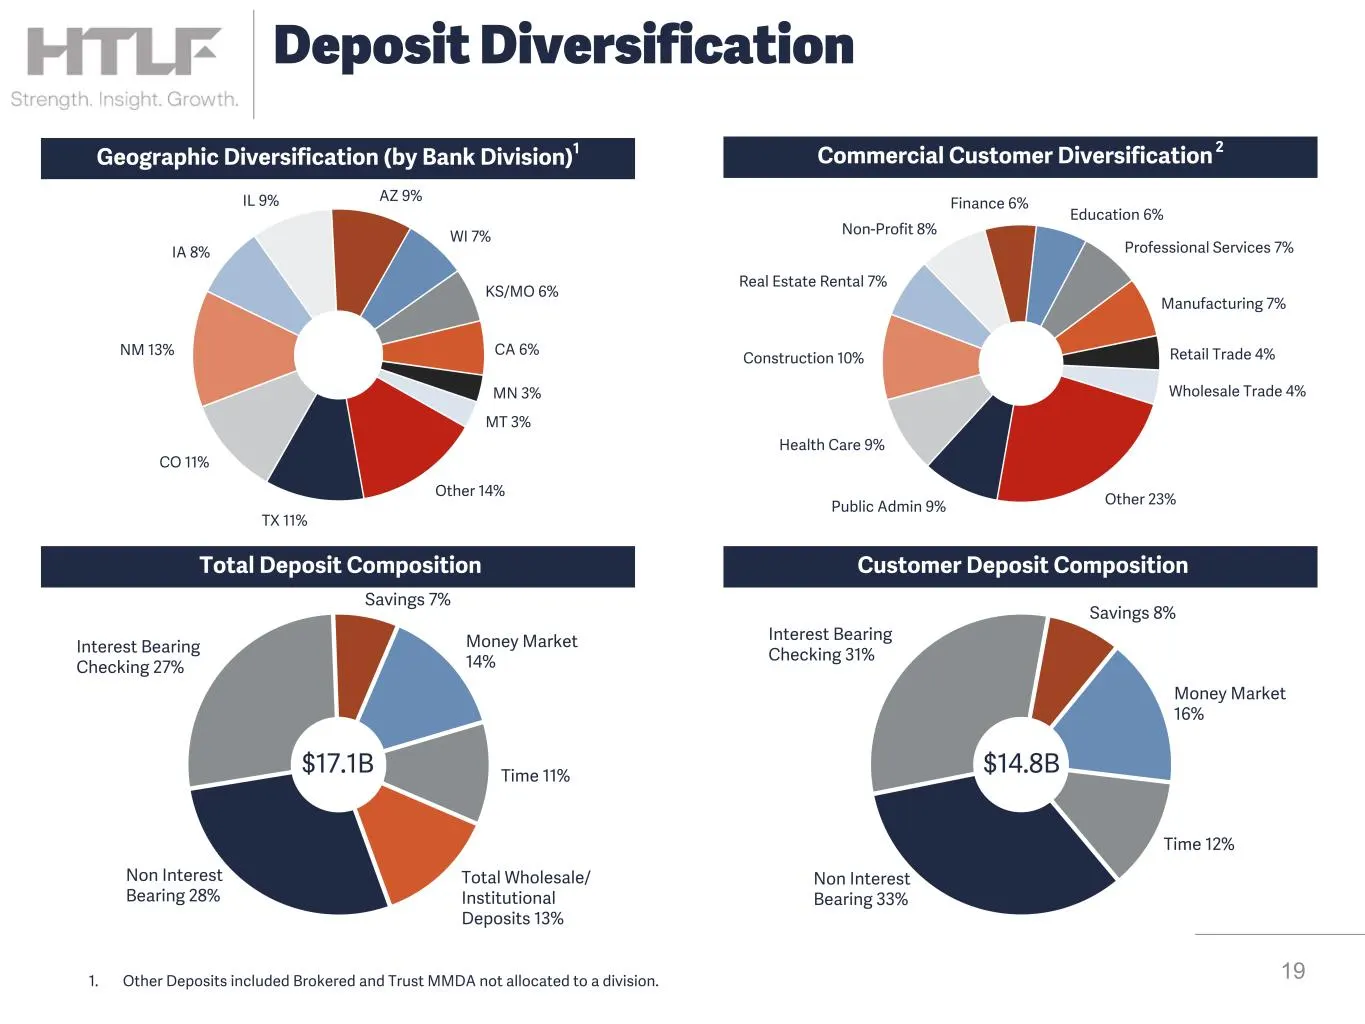
Slide 19: Deposit Diversification
Non Interest Bearing 28% Interest Bearing Checking 27% Savings 7% Money Market 14% Time 11% Total Wholesale/ Institutional Deposits 13% Geographic Diversification (by Bank Division)1 Commercial Customer Diversification 2 19 Deposit Diversification Total Deposit Composition Public Admin 9% Health Car
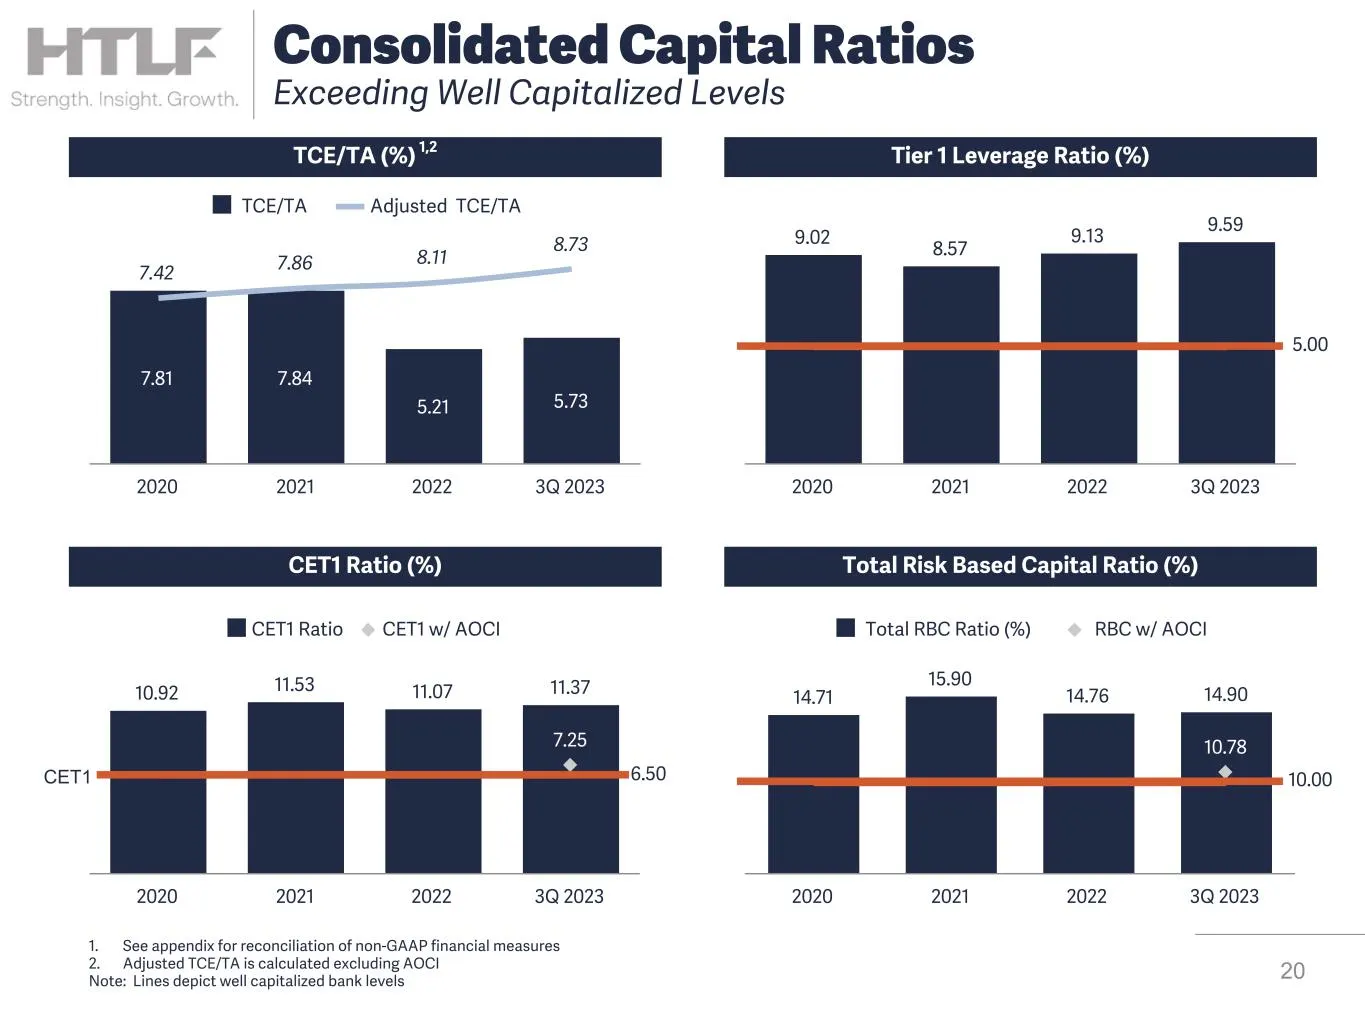
Slide 20: Consolidated Capital Ratios Exceeding Well Capitalized Levels
10.92 11.53 11.07 11.37 7.25 CET1 Ratio CET1 w/ AOCI 2020 2021 2022 3Q 2023 CET1 6.50 TCE/TA (%) 1,2 Tier 1 Leverage Ratio (%) CET1 Ratio (%) Total Risk Based Capital Ratio (%) 7.81 7.84 5.21 5.73 7.42 7.86 8.11 8.73 TCE/TA Adjusted TCE/TA 2020 2021 2022 3Q 2023 9.02 8.57 9.13 9.59 5.00 2020 2021 20
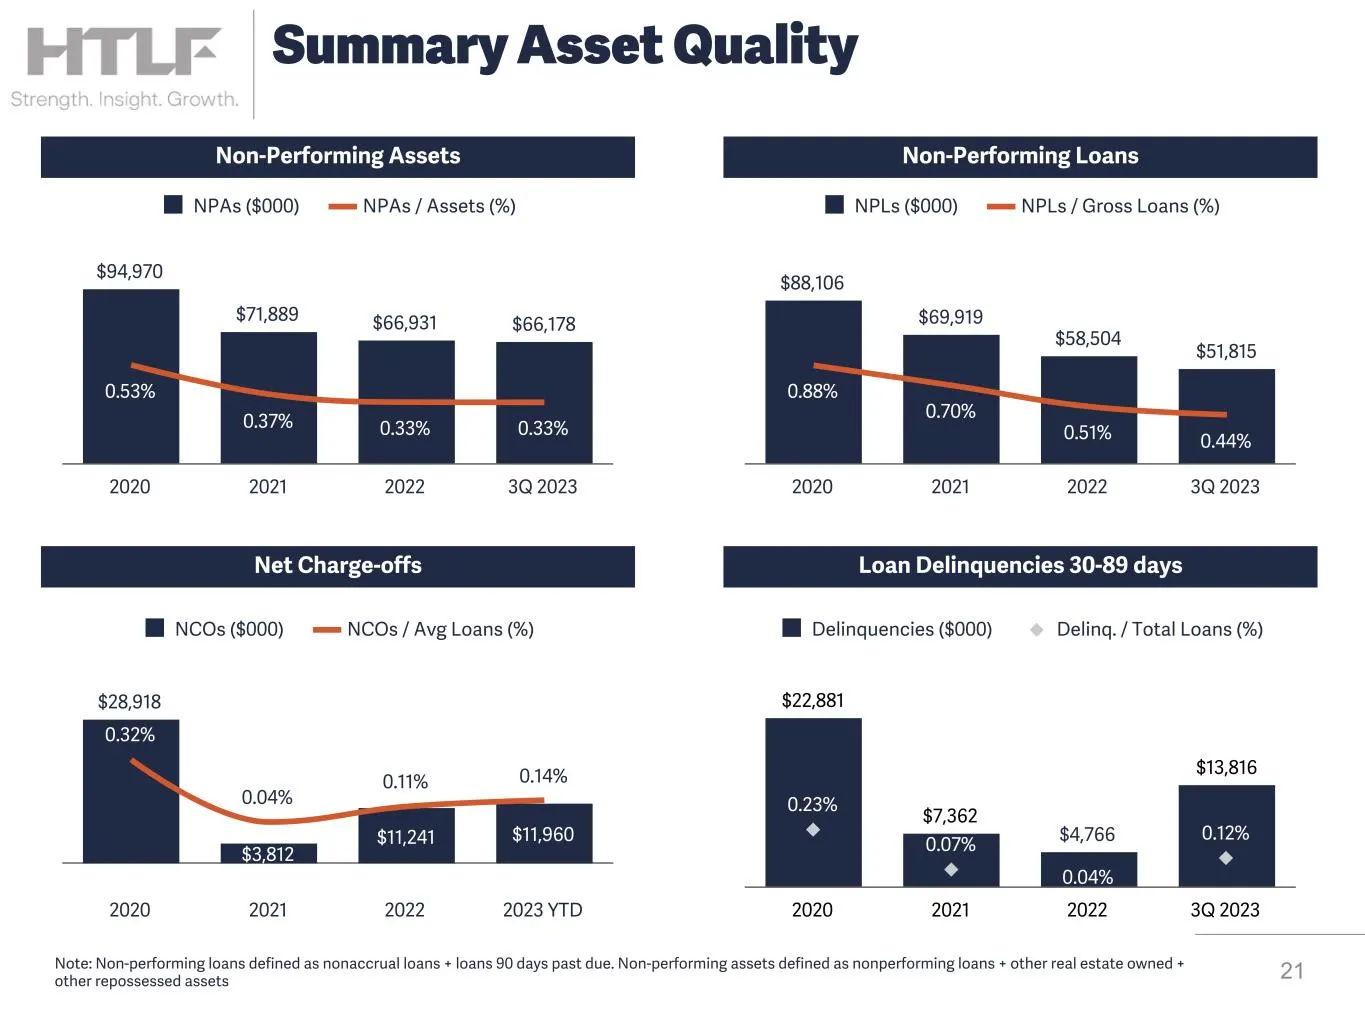
Slide 21: Summary Asset Quality
$22,881 $7,362 $4,766 $13,816 0.23% 0.07% 0.04% 0.12% Delinquencies ($000) Delinq. / Total Loans (%) 2020 2021 2022 3Q 2023 Non-Performing Assets Non-Performing Loans Net Charge-offs Loan Delinquencies 30-89 days $94,970 $71,889 $66,931 $66,178 0.53% 0.37% 0.33% 0.33% NPAs ($000) NPAs / Assets (%) 2
Slide 22: Allowance for Credit Related Losses
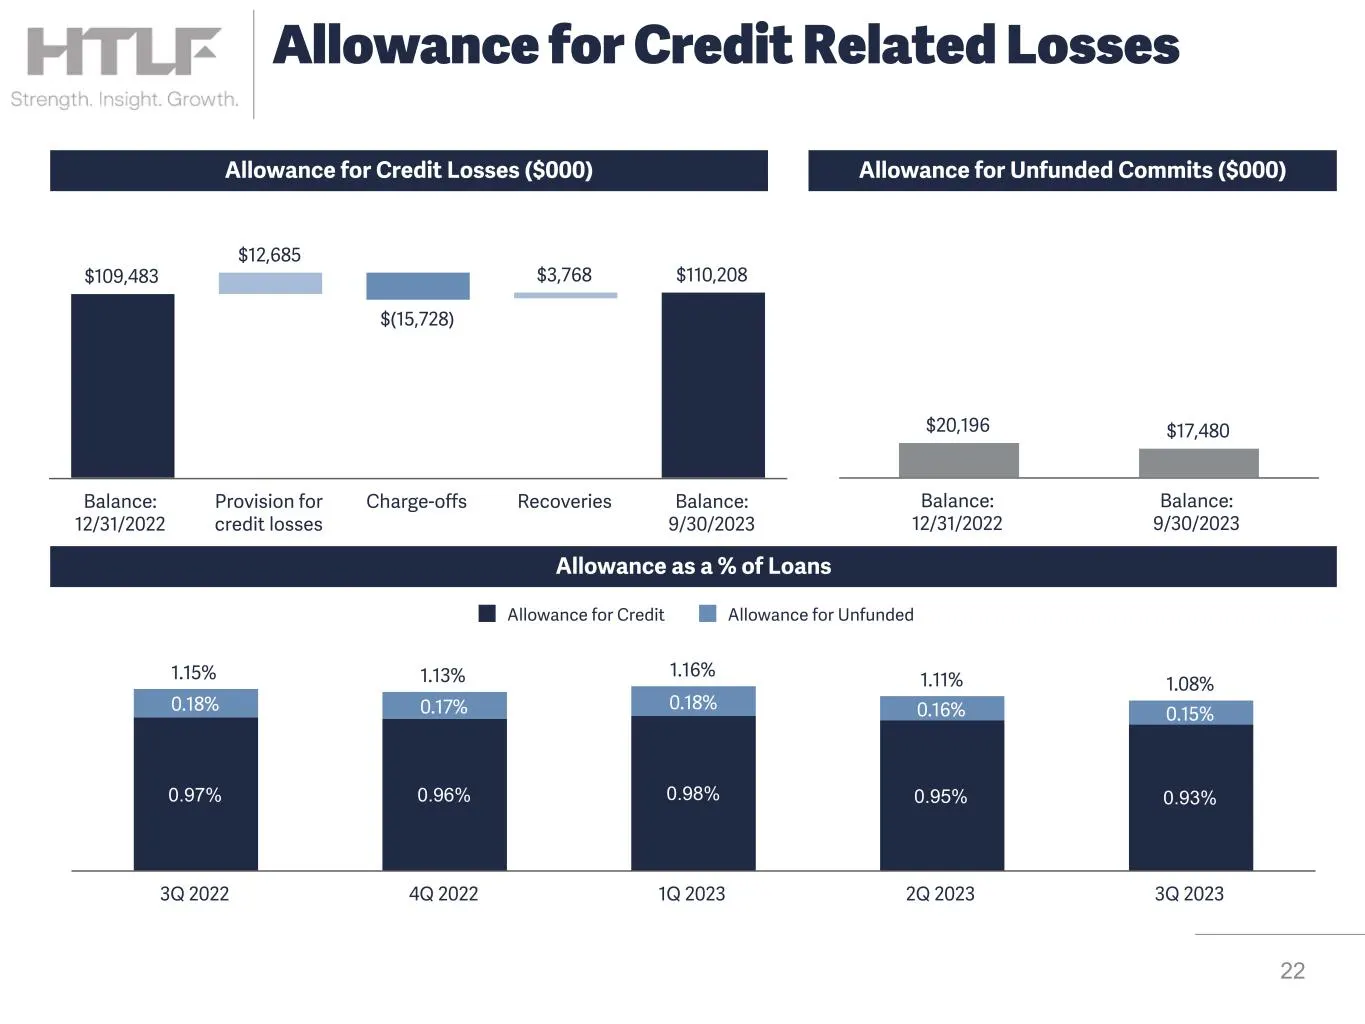
1.15% 1.13% 1.16% 1.11% 1.08% 0.97% 0.96% 0.98% 0.95% 0.93% 0.18% 0.17% 0.18% 0.16% 0.15% Allowance for Credit Allowance for Unfunded 3Q 2022 4Q 2022 1Q 2023 2Q 2023 3Q 2023 $20,196 $17,480 Balance: 12/31/2022 Balance: 9/30/2023 Allowance as a % of Loans Allowance for Credit Losses ($000) Allowance
Slide 23: Contact Information
HITLE Contact Information FTLF FHTLF 563.587.4164 [email protected] Strength. Bruce K. Lee Strength. Bryan R. McKeag Insight President and CEO Insight EVP, Chief Financial Officer Growth. 563.587.4176 office Growth. 5635871904 office 419,3511274 cell 920,284,0732 cell [email protected] [email protected] St

Slide 24: i Bank of
i Bank of Py Atizona Qy Bake os she Pes Barksis ILLINOIS aes aciisonotirreunx CITYWIDE BANKS, elise ee Es Rocky MINNESOTA Sota PREMIER GQ fieeeeain WISCONSIN SS eemavnrom -NEWMEXICO ire nank Bank ___ BANK & TRUST" TAC 2 amen emereTrerl scent HT Bank acleen tiie + Together We Are
Slide 25: Non-GAAP Reconciliations
25 Non-GAAP Reconciliations
Slide 26: Non-GAAP measure definitions
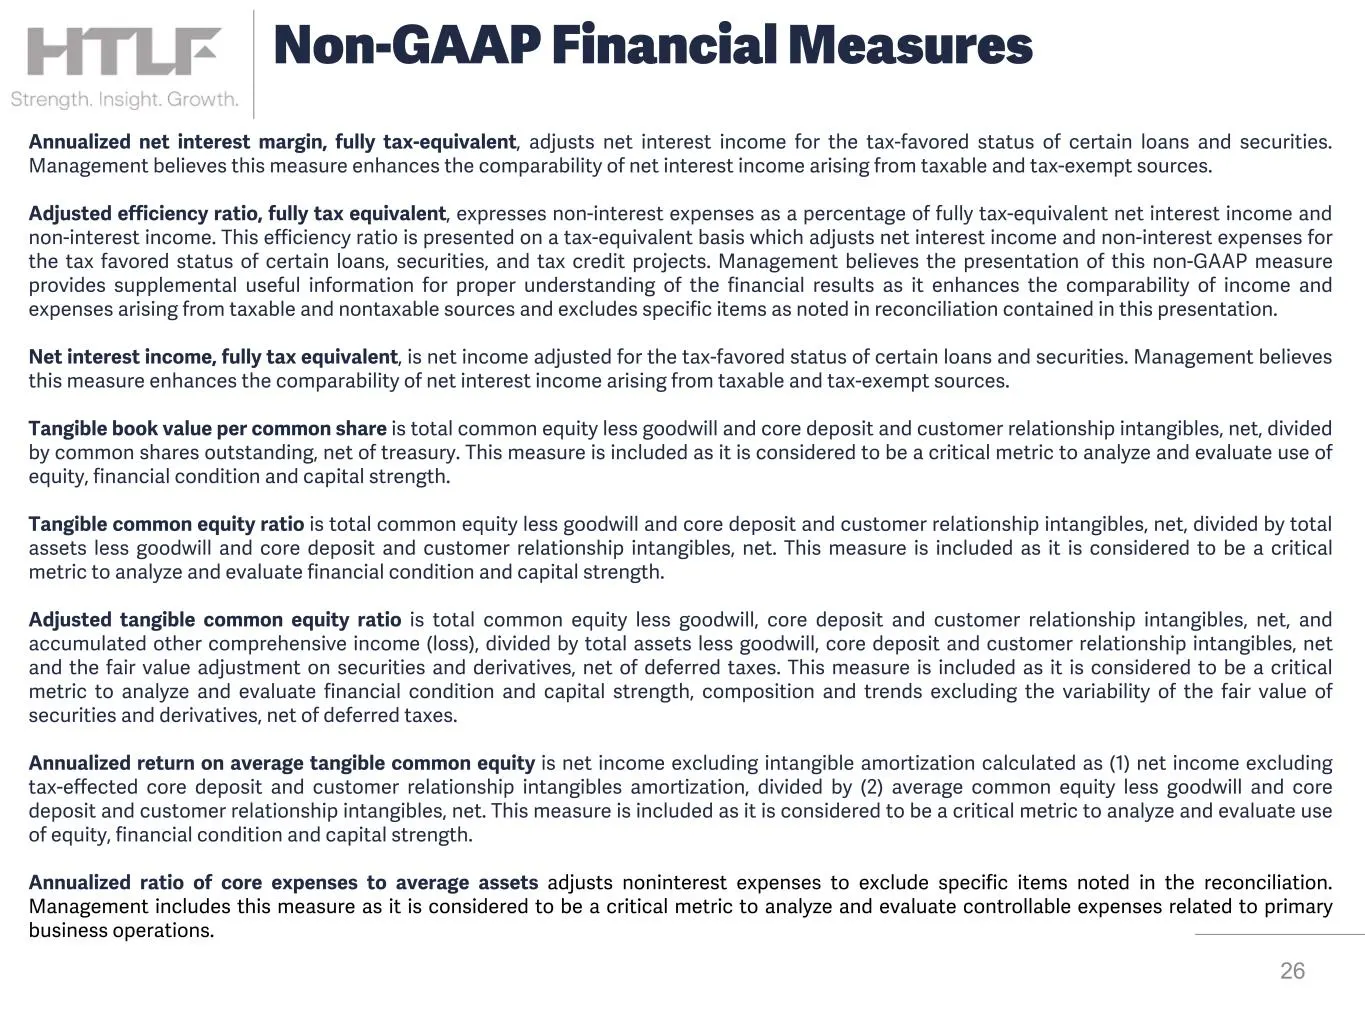
Annualized net interest margin, fully tax-equivalent, adjusts net interest income for the tax-favored status of certain loans and securities. Management believes this measure enhances the comparability of net interest income arising from taxable and tax-exempt sources. Adjusted efficiency ratio, ful
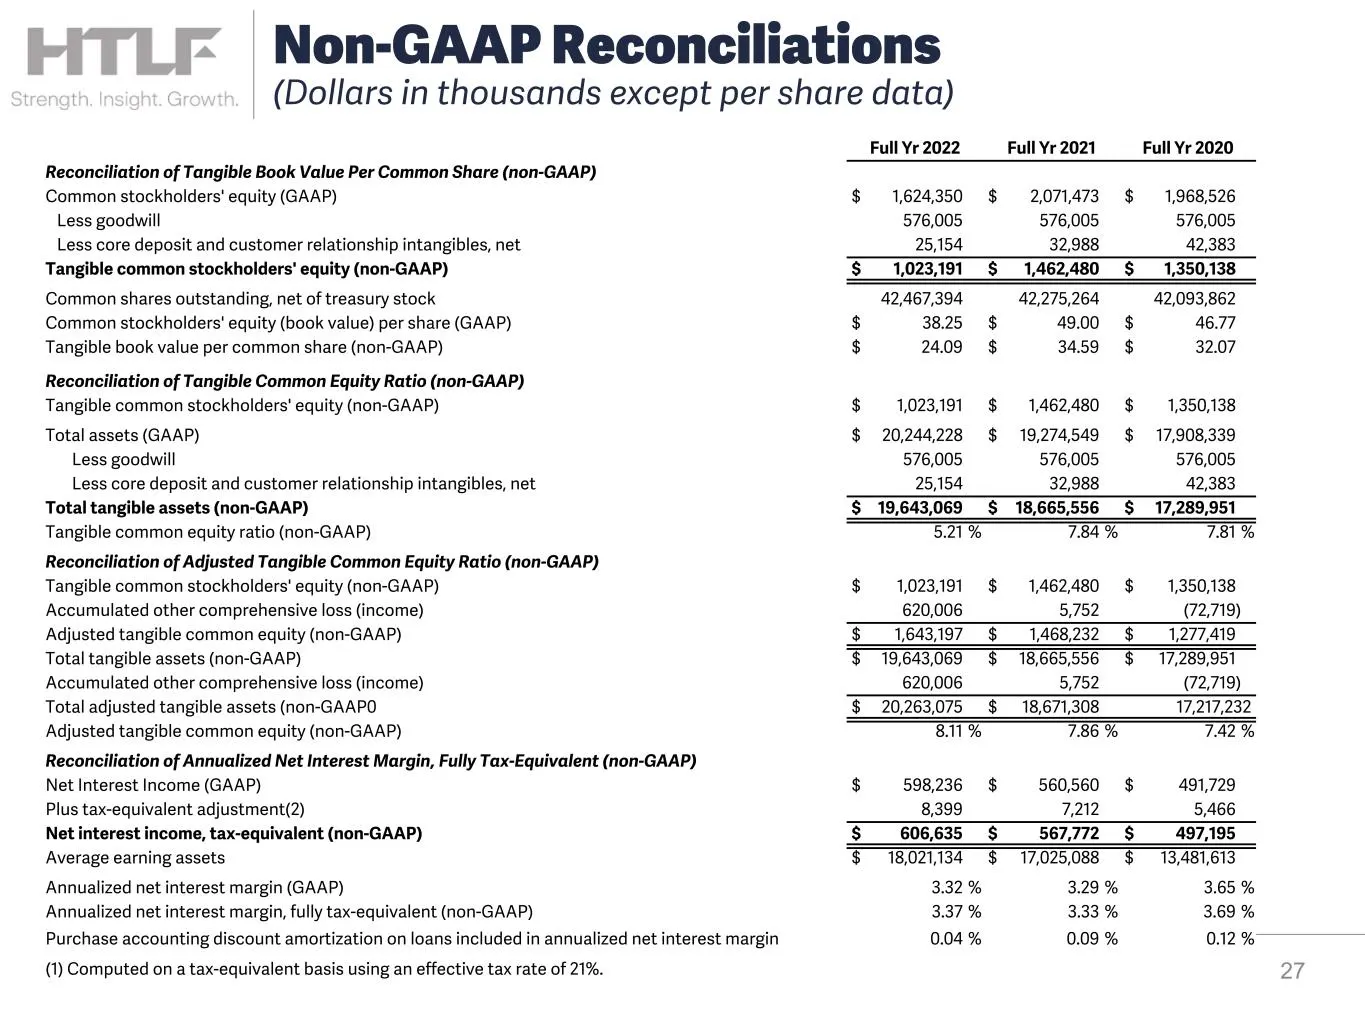
Slide 27: Reconciliation of Tangible Book Value Per Common Share
Full Yr 2022 Full Yr 2021 Full Yr 2020 Reconciliation of Tangible Book Value Per Common Share (non-GAAP) Common stockholders' equity (GAAP) $ 1,624,350 $ 2,071,473 $ 1,968,526 Less goodwill 576,005 576,005 576,005 Less core deposit and customer relationship intangibles, net 25,154 32,988 42,383 Tang
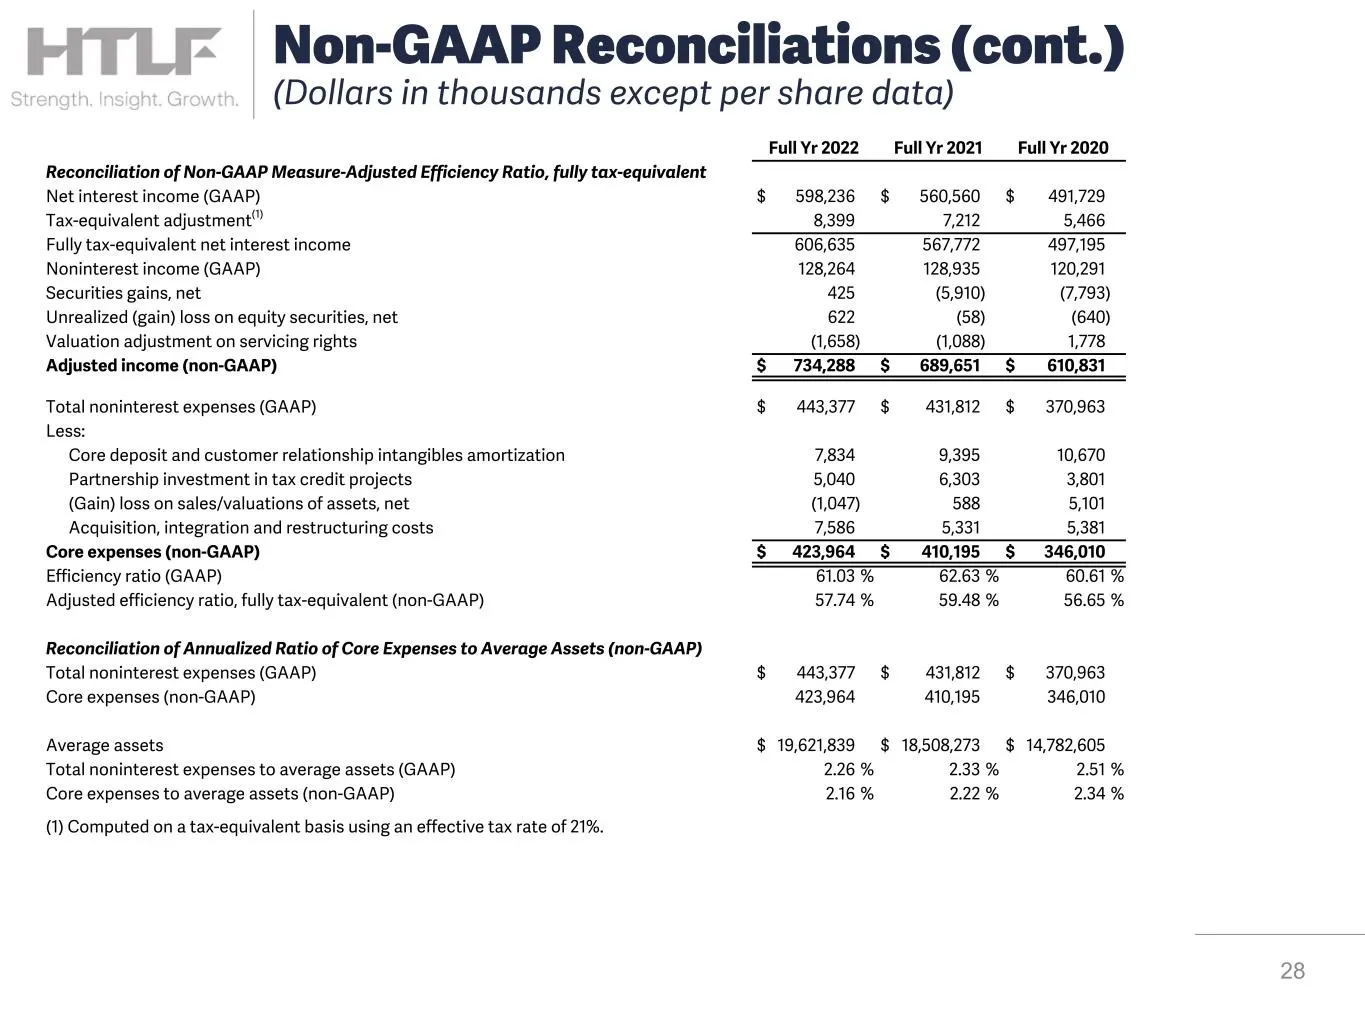
Slide 28: Reconciliation of Adjusted Efficiency Ratio
Full Yr 2022 Full Yr 2021 Full Yr 2020 Reconciliation of Non-GAAP Measure-Adjusted Efficiency Ratio, fully tax-equivalent Net interest income (GAAP) $ 598,236 $ 560,560 $ 491,729 Tax-equivalent adjustment(1) 8,399 7,212 5,466 Fully tax-equivalent net interest income 606,635 567,772 497,195 Nonintere
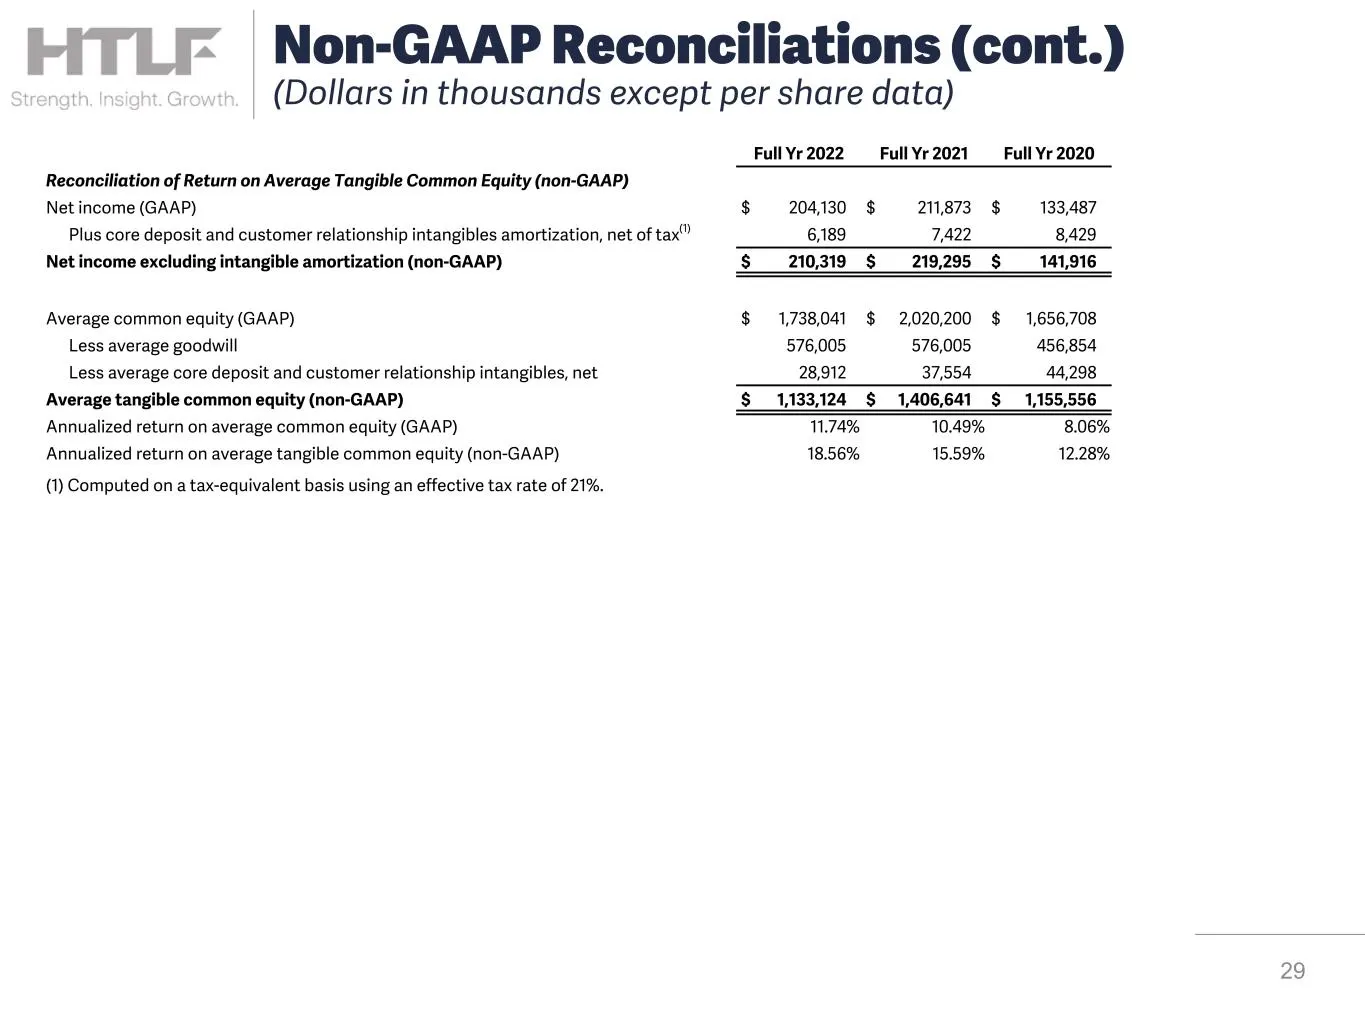
Slide 29: Non-GAAP Reconciliations (cont.)
Non-GAAP Reconciliations (cont.) (Dollars in thousands except per share data) Full Yr 2022 Full Yr 2021 Full Yr 2020 Reconciliation of Return on Average Tangible Common Equity (non-GAAP) Net income (GAAP) $ 204,130 $ 211,873 $ 133,487 Plus core deposit and customer relationship intangibles amortizat
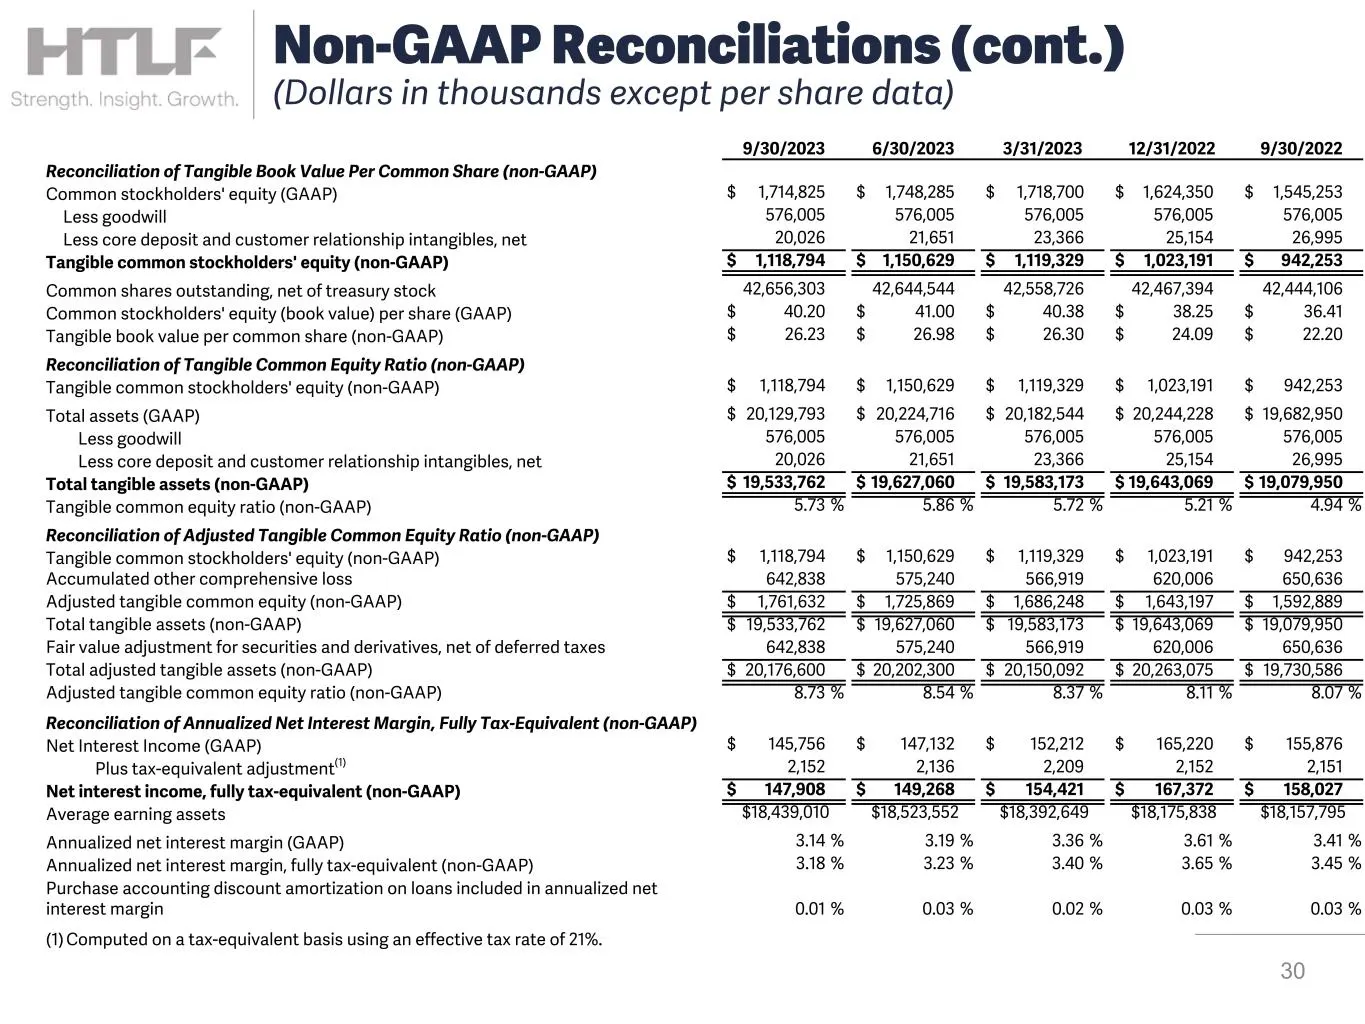
Slide 30: Reconciliation of Tangible Book Value Per Common Share
9/30/2023 6/30/2023 3/31/2023 12/31/2022 9/30/2022 Reconciliation of Tangible Book Value Per Common Share (non-GAAP) Common stockholders' equity (GAAP) $ 1,714,825 $ 1,748,285 $ 1,718,700 $ 1,624,350 $ 1,545,253 Less goodwill 576,005 576,005 576,005 576,005 576,005 Less core deposit and customer rel
Slide 31: Reconciliation of Adjusted Efficiency Ratio
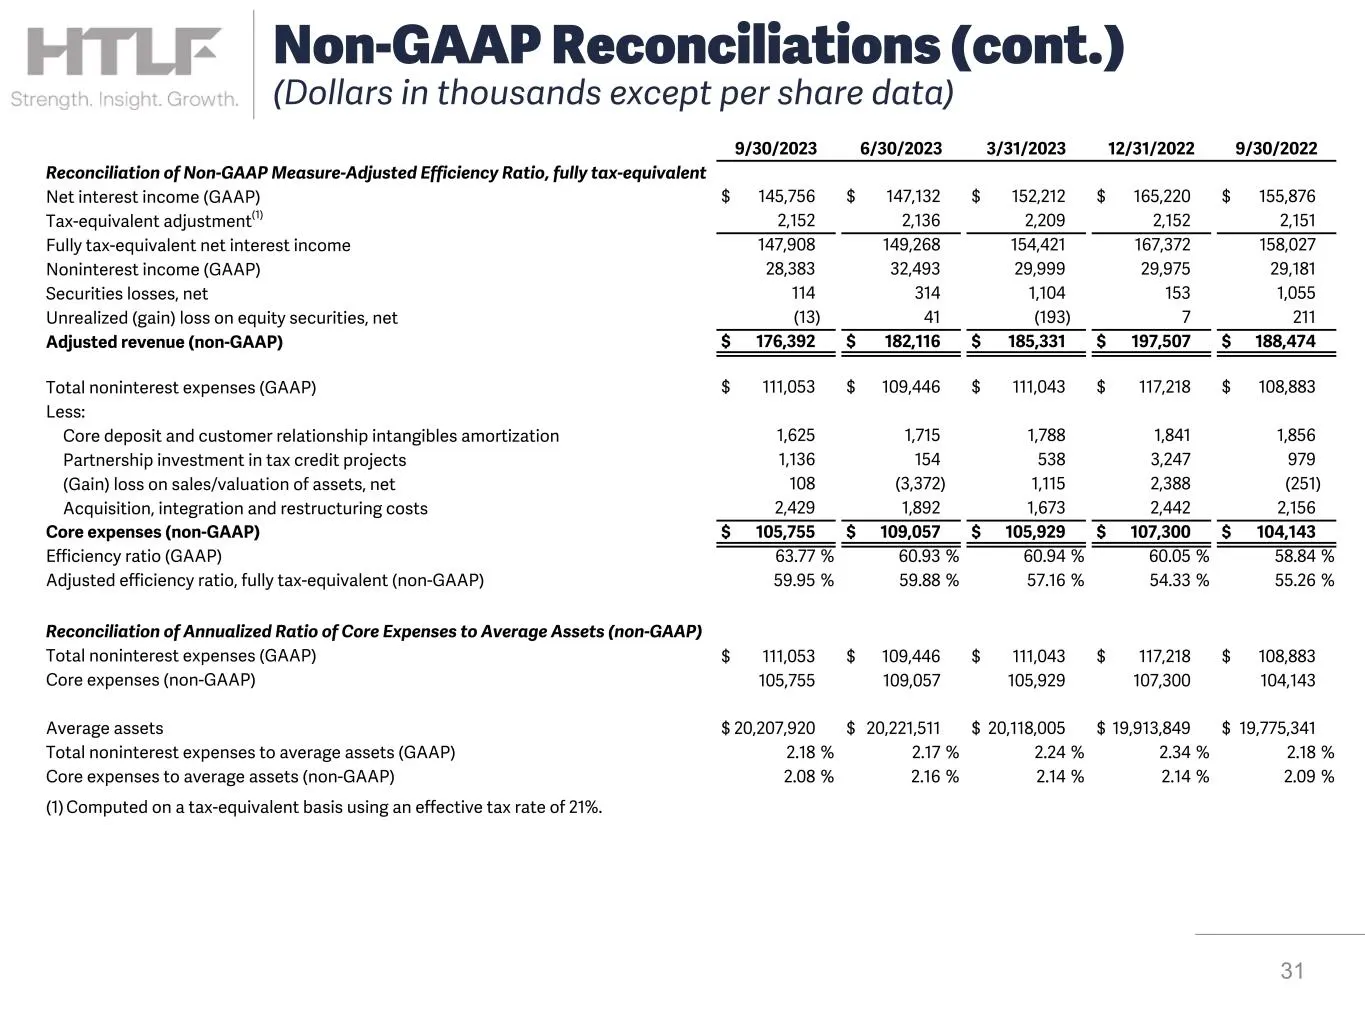
9/30/2023 6/30/2023 3/31/2023 12/31/2022 9/30/2022 Reconciliation of Non-GAAP Measure-Adjusted Efficiency Ratio, fully tax-equivalent Net interest income (GAAP) $ 145,756 $ 147,132 $ 152,212 $ 165,220 $ 155,876 Tax-equivalent adjustment(1) 2,152 2,136 2,209 2,152 2,151 Fully tax-equivalent net inter
Slide 32: Non-GAAP Reconciliations (cont.)
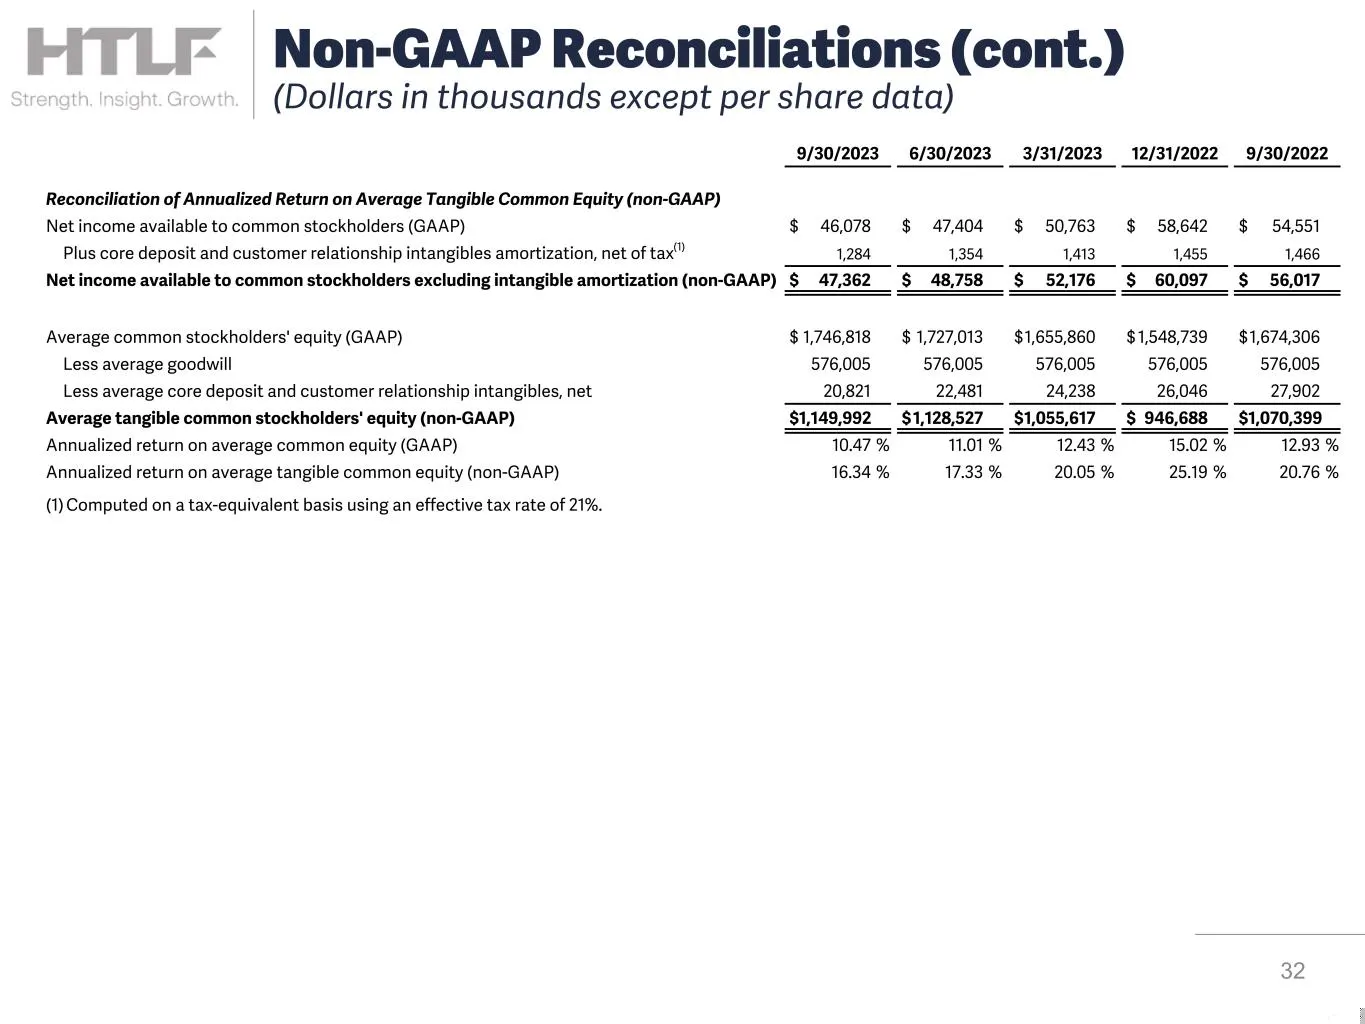
32 Non-GAAP Reconciliations (cont.) (Dollars in thousands except per share data) 9/30/2023 6/30/2023 3/31/2023 12/31/2022 9/30/2022 Reconciliation of Annualized Return on Average Tangible Common Equity (non-GAAP) Net income available to common stockholders (GAAP) $ 46,078 $ 47,404 $ 50,763 $ 58,642
Slide 33: Reconciliation of Adjusted Efficiency Ratio, Nine Months
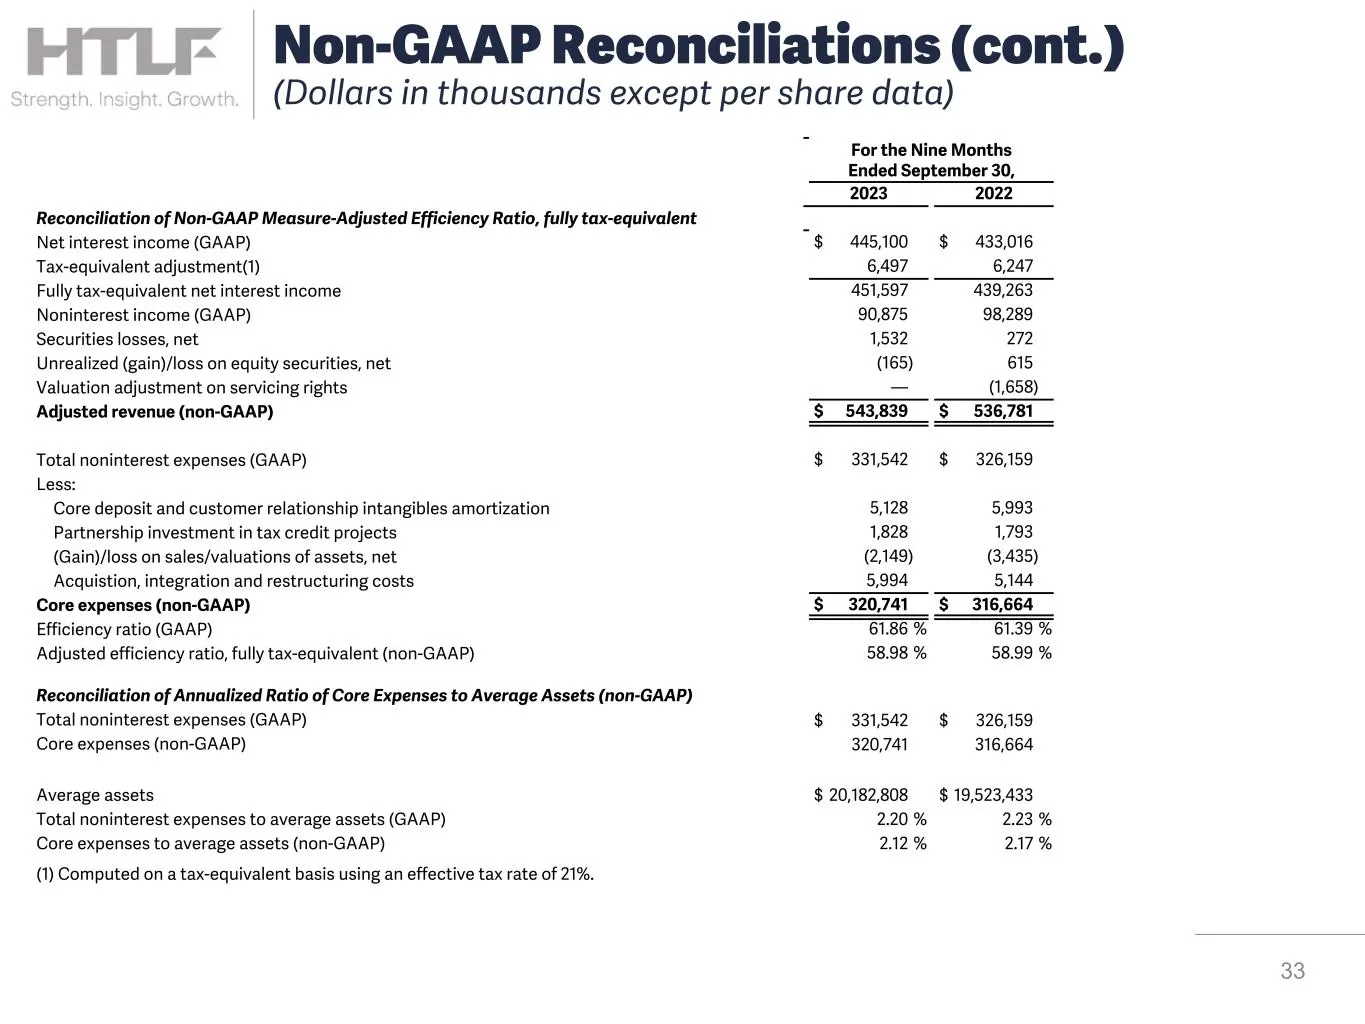
For the Nine Months Ended September 30, 2023 2022 Reconciliation of Non-GAAP Measure-Adjusted Efficiency Ratio, fully tax-equivalent Net interest income (GAAP) $ 445,100 $ 433,016 Tax-equivalent adjustment(1) 6,497 6,247 Fully tax-equivalent net interest income 451,597 439,263 Noninterest income (GA
Slide 34: Non-GAAP Reconciliations (cont.)
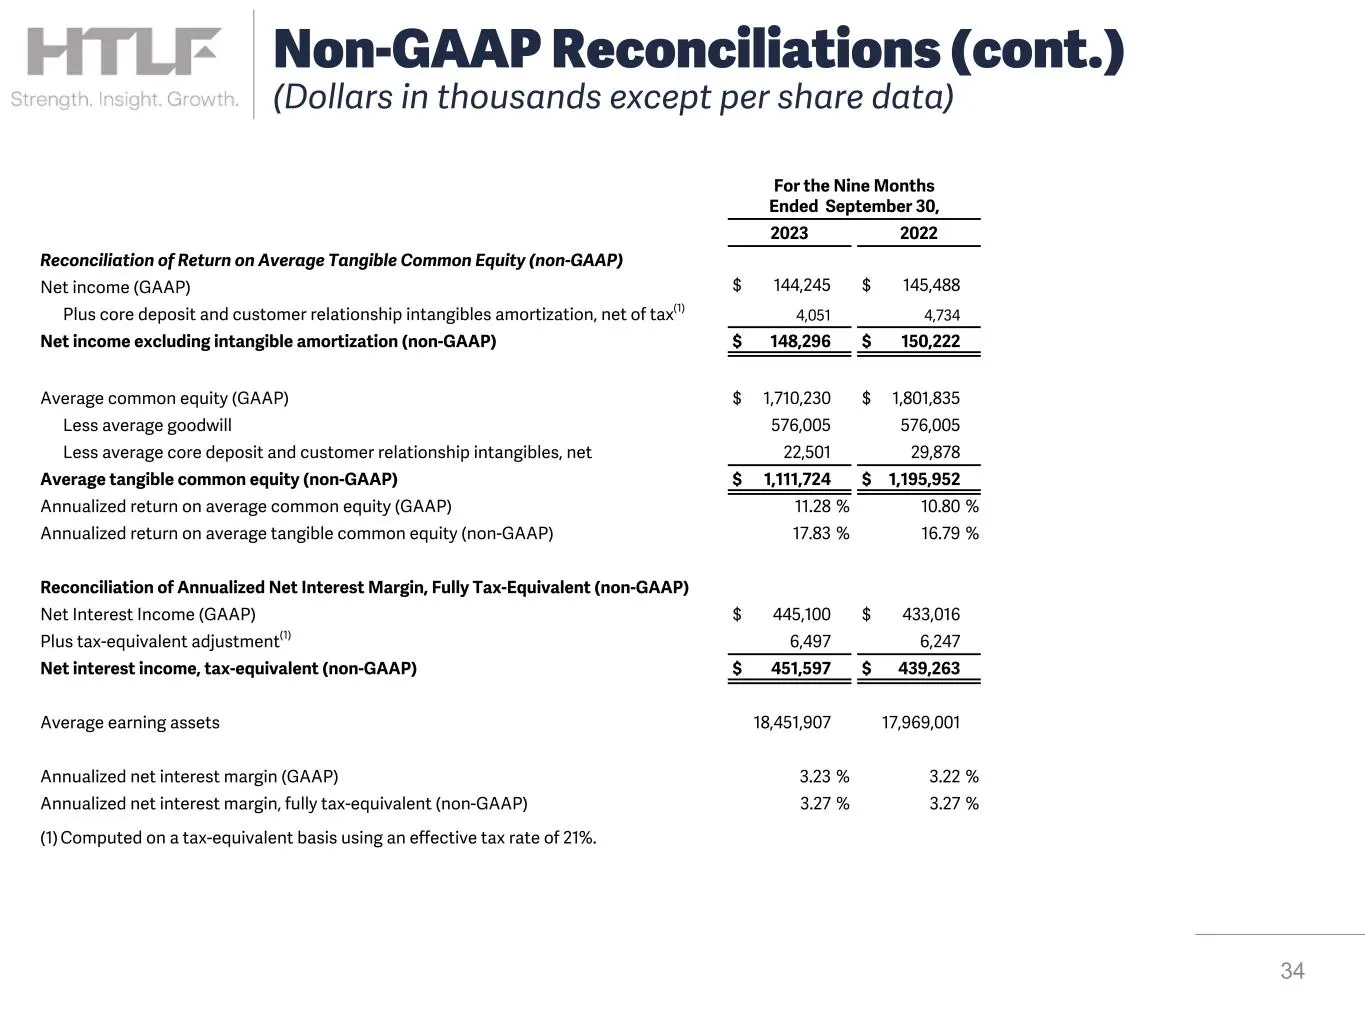
34 Non-GAAP Reconciliations (cont.) (Dollars in thousands except per share data) For the Nine Months Ended September 30, 2023 2022 Reconciliation of Return on Average Tangible Common Equity (non-GAAP) Net income (GAAP) $ 144,245 $ 145,488 Plus core deposit and customer relationship intangibles amort

Slide 35: i Bank of
i Bank of Py Atizona Qy Bake os she Pes Barksis ILLINOIS aes aciisonotirreunx CITYWIDE BANKS, elise ee Es Rocky MINNESOTA Sota PREMIER GQ fieeeeain WISCONSIN SS eemavnrom -NEWMEXICO ire nank Bank ___ BANK & TRUST" TAC 2 amen emereTrerl scent HT Bank acleen tiie + Together We Are
Source: SEC EDGAR · 8-K filed Oct 30, 2023
More decks from Heartland Financial USA Inc
 Merger or Acquisition (July 2024)6 slides · Jul 31, 2024
 Merger or Acquisition (May 2024)6 slides · May 2, 2024
 Merger or Acquisition (May 2024)27 slides · May 2, 2024
 Q4 2023 Earnings Presentation54 slides · Feb 13, 2024
 Q4 2023 Earnings Presentation35 slides · Jan 29, 2024
 Q3 2023 Earnings Presentation55 slides · Nov 15, 2023