Heartland Financial USA — Q1 2021 Earnings Presentation
50 slides from Heartland Financial USA's earnings presentation, Apr 26, 2021
Slide 1: 1st Quarter 2021 Financials
FITLI- Strength. Insight. Growth. 1st Quarter 2021 Financials
Slide 2: Safe Harbor
Safe Harbor 2 This release (including any information incorporated herein by reference), and future oral and written statements of HTLF and its management, may contain forward-looking statements within the meaning of Section 27A of the Securities Act of 1933, as amended, and Section 21E of the Secur
Slide 3: Corporate Profile
3 Corporate Profile
Slide 4: HTLF: Year Growth in Assets
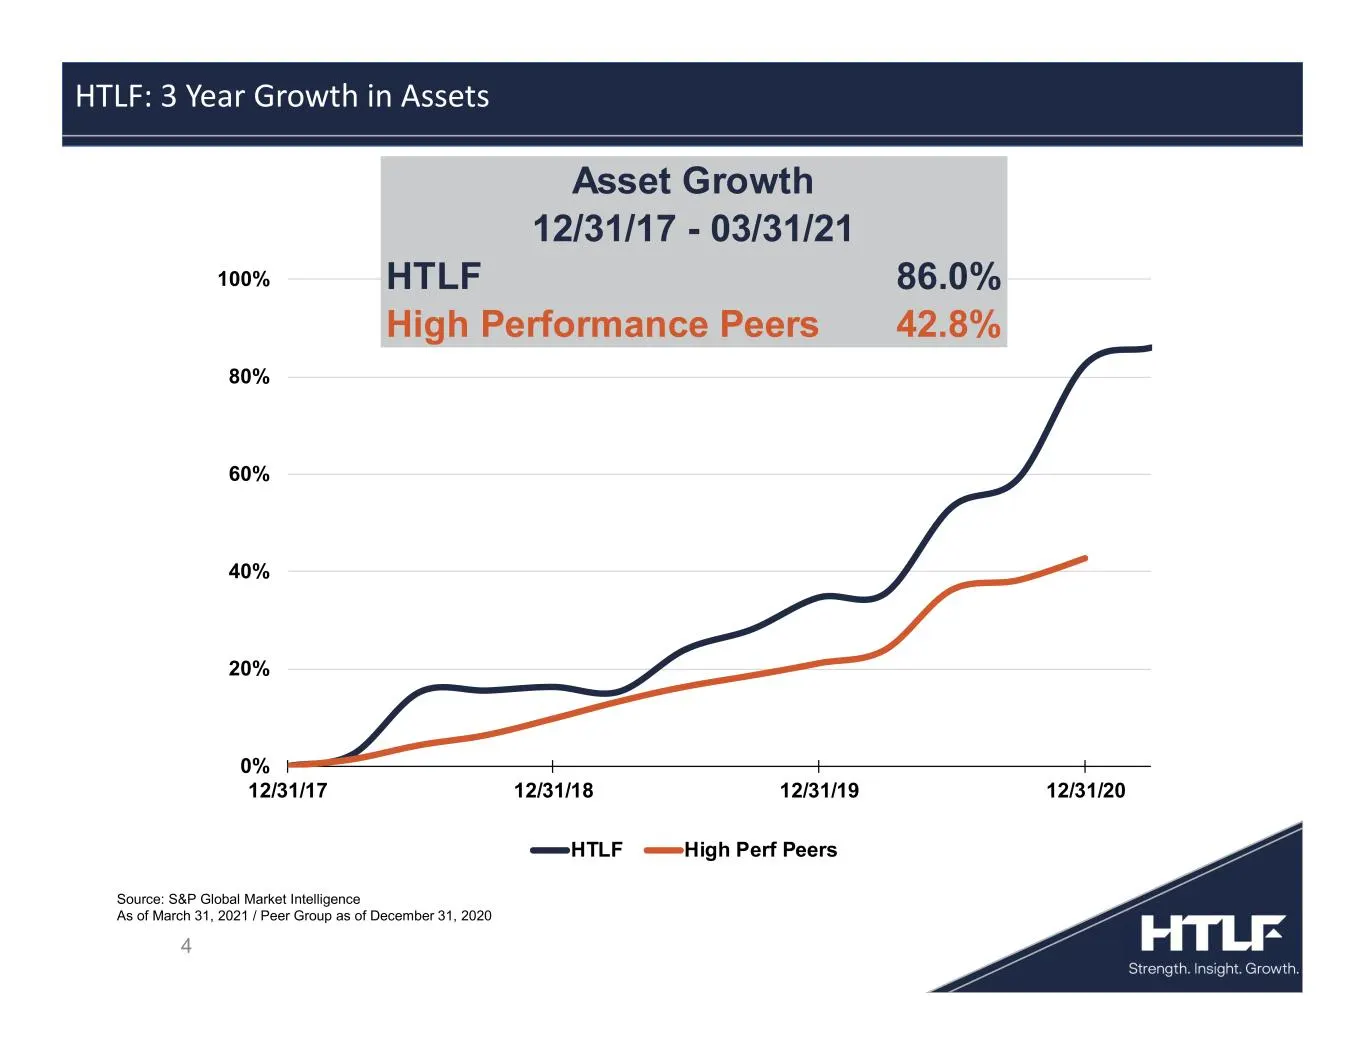
4 HTLF: 3 Year Growth in Assets Source: S&P Global Market Intelligence As of March 31, 2021 / Peer Group as of December 31, 2020 0% 20% 40% 60% 80% 100% 12/31/17 12/31/18 12/31/19 12/31/20 HTLF High Perf Peers HTLF 86.0% High Performance Peers 42.8% 12/31/17 - 03/31/21 Asset Growth
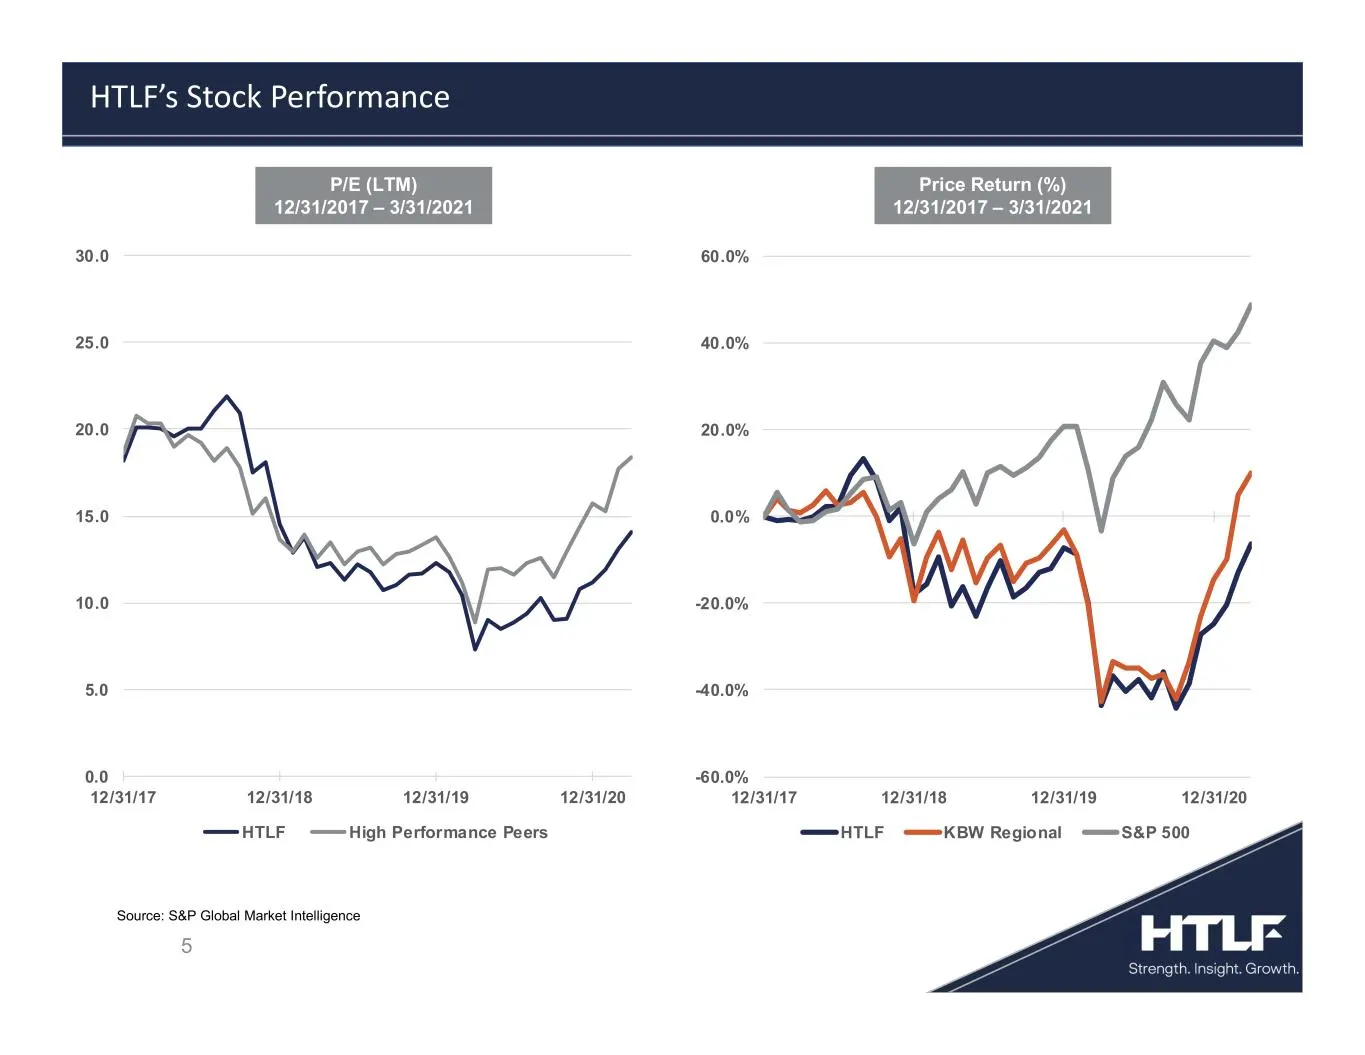
Slide 5: HTLF's Stock Performance
5 HTLF’s Stock Performance Price Return (%) 12/31/2017 – 3/31/2021 Source: S&P Global Market Intelligence P/E (LTM) 12/31/2017 – 3/31/2021 0.0 5.0 10.0 15.0 20.0 25.0 30.0 12/31/17 12/31/18 12/31/19 12/31/20 HTLF High Performance Peers -60.0% -40.0% -20.0% 0.0% 20.0% 40.0% 60.0% 12/31/17 12/31/18 12
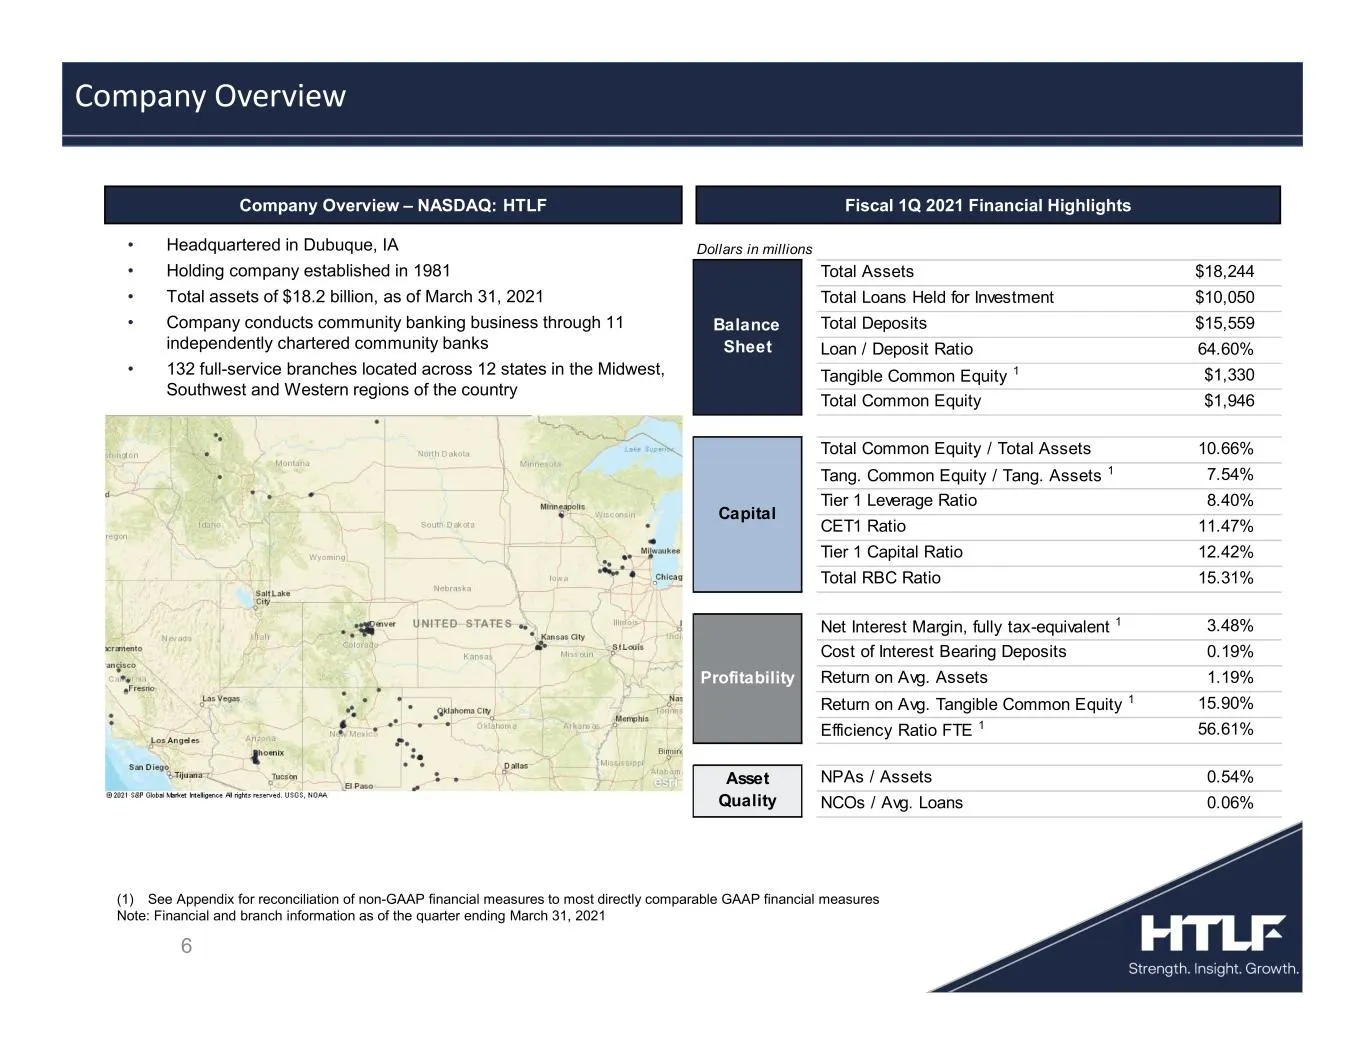
Slide 6: Company Overview – Fiscal 1Q 2021 Financial Highlights
6 Company Overview – NASDAQ: HTLF Fiscal 1Q 2021 Financial Highlights • Headquartered in Dubuque, IA • Holding company established in 1981 • Total assets of $18.2 billion, as of March 31, 2021 • Company conducts community banking business through 11 independently chartered community banks • 132 full
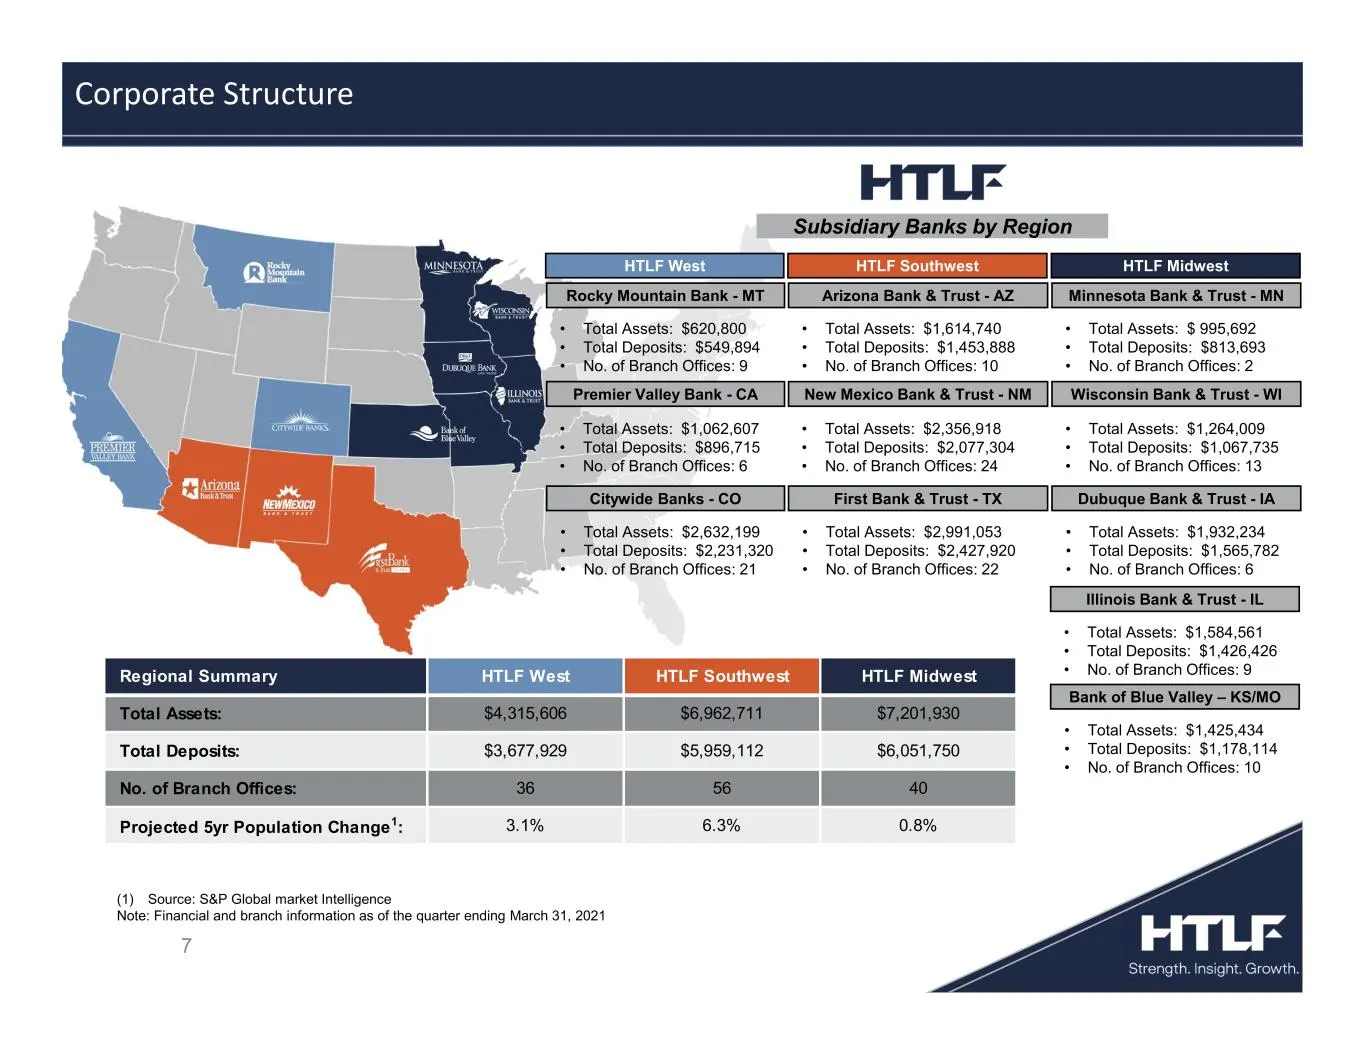
Slide 7: Subsidiary Banks by Region
7 Subsidiary Banks by Region Corporate Structure (1) Source: S&P Global market Intelligence Note: Financial and branch information as of the quarter ending March 31, 2021 Bank of Blue Valley – KS/MO Illinois Bank & Trust - IL Minnesota Bank & Trust - MN HTLF Midwest • Total Assets: $1,584,561 • Tota
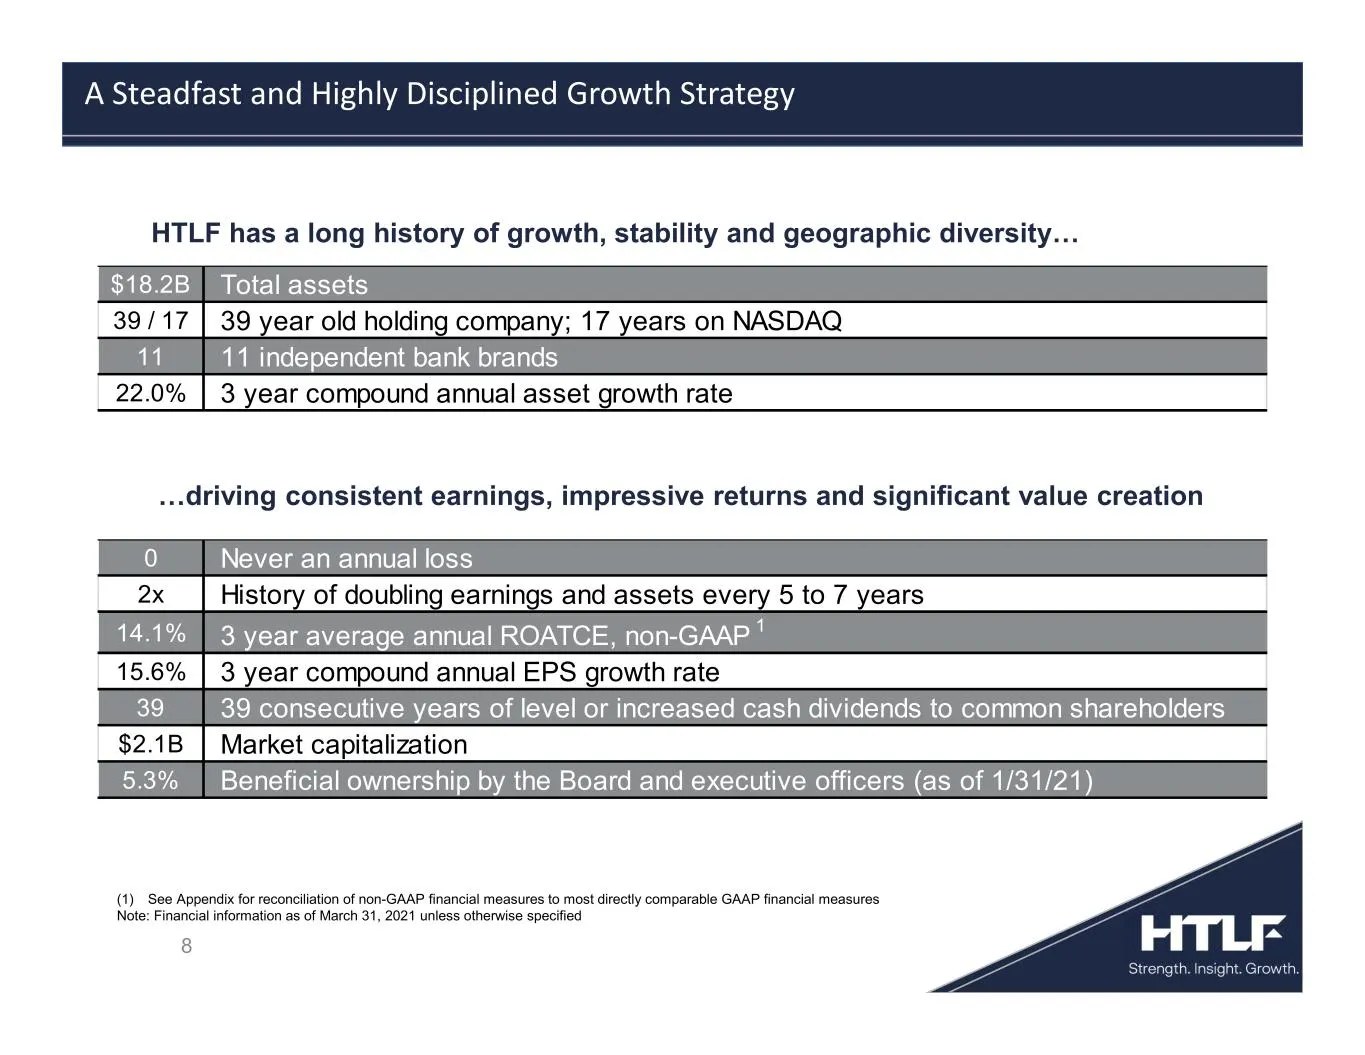
Slide 8: A Steadfast and Highly Disciplined Growth Strategy
8 …driving consistent earnings, impressive returns and significant value creation HTLF has a long history of growth, stability and geographic diversity… A Steadfast and Highly Disciplined Growth Strategy (1) See Appendix for reconciliation of non-GAAP financial measures to most directly comparable G
Slide 9: HTLF Asset and Earnings Growth
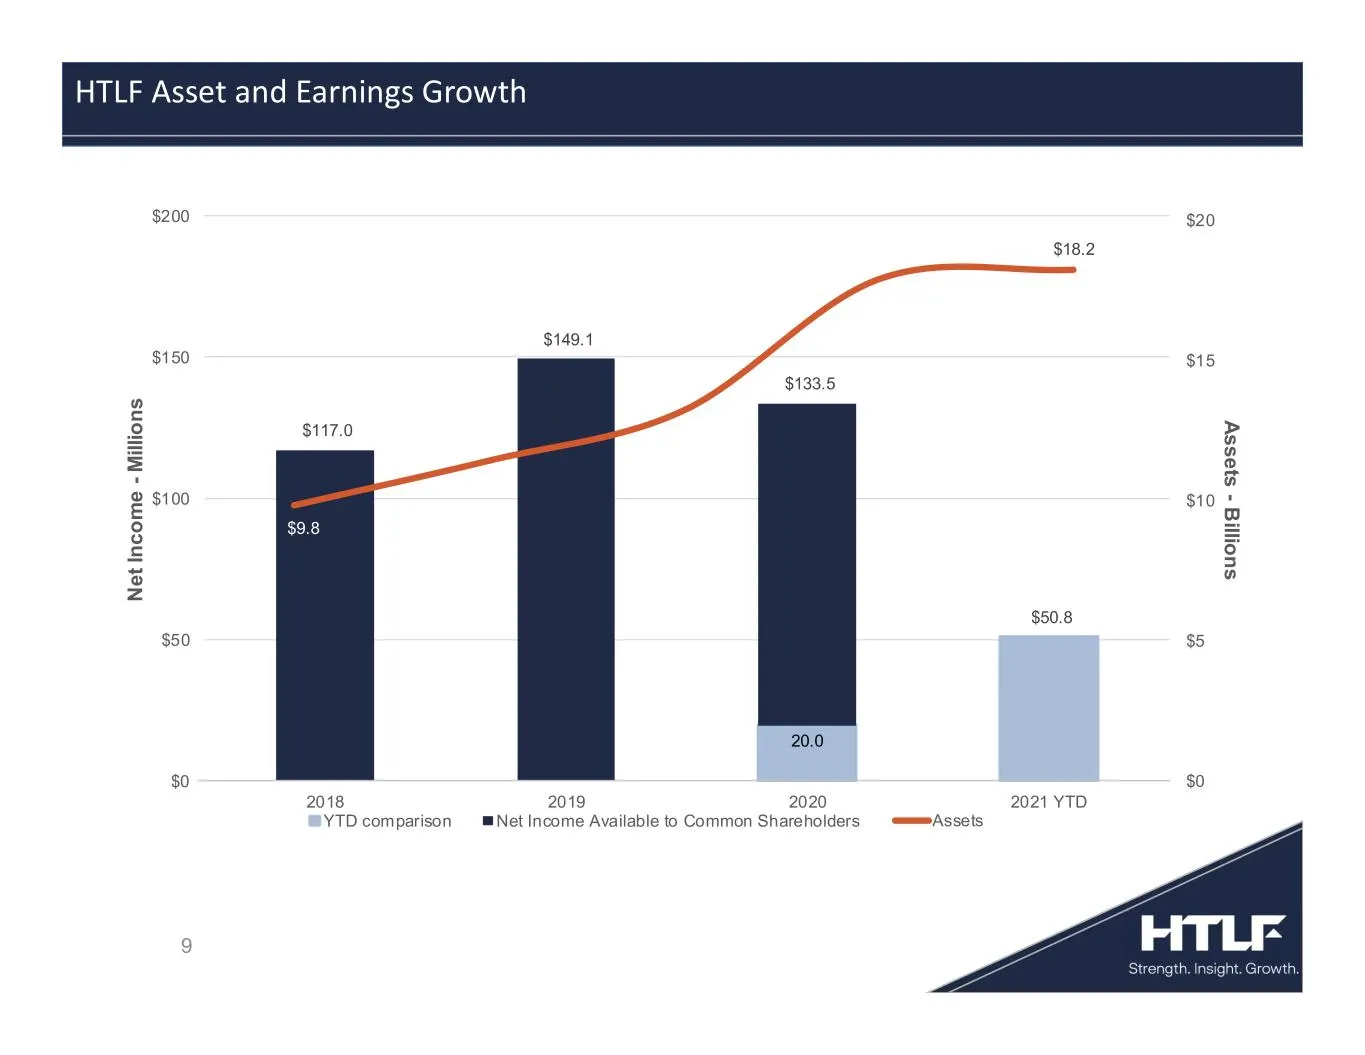
9 HTLF Asset and Earnings Growth 20.0 $117.0 $149.1 $133.5 $50.8 $0 $50 $100 $150 $200 2018 2019 2020 2021 YTD N e t In c o m e - M ill io n s YTD comparison Net Income Available to Common Shareholders $9.8 $18.2 $0 $5 $10 $15 $20 A s s e ts - B illio n s Assets
Slide 10: HTLF Diluted EPS and Dividends
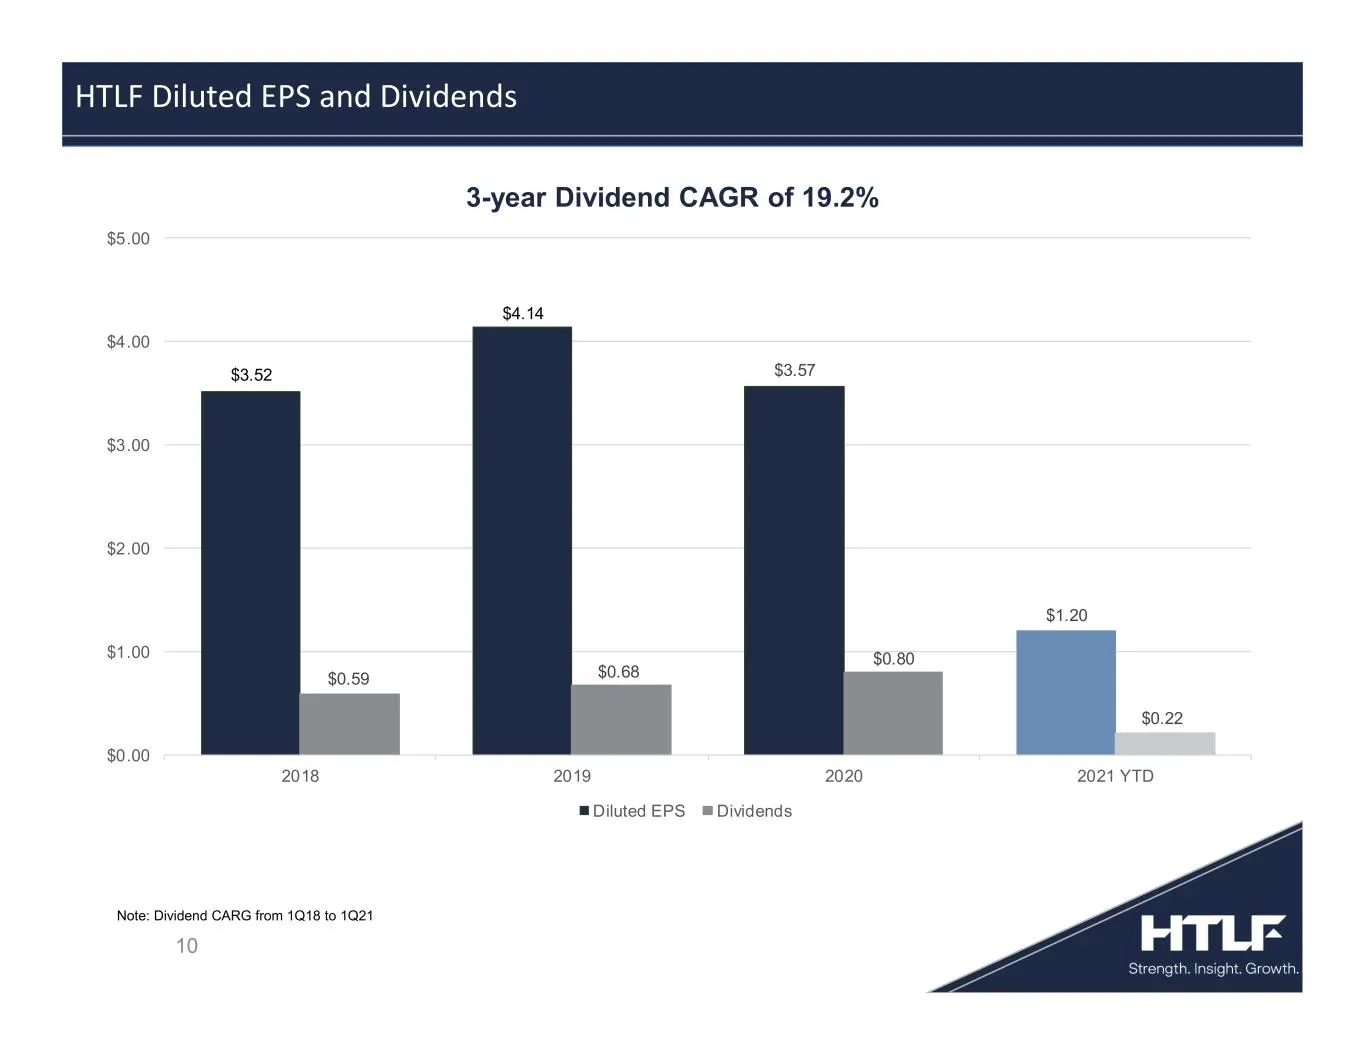
10 HTLF Diluted EPS and Dividends 3-year Dividend CAGR of 19.2% Note: Dividend CARG from 1Q18 to 1Q21 $3.52 $4.14 $3.57 $1.20 $0.59 $0.68 $0.80 $0.22 2018 2019 2020 2021 YTD $0.00 $1.00 $2.00 $3.00 $4.00 $5.00 Diluted EPS Dividends
Slide 11: Broad geographic footprint and decentralized structure
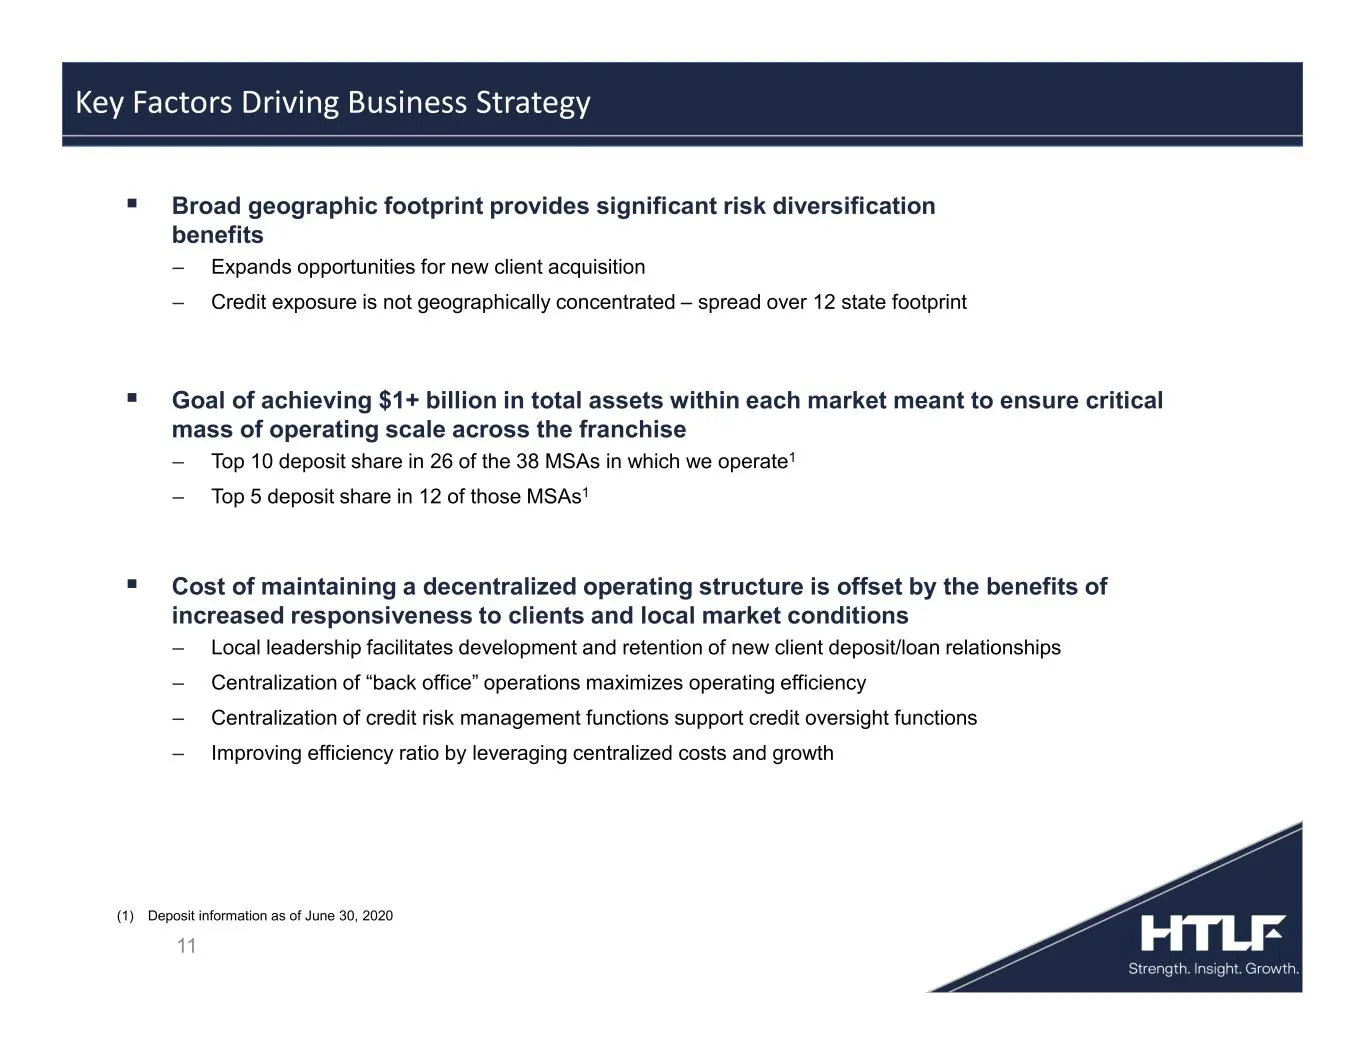
Broad geographic footprint provides significant risk diversification benefits ‒ Expands opportunities for new client acquisition ‒ Credit exposure is not geographically concentrated – spread over 12 state footprint Goal of achieving $1+ billion in total assets within each market meant to ensure
Slide 12: Covid-19 Pandemic Summary
12 Covid-19 Pandemic Summary
Slide 13: Customer Segment Profiles Affected by COVID-19
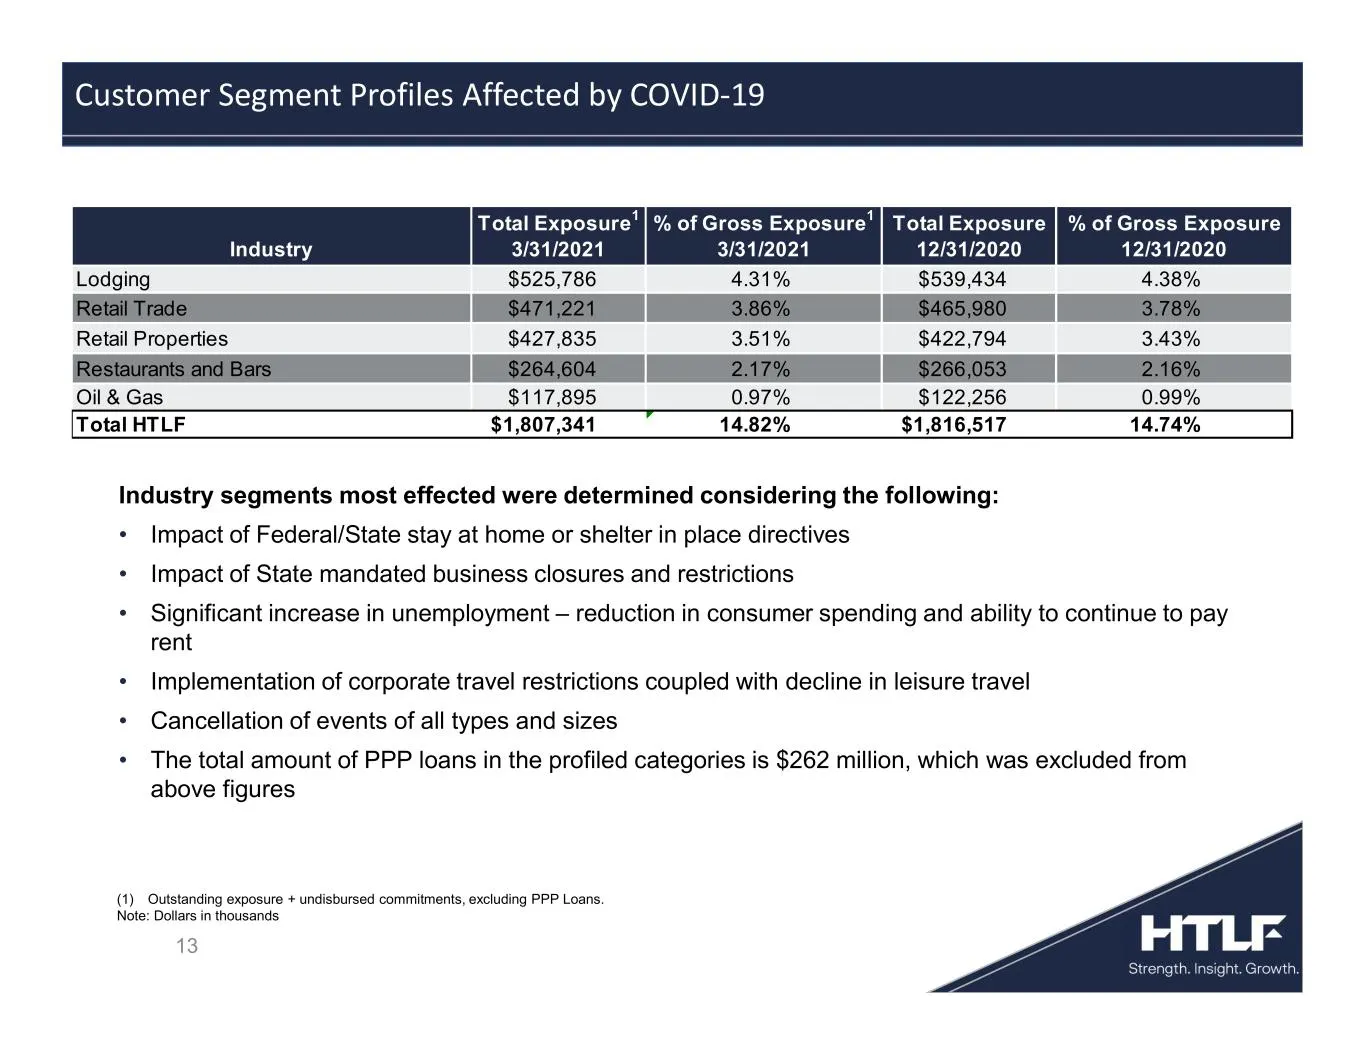
13 Industry segments most effected were determined considering the following: • Impact of Federal/State stay at home or shelter in place directives • Impact of State mandated business closures and restrictions • Significant increase in unemployment – reduction in consumer spending and ability to con
Slide 14: COVID Related Loan Modifications
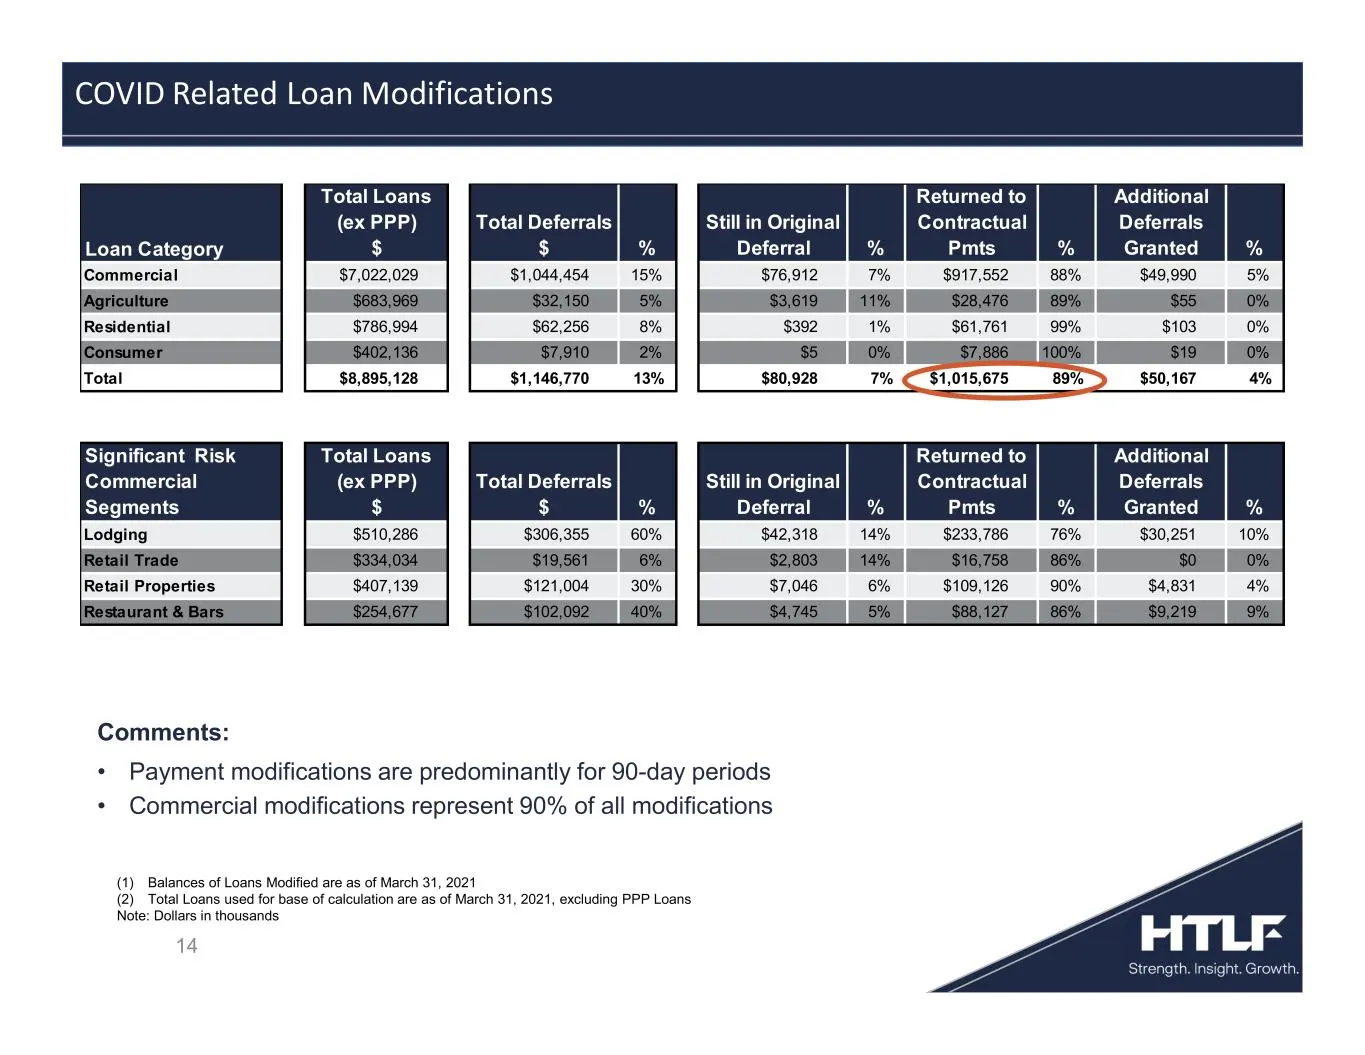
14 Comments: • Payment modifications are predominantly for 90-day periods • Commercial modifications represent 90% of all modifications COVID Related Loan Modifications (1) Balances of Loans Modified are as of March 31, 2021 (2) Total Loans used for base of calculation are as of March 31, 2021, excl
Slide 15: Lodging Portfolio Overview
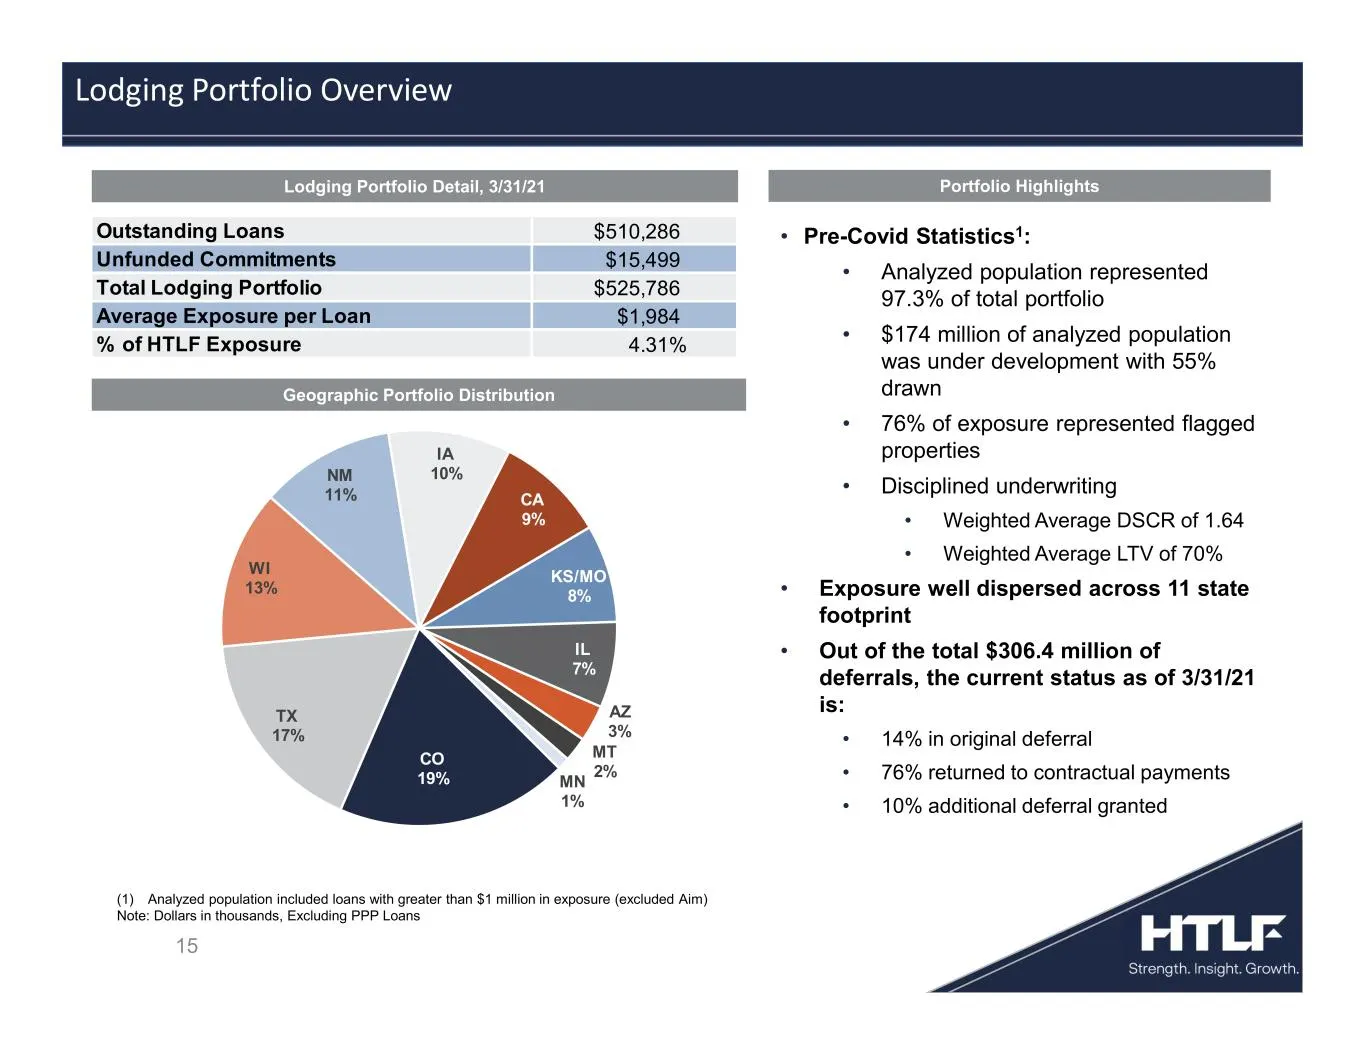
• Pre-Covid Statistics1: • Analyzed population represented 97.3% of total portfolio • $174 million of analyzed population was under development with 55% drawn • 76% of exposure represented flagged properties • Disciplined underwriting • Weighted Average DSCR of 1.64 • Weighted Average LTV of 70% • E
Slide 16: Restaurants & Bars Portfolio Overview
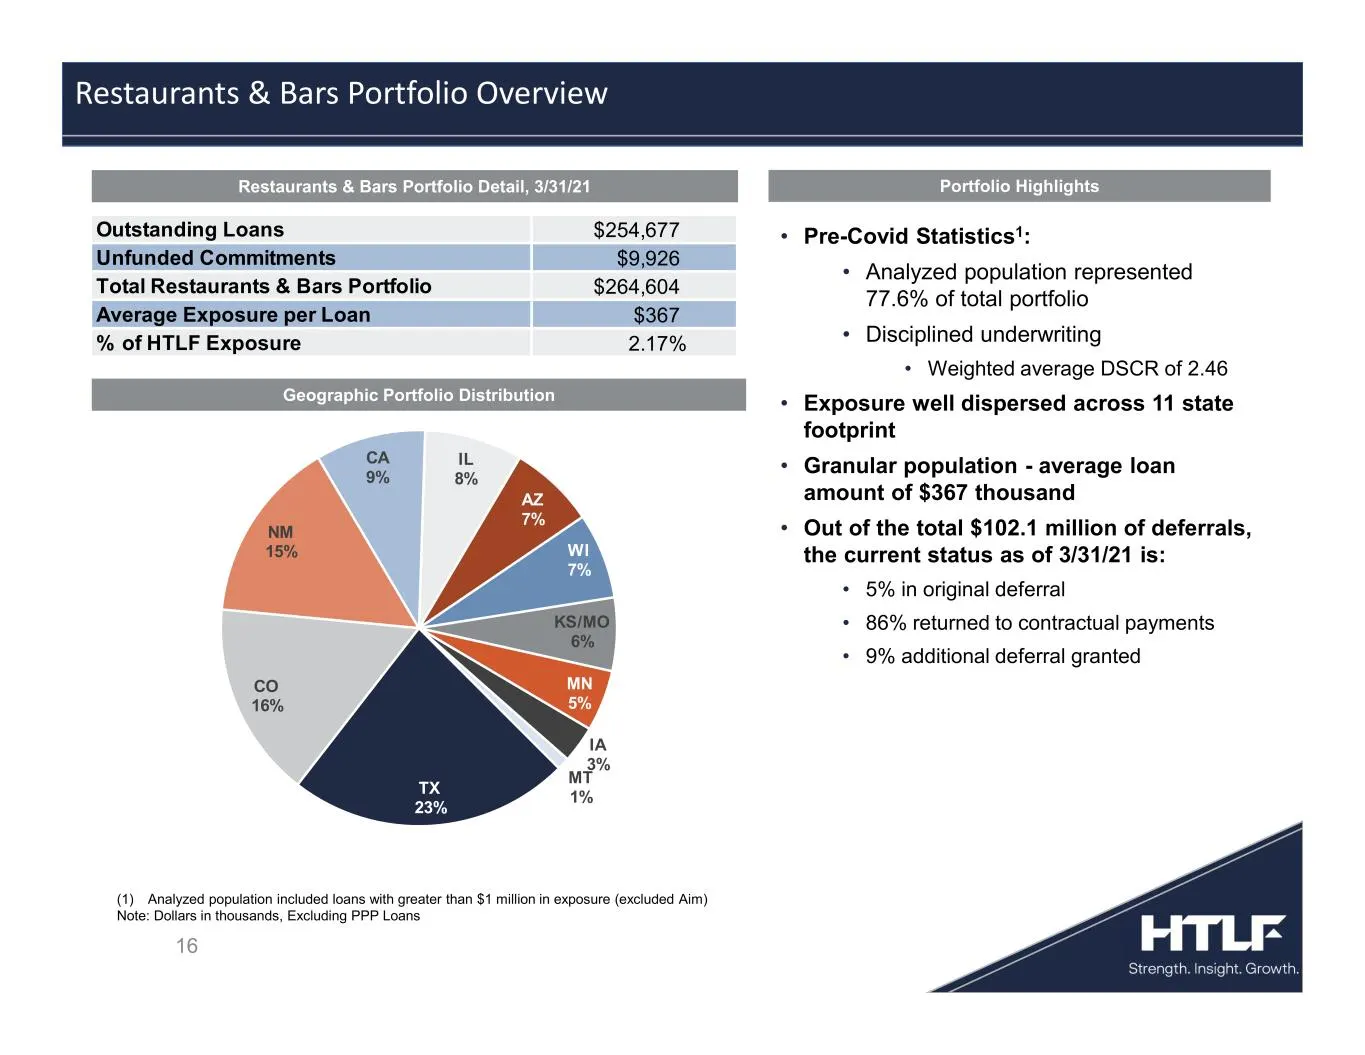
16 Restaurants & Bars Portfolio Overview (1) Analyzed population included loans with greater than $1 million in exposure (excluded Aim) Note: Dollars in thousands, Excluding PPP Loans Outstanding Loans $254,677 Unfunded Commitments $9,926 Total Restaurants & Bars Portfolio $264,604 Average Exposure
Slide 17: Current Participation Level In PPP Program
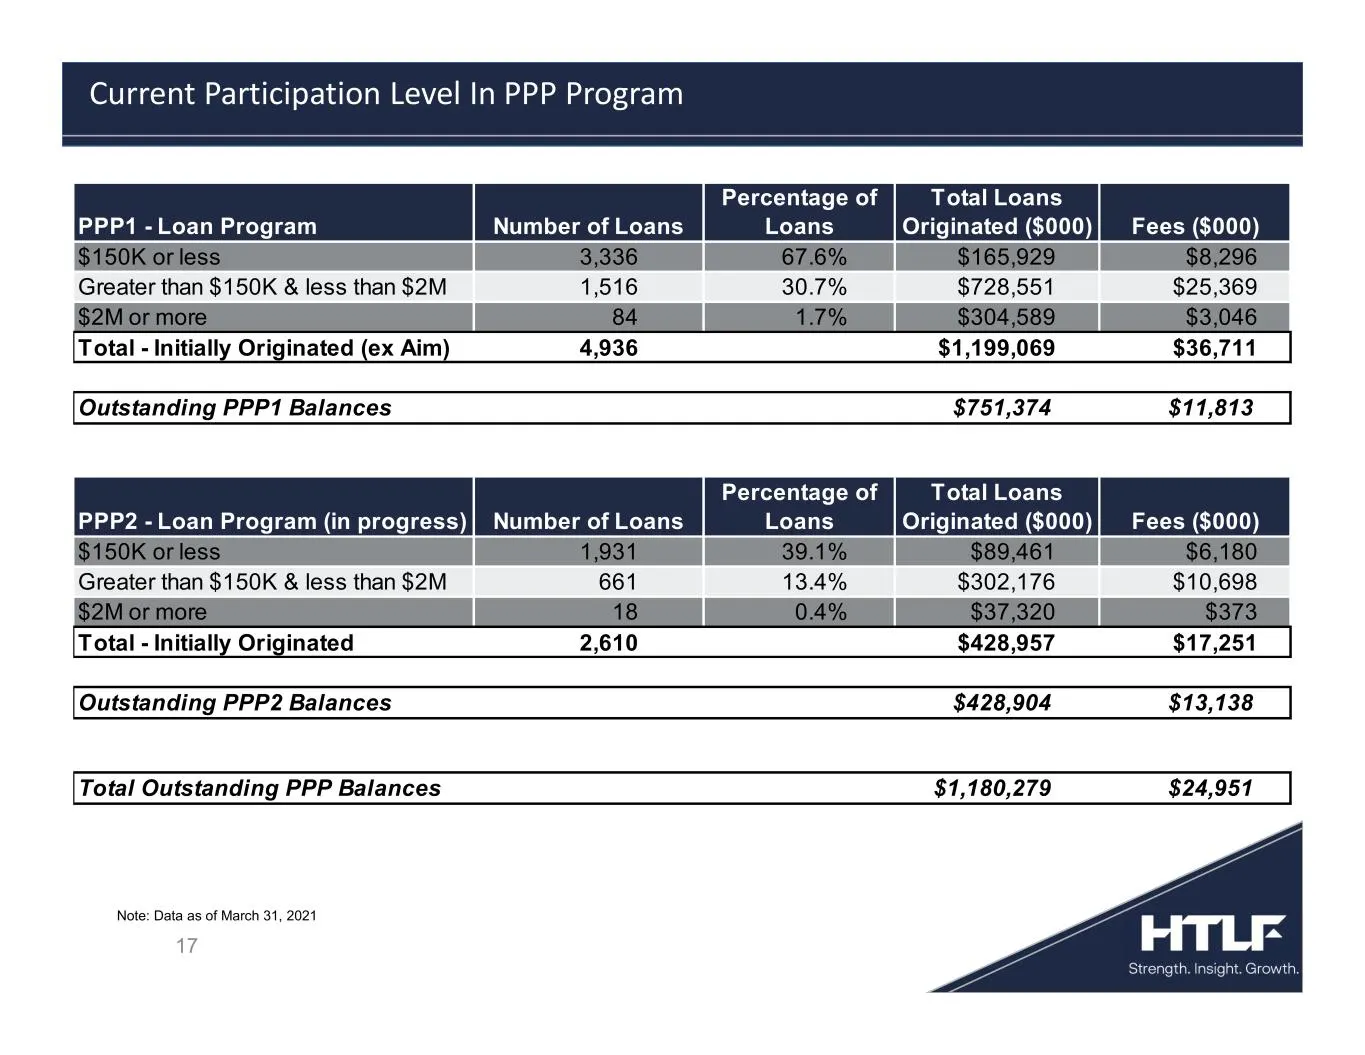
17 Current Participation Level In PPP Program Note: Data as of March 31, 2021 PPP1 - Loan Program Number of Loans Percentage of Loans Total Loans Originated ($000) Fees ($000) $150K or less 3,336 67.6% $165,929 $8,296 Greater than $150K & less than $2M 1,516 30.7% $728,551 $25,369 $2M or more 84 1.7
Slide 18: Financial Summary
18 Financial Summary
Slide 19: Summary Balance Sheet Items
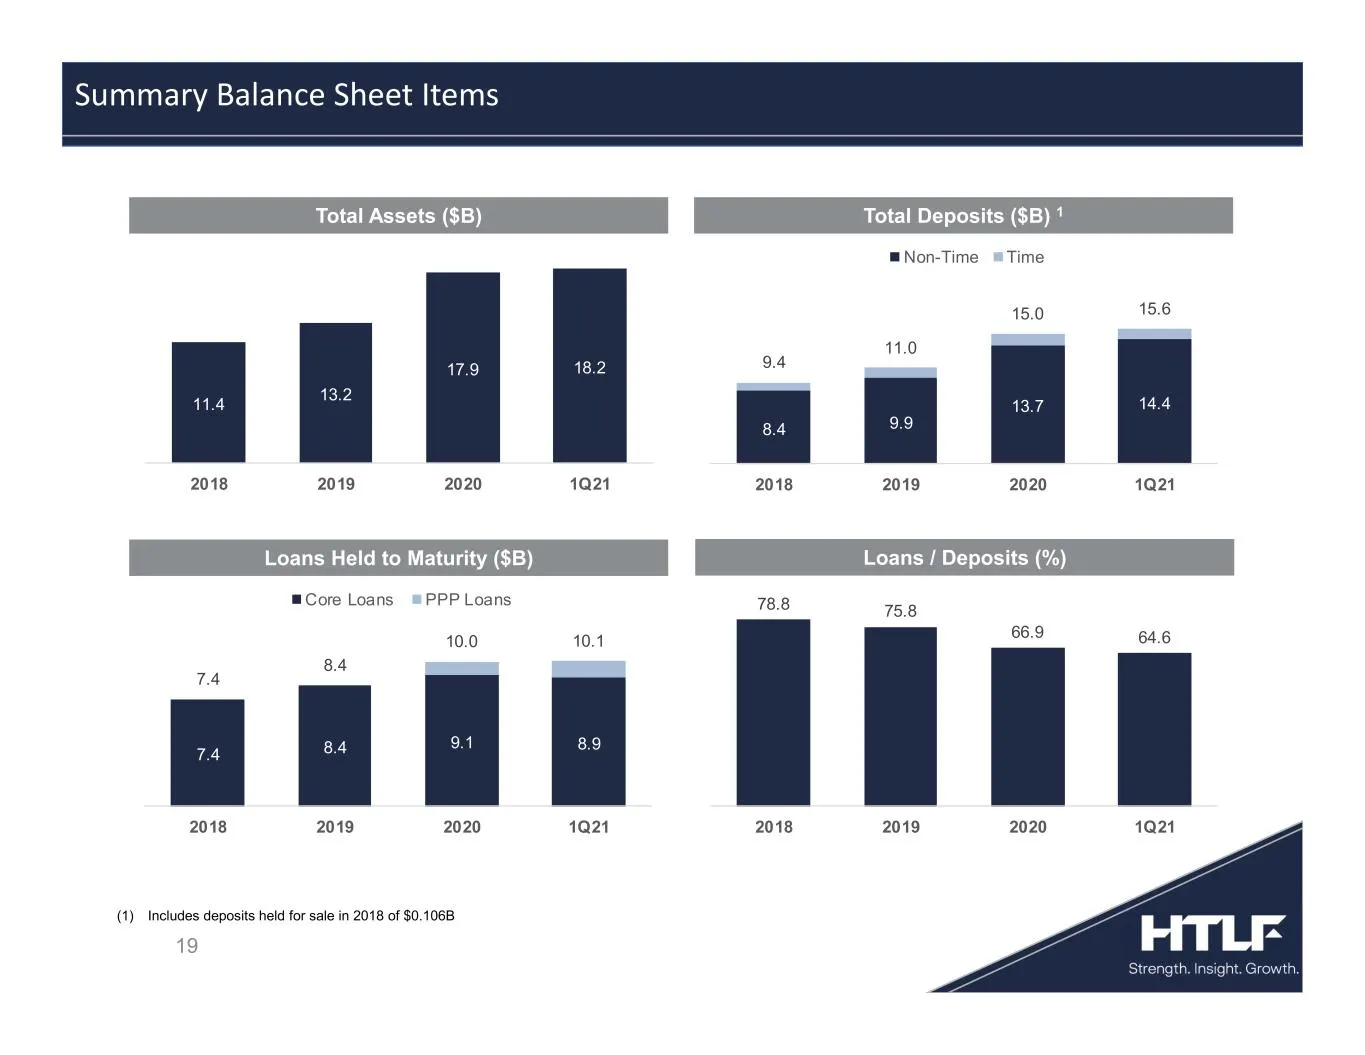
19 Total Assets ($B) Total Deposits ($B) 1 Loans Held to Maturity ($B) Loans / Deposits (%) Summary Balance Sheet Items (1) Includes deposits held for sale in 2018 of $0.106B 11.4 13.2 17.9 18.2 2018 2019 2020 1Q21 8.4 9.9 13.7 14.4 9.4 11.0 15.0 15.6 2018 2019 2020 1Q21 Non-Time Time 78.8 75.8 66.9
Slide 20: Summary Profitability Items
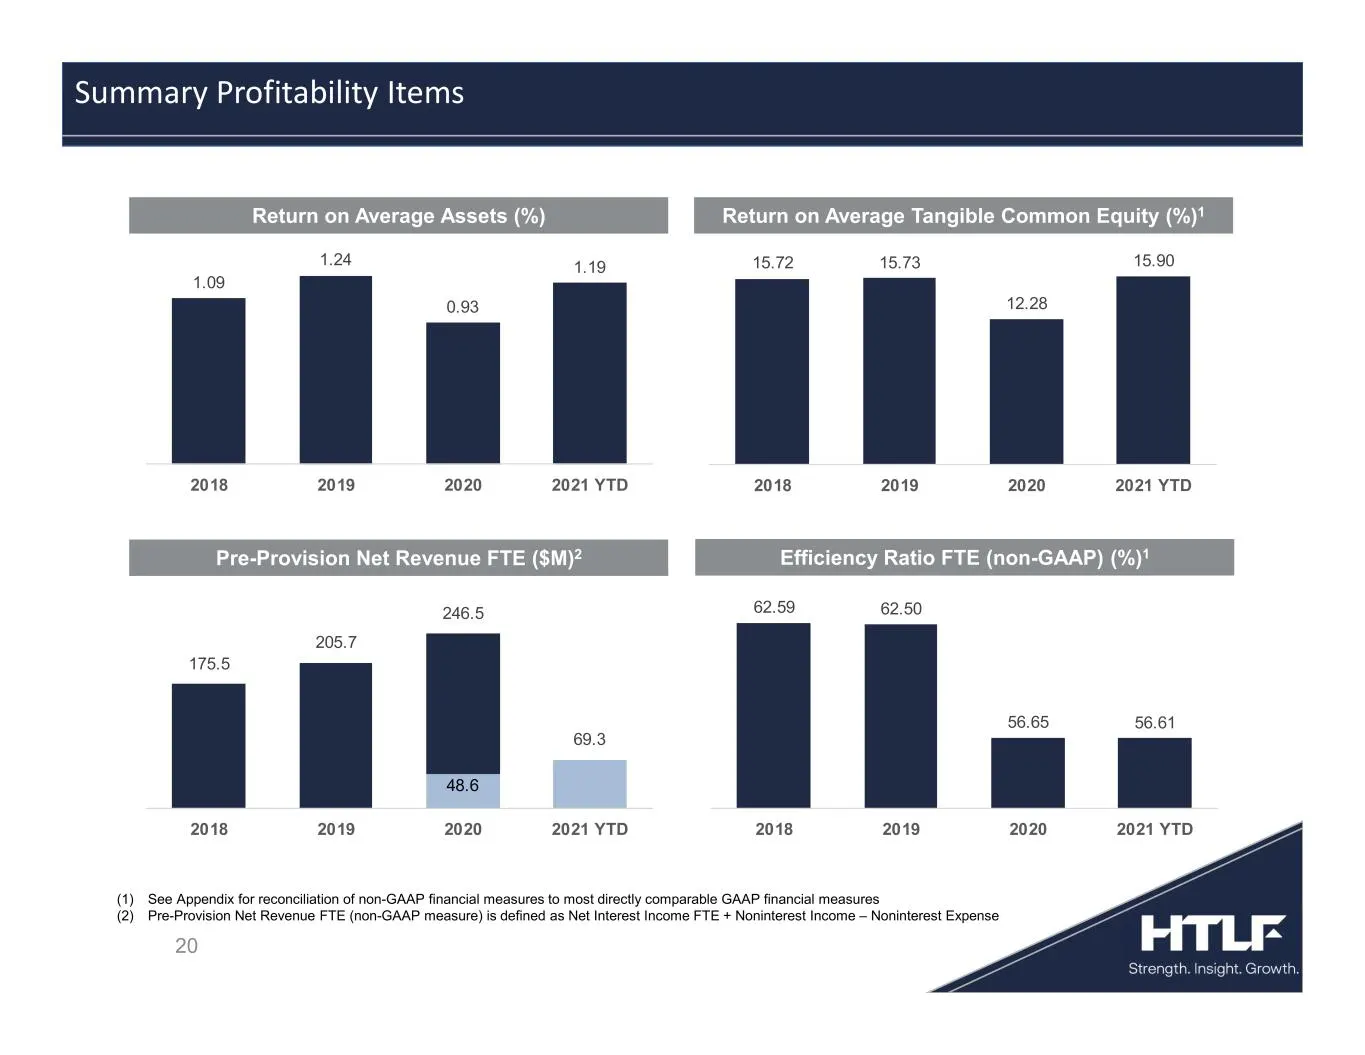
20 Summary Profitability Items (1) See Appendix for reconciliation of non-GAAP financial measures to most directly comparable GAAP financial measures (2) Pre-Provision Net Revenue FTE (non-GAAP measure) is defined as Net Interest Income FTE + Noninterest Income – Noninterest Expense 1.09 1.24 0.93 1
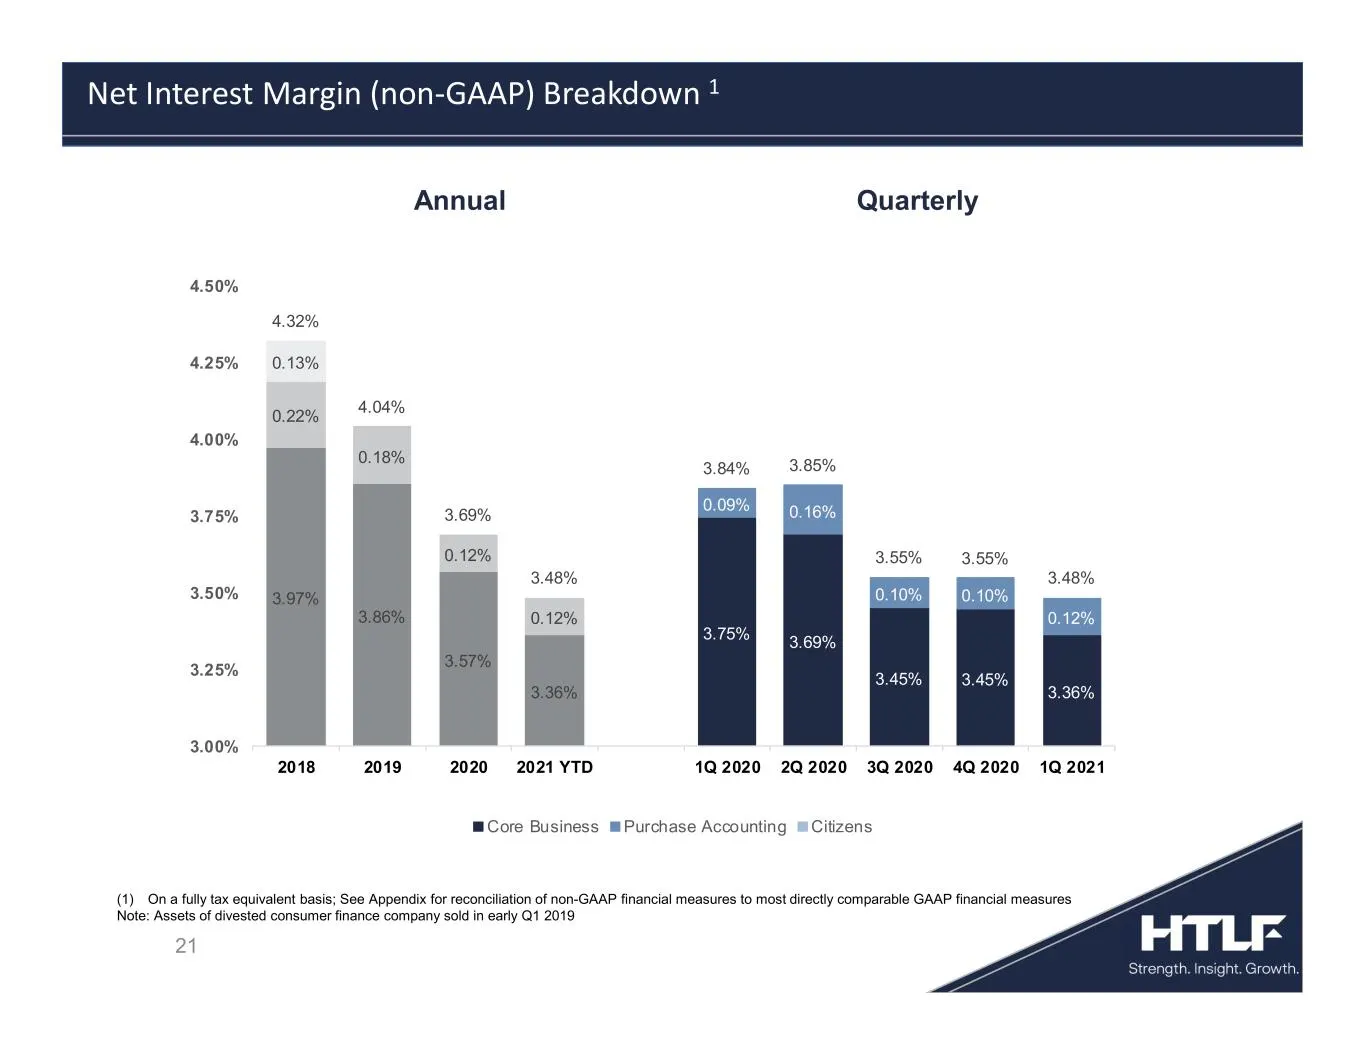
Slide 21: Net Interest Margin Breakdown
21 Net Interest Margin (non-GAAP) Breakdown 1 QuarterlyAnnual (1) On a fully tax equivalent basis; See Appendix for reconciliation of non-GAAP financial measures to most directly comparable GAAP financial measures Note: Assets of divested consumer finance company sold in early Q1 2019 3.97% 3.86% 3.
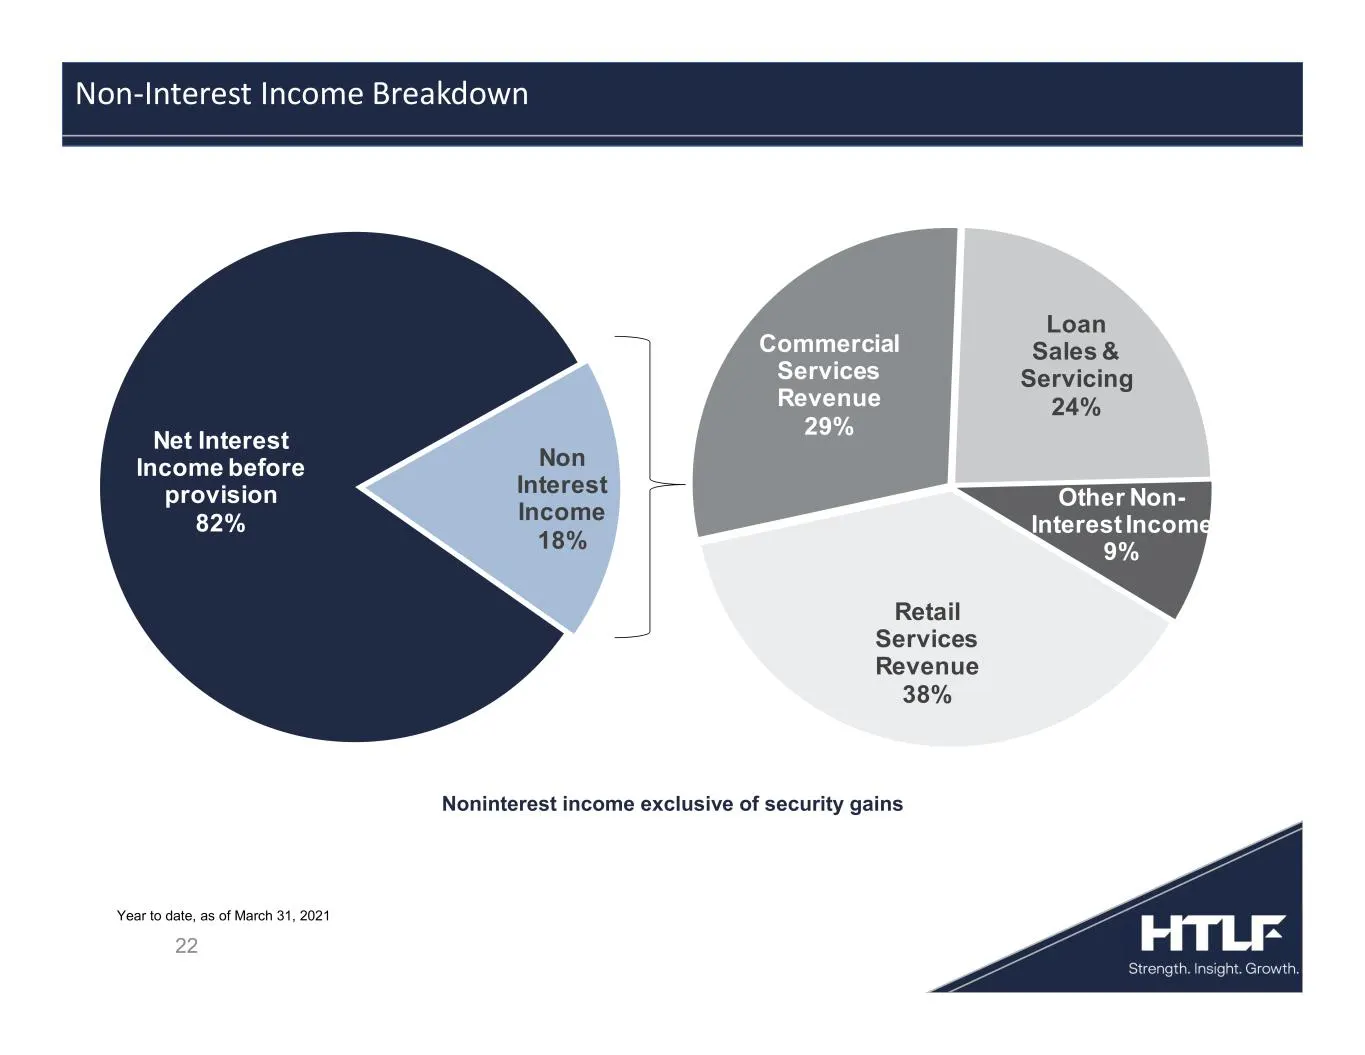
Slide 22: Non-Interest Income Breakdown
22 Noninterest income exclusive of security gains Non-Interest Income Breakdown Year to date, as of March 31, 2021 Net Interest Income before provision 82% Non Interest Income 18% Retail Services Revenue 38% Commercial Services Revenue 29% Loan Sales & Servicing 24% Other Non- Interest Income 9%
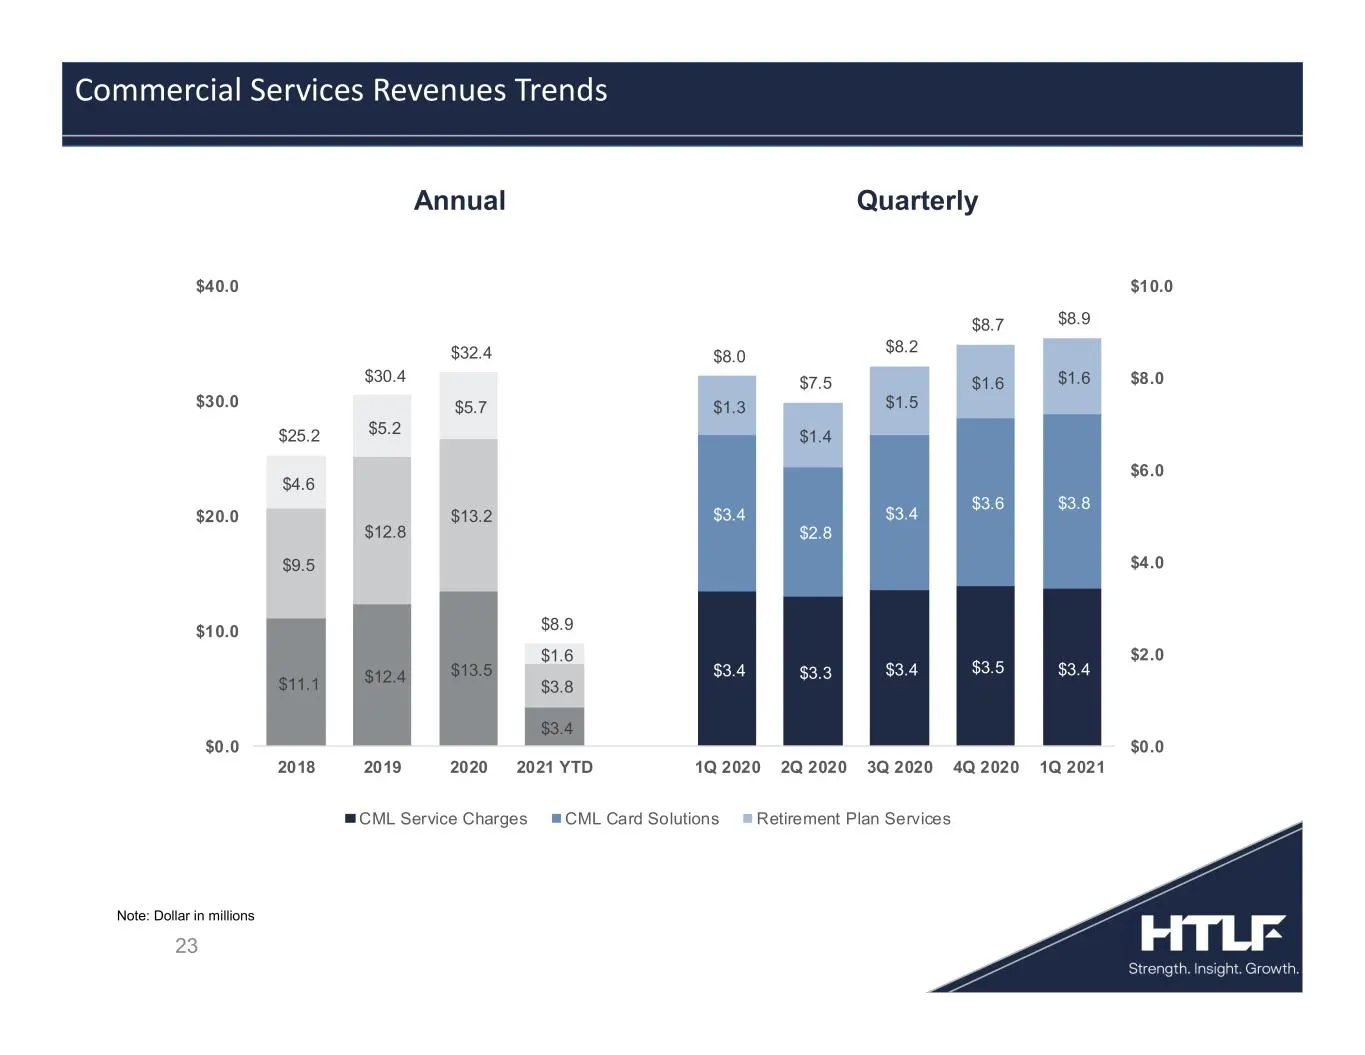
Slide 23: Commercial Services Revenues Trends
23 Commercial Services Revenues Trends Note: Dollar in millions $11.1 $12.4 $13.5 $3.4 $9.5 $12.8 $13.2 $3.8 $4.6 $5.2 $5.7 $1.6 $3.4 $3.3 $3.4 $3.5 $3.4 $3.4 $2.8 $3.4 $3.6 $3.8 $1.3 $1.4 $1.5 $1.6 $1.6 $25.2 $30.4 $32.4 $8.9 $8.0 $7.5 $8.2 $8.7 $8.9 $0.0 $2.0 $4.0 $6.0 $8.0 $10.0 $0.0 $10.0 $20.0
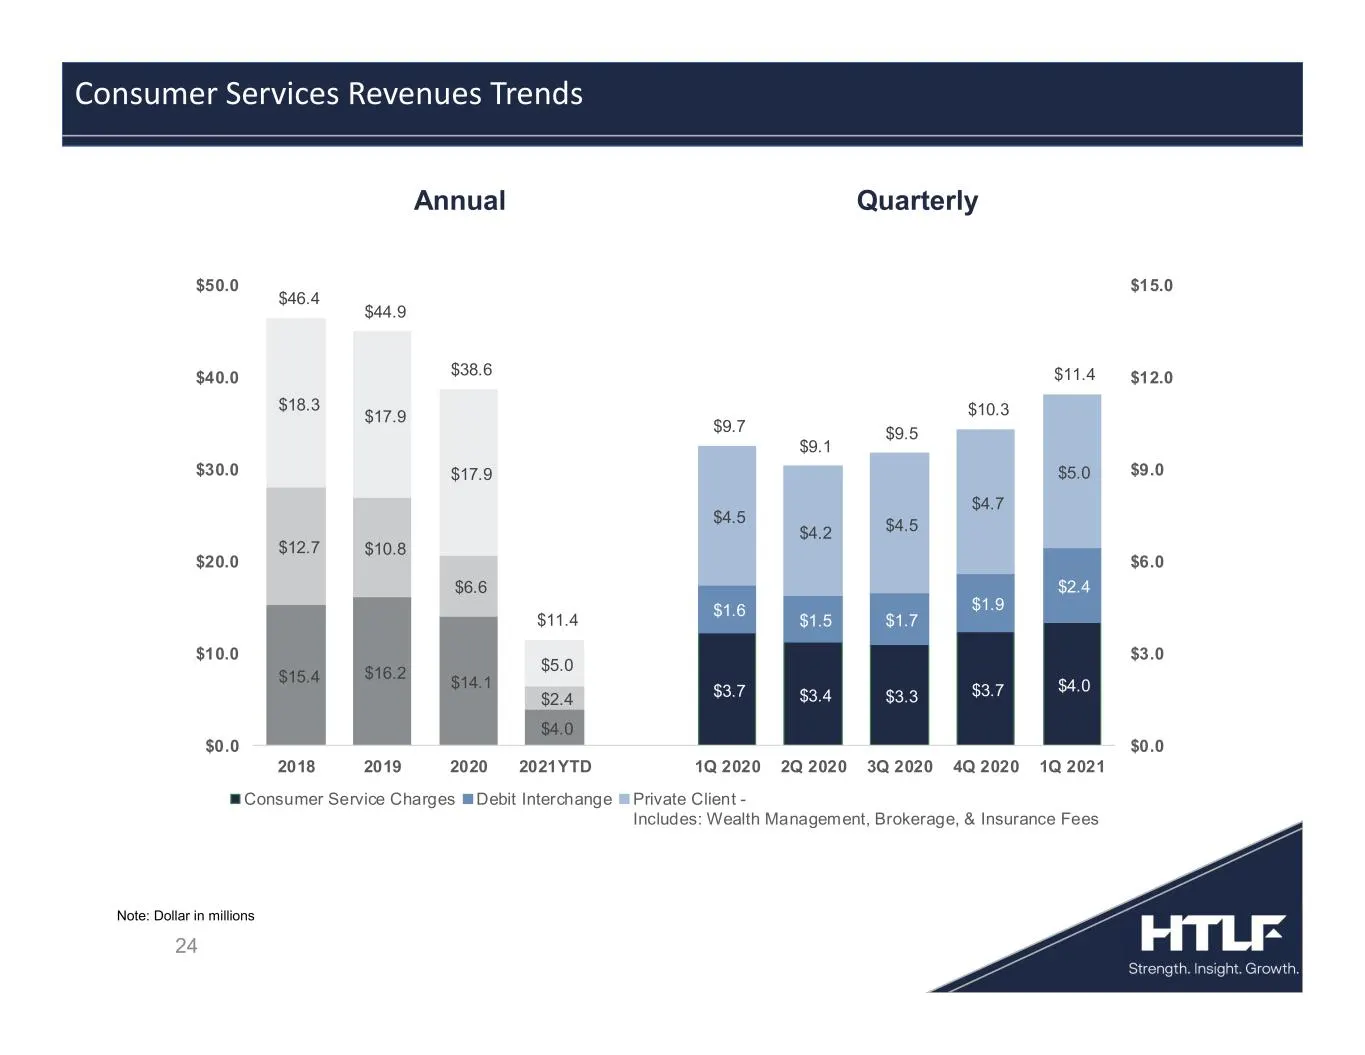
Slide 24: Consumer Services Revenues Trends
24 Consumer Services Revenues Trends Note: Dollar in millions $15.4 $16.2 $14.1 $4.0 $12.7 $10.8 $6.6 $2.4 $18.3 $17.9 $17.9 $5.0 $3.7 $3.4 $3.3 $3.7 $4.0 $1.6 $1.5 $1.7 $1.9 $2.4 $4.5 $4.2 $4.5 $4.7 $5.0 $46.4 $44.9 $38.6 $11.4 $9.7 $9.1 $9.5 $10.3 $11.4 $0.0 $3.0 $6.0 $9.0 $12.0 $15.0 $0.0 $10.0 $
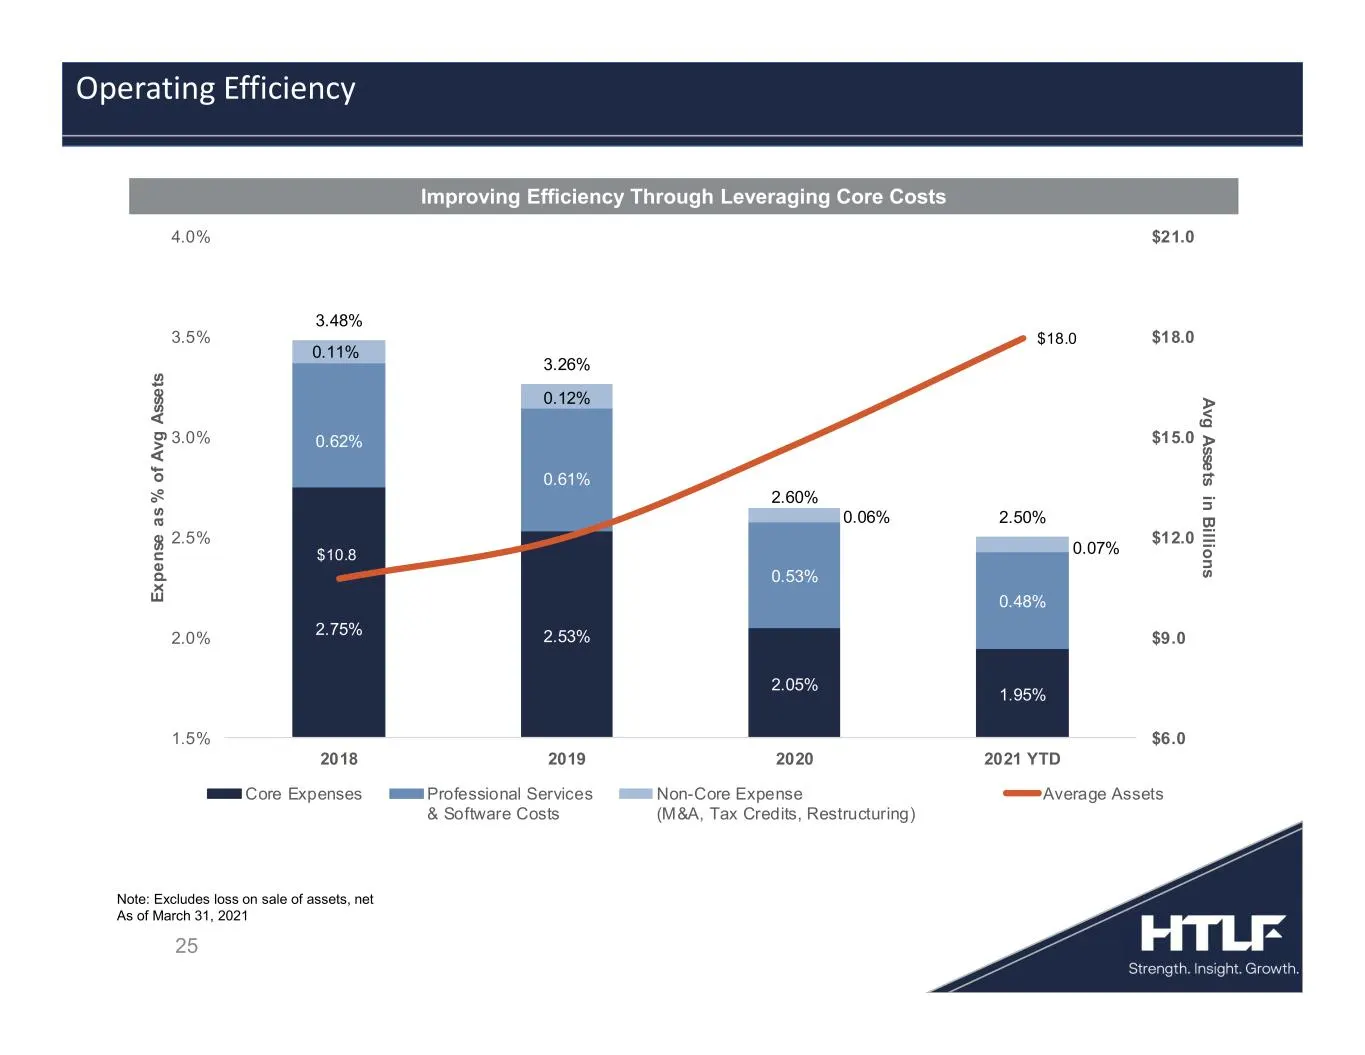
Slide 25: Improving Efficiency Through Leveraging Core Costs
Improving Efficiency Through Leveraging Core Costs 25 Operating Efficiency Note: Excludes loss on sale of assets, net As of March 31, 2021 2.75% 2.53% 2.05% 1.95% 0.62% 0.61% 0.53% 0.48% 0.11% 0.12% 0.06% 0.07% 3.48% 3.26% 2.60% 2.50% $10.8 $18.0 $6.0 $9.0 $12.0 $15.0 $18.0 $21.0 1.5% 2.0% 2.5% 3.0%
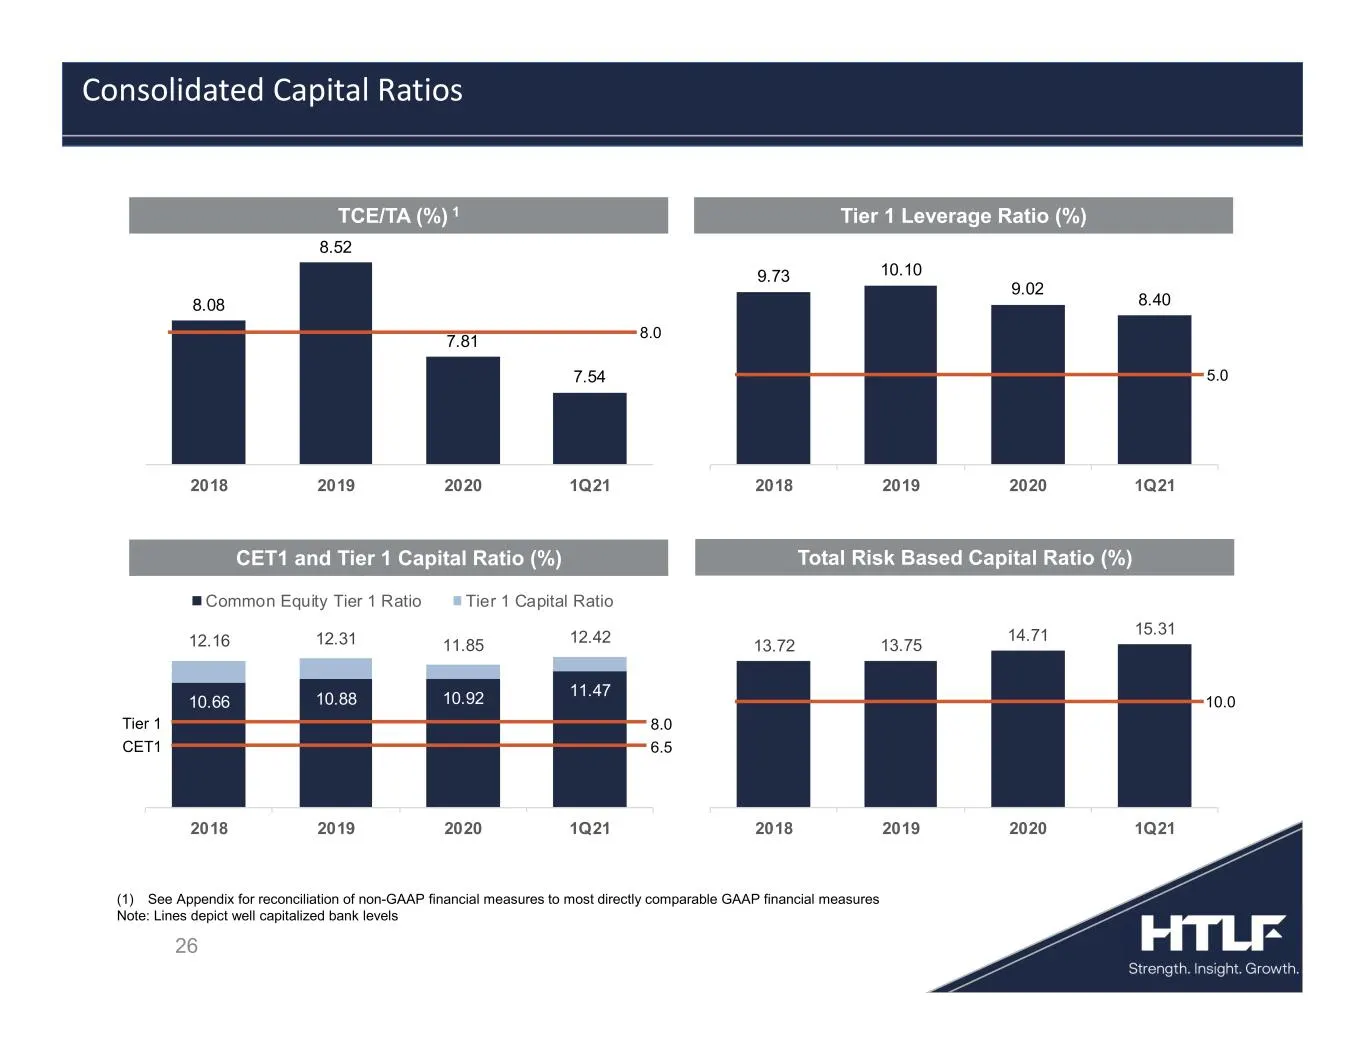
Slide 26: Consolidated Capital Ratios
8.08 8.52 7.81 7.54 2018 2019 2020 1Q21 9.73 10.10 9.02 8.40 2018 2019 2020 1Q21 10.66 10.88 10.92 11.47 12.16 12.31 11.85 12.42 2018 2019 2020 1Q21 Common Equity Tier 1 Ratio Tier 1 Capital Ratio 13.72 13.75 14.71 15.31 2018 2019 2020 1Q21 26 Consolidated Capital Ratios Tier 1 CET1 10.0 8.0 8.0 6.5
Slide 27: Loan Portfolio and Asset Quality
27 Loan Portfolio and Asset Quality
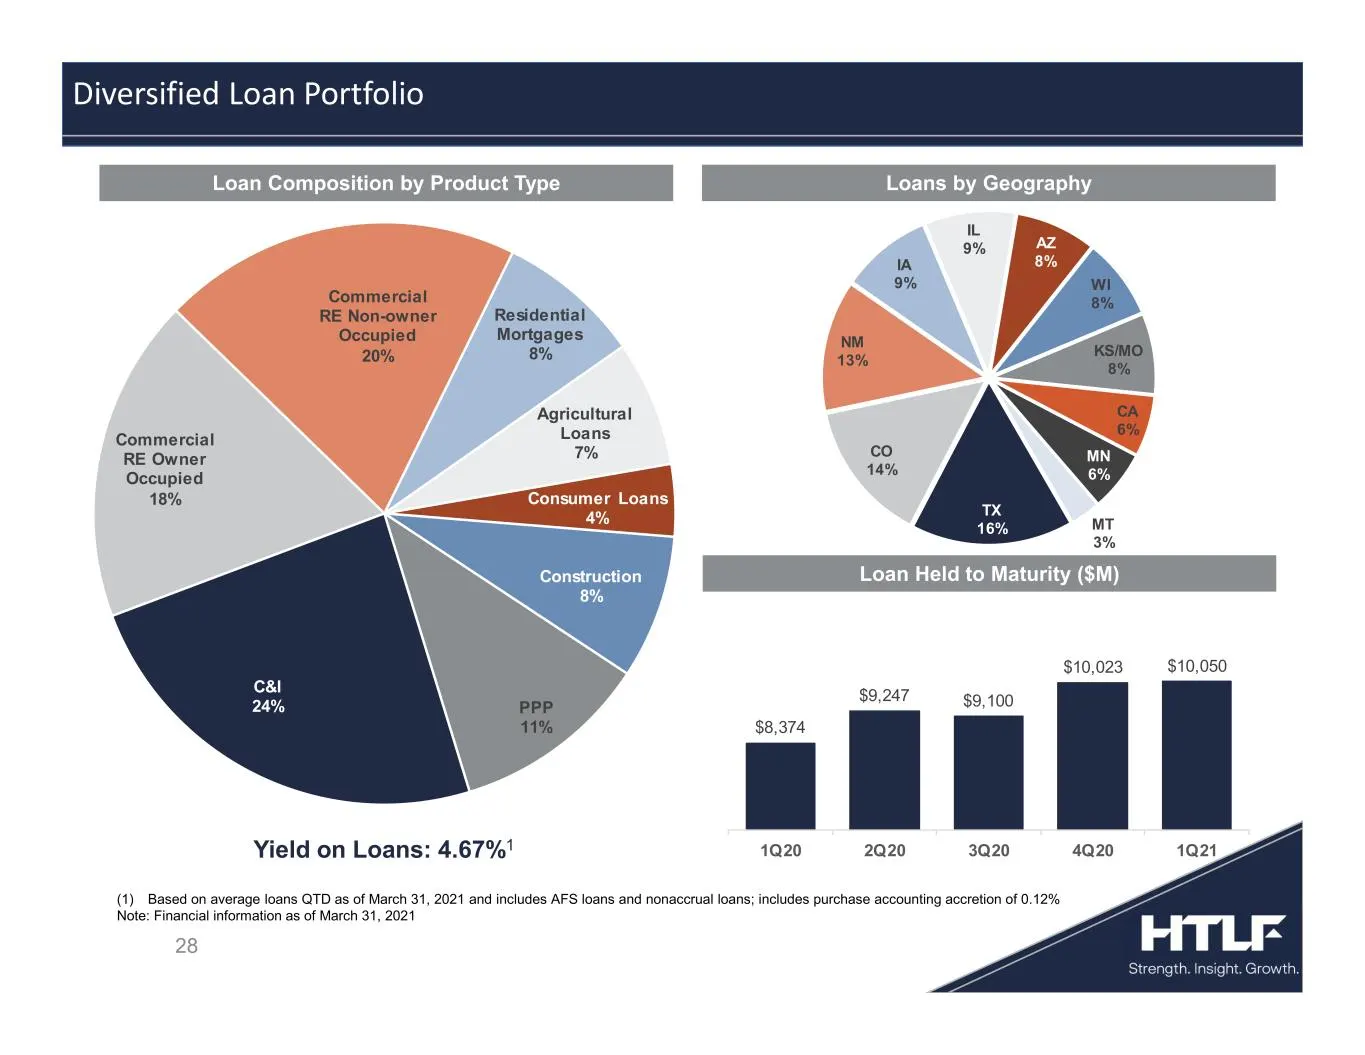
Slide 28: Diversified Loan Portfolio
28 Loan Composition by Product Type Loans by Geography Loan Held to Maturity ($M) Diversified Loan Portfolio (1) Based on average loans QTD as of March 31, 2021 and includes AFS loans and nonaccrual loans; includes purchase accounting accretion of 0.12% Note: Financial information as of March 31, 20
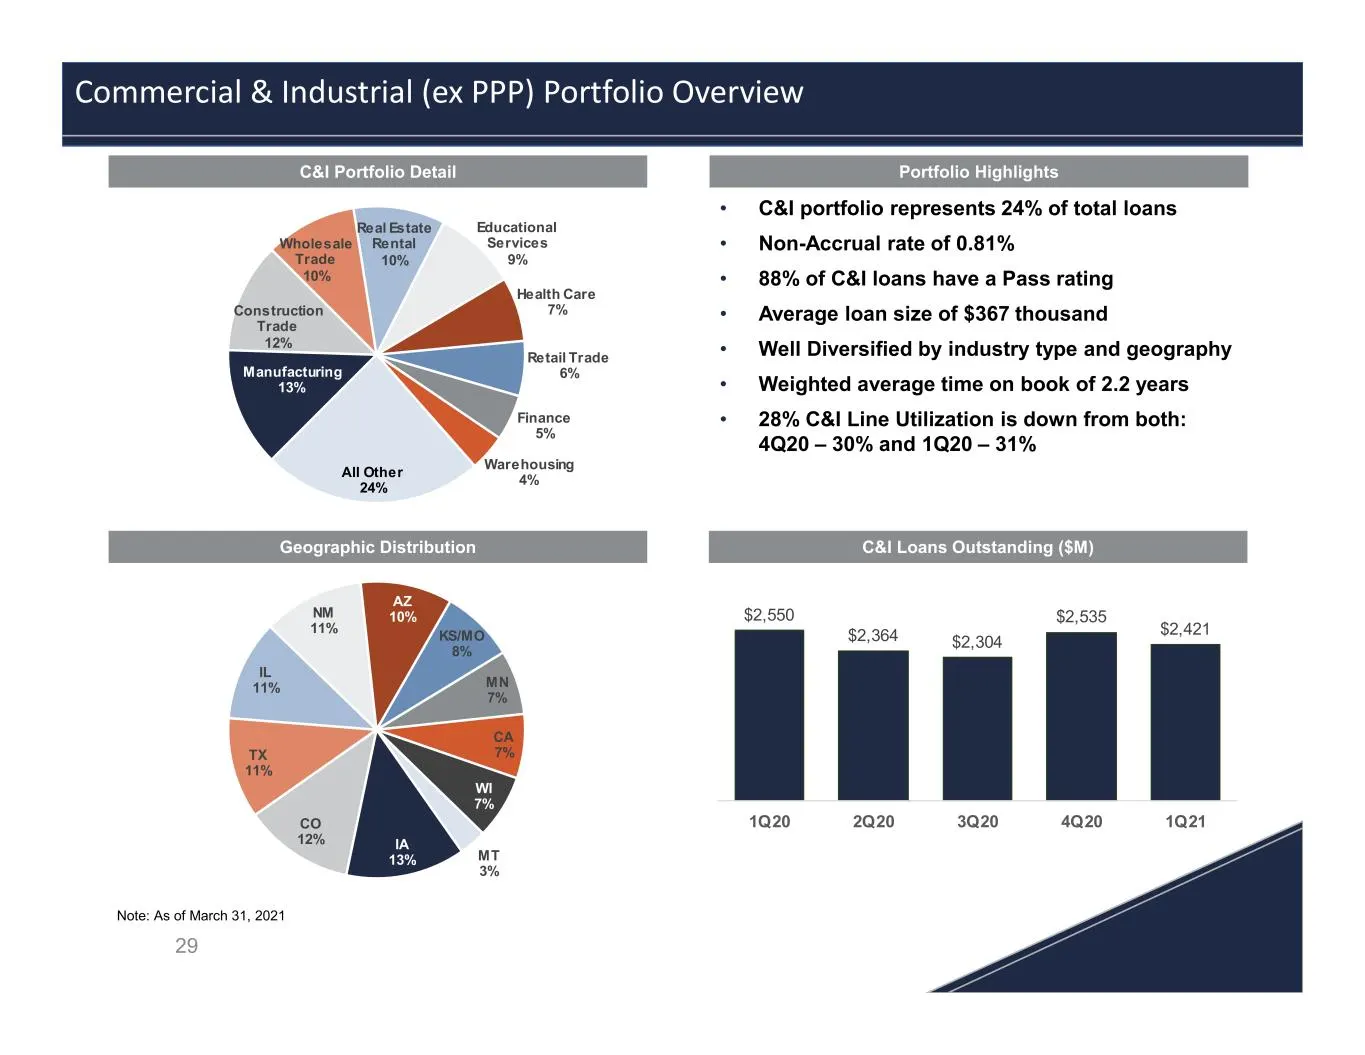
Slide 29: Commercial & Industrial Portfolio Overview
• C&I portfolio represents 24% of total loans • Non-Accrual rate of 0.81% • 88% of C&I loans have a Pass rating • Average loan size of $367 thousand • Well Diversified by industry type and geography • Weighted average time on book of 2.2 years • 28% C&I Line Utilization is down from both: 4Q20 – 30%
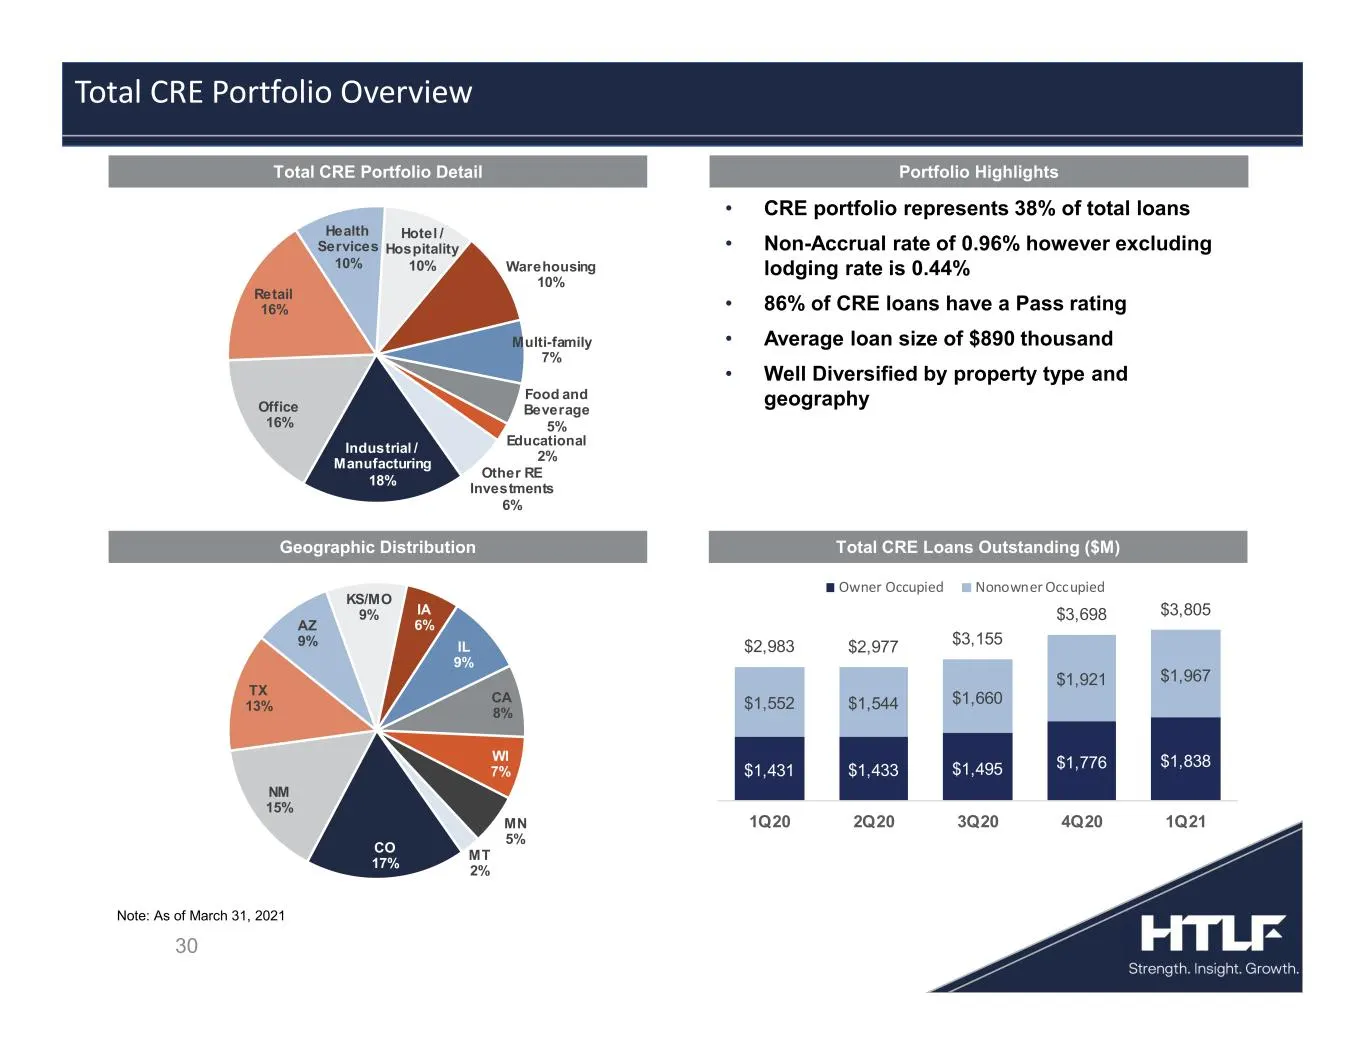
Slide 30: Total CRE Portfolio Overview
• CRE portfolio represents 38% of total loans • Non-Accrual rate of 0.96% however excluding lodging rate is 0.44% • 86% of CRE loans have a Pass rating • Average loan size of $890 thousand • Well Diversified by property type and geography 30 Total CRE Portfolio Overview Note: As of March 31, 2021 $1
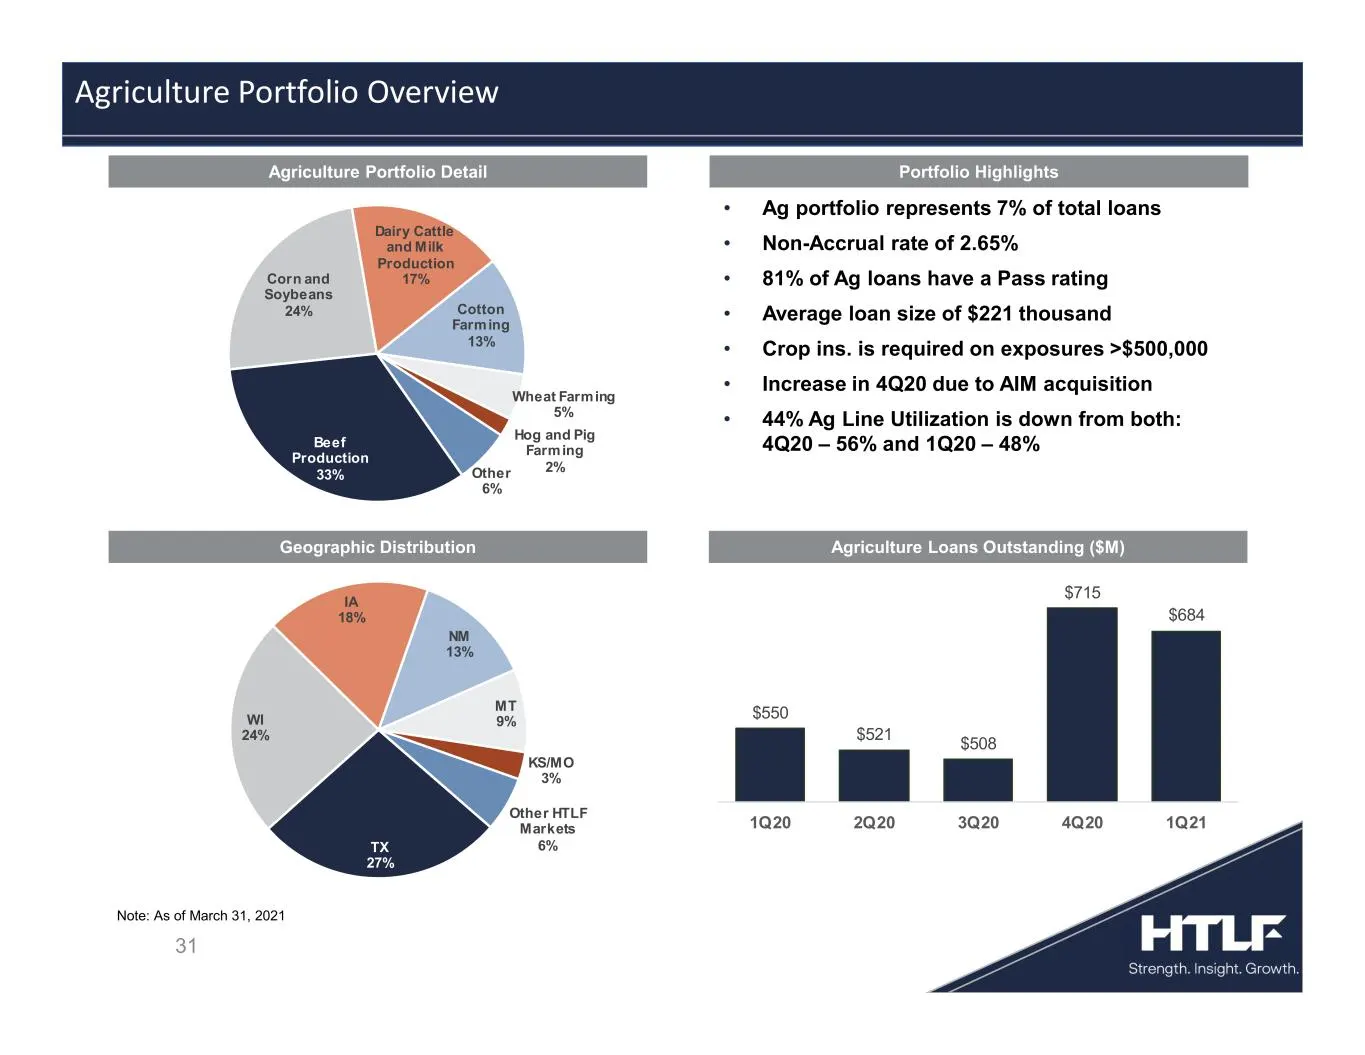
Slide 31: Agriculture Portfolio Overview
• Ag portfolio represents 7% of total loans • Non-Accrual rate of 2.65% • 81% of Ag loans have a Pass rating • Average loan size of $221 thousand • Crop ins. is required on exposures >$500,000 • Increase in 4Q20 due to AIM acquisition • 44% Ag Line Utilization is down from both: 4Q20 – 56% and 1Q20
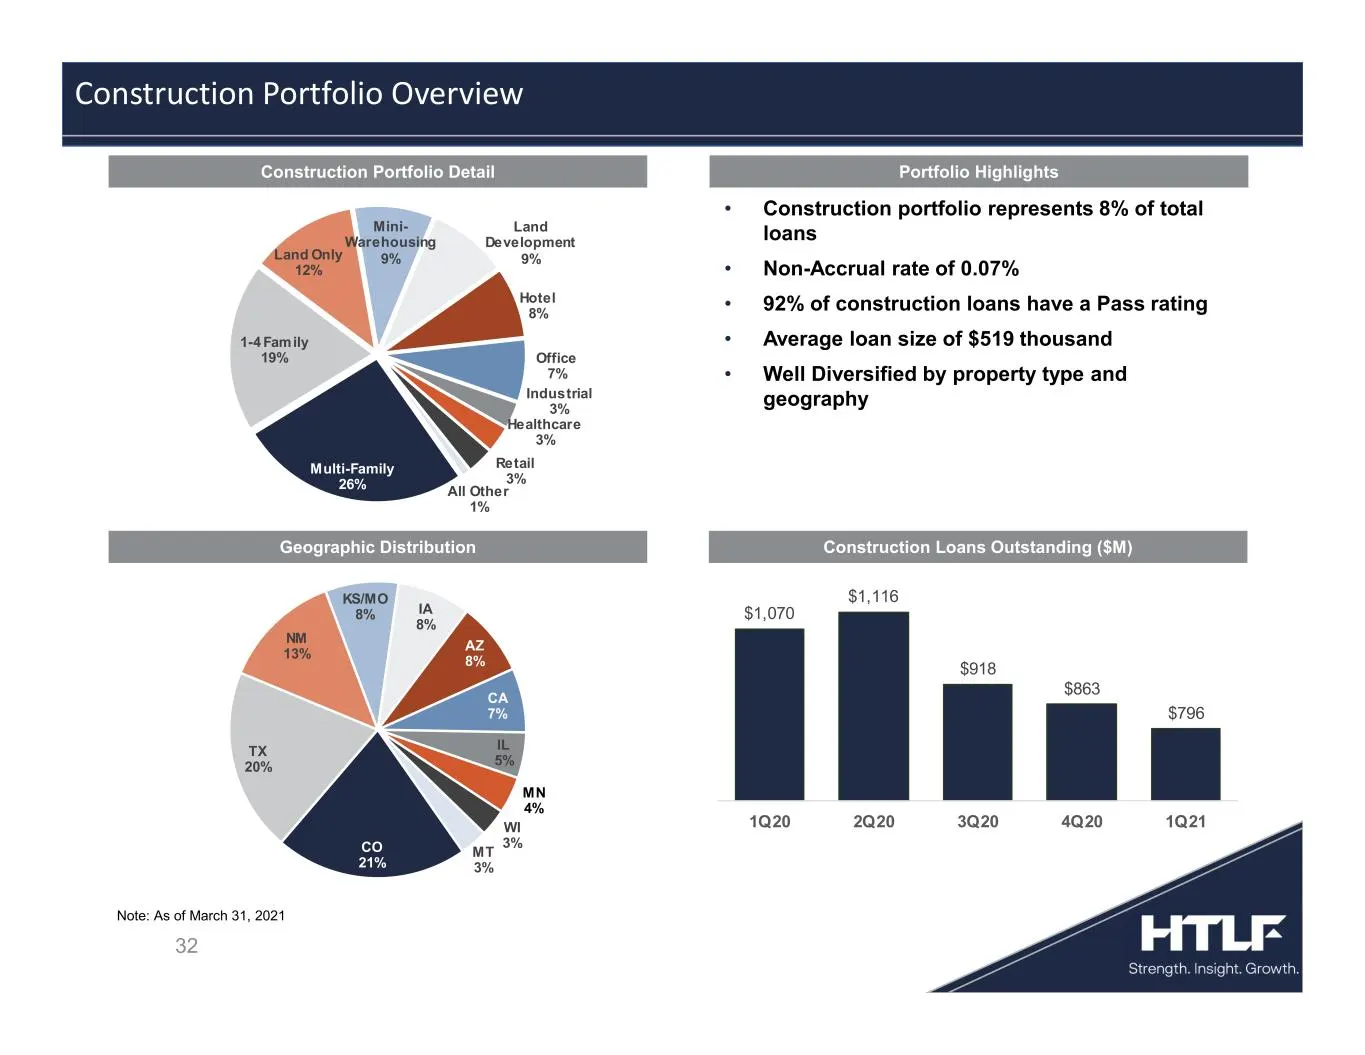
Slide 32: Construction Portfolio Overview
Portfolio HighlightsConstruction Portfolio Detail • Construction portfolio represents 8% of total loans • Non-Accrual rate of 0.07% • 92% of construction loans have a Pass rating • Average loan size of $519 thousand • Well Diversified by property type and geography Geographic Distribution Constructi
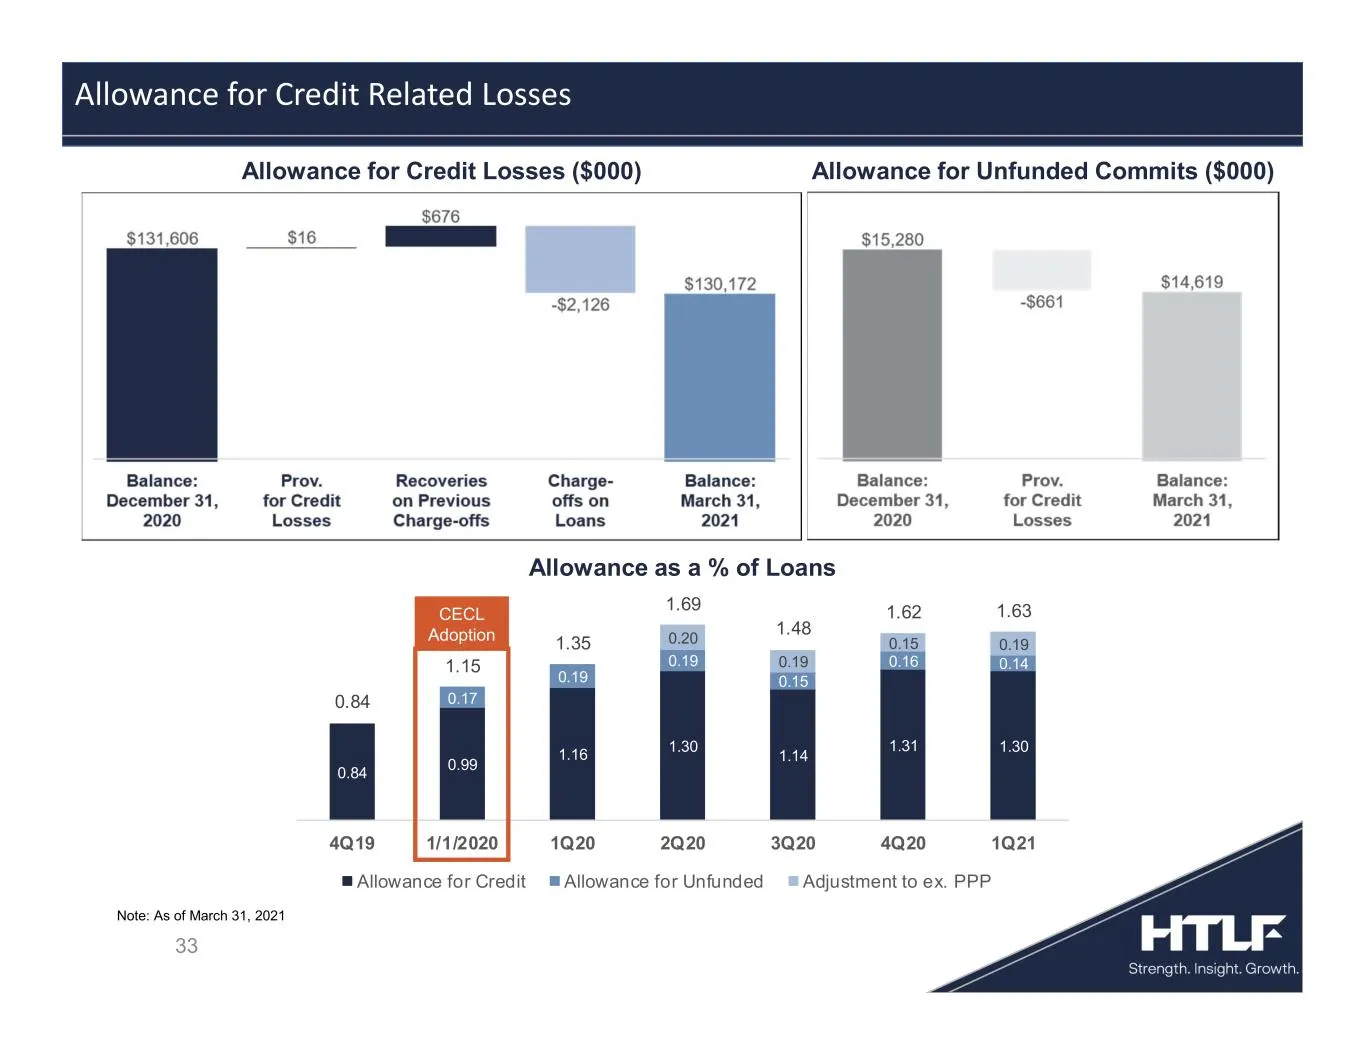
Slide 33: Allowance for Credit Related Losses
33 Allowance for Credit Related Losses Allowance as a % of Loans Allowance for Credit Losses ($000) Note: As of March 31, 2021 Allowance for Unfunded Commits ($000) 0.84 1.15 1.35 1.69 1.48 1.62 1.63 0.84 0.99 1.16 1.30 1.14 1.31 1.30 0.17 0.19 0.19 0.15 0.16 0.14 0.20 0.19 0.15 0.19 4Q19 1/1/2020 1
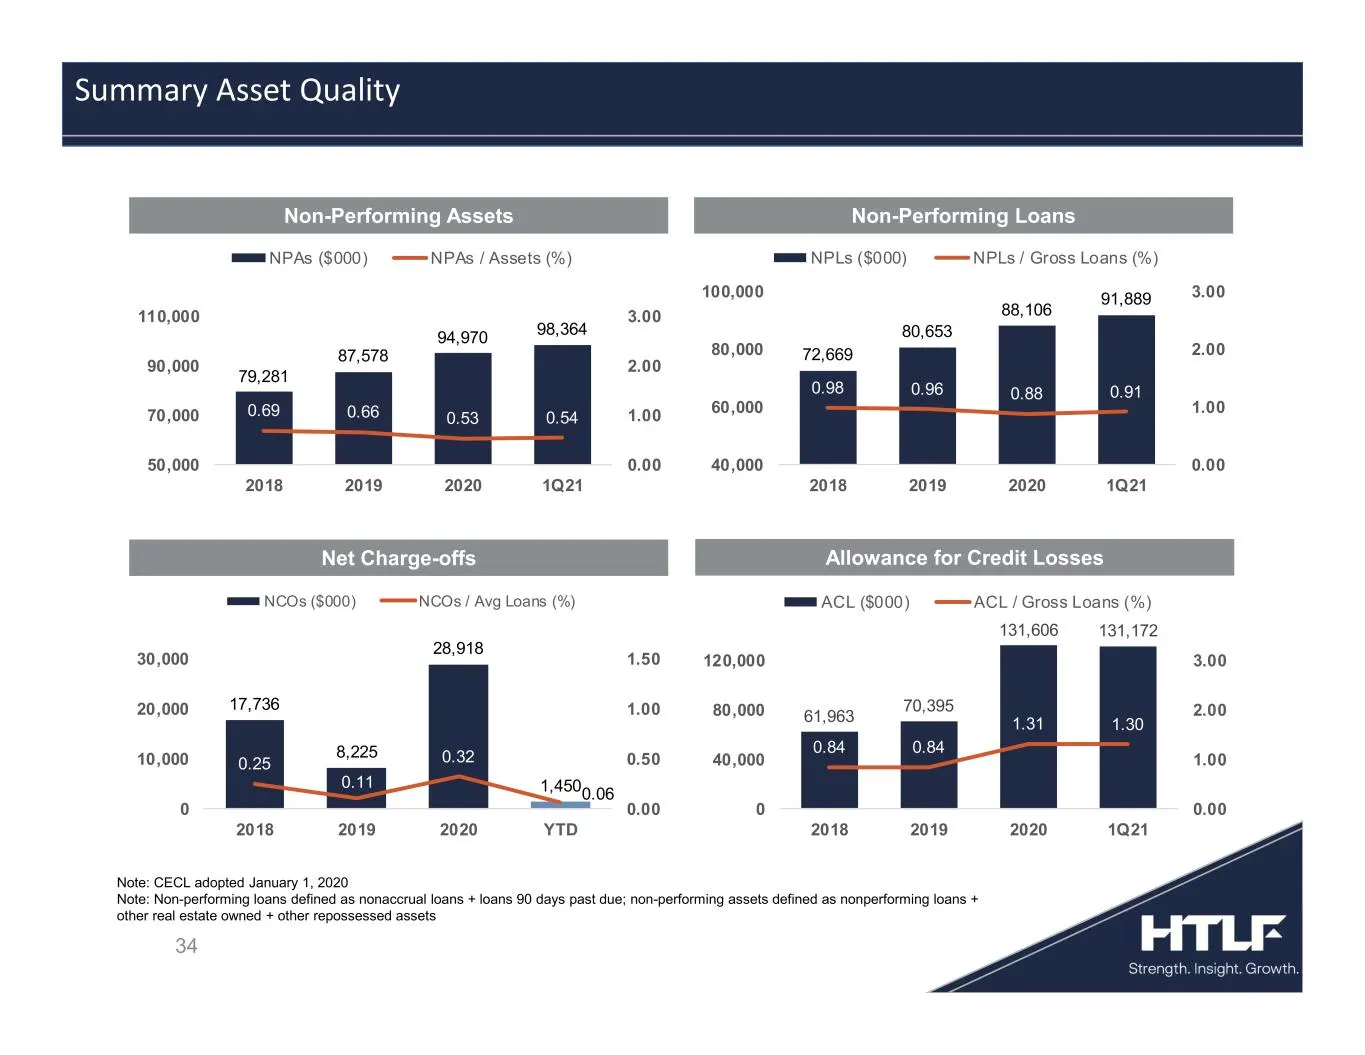
Slide 34: Summary Asset Quality
34 Summary Asset Quality Note: CECL adopted January 1, 2020 Note: Non-performing loans defined as nonaccrual loans + loans 90 days past due; non-performing assets defined as nonperforming loans + other real estate owned + other repossessed assets 72,669 80,653 88,106 91,889 0.98 0.96 0.88 0.91 0.00
Slide 35: Liquidity, Investments, Funding and Capital
35 Liquidity, Investments, Funding and Capital
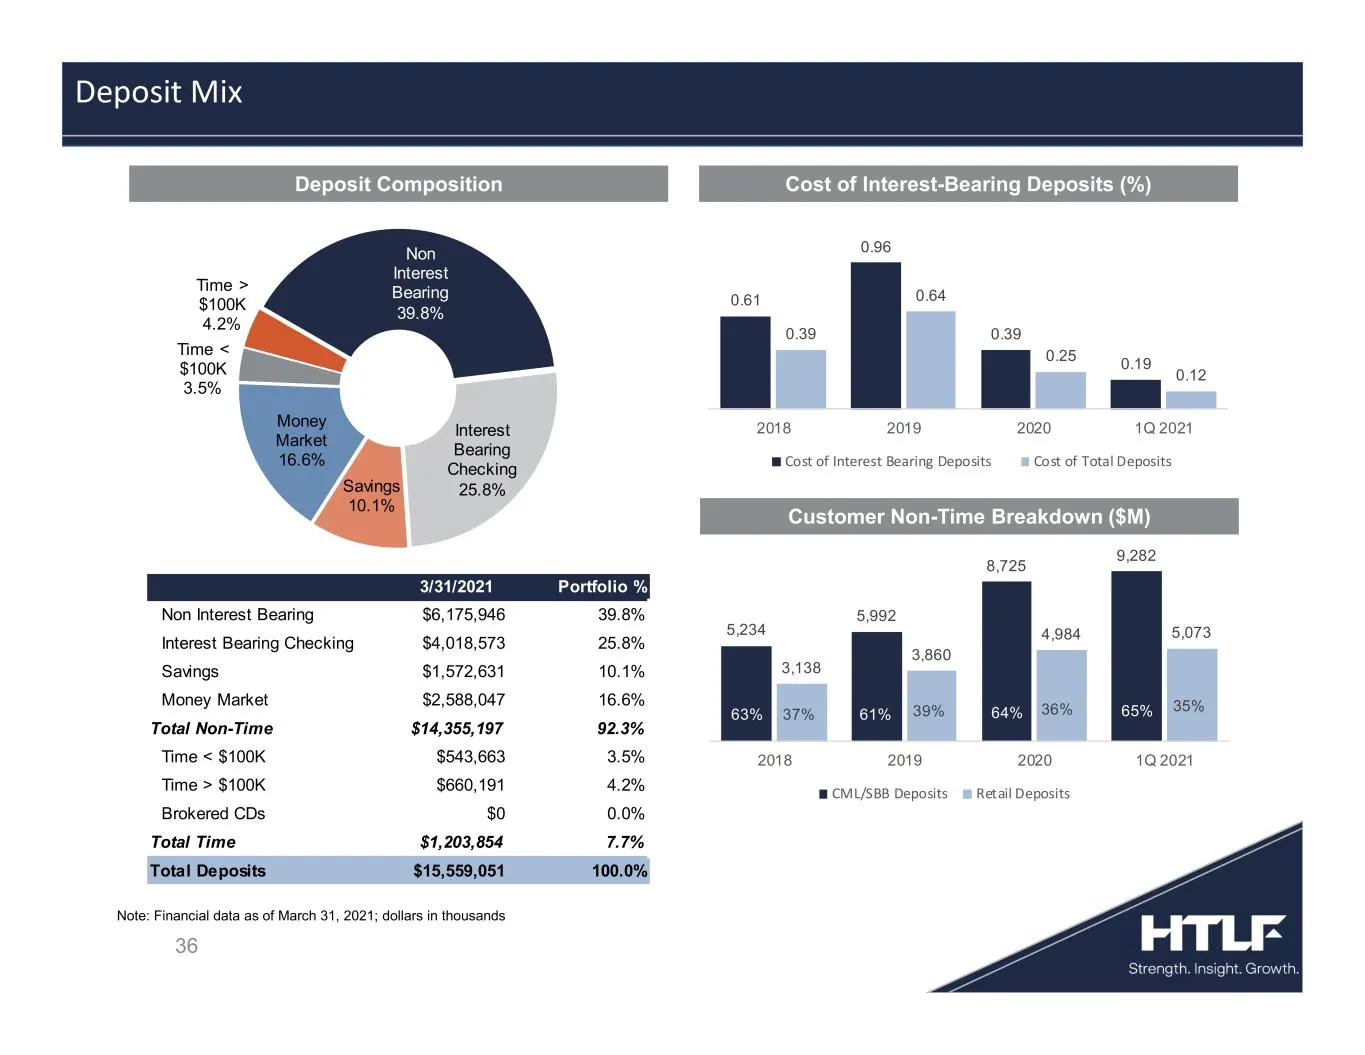
Slide 36: Deposit Mix
Deposit Composition Cost of Interest-Bearing Deposits (%) Customer Non-Time Breakdown ($M) 36 Deposit Mix Note: Financial data as of March 31, 2021; dollars in thousands Non Interest Bearing 39.8% Interest Bearing Checking 25.8%Savings 10.1% Money Market 16.6% Time < $100K 3.5% Time > $100K 4.2% 3/3
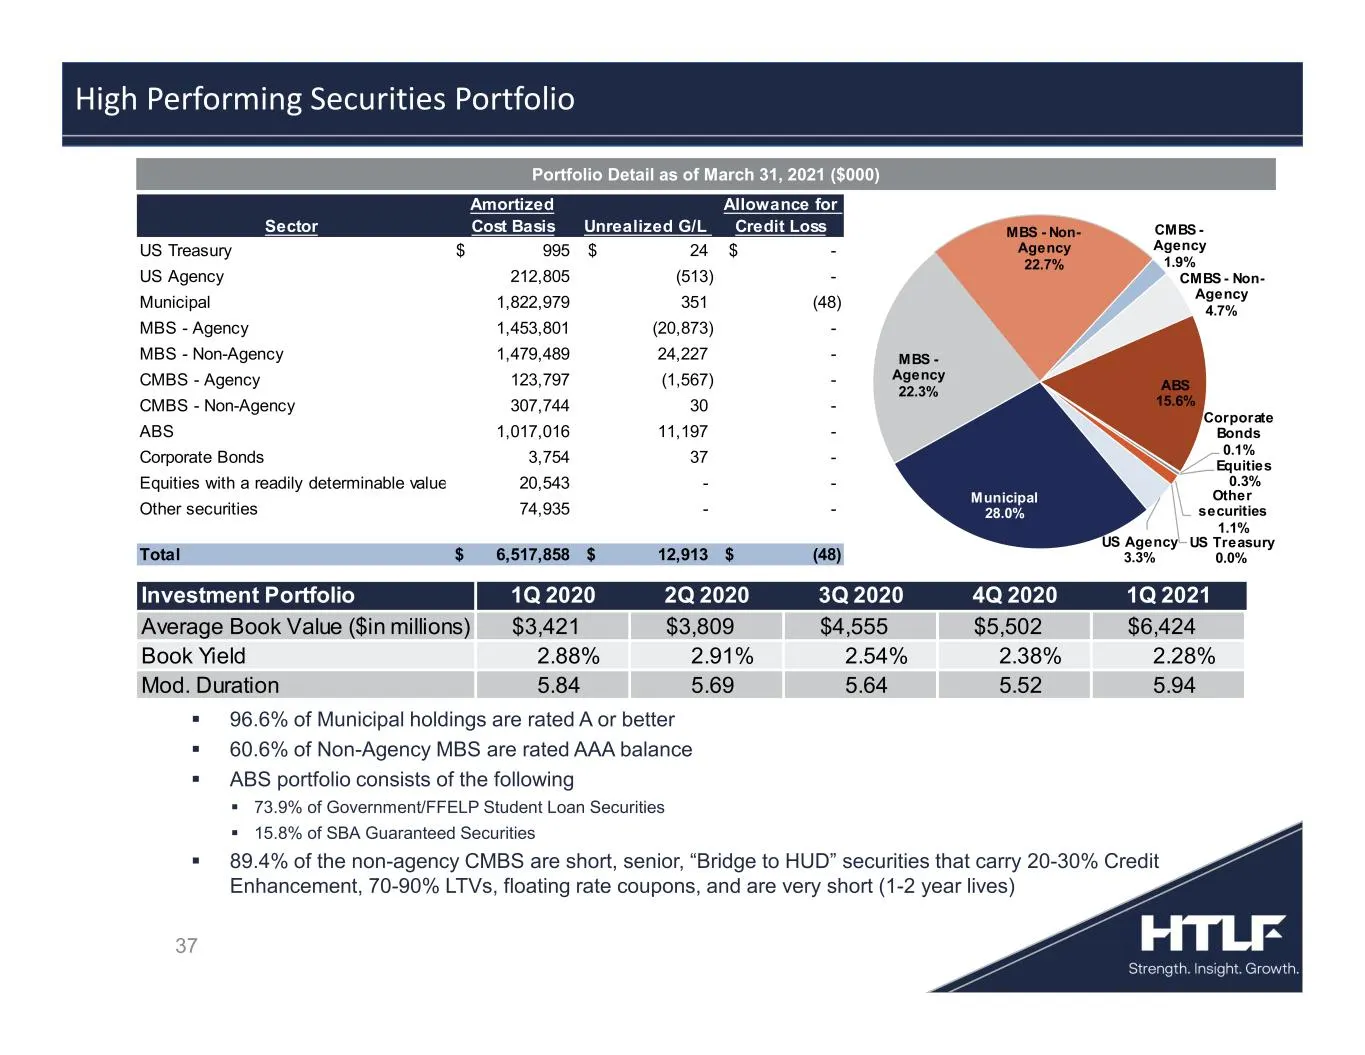
Slide 37: High Performing Securities Portfolio
37 96.6% of Municipal holdings are rated A or better 60.6% of Non-Agency MBS are rated AAA balance ABS portfolio consists of the following 73.9% of Government/FFELP Student Loan Securities 15.8% of SBA Guaranteed Securities 89.4% of the non-agency CMBS are short, senior, “Bridge to HUD”
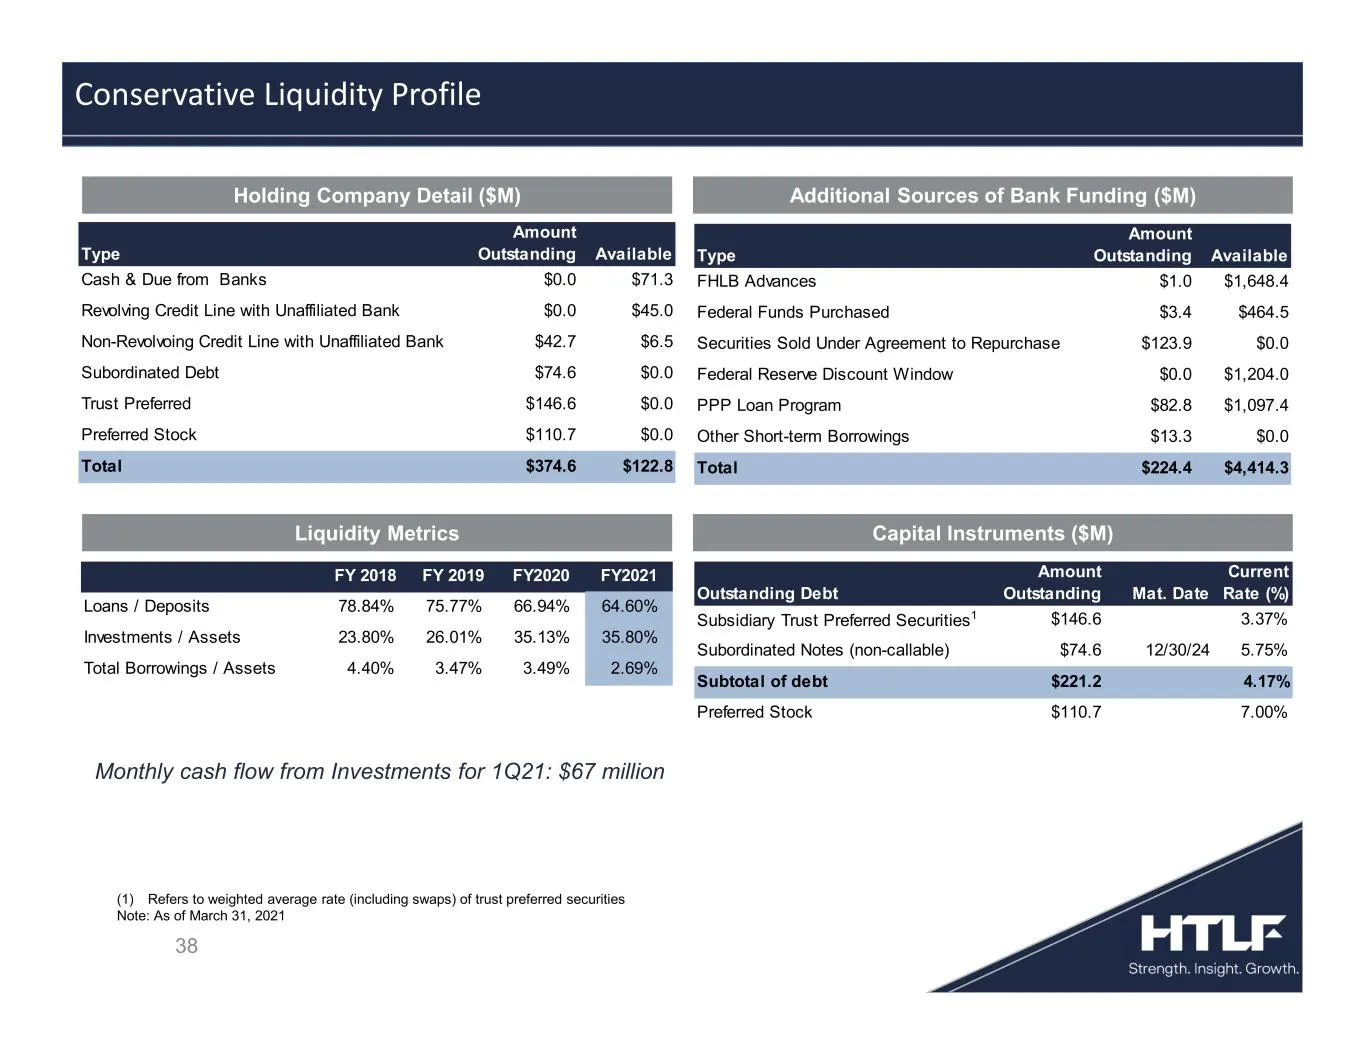
Slide 38: Conservative Liquidity Profile
38 Monthly cash flow from Investments for 1Q21: $67 million Capital Instruments ($M) Conservative Liquidity Profile Liquidity Metrics (1) Refers to weighted average rate (including swaps) of trust preferred securities Note: As of March 31, 2021 FY 2018 FY 2019 FY2020 FY2021 Loans / Deposits 78.84% 7

Slide 39: M&A Strategy
39 M&A Strategy
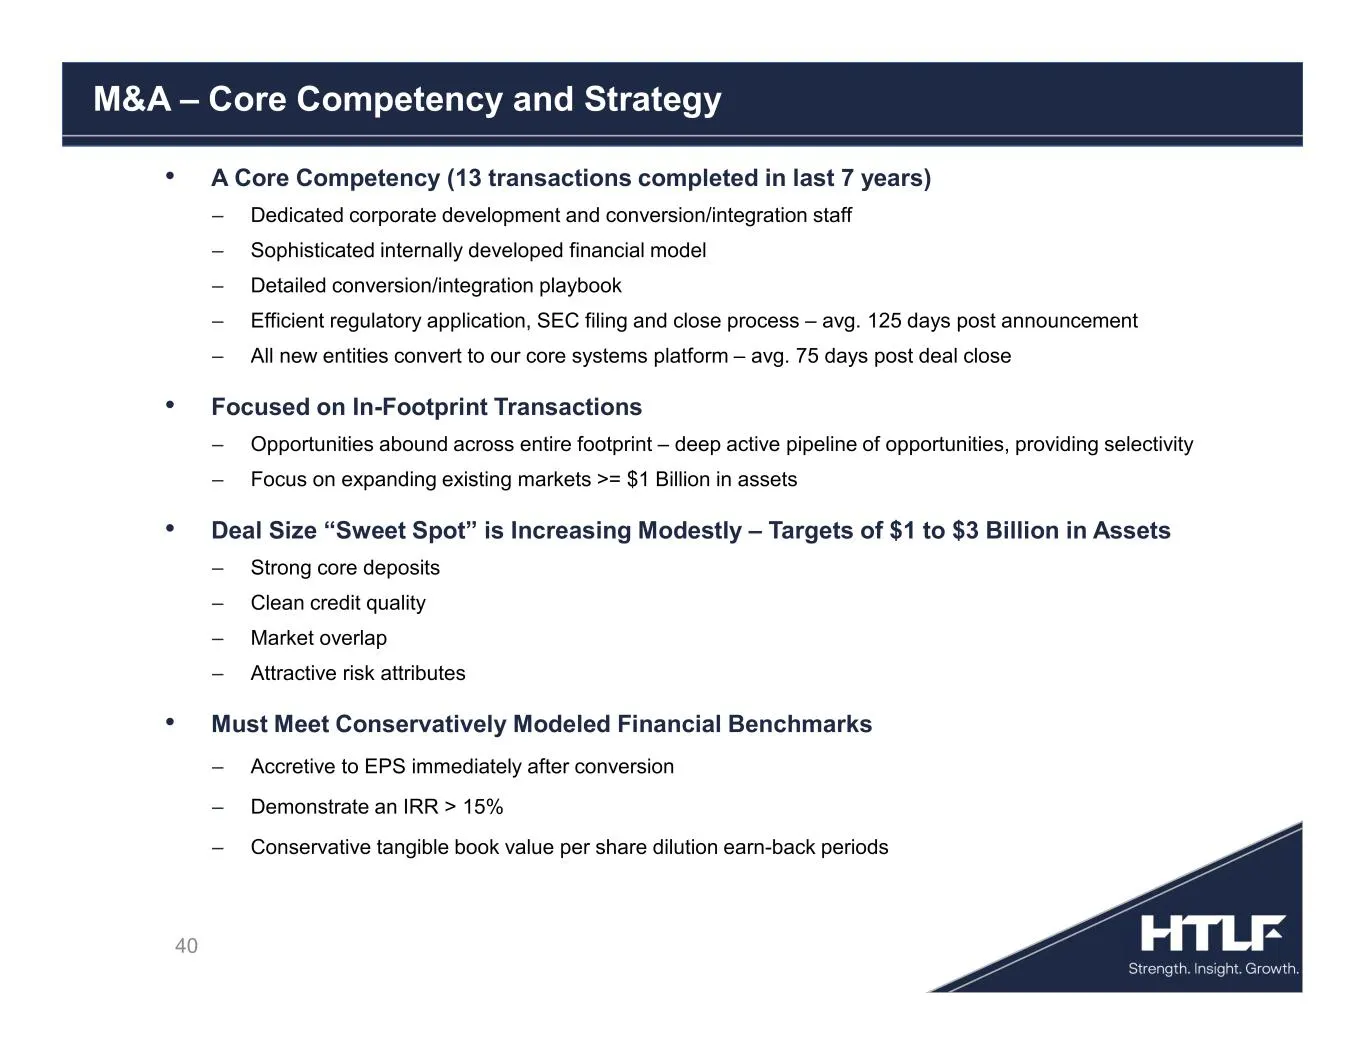
Slide 40: M&A: A Core Competency
40 • A Core Competency (13 transactions completed in last 7 years) ‒ Dedicated corporate development and conversion/integration staff ‒ Sophisticated internally developed financial model ‒ Detailed conversion/integration playbook ‒ Efficient regulatory application, SEC filing and close process – avg
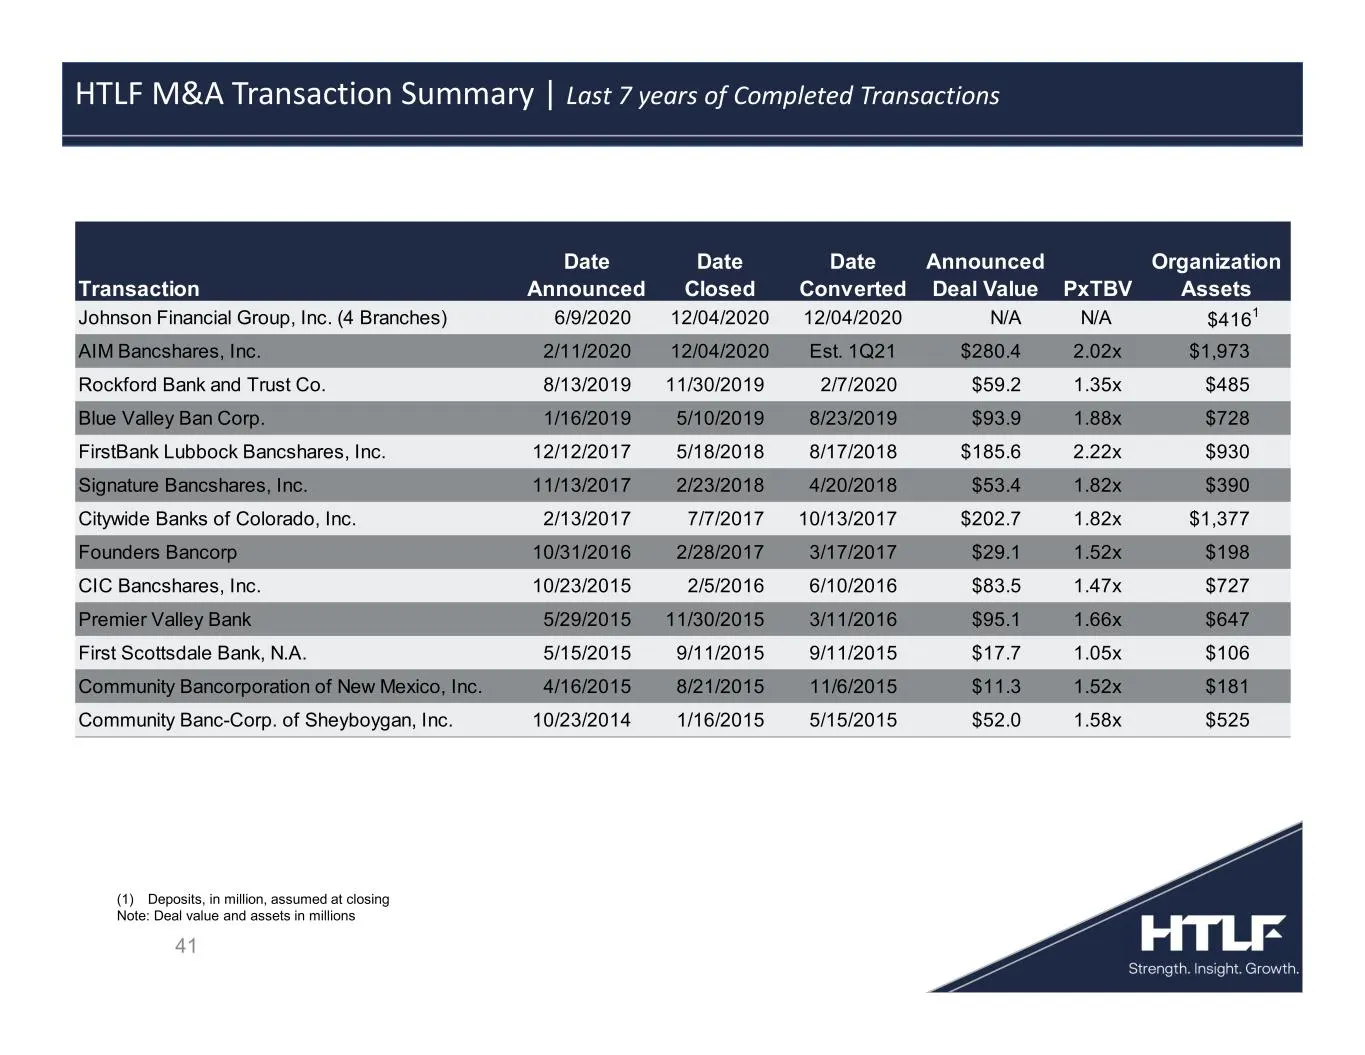
Slide 41: HTLF M&A Transaction Summary
41 HTLF M&A Transaction Summary | Last 7 years of Completed Transactions (1) Deposits, in million, assumed at closing Note: Deal value and assets in millions Transaction Date Announced Date Closed Date Converted Announced Deal Value PxTBV Organization Assets Johnson Financial Group, Inc. (4 Branches
Slide 42: HTLF Investor Summary
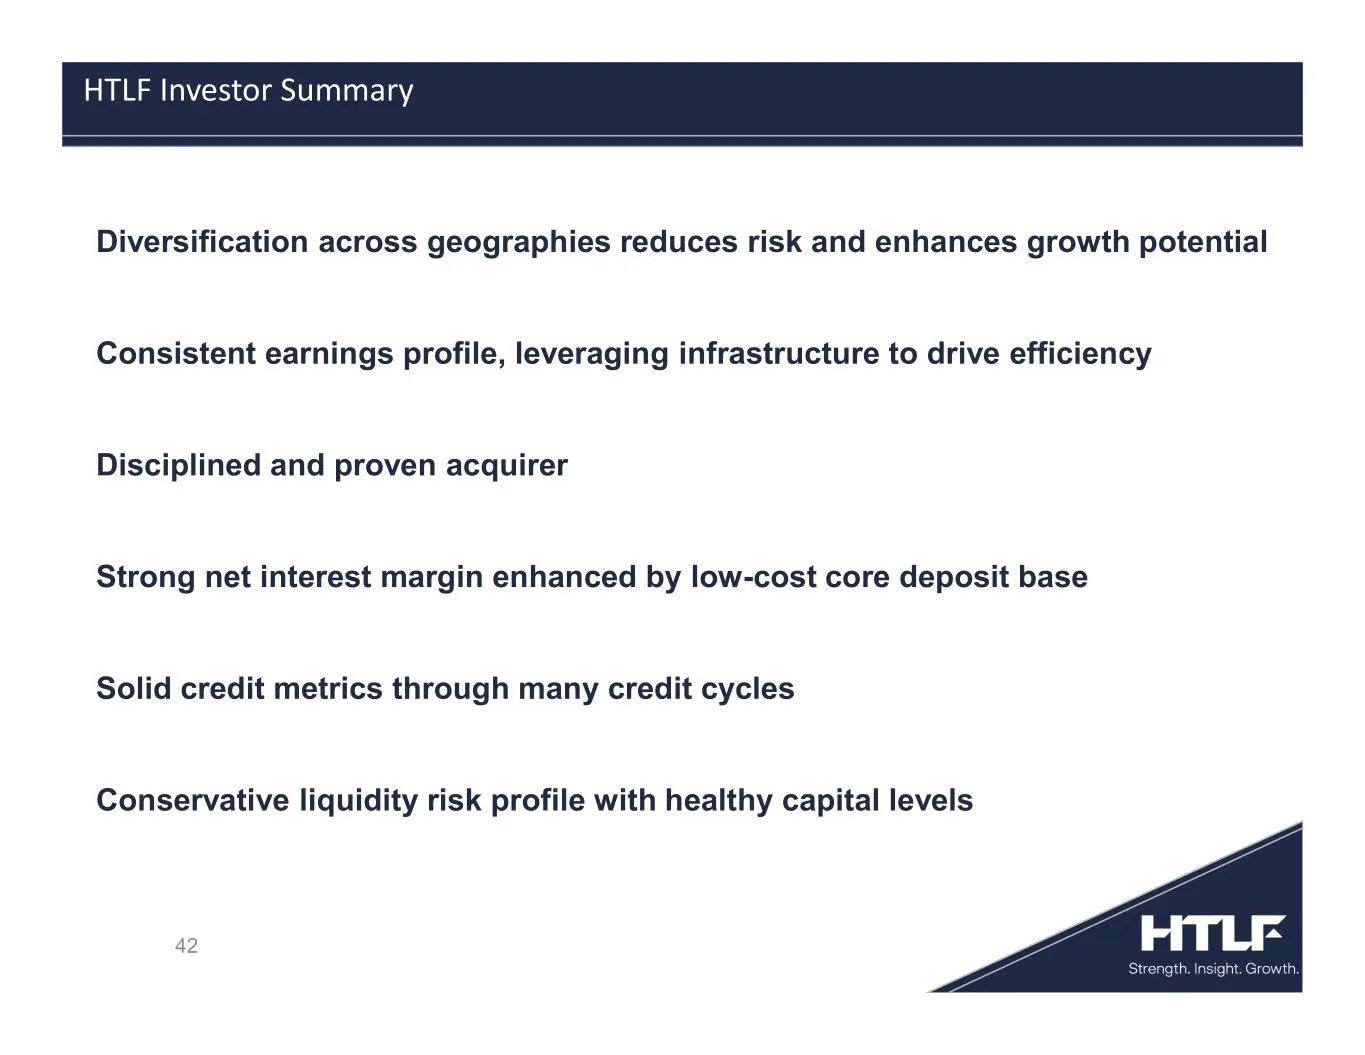
42 HTLF Investor Summary Diversification across geographies reduces risk and enhances growth potential Consistent earnings profile, leveraging infrastructure to drive efficiency Disciplined and proven acquirer Strong net interest margin enhanced by low-cost core deposit base Solid credit metrics thr
Slide 43: Analyst Ratings
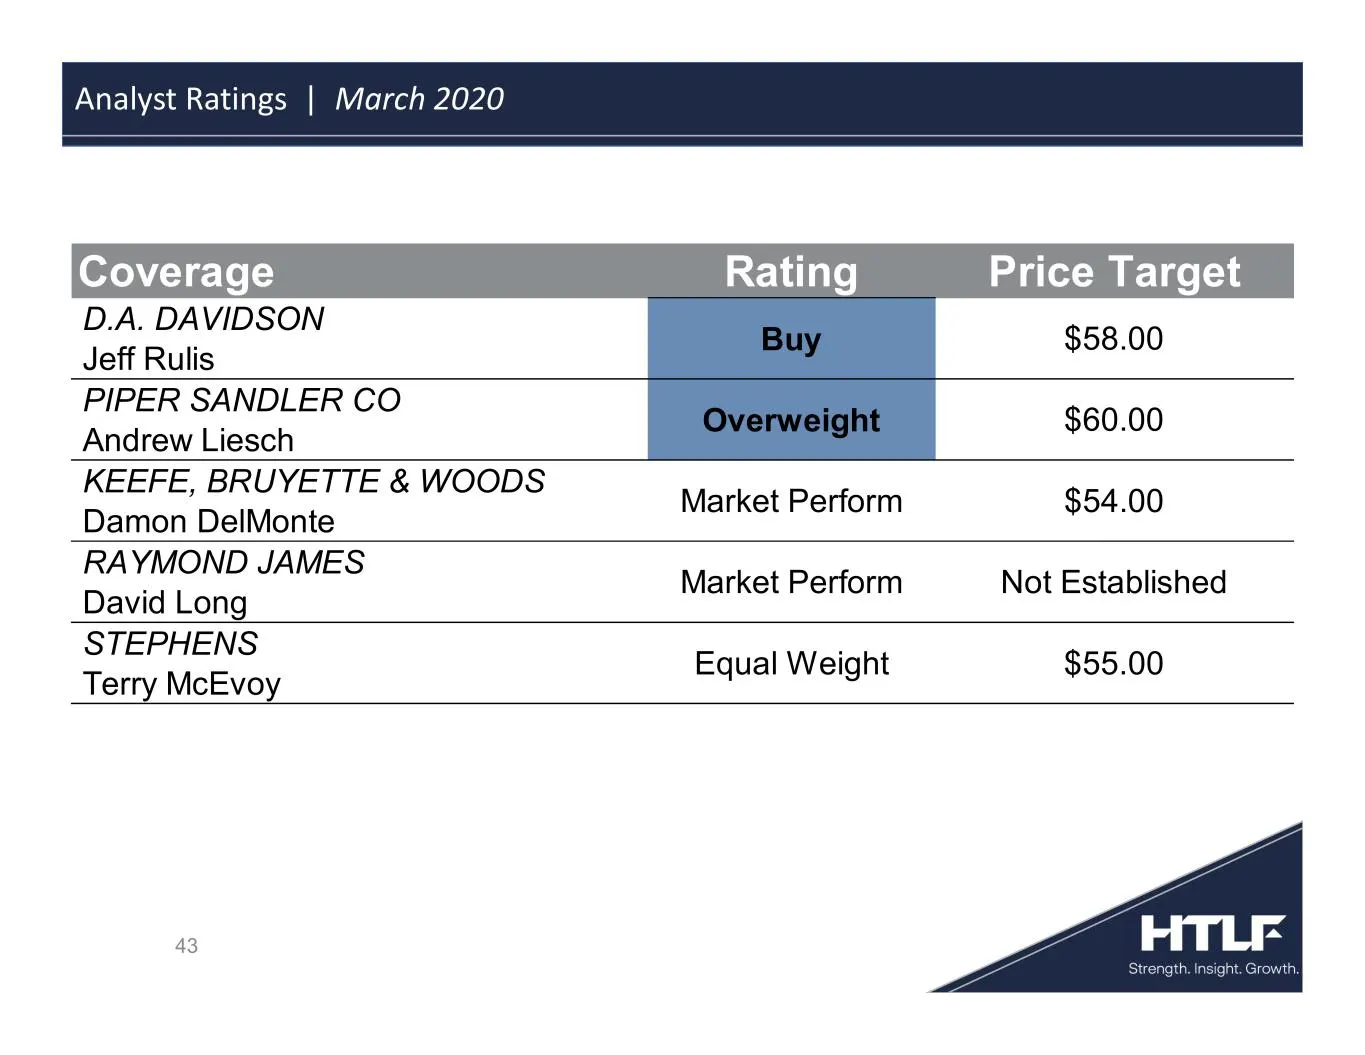
43 Analyst Ratings | March 2020 Coverage Rating Price Target D.A. DAVIDSON Jeff Rulis PIPER SANDLER CO Andrew Liesch KEEFE, BRUYETTE & WOODS Damon DelMonte RAYMOND JAMES David Long STEPHENS Terry McEvoy Market Perform Not Established Equal Weight $55.00 Buy $58.00 Overweight $60.00 Market Perform $5
Slide 44: Contact Information
Contact Informat' ———————————————————— eT 44
Slide 45: Appendix
45 Appendix
Slide 46: Non-GAAP measure definitions
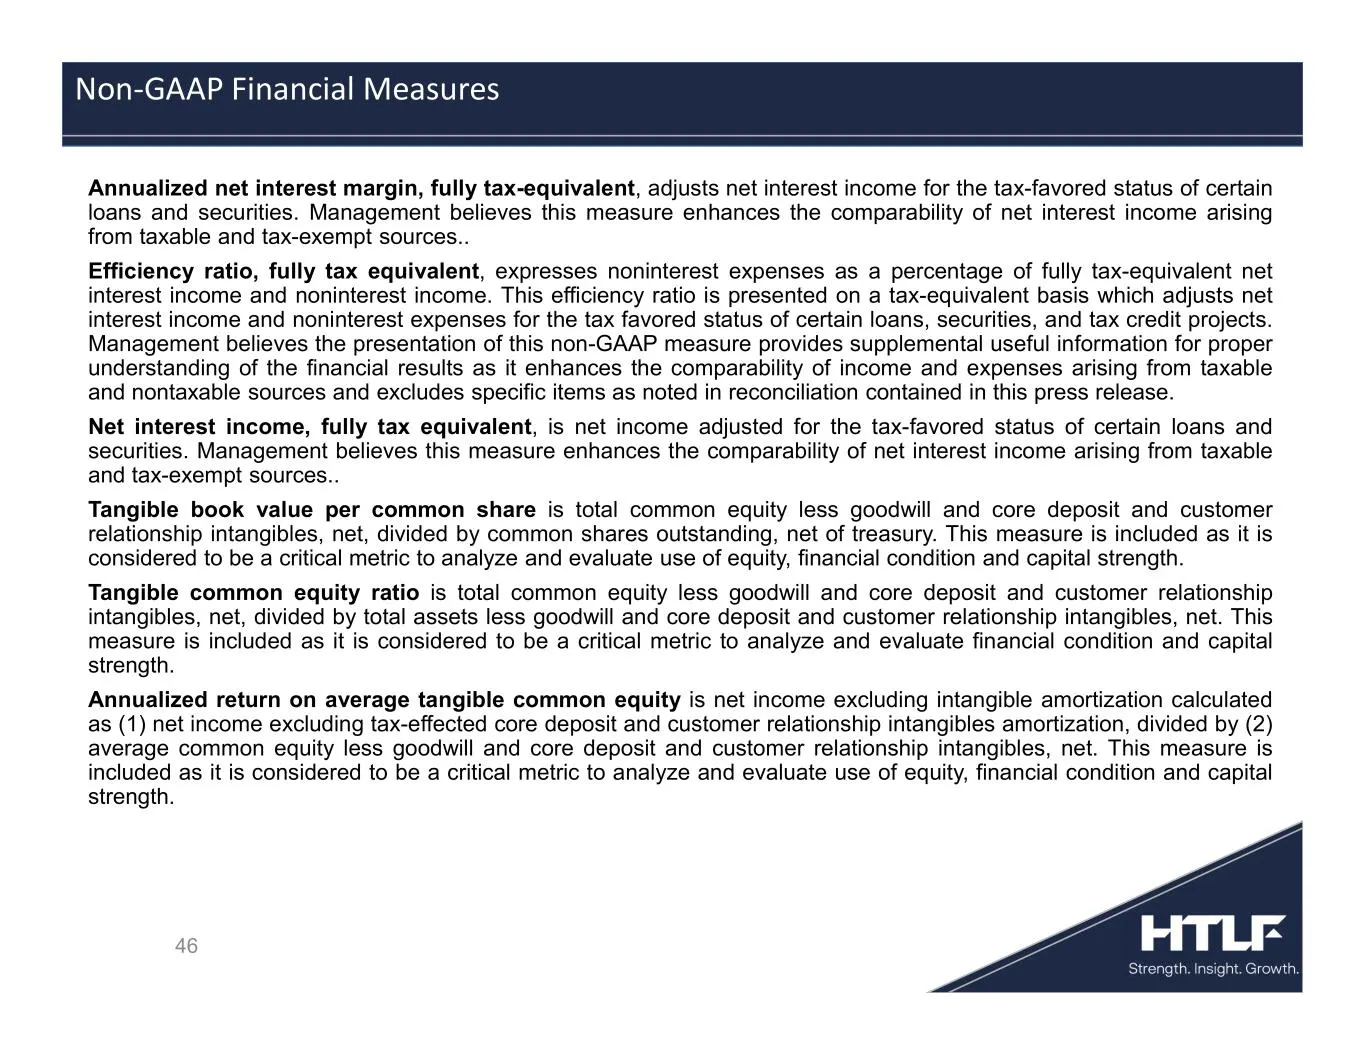
46 Annualized net interest margin, fully tax-equivalent, adjusts net interest income for the tax-favored status of certain loans and securities. Management believes this measure enhances the comparability of net interest income arising from taxable and tax-exempt sources.. Efficiency ratio, fully ta
Slide 47: Non-GAAP Reconciliations
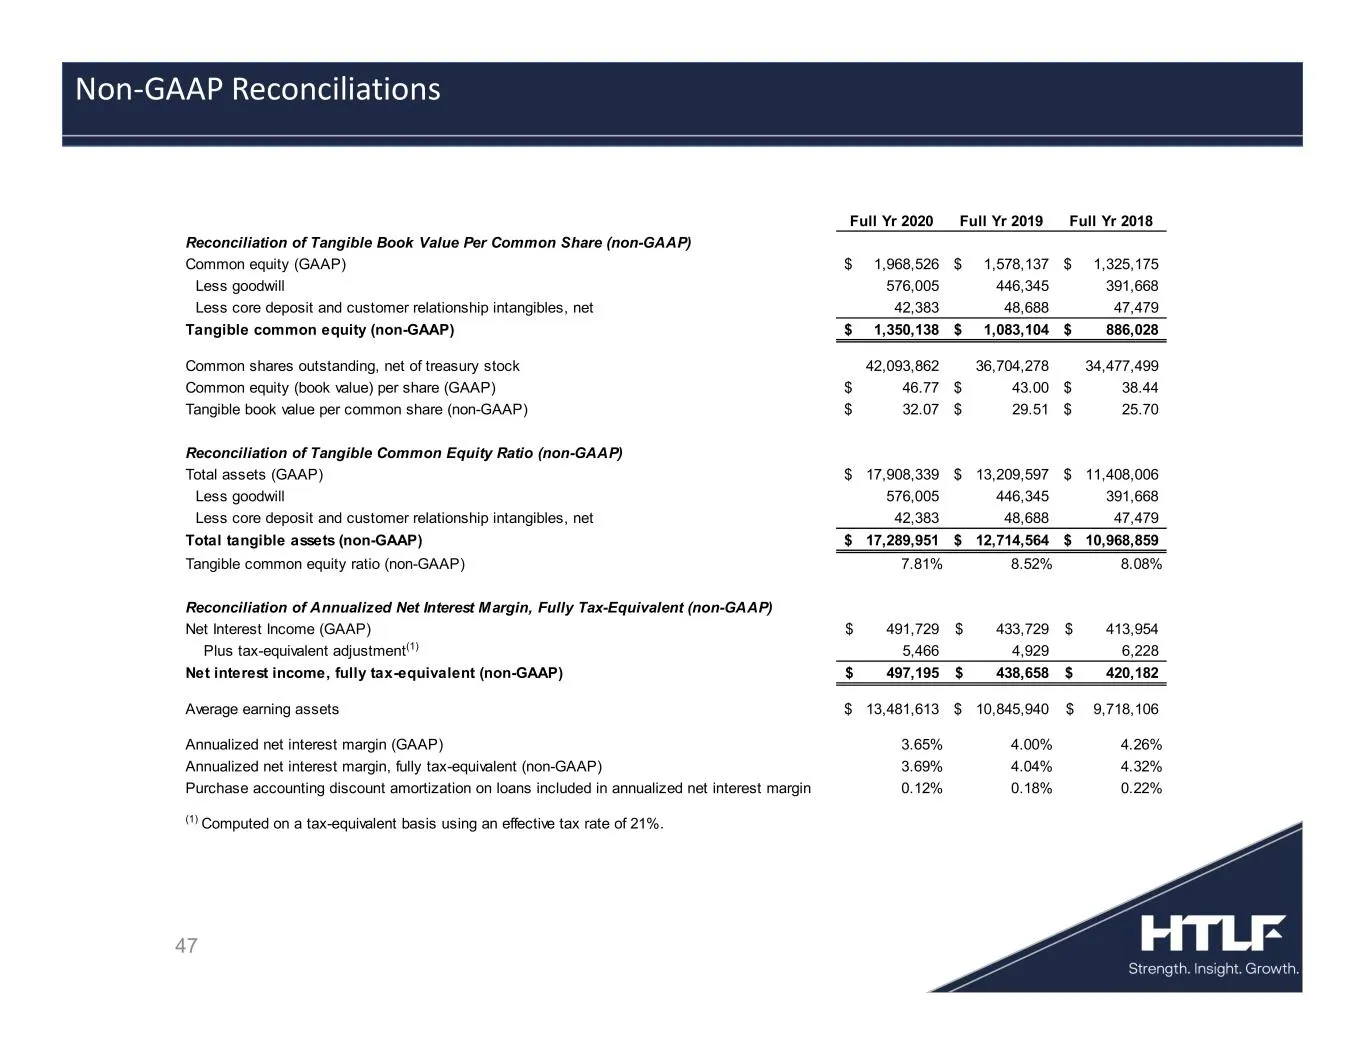
47 Non-GAAP Reconciliations Full Yr 2020 Full Yr 2019 Full Yr 2018 Reconciliation of Tangible Book Value Per Common Share (non-GAAP) Common equity (GAAP) 1,968,526$ 1,578,137$ 1,325,175$ Less goodwill 576,005 446,345 391,668 Less core deposit and customer relationship intangibles, net 42,383 48,688
Slide 48: Non-GAAP Reconciliations (cont.)
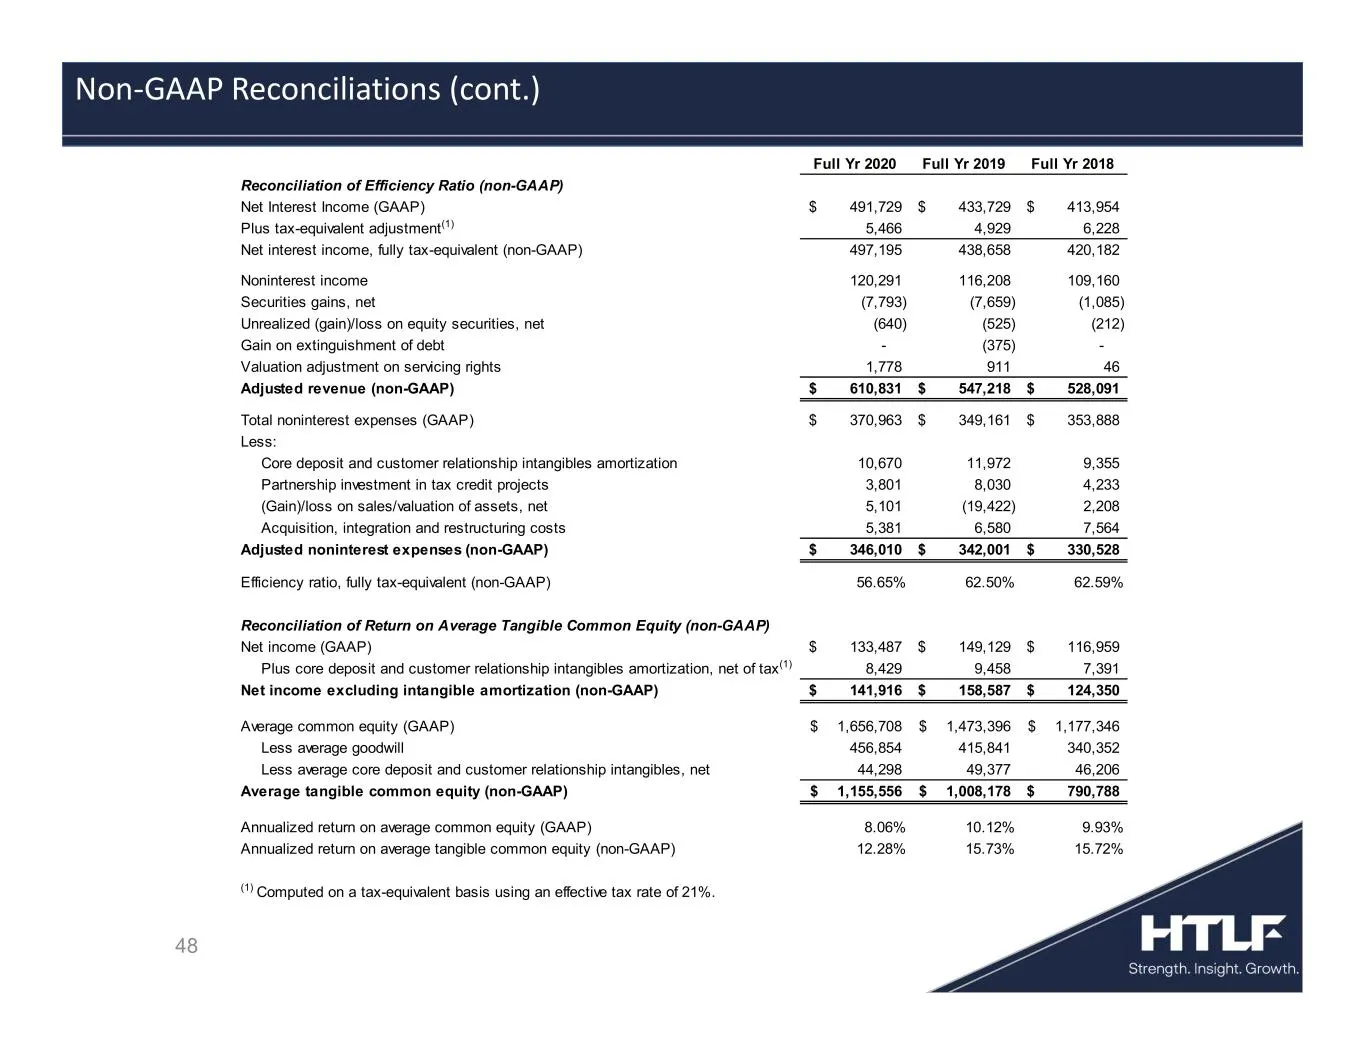
48 Non-GAAP Reconciliations (cont.) Full Yr 2020 Full Yr 2019 Full Yr 2018 Reconciliation of Efficiency Ratio (non-GAAP) Net Interest Income (GAAP) 491,729$ 433,729$ 413,954$ Plus tax-equivalent adjustment(1) 5,466 4,929 6,228 Net interest income, fully tax-equivalent (non-GAAP) 497,195 438,658 420,
Slide 49: Non-GAAP Reconciliations (cont.)
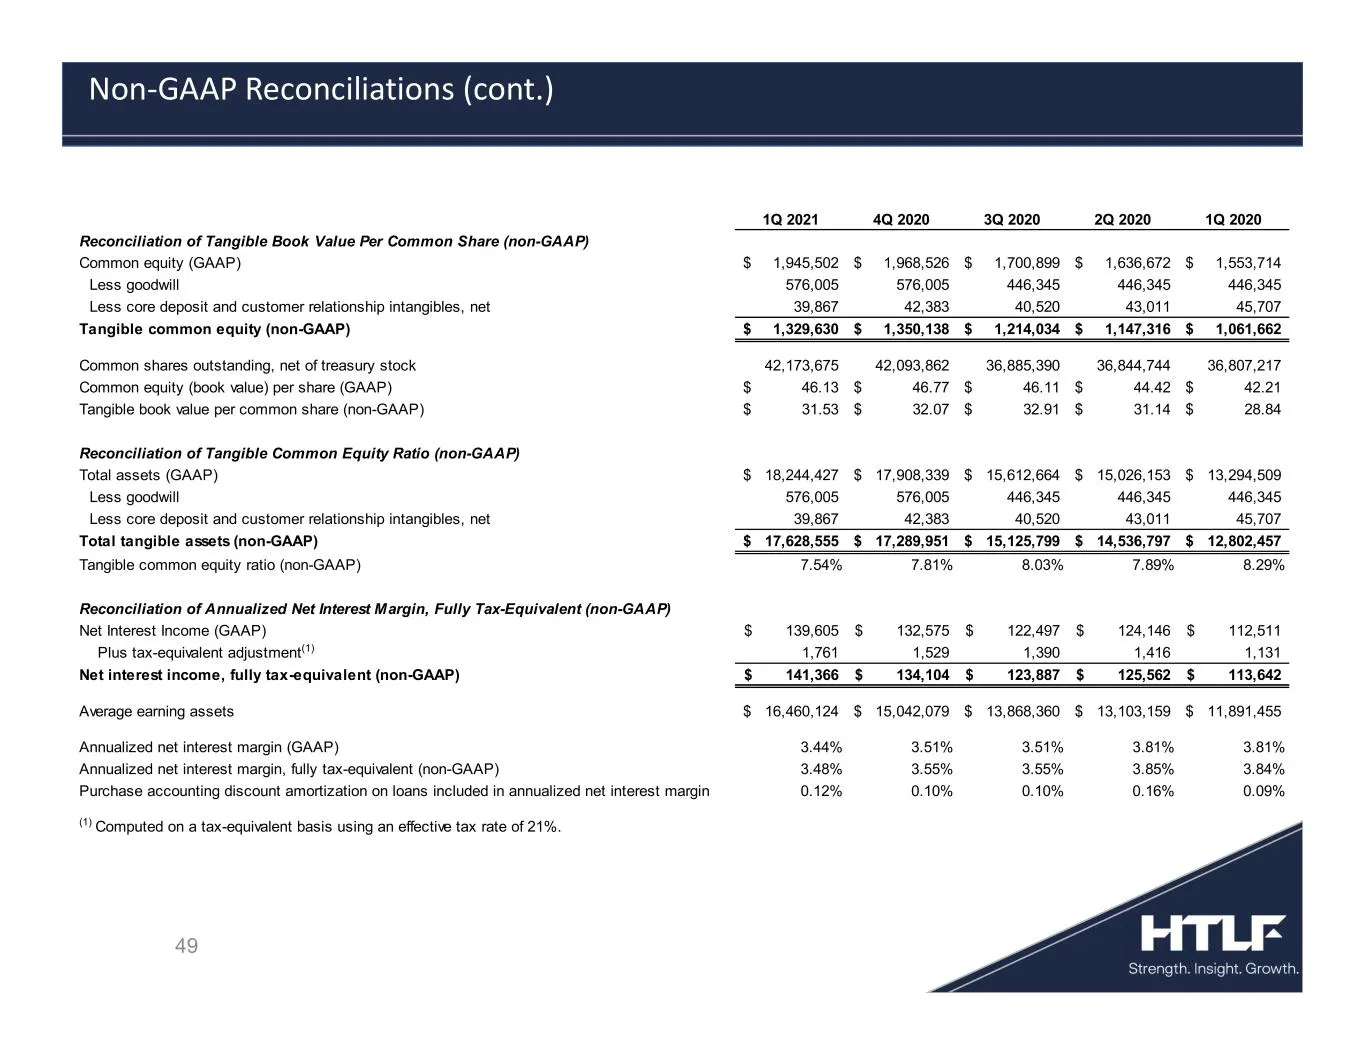
49 Non-GAAP Reconciliations (cont.) 1Q 2021 4Q 2020 3Q 2020 2Q 2020 1Q 2020 Reconciliation of Tangible Book Value Per Common Share (non-GAAP) Common equity (GAAP) 1,945,502$ 1,968,526$ 1,700,899$ 1,636,672$ 1,553,714$ Less goodwill 576,005 576,005 446,345 446,345 446,345 Less core deposit and custom
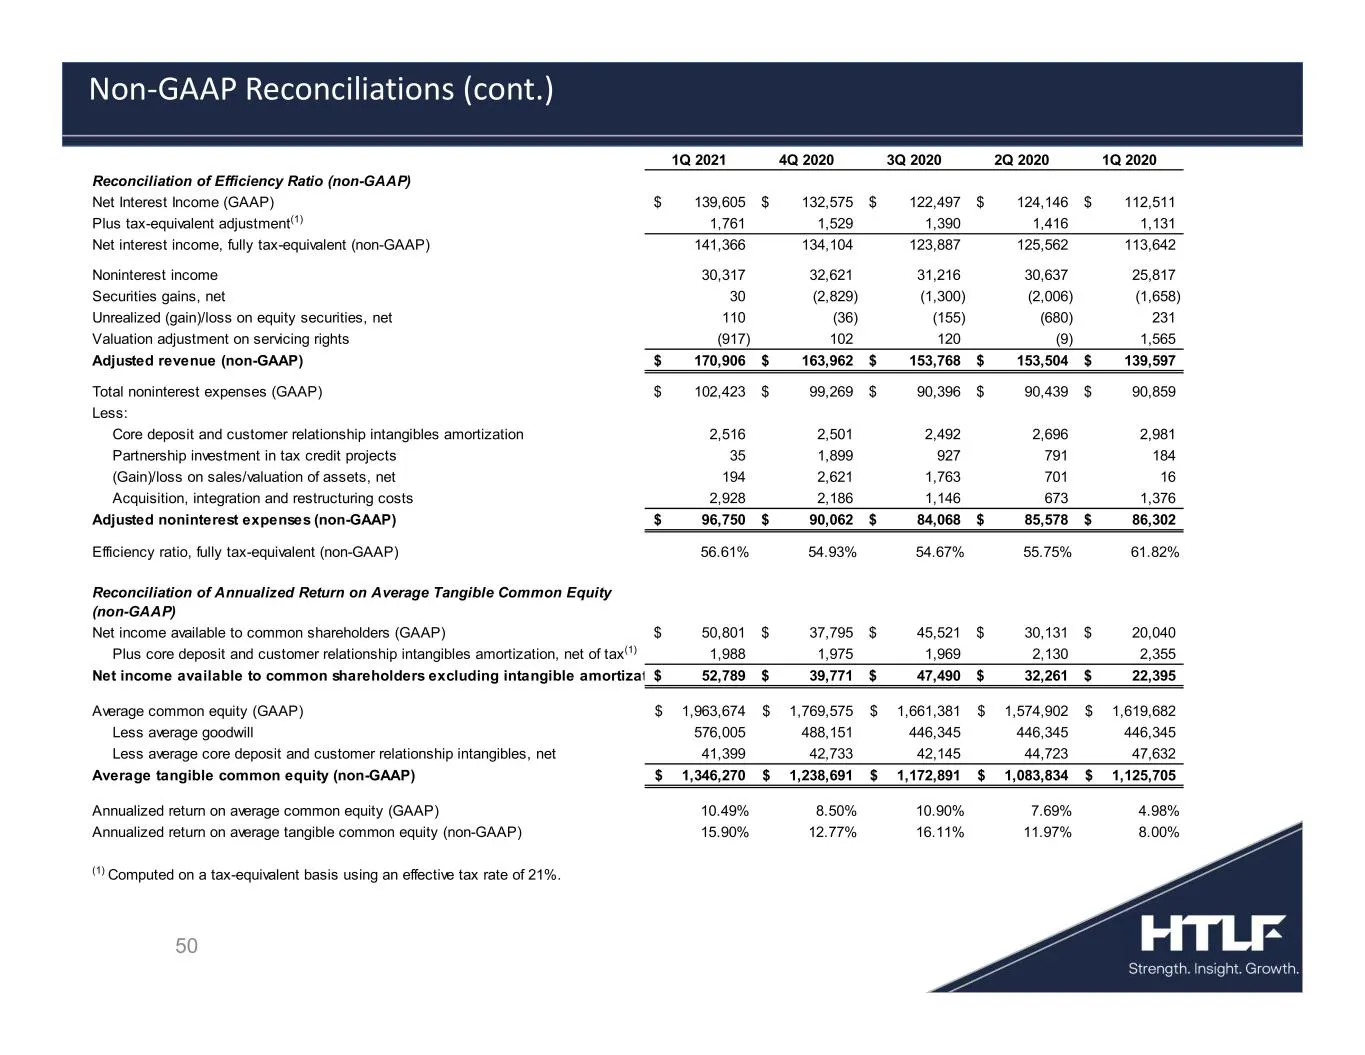
Slide 50: Non-GAAP Reconciliations (cont.)
50 Non-GAAP Reconciliations (cont.) 1Q 2021 4Q 2020 3Q 2020 2Q 2020 1Q 2020 Reconciliation of Efficiency Ratio (non-GAAP) Net Interest Income (GAAP) 139,605$ 132,575$ 122,497$ 124,146$ 112,511$ Plus tax-equivalent adjustment(1) 1,761 1,529 1,390 1,416 1,131 Net interest income, fully tax-equivalent
Source: SEC EDGAR · 8-K filed Apr 26, 2021
More decks from Heartland Financial USA Inc
 Merger or Acquisition (July 2024)6 slides · Jul 31, 2024
 Merger or Acquisition (May 2024)6 slides · May 2, 2024
 Merger or Acquisition (May 2024)27 slides · May 2, 2024
 Q4 2023 Earnings Presentation54 slides · Feb 13, 2024
 Q4 2023 Earnings Presentation35 slides · Jan 29, 2024
 Q3 2023 Earnings Presentation55 slides · Nov 15, 2023