Metaldyne Performance Group Inc
Metaldyne Performance — KeyBanc Industrial, Automotive and Transportation Conference 2015
28 slides from Metaldyne Performance's conference presentation, May 28, 2015
Slide 1: KeyBanc Industrial, Automotive and Transportation Conference
LIGHT VEHICLE COMMERCIAL INDUSTRIAL MPG KeyBanc Industrial, Automotive and Transportation Conference May 28, 2015
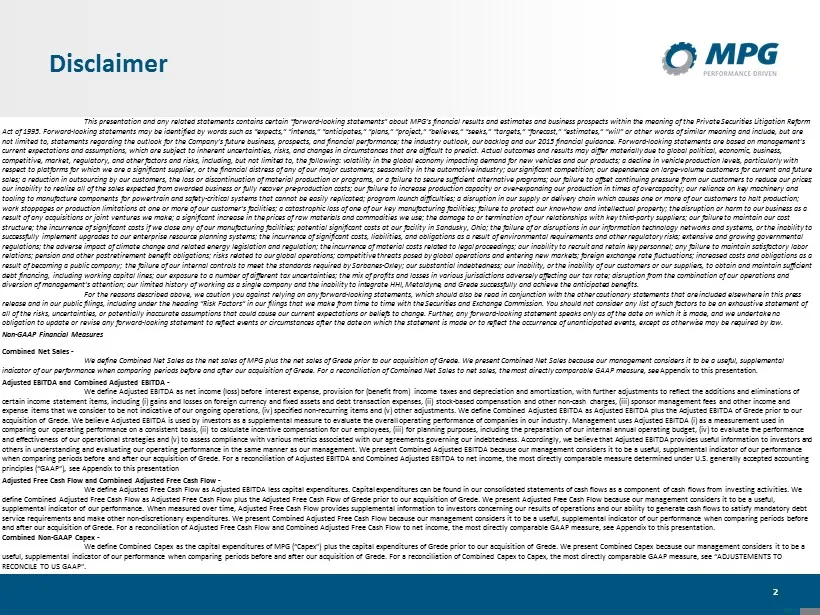
Slide 2: Disclaimer
2 Disclaimer This presentation and any related statements contains certain “forward - looking statements” about MPG’s financial results and estimates and business prospects within the meaning of th e Private Securities Litigation Reform Act of 1995. Forward - looking statements may be identified by
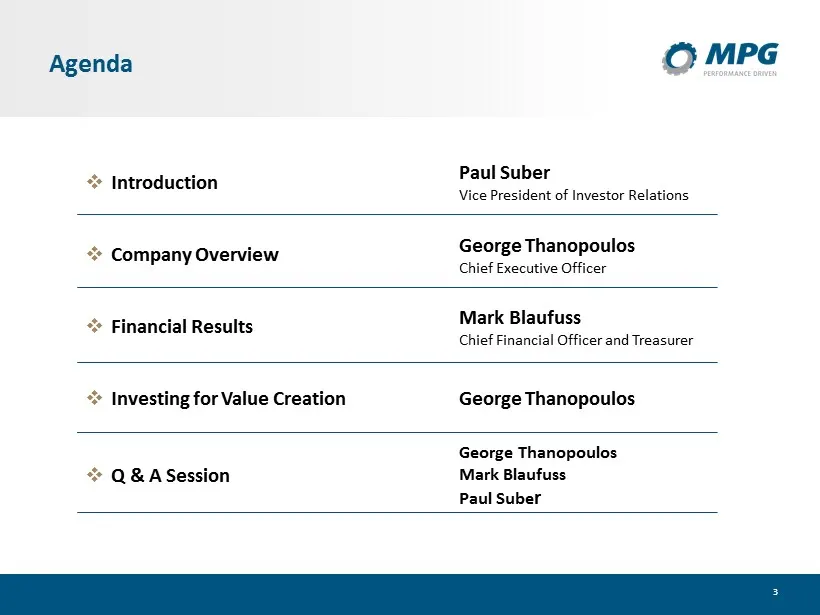
Slide 3: Agenda
3 Agenda □ Introduction Paul Suber Vice President of Investor Relations □ Company Overview George Thanopoulos Chief Executive Officer □ Financial Results Mark Blaufuss Chief Financial Officer and Treasurer □ Investing for Value Creation George Thanopoulos □ Q & A Session George Thanopoulos Mark Blau
Slide 4: Company Overview
COMPANY OVERVIEW MPG
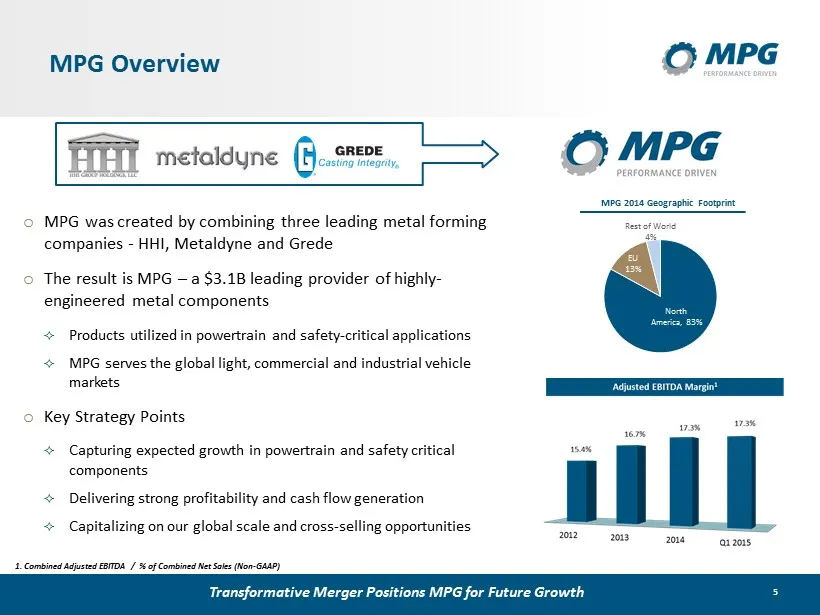
Slide 5: MPG Overview
5 MPG Overview Metaldyne Performance Group Becomes Public o MPG was created by combining three leading metal forming companies - HHI, Metaldyne and Grede o The result is MPG – a $3.1B leading provider of highly - engineered metal components Products utilized in powertrain and safety - critical appli
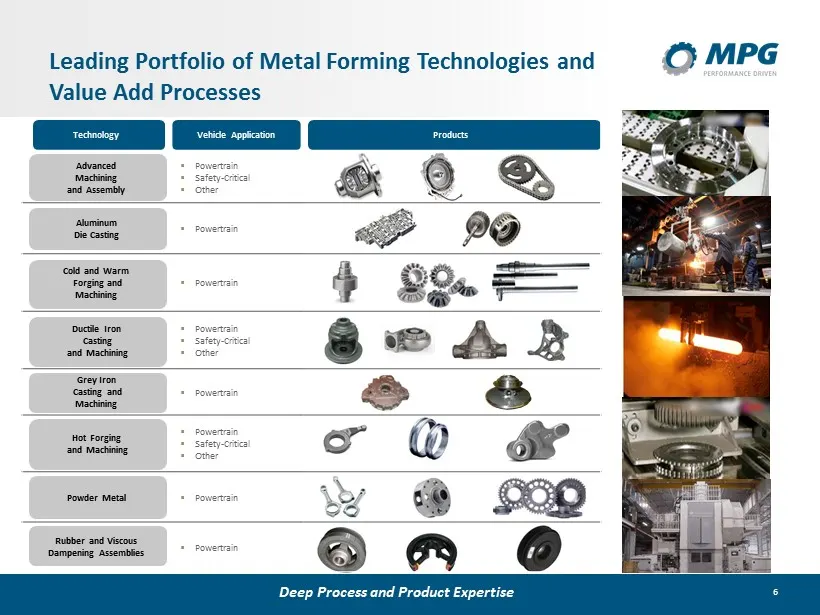
Slide 6: Leading Portfolio of Metal Forming Technologies and Value Add Processes
6 Leading Portfolio of Metal Forming Technologies and Value Add Processes Deep Process and Product Expertise Technology Vehicle Application Products Advanced Machining and Assembly ▪ Powertrain ▪ Safety - Critical ▪ Other Aluminum Die Casting ▪ Powertrain Cold and Warm Forging and Machining ▪ Powert
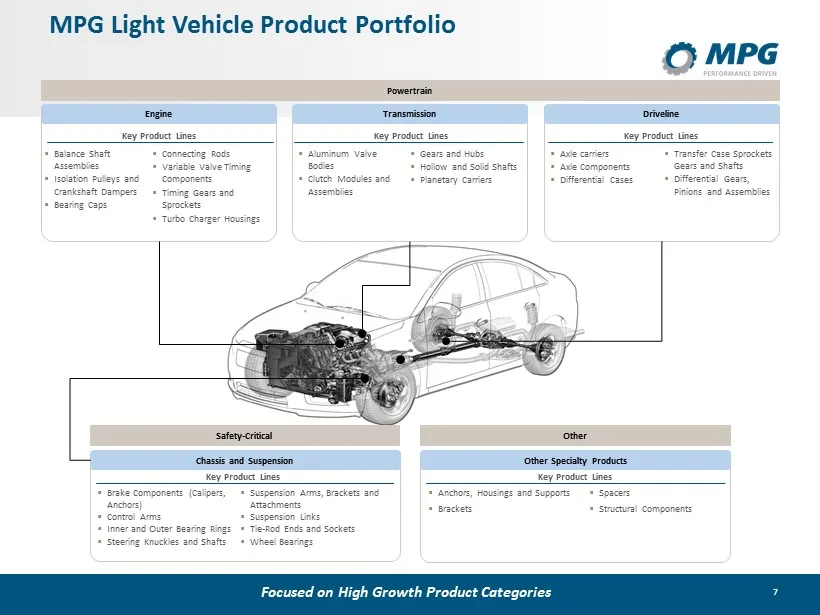
Slide 7: MPG Light Vehicle Product Portfolio Focused on High Growth Product Categories
7 Engine Powertrain Driveline Transmission MPG Light Vehicle Product Portfolio Focused on High Growth Product Categories Key Product Lines ▪ Balance Shaft Assemblies ▪ Isolation Pulleys and Crankshaft Dampers ▪ Bearing Caps ▪ Connecting Rods ▪ Variable Valve Timing Components ▪ Timing Gears and Spro
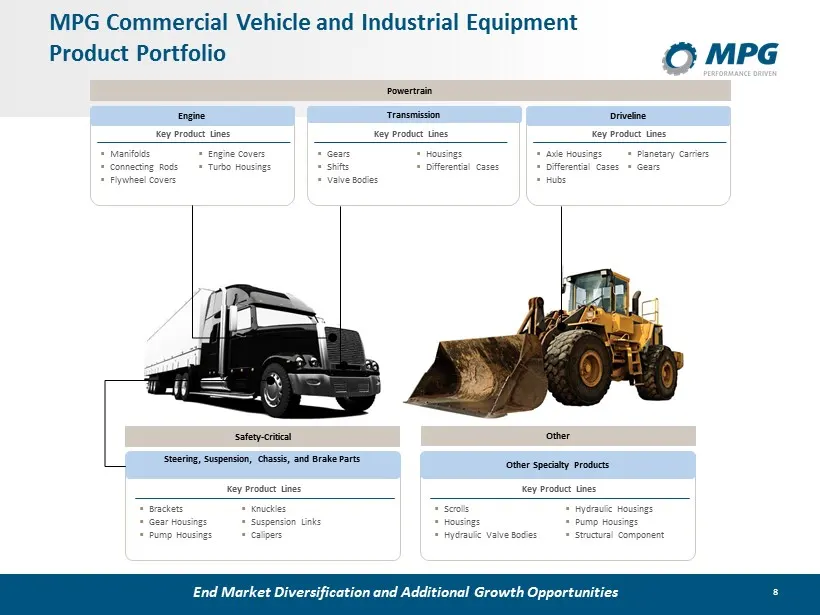
Slide 8: MPG Commercial Vehicle and Industrial Equipment Product Portfolio
8 ▪ Engine Covers ▪ Turbo Housings MPG Commercial Vehicle and Industrial Equipment Product Portfolio Engine Key Product Lines ▪ Manifolds ▪ Connecting Rods ▪ Flywheel Covers Powertrain Transmission Key Product Lines ▪ Gears ▪ Shifts ▪ Valve Bodies Key Product Lines ▪ Brackets ▪ Gear Housings ▪ Pump
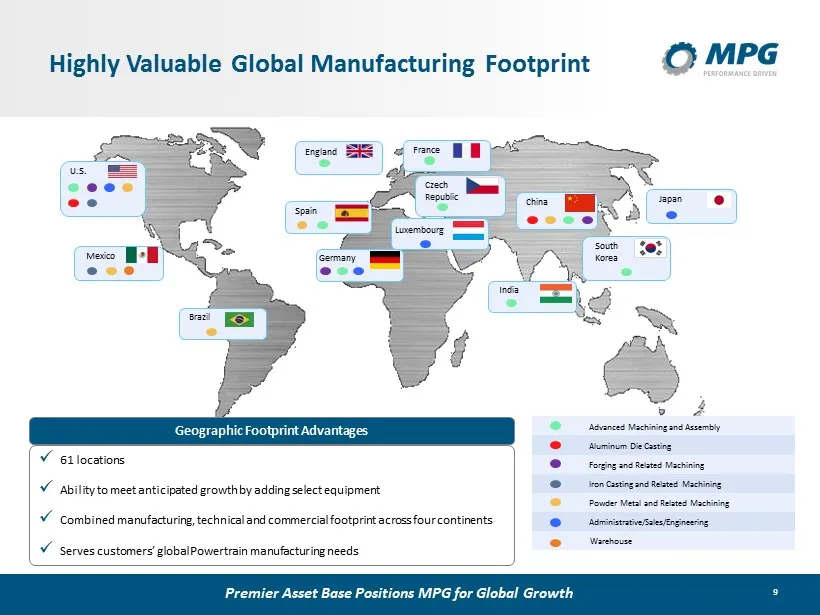
Slide 9: Premier Asset Base Positions MPG for Global Growth
9 Advanced Machining and Assembly Aluminum Die Casting Forging and Related Machining Iron Casting and Related Machining Powder Metal and Related Machining Administrative/Sales/Engineering Warehouse Premier Asset Base Positions MPG for Global Growth Highly Valuable Global Manufacturing Footprint U.S.
Slide 10: Financial Results
FINANCIAL RESULTS MPG
Slide 11: Near-Term Value Creation
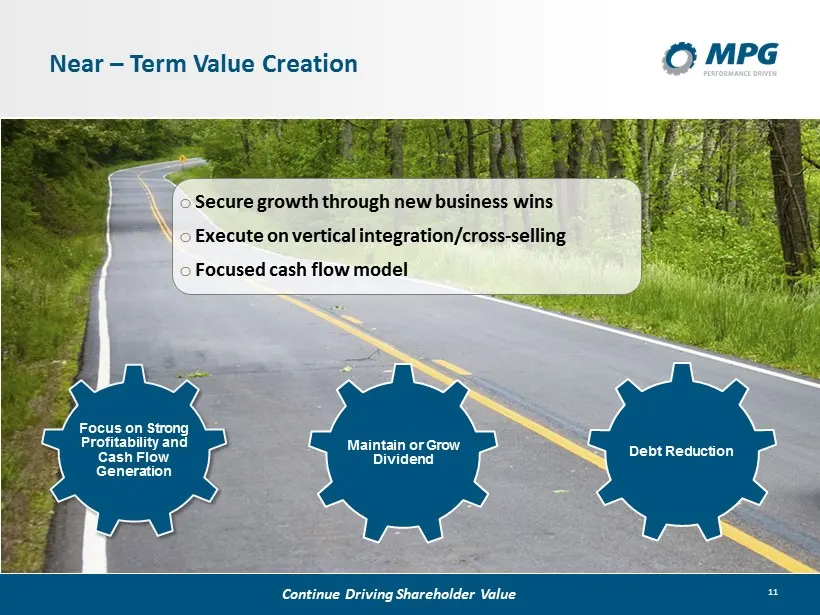
11 Near – Term Value Creation Focus on Strong Profitability and Cash Flow Generation Debt Reduction Maintain or Grow Dividend o Secure growth through new business wins o Execute on vertical integration/cross - selling o Focused cash flow model Continue Driving Shareholder Value
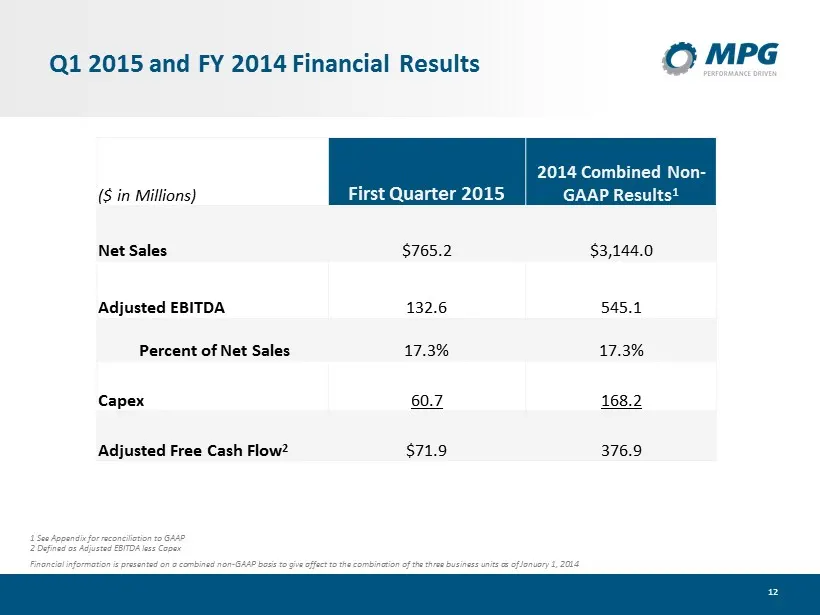
Slide 12: Q1 2015 and FY 2014 Financial Results
12 Q1 2015 and FY 2014 Financial Results ($ in Millions) First Quarter 2015 2014 Combined Non - GAAP Results 1 Net Sales $765.2 $3,144.0 Adjusted EBITDA 132.6 545.1 Percent of Net Sales 17.3% 17.3% Capex 60.7 168.2 Adjusted Free Cash Flow 2 $71.9 376.9 1 See Appendix for reconciliation to GAAP 2 Def
Slide 13: Treasury Updates for Q1 2015
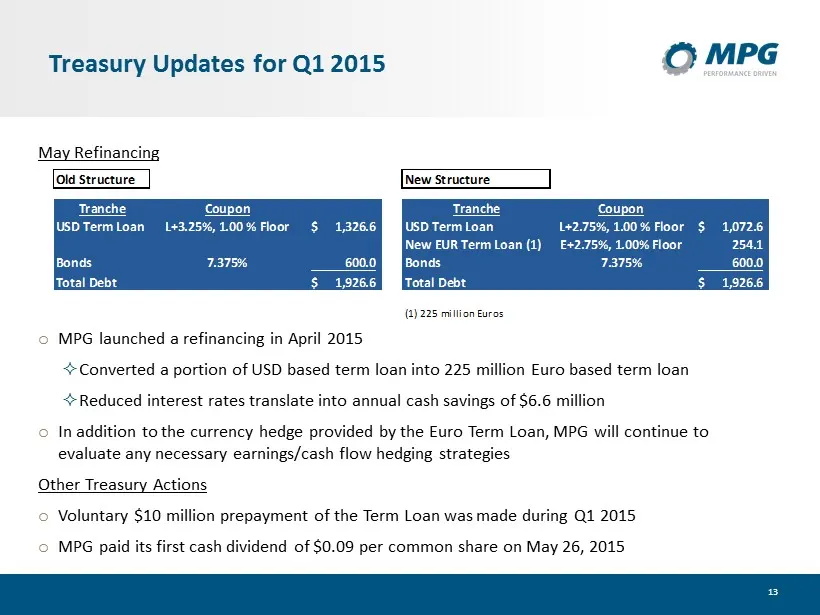
13 Treasury Updates for Q1 2015 May Refinancing o MPG launched a refinancing in April 2015 Converted a portion of USD based term loan into 225 million Euro based term loan Reduced interest rates translate into annual cash savings of $6.6 million o In addition to the currency hedge provided by the Eu
Slide 14: Disciplined Approach to Investment for Value Creation
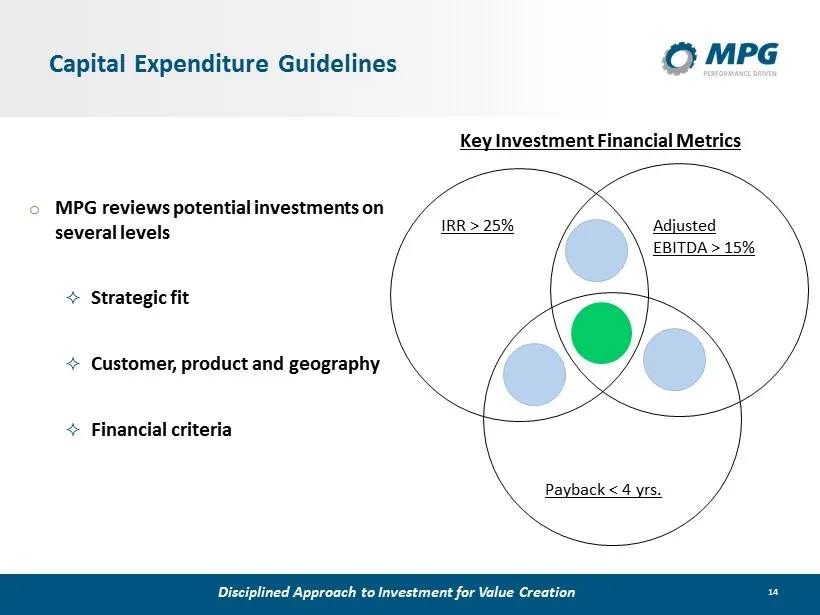
14 Capital Expenditure Guidelines IRR > 25% Adjusted EBITDA > 15% Payback < 4 yrs. o MPG reviews potential investments on several levels Strategic fit Customer , product and geography Financial c riteria Key Investment Financial Metrics Disciplined Approach to Investment for Value Creation
Slide 15: 2015 Guidance Ranges
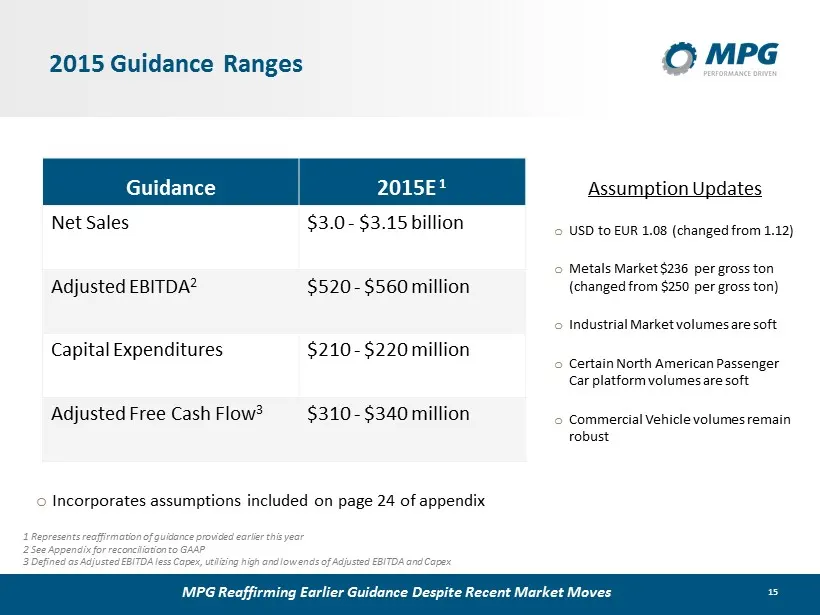
15 2015 Guidance Ranges Guidance 2015 E 1 Net Sales $3.0 - $3.15 billion Adjusted EBITDA 2 $520 - $560 million Capital Expenditures $210 - $220 million Adjusted Free Cash Flow 3 $310 - $340 million 1 Represents reaffirmation of guidance provided earlier this year 2 See Appendix for reconciliation to
Slide 16: Near-Term Value Creation
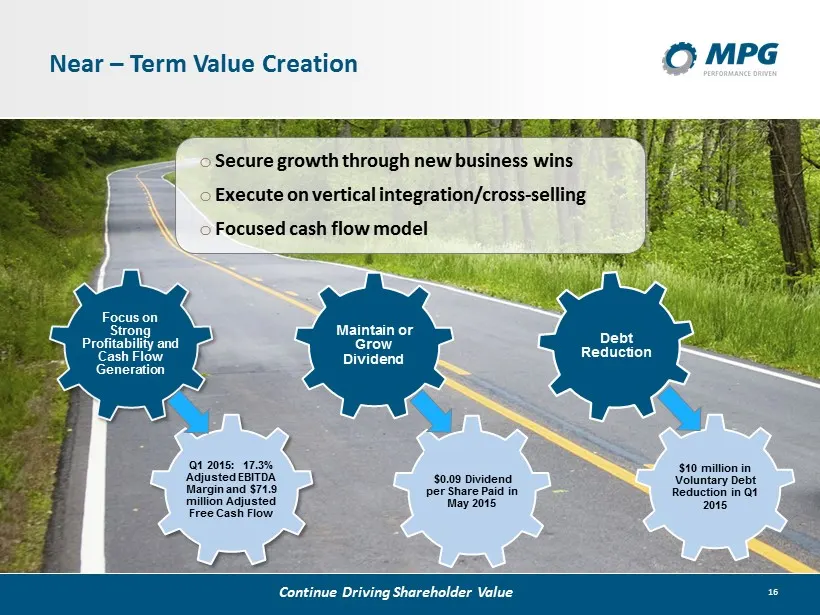
16 Near – Term Value Creation Focus on Strong Profitability and Cash Flow Generation Debt Reduction Maintain or Grow Dividend Continue Driving Shareholder Value o Secure growth through new business wins o Execute on vertical integration/cross - selling o Focused cash flow model Q1 2015: 17.3% Adjust
Slide 17: Investing for Value Creation
INVESTING FOR VALUE CREATION MPG
Slide 18: Positive Outlook for Primary Regions and Markets
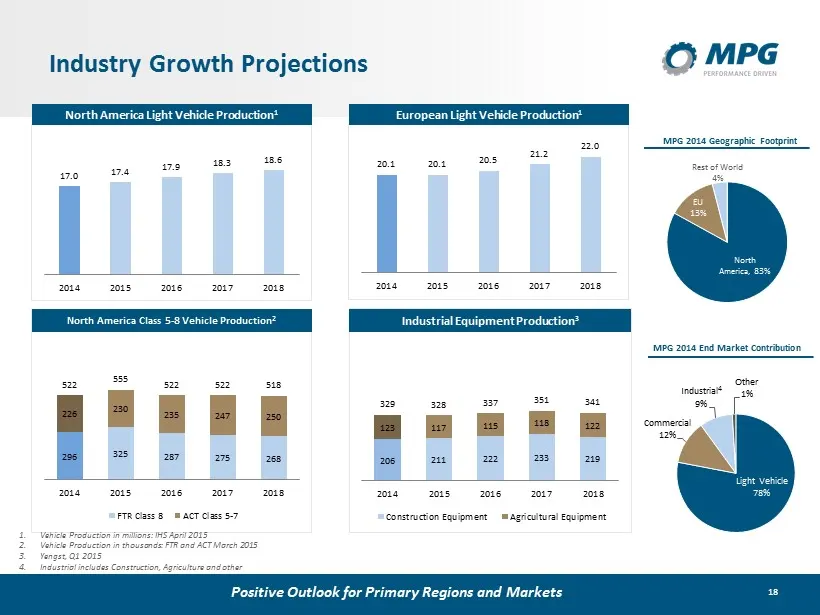
18 206 211 222 233 219 123 117 115 118 122 329 328 337 351 341 2014 2015 2016 2017 2018 Construction Equipment Agricultural Equipment 296 325 287 275 268 226 230 235 247 250 522 555 522 522 518 2014 2015 2016 2017 2018 FTR Class 8 ACT Class 5-7 17.0 17.4 17.9 18.3 18.6 2014 2015 2016 2017 2018 North
Slide 19: MPG's New Business/Growth Projects
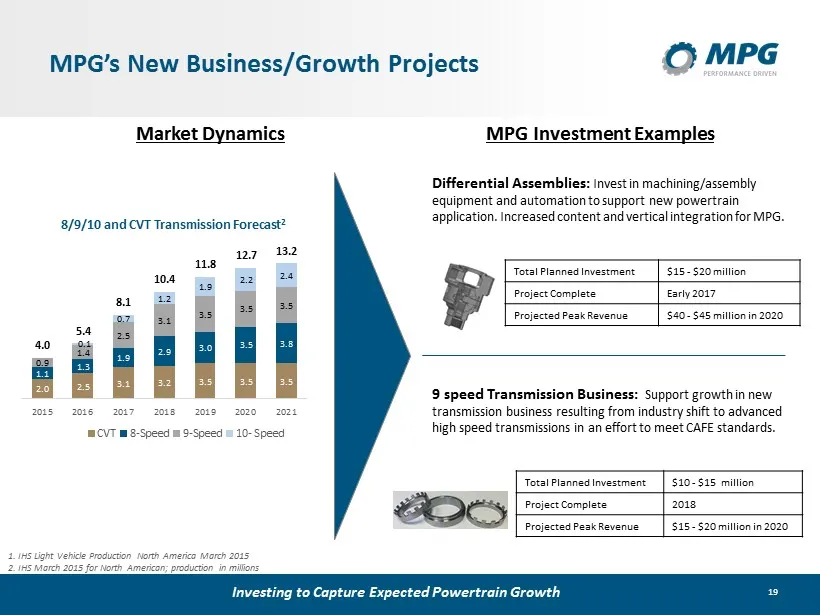
19 MPG’s New Business/Growth Projects Differential Assemblies: Invest in machining/assembly equipment and automation to support new powertrain application. Increased content and vertical integration for MPG. Total Planned Investment $15 - $20 million Project Complete Early 2017 Projected Peak Revenu
Slide 20: MPG's Cost Saving/Efficiency Improvement Projects
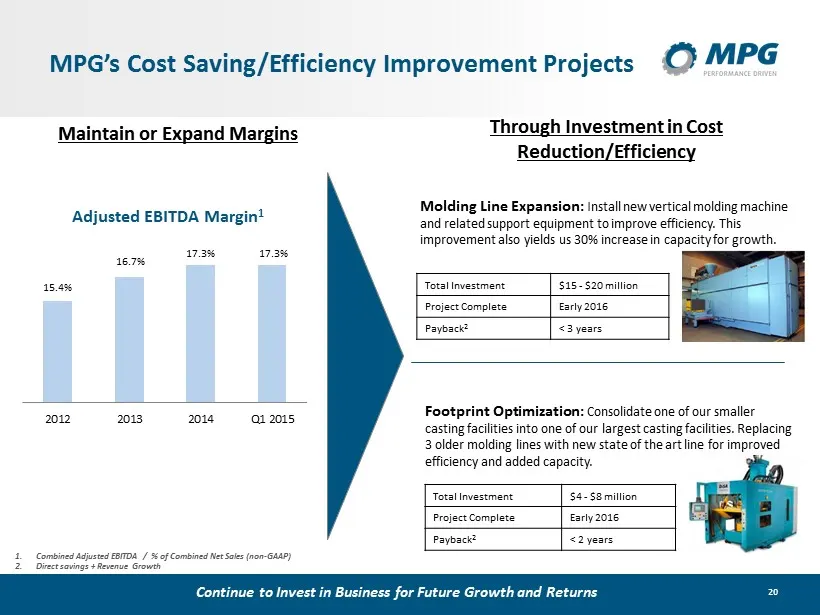
20 MPG’s Cost Saving/Efficiency Improvement Projects Molding Line Expansion: Install new vertical molding machine and related support equipment to improve efficiency. This improvement also yields us 30% increase in capacity for growth. Total Investment $15 - $20 million Project Complete Early 2016 P
Slide 21: Long-Term Value Creation
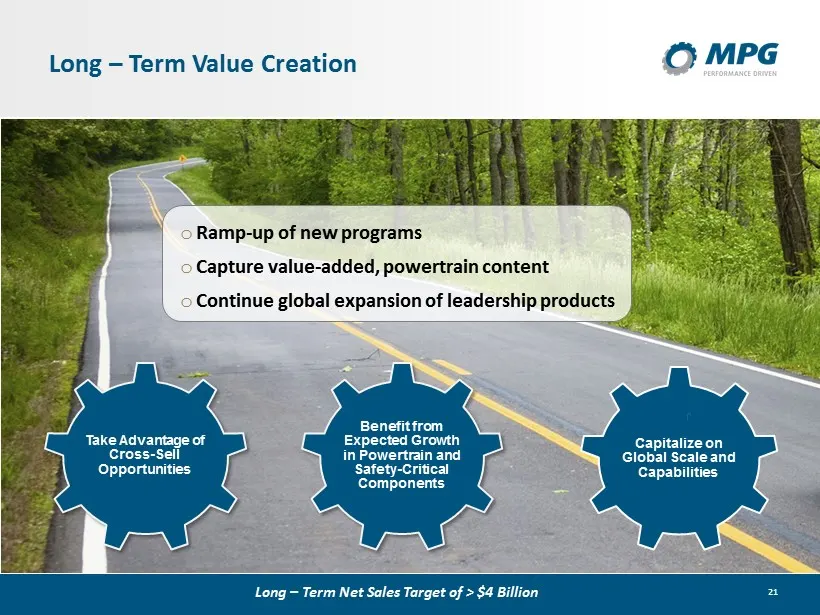
21 Long – Term Value Creation Benefit from Expected Growth in Powertrain and Safety - Critical Components Capitalize on Global Scale and Capabilities Take Advantage of Cross - Sell Opportunities Long – Term Net Sales Target of > $4 Billion o Ramp - up of new programs o Capture value - added, powertr
Slide 22: Q & A Session
Q & A SESSION MPG

Slide 23: Appendix
APPENDIX MPG
Slide 24: Assumptions
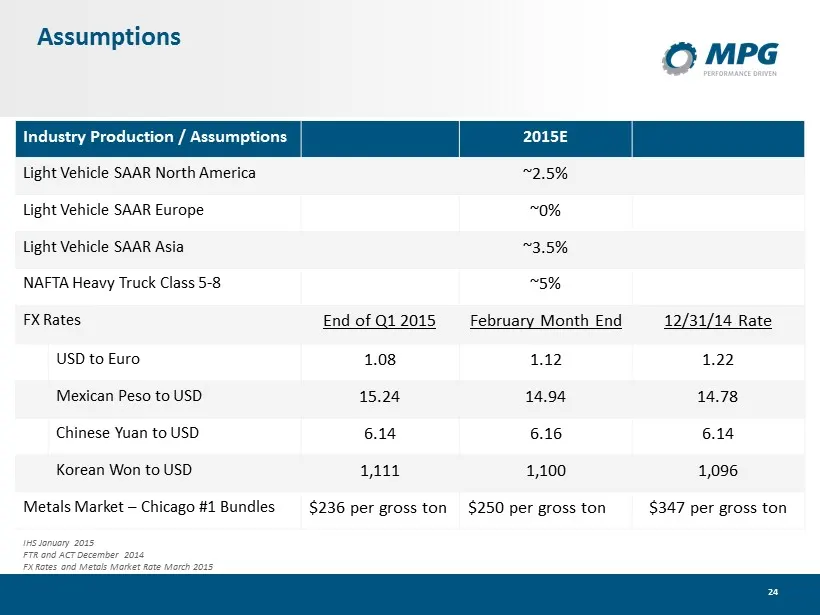
24 Assumptions Industry Production / Assumptions 2015E Light Vehicle SAAR North America ~2.5% Light Vehicle SAAR Europe ~0% Light Vehicle SAAR Asia ~3.5% NAFTA Heavy Truck Class 5 - 8 ~5% FX Rates End of Q1 2015 February Month End 12/31/14 Rate USD to Euro 1.08 1.12 1.22 Mexican Peso to USD 15.24 14
Slide 25: GAAP Reconciliation Guidance Slide
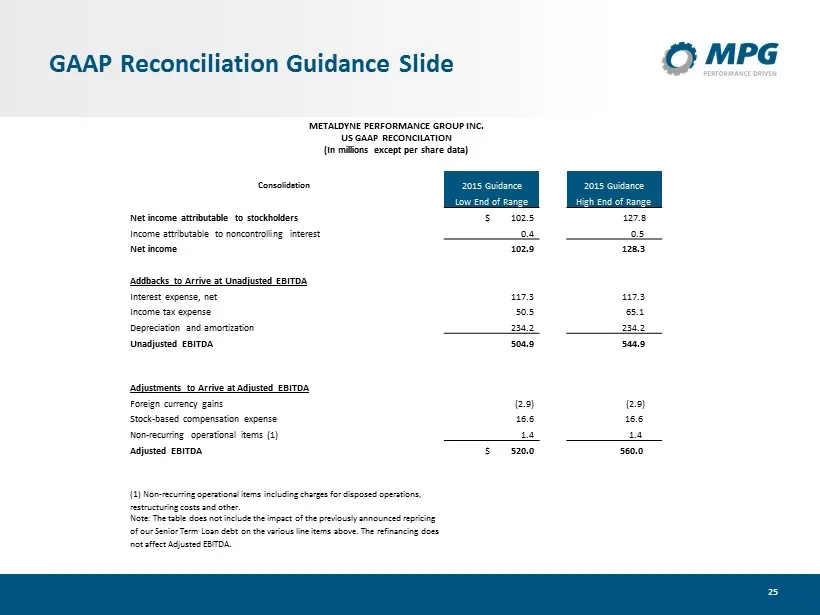
25 GAAP Reconciliation Guidance Slide Consolidation 2015 Guidance 2015 Guidance Low End of Range High End of Range Net income attributable to stockholders $ 102.5 127.8 Income attributable to noncontrolling interest 0.4 0.5 Net income 102.9 128.3 Addbacks to Arrive at Unadjusted EBITDA Interest expe
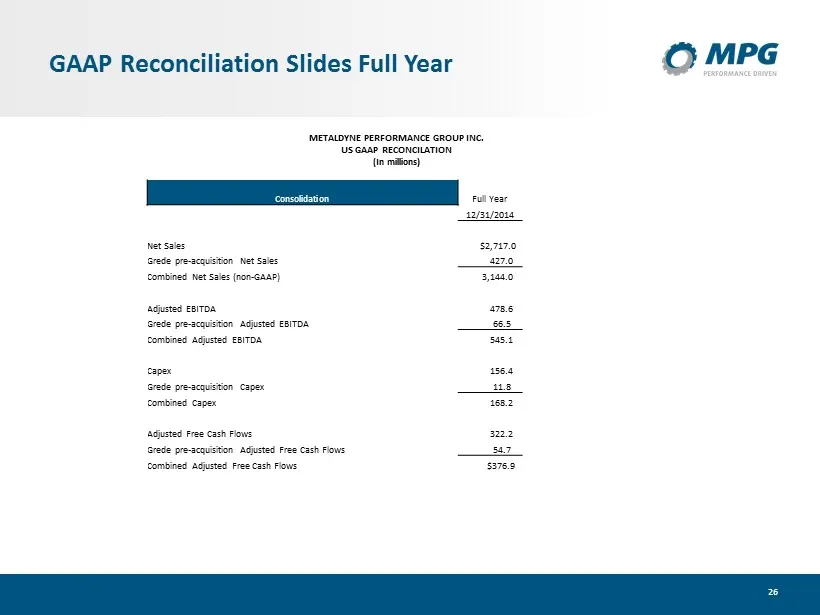
Slide 26: GAAP Reconciliation Slides Full Year Consolidation
26 GAAP Reconciliation Slides Full Year Consolidation Full Year 12/31/2014 Net Sales $2,717.0 Grede pre - acquisition Net Sales 427.0 Combined Net Sales (non - GAAP) 3,144.0 Adjusted EBITDA 478.6 Grede pre - acquisition Adjusted EBITDA 66.5 Combined Adjusted EBITDA 545.1 Capex 156.4 Grede pre - acqu
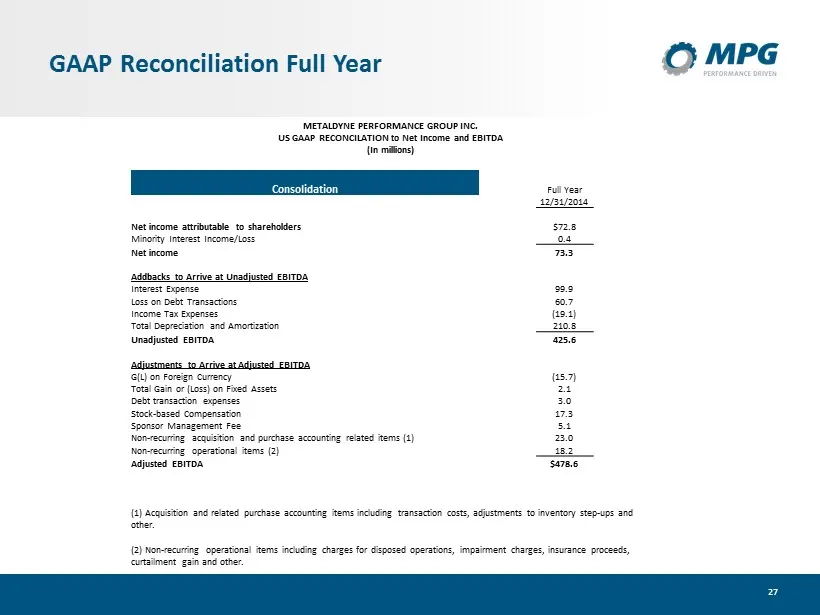
Slide 27: GAAP Reconciliation Full Year Consolidation
27 GAAP Reconciliation Full Year Consolidation Full Year 12/31/2014 Net income attributable to shareholders $72.8 Minority Interest Income/Loss 0.4 Net income 73.3 Addbacks to Arrive at Unadjusted EBITDA Interest Expense 99.9 Loss on Debt Transactions 60.7 Income Tax Expenses ( 19.1) Total Depreciat
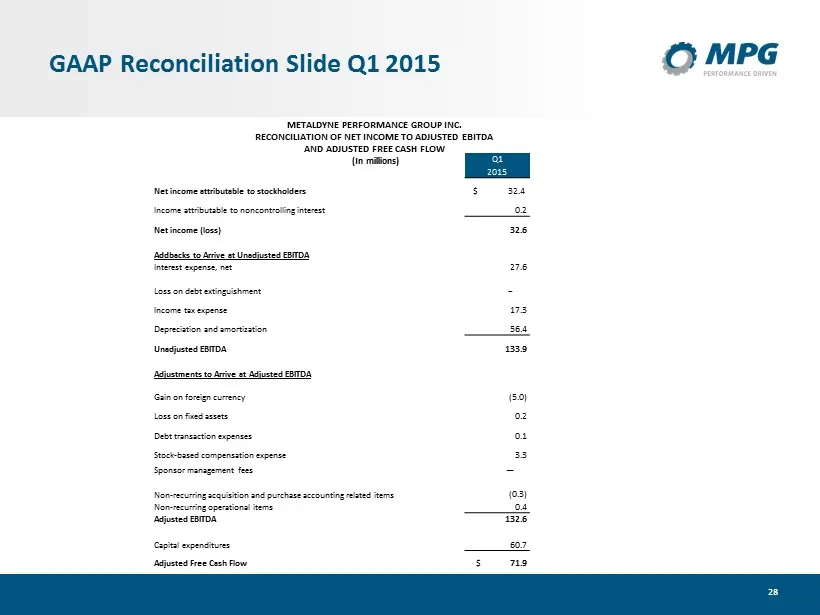
Slide 28: GAAP Reconciliation Slide Q1 2015
28 GAAP Reconciliation Slide Q1 2015 Q1 2015 Net income attributable to stockholders $ 32.4 Income attributable to noncontrolling interest 0.2 Net income (loss) 32.6 Addbacks to Arrive at Unadjusted EBITDA Interest expense, net 27.6 Loss on debt extinguishment − Income tax expense 17.3 Depreciation
Source: SEC EDGAR · 8-K filed May 28, 2015
More decks from Metaldyne Performance Group Inc
 Debt Investor Presentation (February 2017)55 slides · Feb 23, 2017
 Merger or Acquisition (January 2017)37 slides · Jan 11, 2017
 2016 Bank of America Merrill Lynch Leveraged Finance Conference38 slides · Nov 30, 2016
 Merger or Acquisition (November 2016)26 slides · Nov 17, 2016
 Merger or Acquisition (November 2016)25 slides · Nov 3, 2016
 Deutsche Bank Leveraged Finance Conference 201630 slides · Sep 27, 2016