Metaldyne Performance Group Inc
Metaldyne Performance — Merger or Acquisition (November 2016)
26 slides from Metaldyne Performance's merger presentation, Nov 17, 2016
Slide 1: Barclays 2016 Global Automotive Conference
BARCLAYS 2016 GLOBAL AUTOMOTIVE CONFERENCE NOVEMBER 17, 2016
Slide 2: Forward-looking statements
Some of the information presented in this document and discussions that follow, including, without limitation, statements with respect to the transaction and the anticipated consequences and benefits of the transaction, the targeted close date for the transaction, product development, market trends,
Slide 3: Important Information for Stockholders and Investors
Important Information for Stockholders and Investors This announcement is provided for informational purposes only and is neither an offer to purchase nor a solicitation of an offer to sell shares of AAM or MPG. Subject to future developments, AAM and MPG will file a joint proxy statement/prospectus
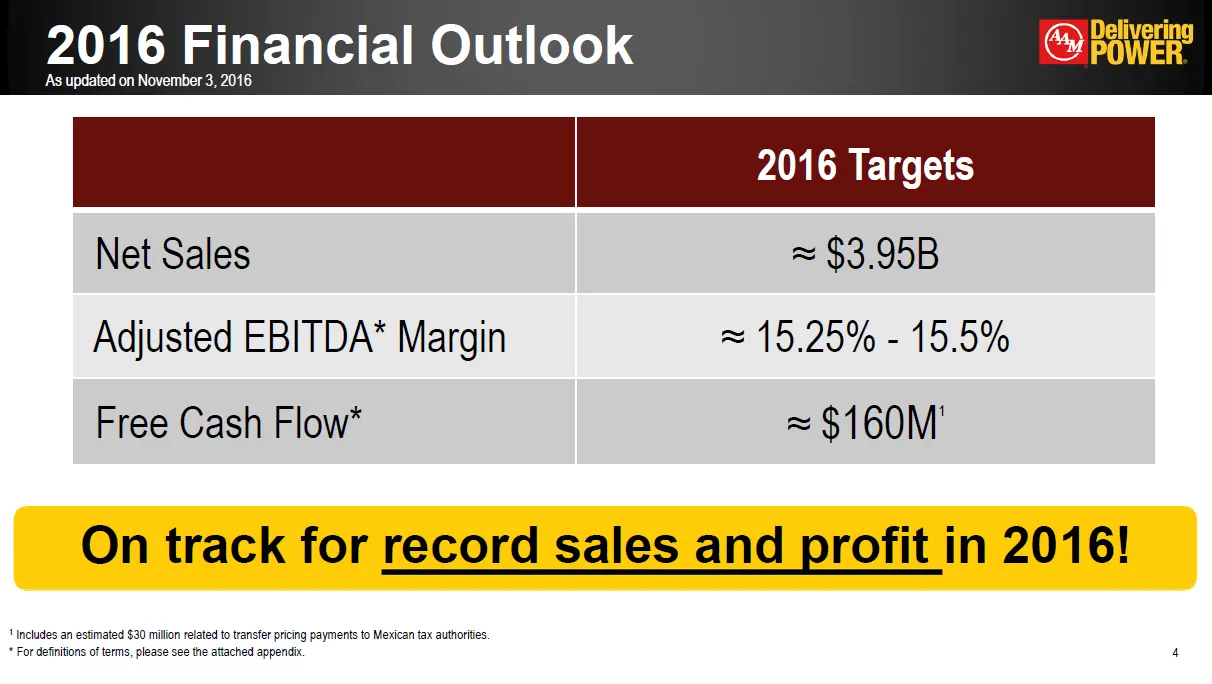
Slide 4: 2016 Financial Outlook
* 2016 Targets Net Sales ≈ $3.95B Adjusted EBITDA* Margin ≈ 15.25% - 15.5% Free Cash Flow* ≈ $160M1 2016 Financial Outlook On track for record sales and profit in 2016! 1 Includes an estimated $30 million related to transfer pricing payments to Mexican tax authorities.* For definitions of terms, ple
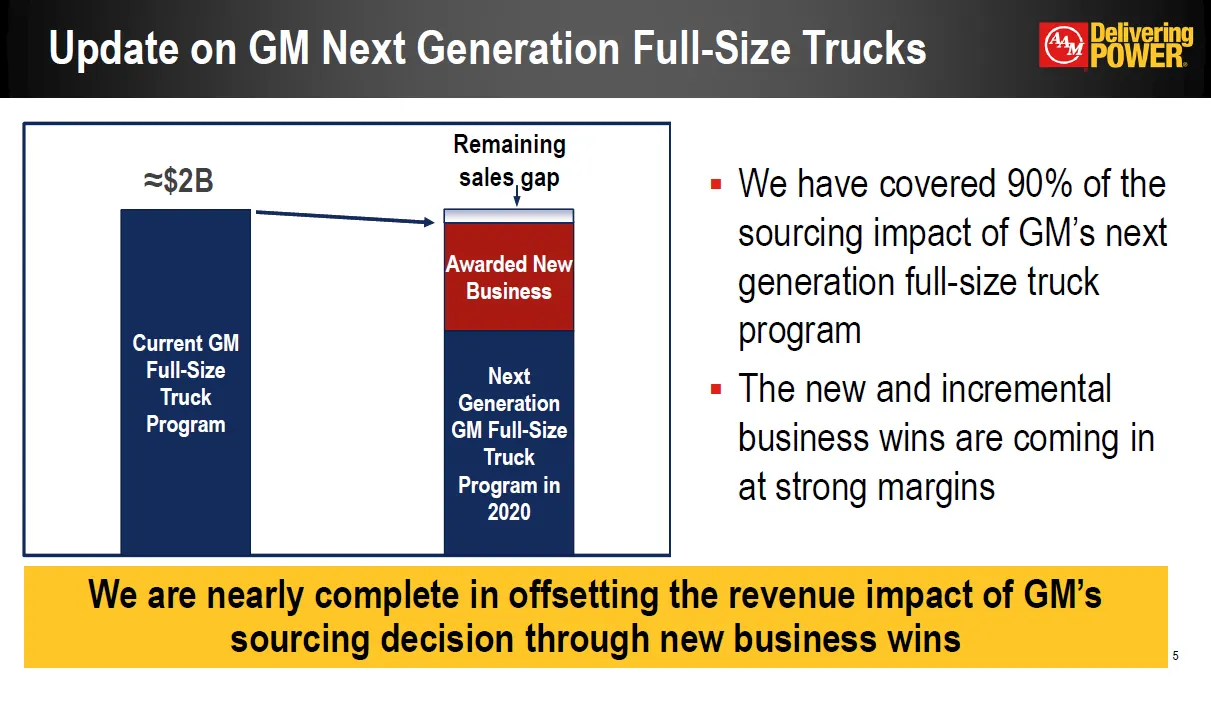
Slide 5: Update on GM Next Generation Full-Size Trucks
Update on GM Next Generation Full-Size Trucks * Remaining sales gap We have covered 90% of the sourcing impact of GM’s next generation full-size truck programThe new and incremental business wins are coming in at strong margins We are nearly complete in offsetting the revenue impact of GM’s sourcing
Slide 6: AAM's Acquisition of MPG (Metaldyne Performance Group)
AAM’S ACQUISITION OF MPG (METALDYNE PERFORMANCE GROUP) Increased Global Scale │ Expanded Product Portfolio │ Accelerated Diversification │ Enhanced Cash Flow Generation
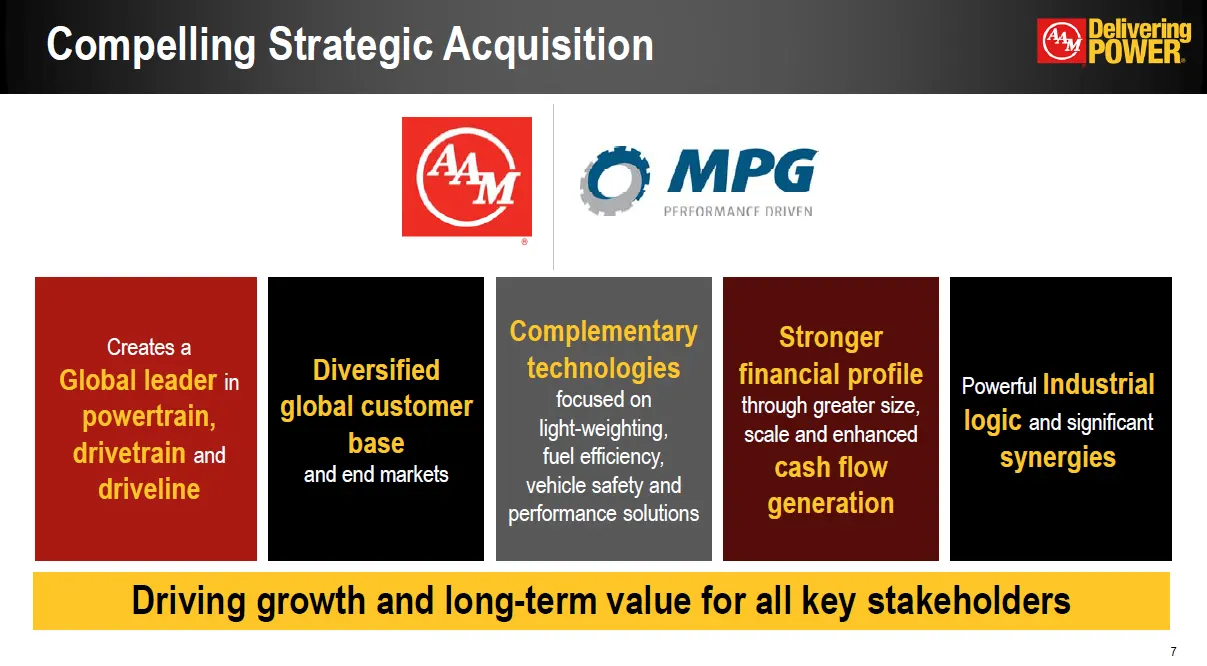
Slide 7: Compelling Strategic Acquisition
Driving growth and long-term value for all key stakeholders Creates a Global leader in powertrain, drivetrain and driveline Diversified global customer base and end markets Complementary technologies focused on light-weighting, fuel efficiency, vehicle safety and performance solutions Stronger finan
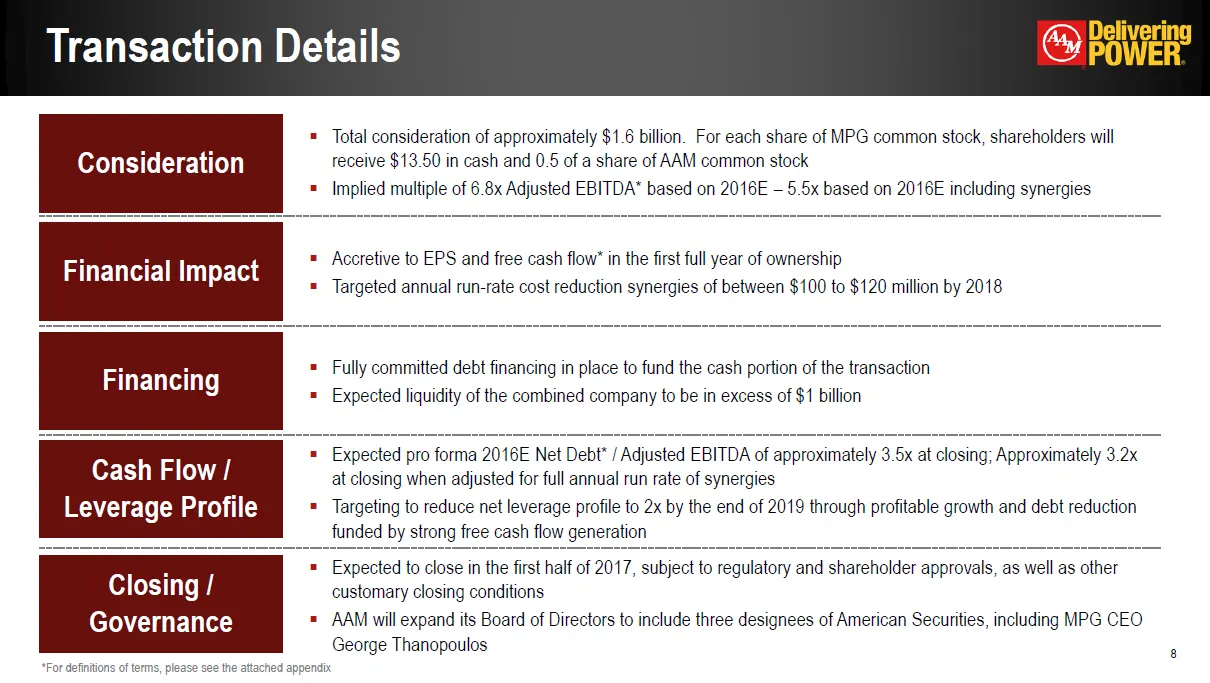
Slide 8: Transaction Details
Transaction Details * Consideration Total consideration of approximately $1.6 billion. For each share of MPG common stock, shareholders will receive $13.50 in cash and 0.5 of a share of AAM common stock Implied multiple of 6.8x Adjusted EBITDA* based on 2016E – 5.5x based on 2016E including synergie
Slide 9: Significantly Enhanced Scale and Profitability
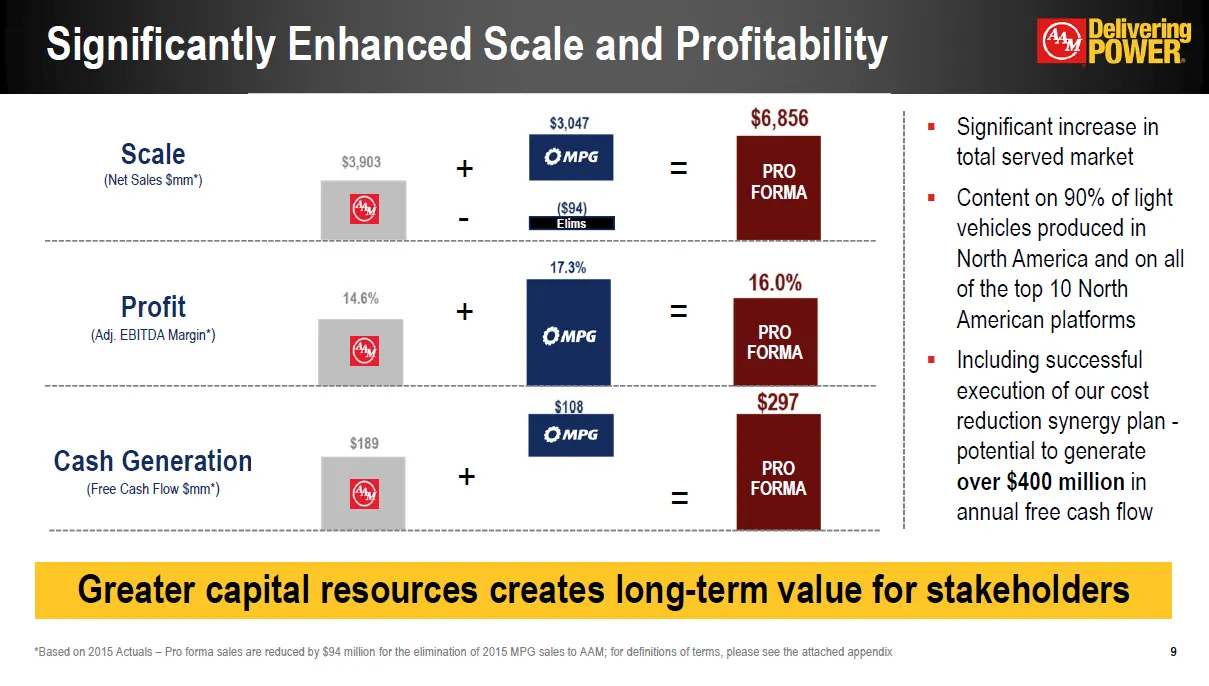
*Based on 2015 Actuals – Pro forma sales are reduced by $94 million for the elimination of 2015 MPG sales to AAM; for definitions of terms, please see the attached appendix Significantly Enhanced Scale and Profitability * Scale(Net Sales $mm*) Profit(Adj. EBITDA Margin*) Cash Generation(Free Cash Fl
Slide 10: Comprehensive Solutions from Engine to Driveline
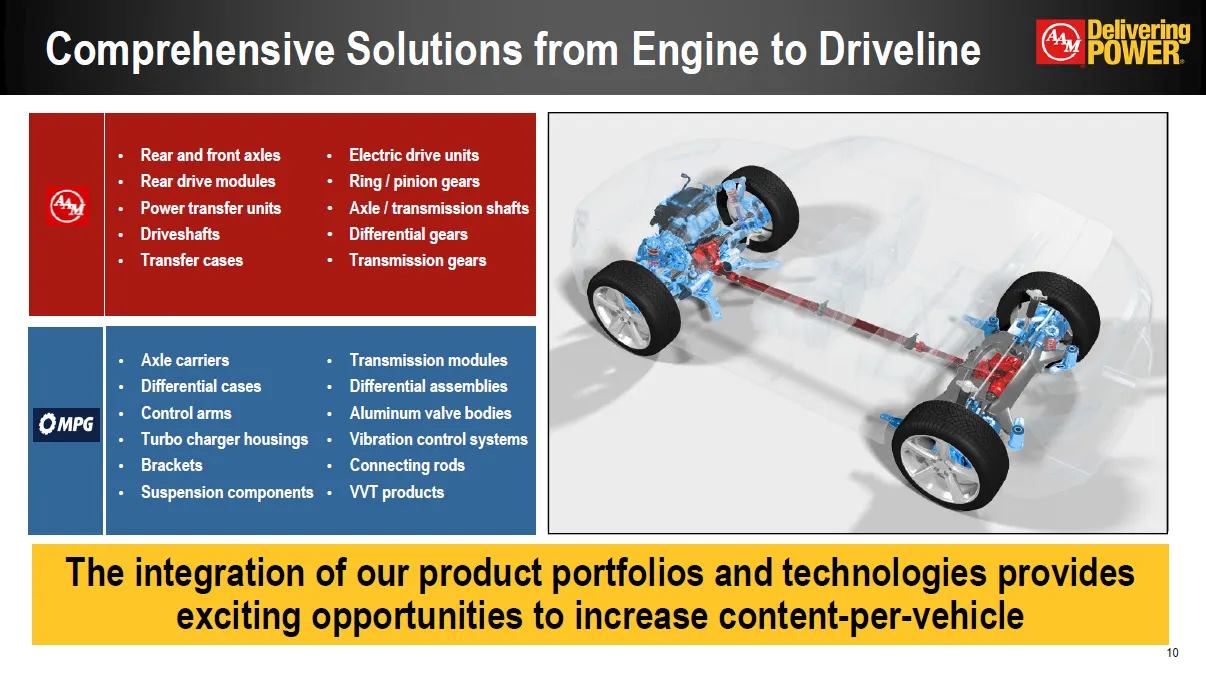
Comprehensive Solutions from Engine to Driveline * The integration of our product portfolios and technologies provides exciting opportunities to increase content-per-vehicle
Slide 11: Expanded Product Portfolio
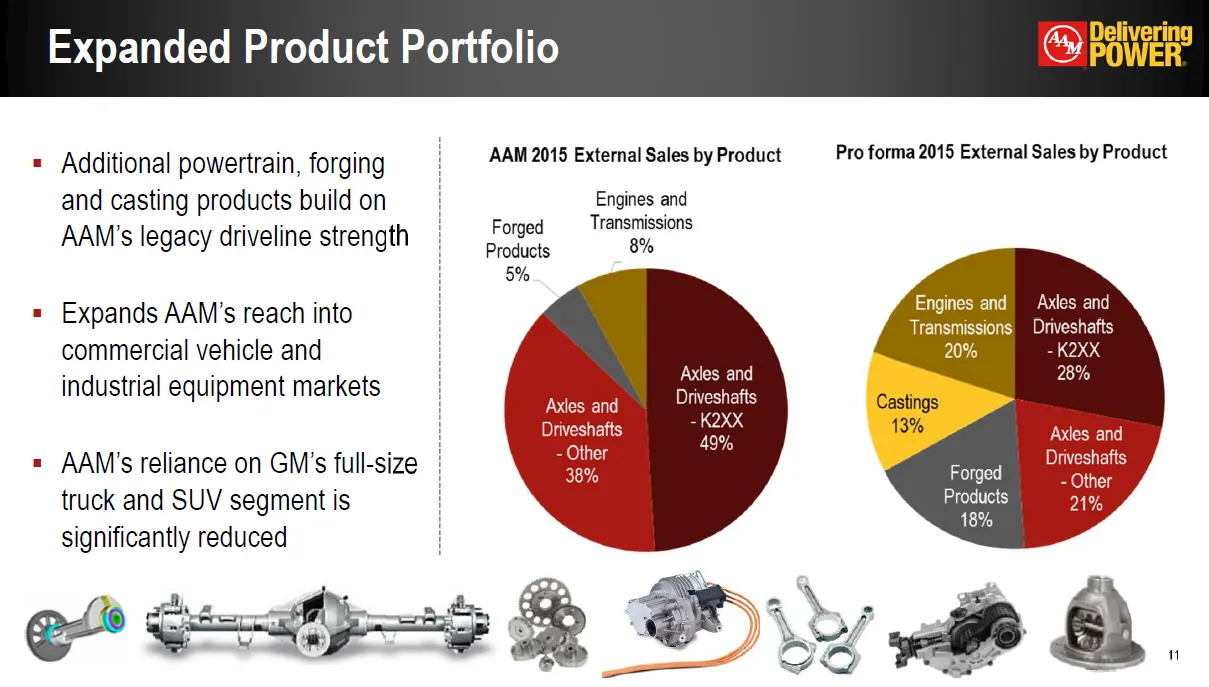
Additional powertrain, forging and casting products build on AAM’s legacy driveline strengthExpands AAM’s reach into commercial vehicle and industrial equipment marketsAAM’s reliance on GM’s full-size truck and SUV segment is significantly reduced Expanded Product Portfolio *
Slide 12: Accelerated Customer Diversification
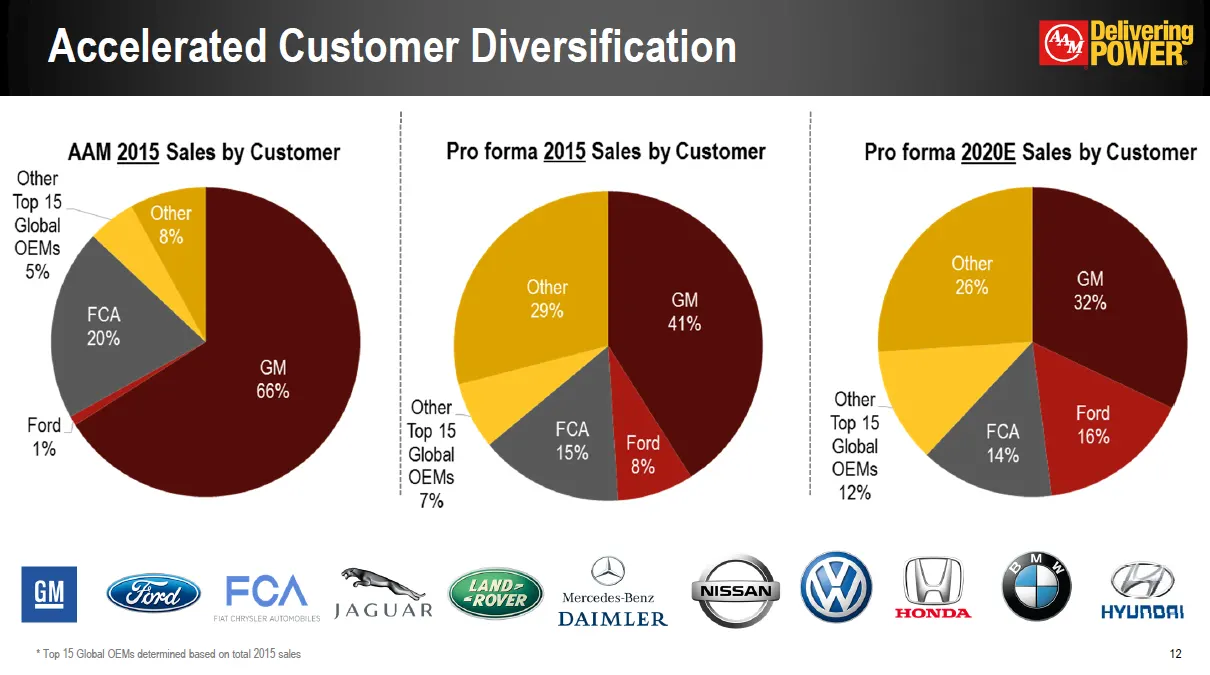
Accelerated Customer Diversification * * Top 15 Global OEMs determined based on total 2015 sales
Slide 13: Anticipated Synergies
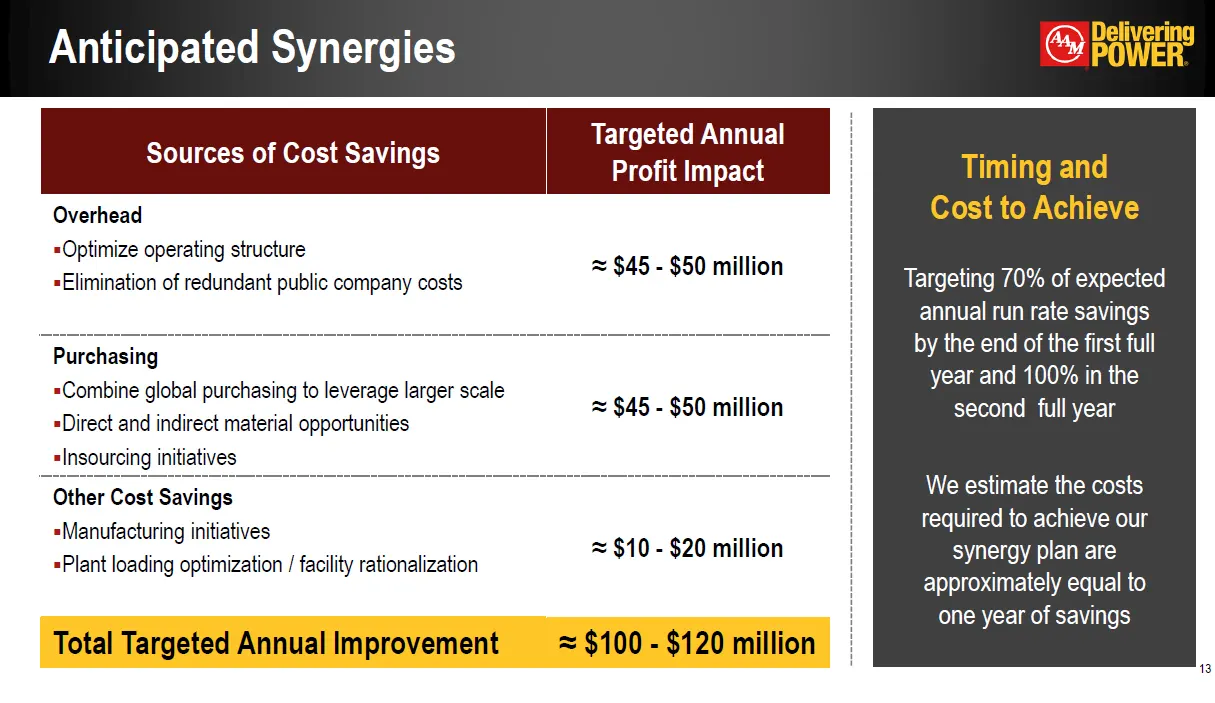
Anticipated Synergies * Sources of Cost Savings Targeted Annual Profit Impact OverheadOptimize operating structureElimination of redundant public company costs ≈ $45 - $50 million PurchasingCombine global purchasing to leverage larger scaleDirect and indirect material opportunitiesInsourcing initiat
Slide 14: US SAAR and NA Production Assumptions
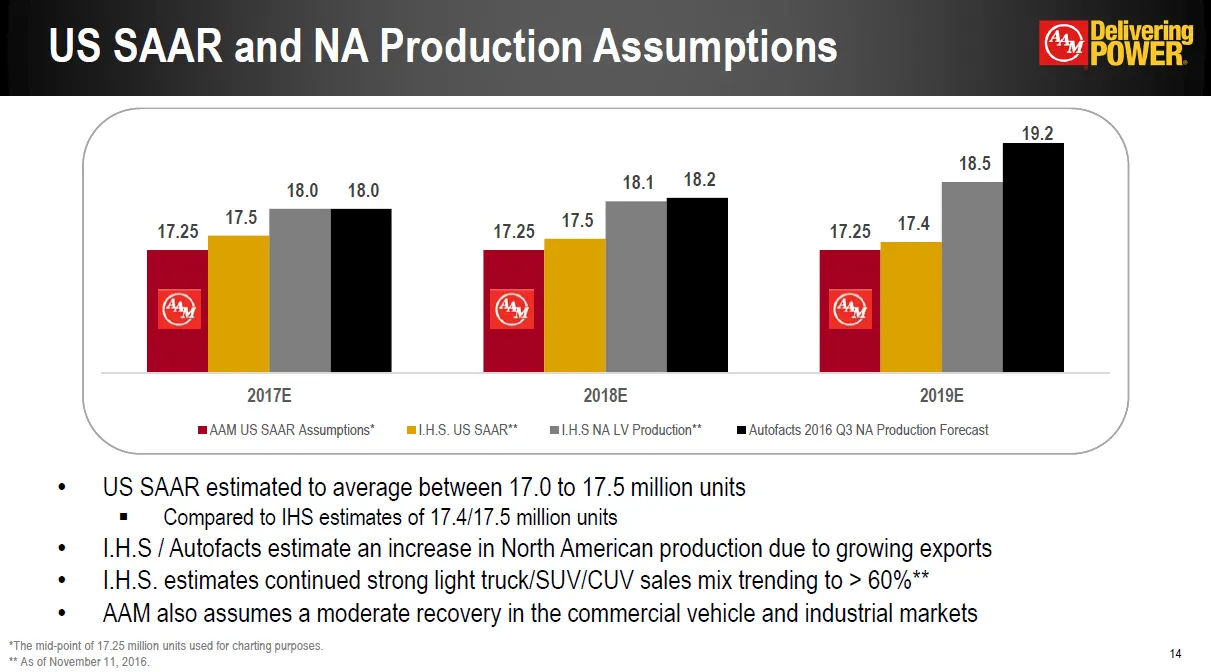
US SAAR and NA Production Assumptions * US SAAR estimated to average between 17.0 to 17.5 million unitsCompared to IHS estimates of 17.4/17.5 million units I.H.S / Autofacts estimate an increase in North American production due to growing exportsI.H.S. estimates continued strong light truck/SUV/CUV
Slide 15: Pro Forma 2017 – 2019 Financial Targets
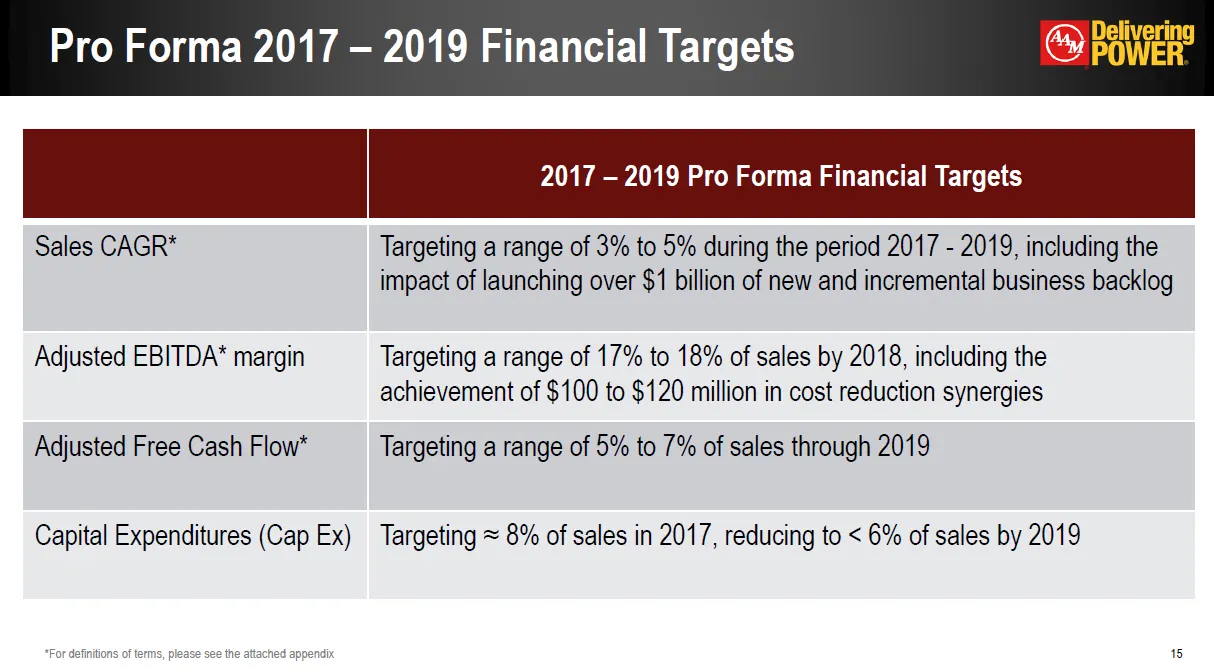
Pro Forma 2017 – 2019 Financial Targets * 2017 – 2019 Pro Forma Financial Targets Sales CAGR* Targeting a range of 3% to 5% during the period 2017 - 2019, including the impact of launching over $1 billion of new and incremental business backlog Adjusted EBITDA* margin Targeting a range of 17% to 18%
Slide 16: Expected Pro Forma EBITDA vs. Cash Payments
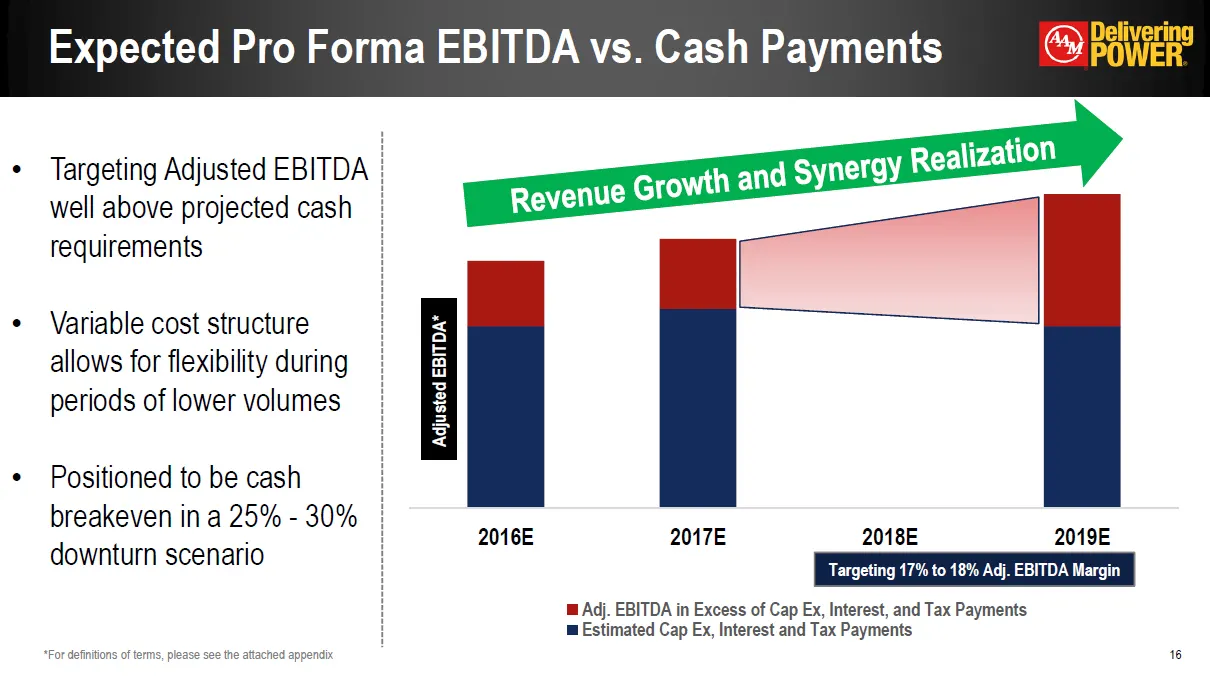
Expected Pro Forma EBITDA vs. Cash Payments * Revenue Growth and Synergy Realization Adjusted EBITDA* Targeting Adjusted EBITDA well above projected cash requirementsVariable cost structure allows for flexibility during periods of lower volumesPositioned to be cash breakeven in a 25% - 30% downturn
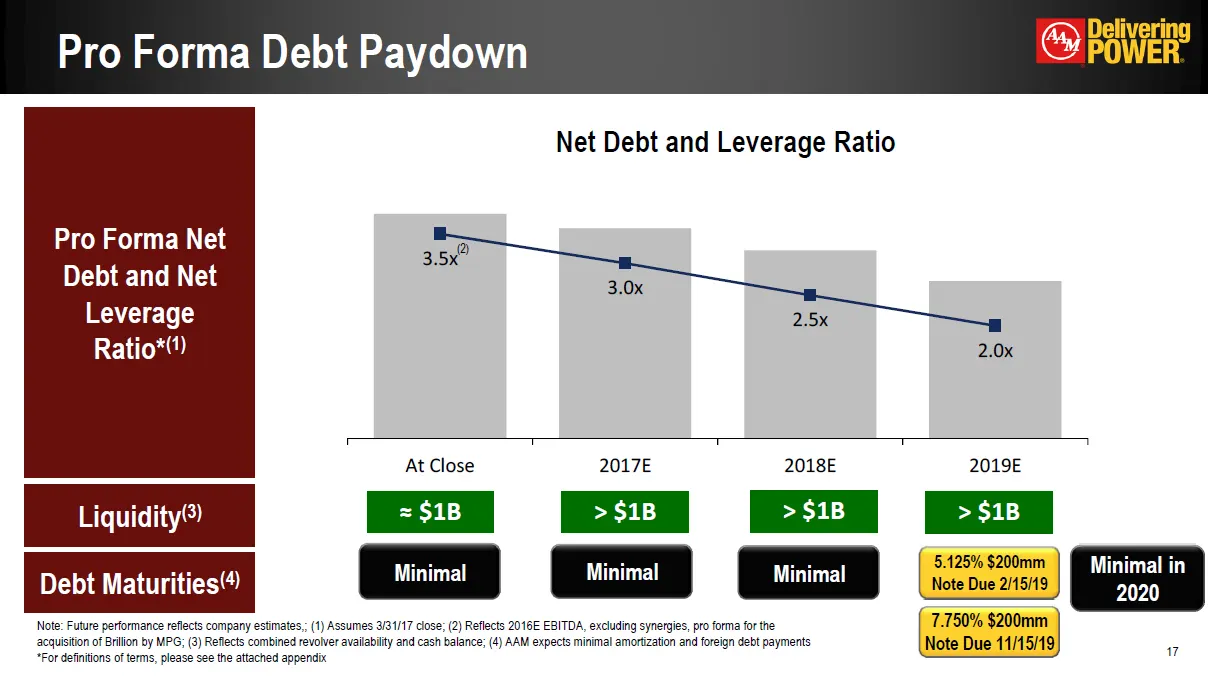
Slide 17: Pro Forma Debt Paydown and Net Leverage
* Note: Future performance reflects company estimates,; (1) Assumes 3/31/17 close; (2) Reflects 2016E EBITDA, excluding synergies, pro forma for the acquisition of Brillion by MPG; (3) Reflects combined revolver availability and cash balance; (4) AAM expects minimal amortization and foreign debt pay
Slide 18: Enhanced Credit Profile
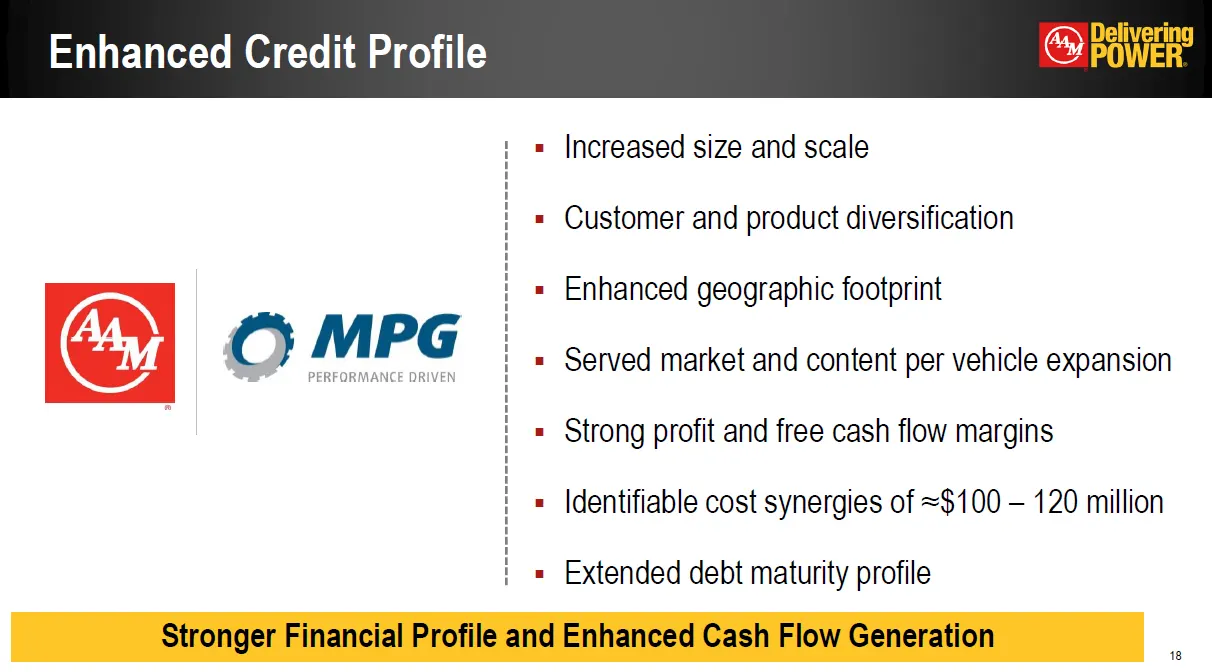
Enhanced Credit Profile * Stronger Financial Profile and Enhanced Cash Flow Generation Increased size and scaleCustomer and product diversificationEnhanced geographic footprintServed market and content per vehicle expansionStrong profit and free cash flow marginsIdentifiable cost synergies of ≈$100
Slide 19: Powerful Industrial Logic
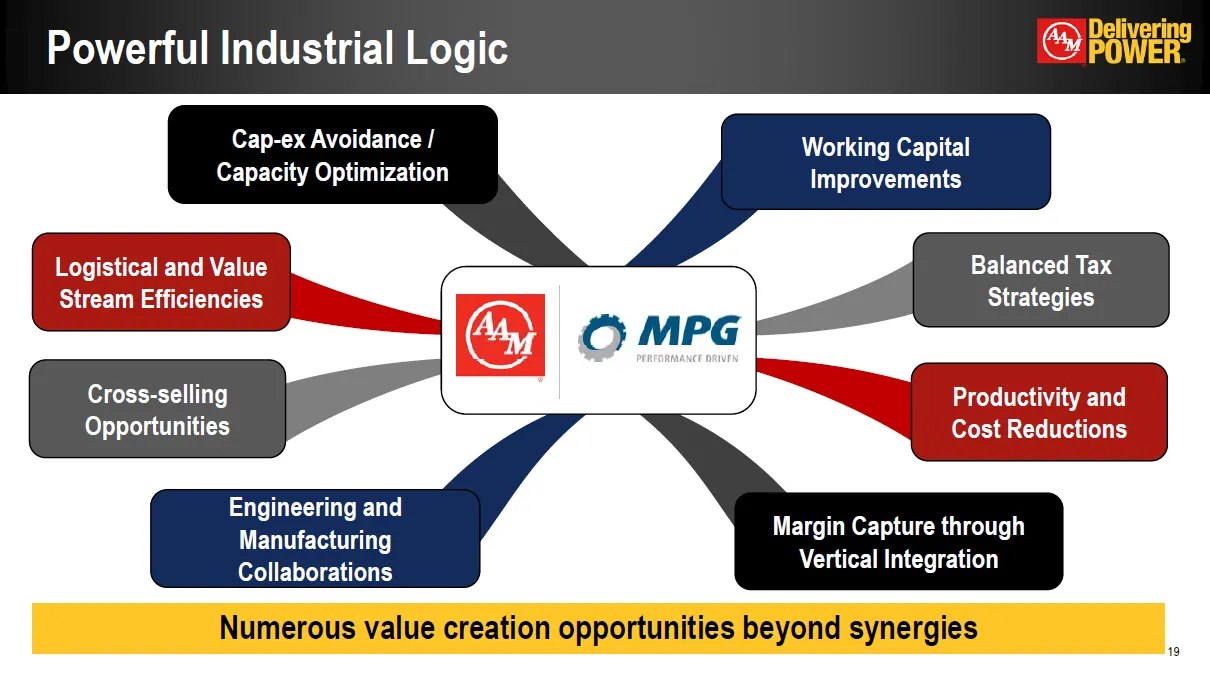
Powerful Industrial Logic * Logistical and Value Stream Efficiencies Cross-selling Opportunities Cap-ex Avoidance / Capacity Optimization Balanced Tax Strategies Margin Capture through Vertical Integration Productivity and Cost Reductions Working Capital Improvements Numerous value creation opportun

Slide 20: Appendix
APPENDIX *
Slide 21: Shareholder Value Enhancement Opportunity
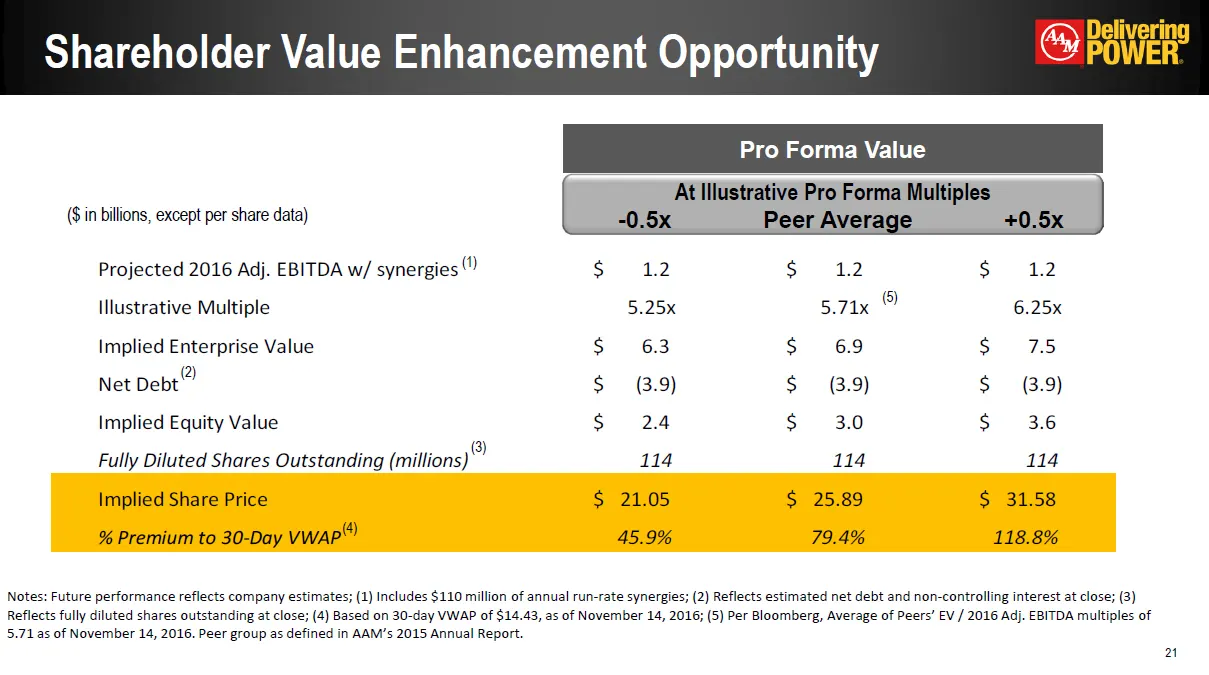
Shareholder Value Enhancement Opportunity * Notes: Future performance reflects company estimates; (1) Includes $110 million of annual run-rate synergies; (2) Reflects estimated net debt and non-controlling interest at close; (3) Reflects fully diluted shares outstanding at close; (4) Based on 30-day
Slide 22: Non-GAAP financial measures
In addition to the results reported in accordance with accounting principles generally accepted in the United States of America (GAAP) included within this presentation, we have provided certain information, which includes non-GAAP financial measures. Such information is reconciled to its closest GA
Slide 23: Reconciliation of Non-GAAP Measures
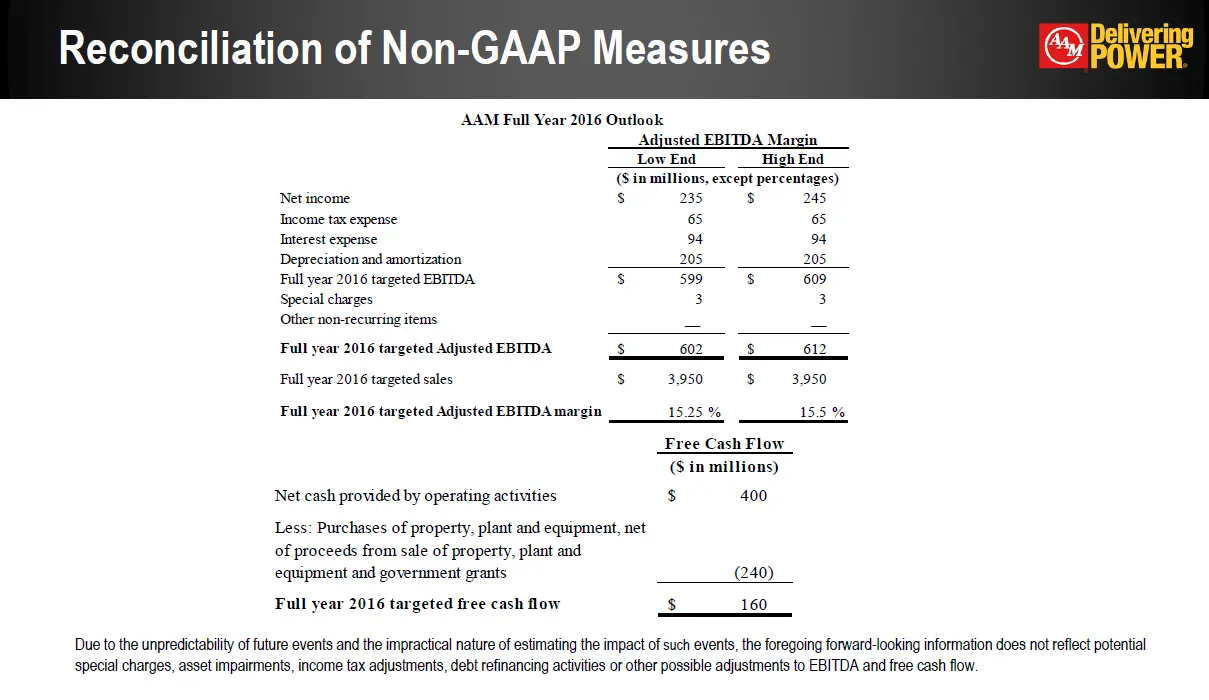
Reconciliation of Non-GAAP Measures Due to the unpredictability of future events and the impractical nature of estimating the impact of such events, the foregoing forward-looking information does not reflect potential special charges, asset impairments, income tax adjustments, debt refinancing activ
Slide 24: Reconciliation of Non-GAAP Measures
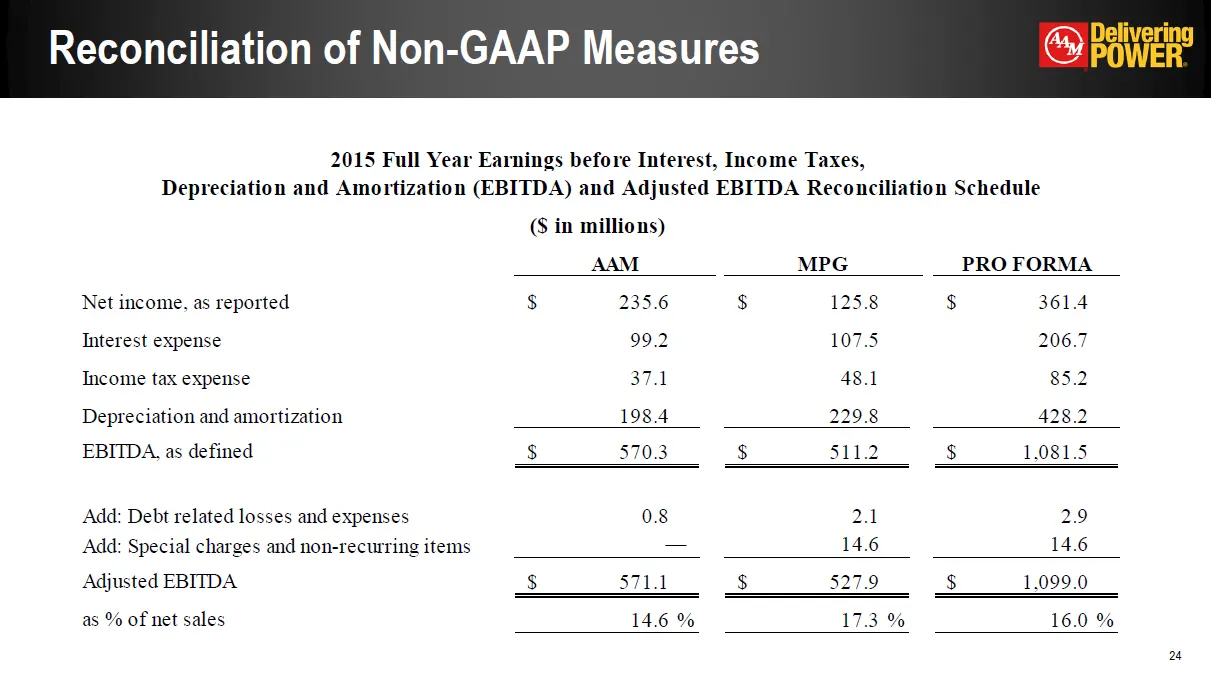
Reconciliation of Non-GAAP Measures *
Slide 25: Reconciliation of Non-GAAP Measures
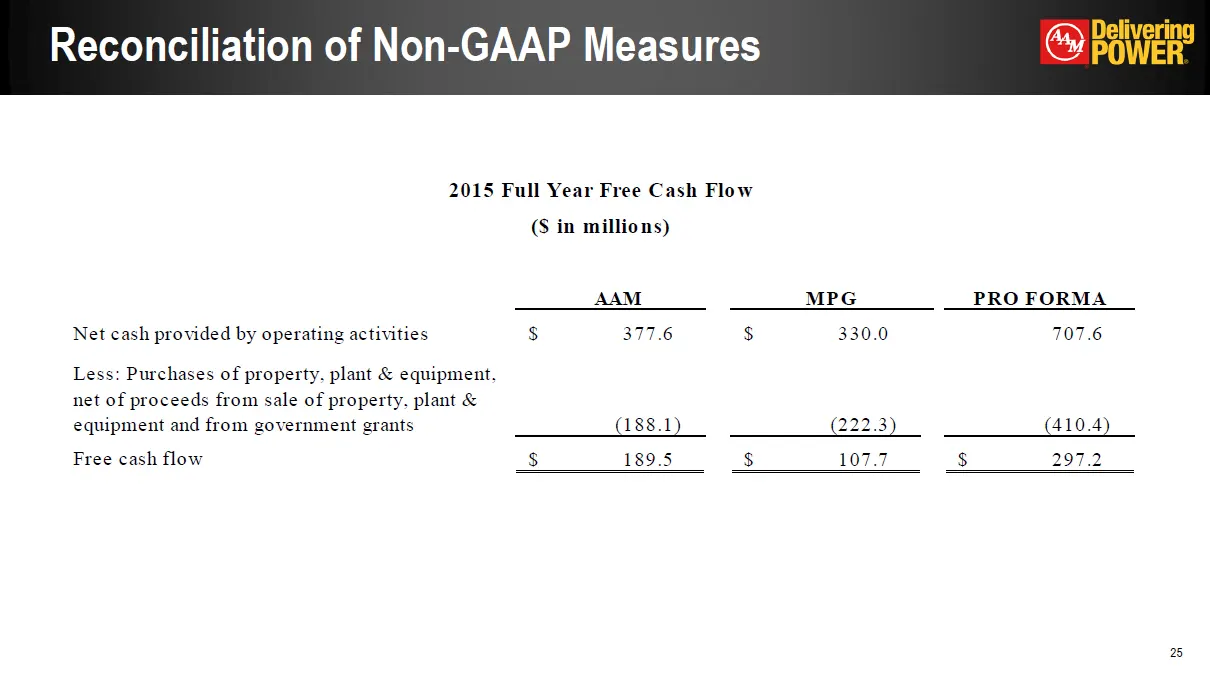
Reconciliation of Non-GAAP Measures *
Slide 26: Reconciliation of Non-GAAP Measures
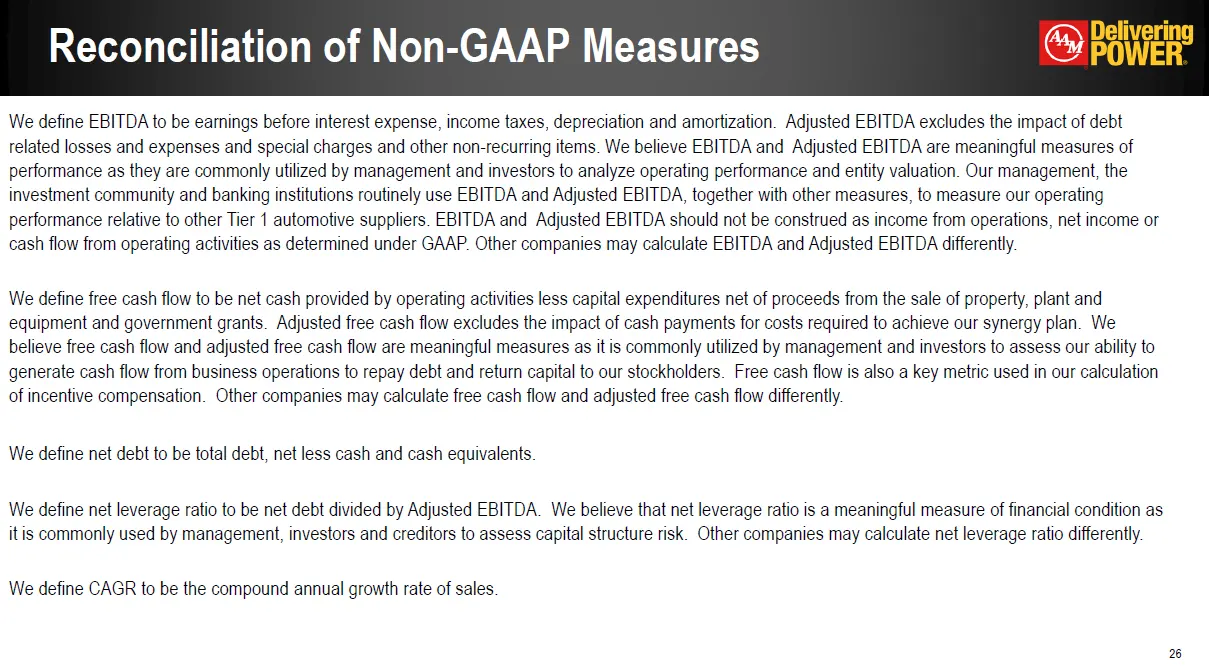
Reconciliation of Non-GAAP Measures * We define EBITDA to be earnings before interest expense, income taxes, depreciation and amortization. Adjusted EBITDA excludes the impact of debt related losses and expenses and special charges and other non-recurring items. We believe EBITDA and Adjusted EBITDA
Source: SEC EDGAR · 425 filed Nov 17, 2016
More decks from Metaldyne Performance Group Inc
 Debt Investor Presentation (February 2017)55 slides · Feb 23, 2017
 Merger or Acquisition (January 2017)37 slides · Jan 11, 2017
 2016 Bank of America Merrill Lynch Leveraged Finance Conference38 slides · Nov 30, 2016
 Merger or Acquisition (November 2016)25 slides · Nov 3, 2016
 Deutsche Bank Leveraged Finance Conference 201630 slides · Sep 27, 2016
 Goldman Sachs Leveraged Finance Conference 201627 slides · May 17, 2016