Metaldyne Performance Group Inc
Metaldyne Performance — Goldman Sachs Leveraged Finance Conference 2016
27 slides from Metaldyne Performance's conference presentation, May 17, 2016
Slide 1: Goldman Sachs Leveraged Finance Conference May 17, 2016
Goldman Sachs Leveraged Finance Conference May 17, 2016
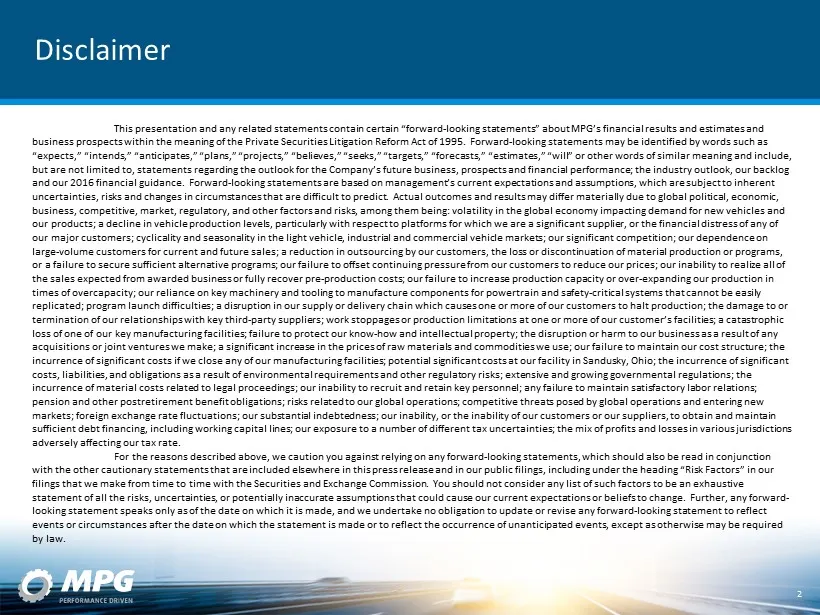
Slide 2: Disclaimer
Disclaimer This presentation and any related statements contain certain “forward - looking statements” about MPG’s financial results and esti mates and business prospects within the meaning of the Private Securities Litigation Reform Act of 1995. Forward - looking statements may b e identified by wo
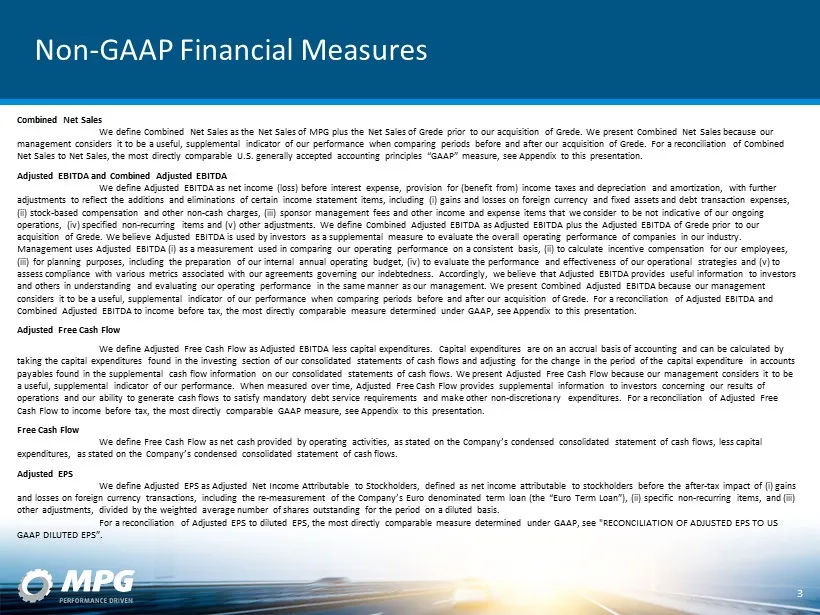
Slide 3: Non-GAAP Financial Measures
Non - GAAP Financial Measures Combined Net Sales We define Combined Net Sales as the Net Sales of MPG plus the Net Sales of Grede prior to our acquisition of Grede. We presen t C ombined Net Sales because our management considers it to be a useful, supplemental indicator of our performance when comp
Slide 4: Business Overview and 2016 Priorities
BUSINESS OVERVIEW AND 2016 PRIORITIES
Slide 5: The MPG Story
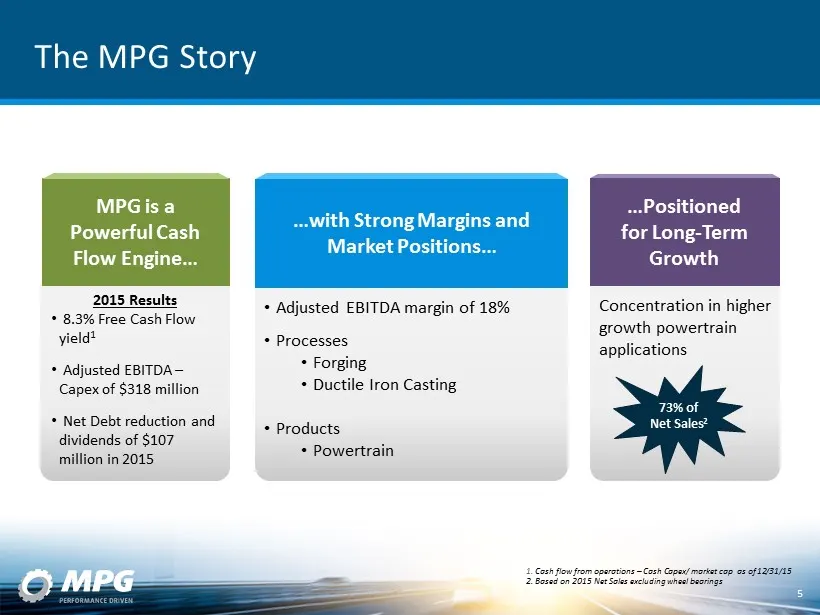
The MPG Story 5 MPG is a Powerful C ash F low Engine… …Positioned for Long - Term Growth 1. Cash flow from operations – Cash Capex/ market cap as of 12/31/15 2. Based on 2015 Net Sales excluding wheel bearings …with Strong Margins and Market Positions… 2015 Results • 8.3% Free Cash Flow yield 1 • Ad
Slide 6: The MPG Value Proposition
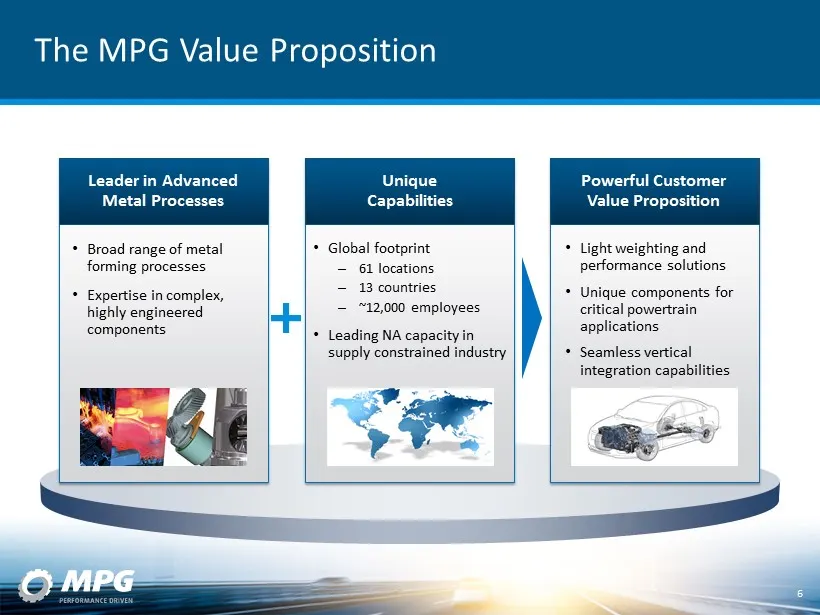
The MPG Value Proposition 6 Leader in Advanced Metal Processes Unique Capabilities Powerful Customer Value Proposition • Broad range of metal forming processes • Expertise in complex, highly engineered components • Global footprint – 61 locations – 13 countries – ~12,000 employees • Leading NA capac
Slide 7: Broad Global Footprint
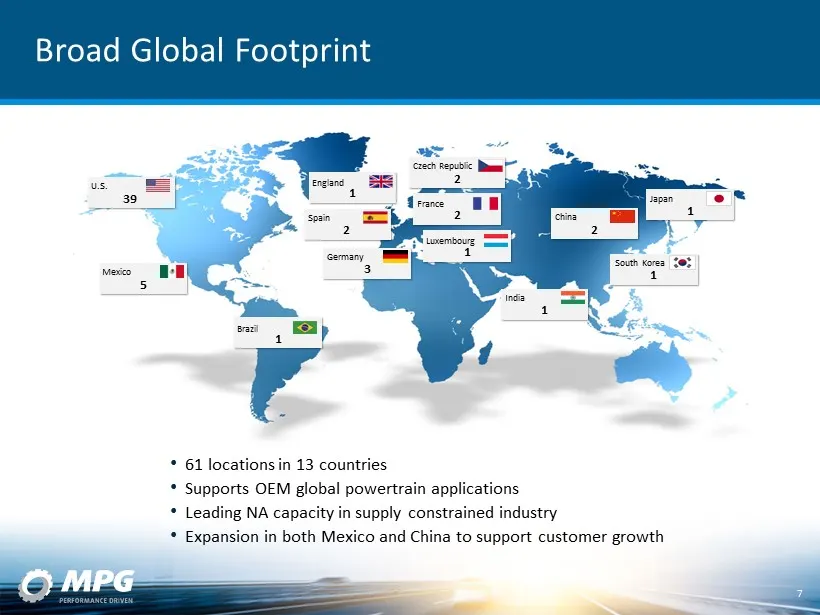
Broad Global Footprint • 61 locations in 13 countries • Supports OEM global powertrain applications • Leading NA capacity in supply constrained industry • Expansion in both Mexico and China to support customer growth 7 U.S. Brazil South Korea Germany Mexico England Spain Luxembourg France Czech Repu
Slide 8: Focused On Faster Growing Powertrain Applications
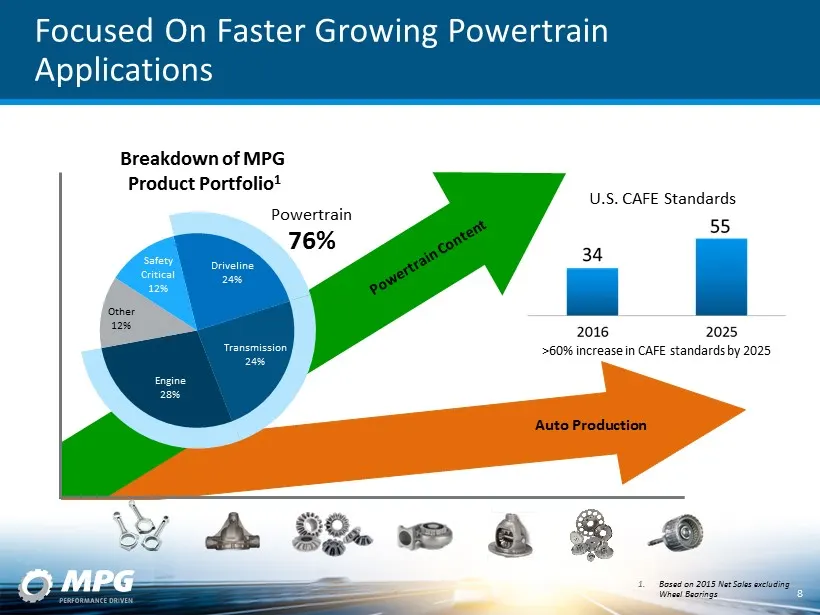
Driveline 24% Transmission 24% Engine 28% Other 12% Safety Critical 12% 1. Based on 2015 Net Sales excluding Wheel Bearings Focused On Faster Growing Powertrain Applications Breakdown of MPG Product Portfolio 1 Powertrain 76% >60% increase in CAFE standards by 2025 U.S. CAFE Standards 8 Auto Product
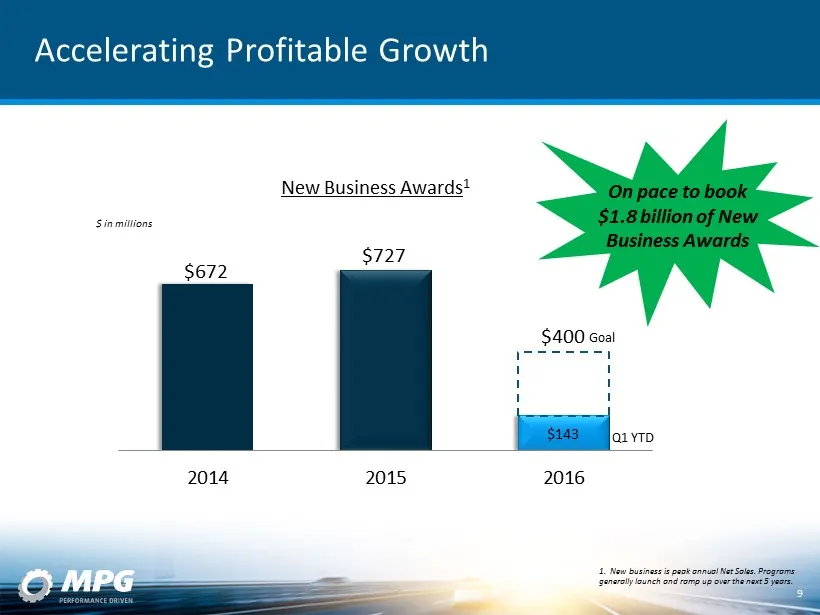
Slide 9: Accelerating Profitable Growth
Accelerating Profitable Growth 9 $672 $727 $143 $400 2014 2015 2016 Q1 YTD 1. New business is peak annual Net Sales. Programs generally launch and ramp up over the next 5 years. New Business Awards 1 $ in millions Goal On pace to book $1.8 billion of New Business Awards
Slide 10: Financials and 2016 Outlook
FINANCIALS AND 2016 OUTLOOK
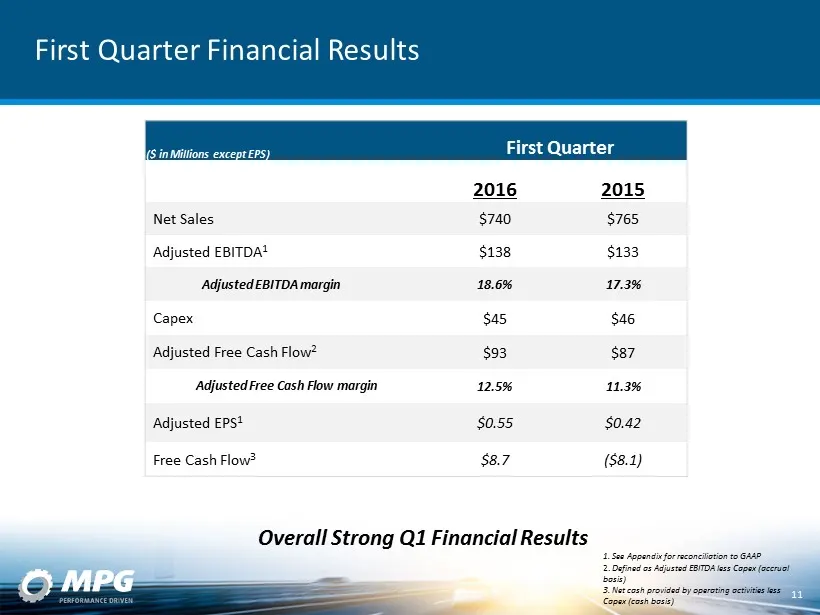
Slide 11: First Quarter Financial Results
First Quarter Financial Results ($ in Millions except EPS) First Quarter 2016 2015 Net Sales $740 $765 Adjusted EBITDA 1 $138 $133 Adjusted EBITDA margin 18.6% 17.3% Capex $45 $46 Adjusted Free Cash Flow 2 $93 $87 Adjusted Free Cash Flow margin 12.5% 11.3% Adjusted EPS 1 $0.55 $0.42 Free Cash Flow 3
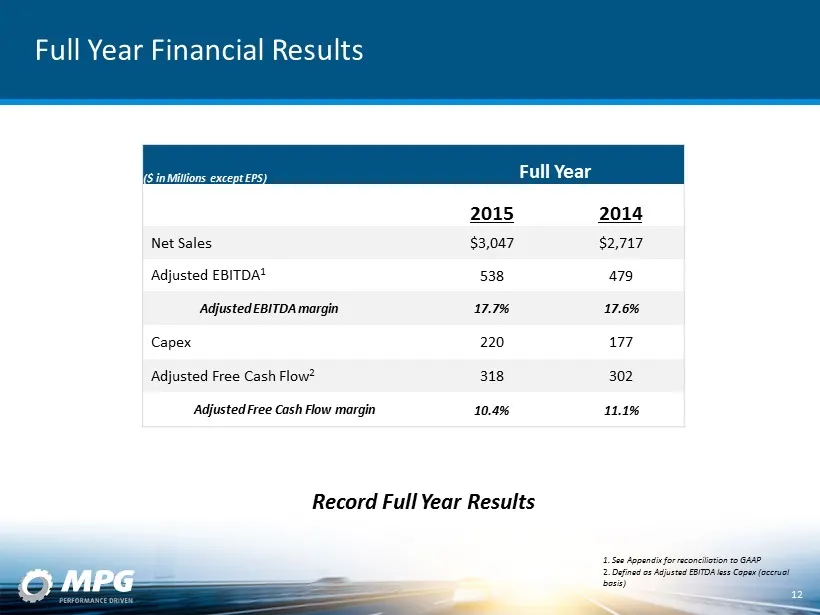
Slide 12: Full Year Financial Results
Full Year Financial Results ($ in Millions except EPS) Full Year 2015 2014 Net Sales $3,047 $2,717 Adjusted EBITDA 1 538 479 Adjusted EBITDA margin 17.7% 17.6% Capex 220 177 Adjusted Free Cash Flow 2 318 302 Adjusted Free Cash Flow margin 10.4% 11.1% 1. See Appendix for reconciliation to GAAP 2. Def
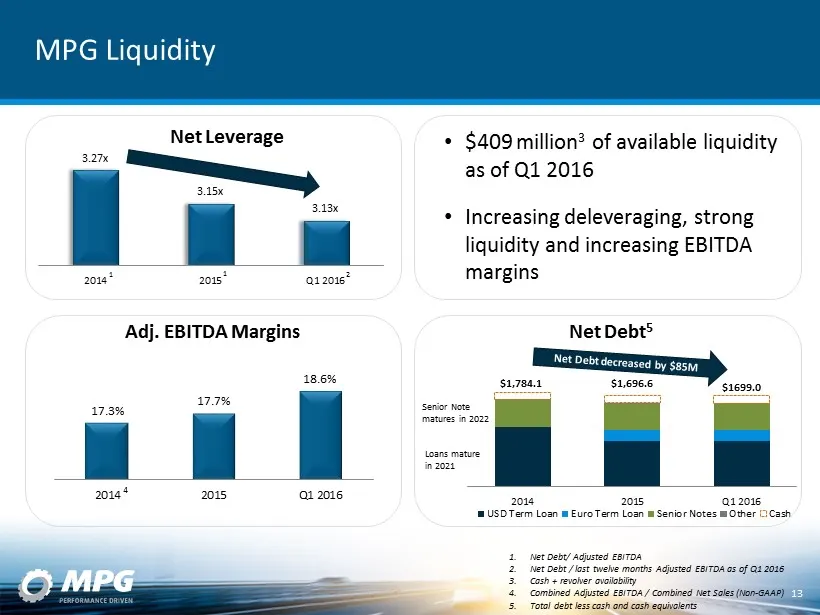
Slide 13: MPG Liquidity and Net Leverage
2014 2015 Q1 2016 USD Term Loan Euro Term Loan Senior Notes Other Cash MPG Liquidity 13 3.27x 3.15x 3.13x 2014 2015 Q1 2016 Net Leverage • $409 million 3 of available liquidity as of Q1 2016 • Increasing deleveraging, strong liquidity and increasing EBITDA margins 17.3% 17.7% 18.6% 2014 2015 Q1 2016
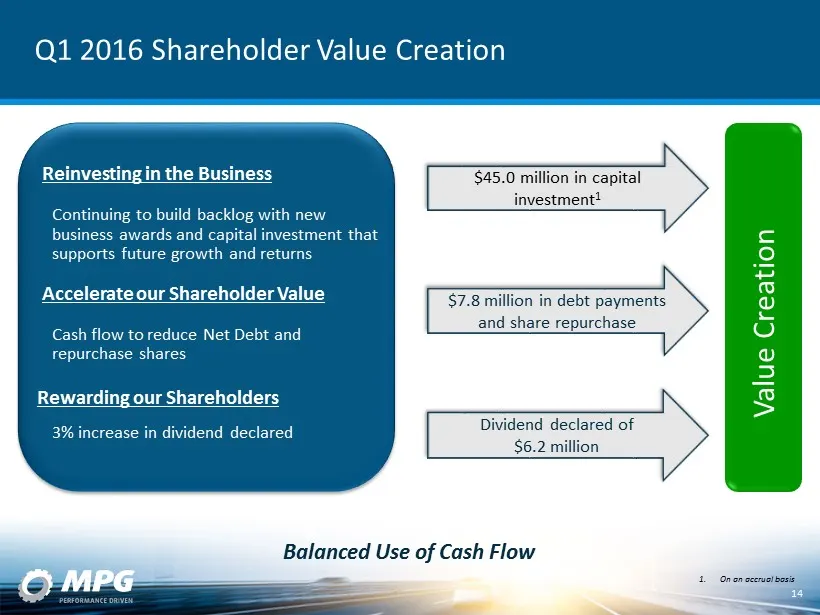
Slide 14: Reinvesting in the Business
Reinvesting in the Business Continuing to build backlog with new business awards and capital investment that supports future growth and returns Accelerate our Shareholder Value Cash flow to reduce Net D ebt and repurchase shares Rewarding our Shareholders 3% increase in dividend declared $7.8 millio
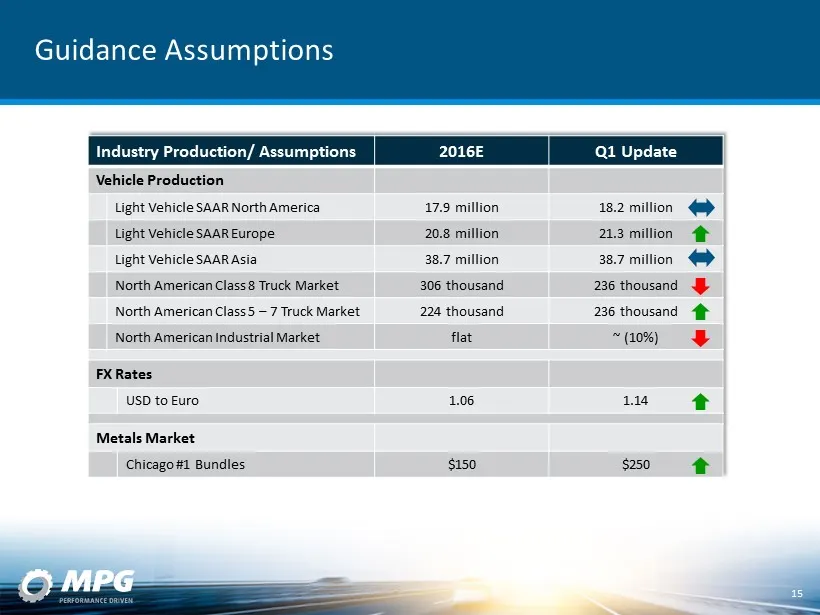
Slide 15: Guidance Assumptions
Guidance Assumptions Industry Production/ Assumptions 2016E Q1 Update Vehicle Production Light Vehicle SAAR North America 17.9 million 18.2 million Light Vehicle SAAR Europe 20.8 million 21.3 million Light Vehicle SAAR Asia 38.7 million 38.7 million North American Class 8 Truck Market 306 thousand 2
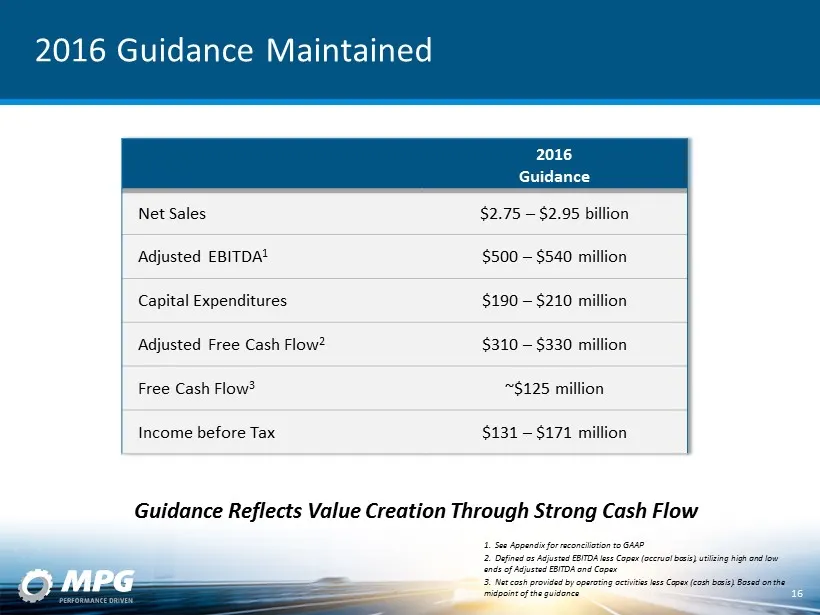
Slide 16: 2016 Guidance Maintained
2016 Guidance Maintained 2016 Guidance Net Sales $2.75 – $2.95 billion Adjusted EBITDA 1 $500 – $540 million Capital Expenditures $190 – $210 million Adjusted Free Cash Flow 2 $310 – $330 million Free Cash Flow 3 ~$125 million Income before Tax $131 – $171 million 1. See Appendix for reconciliation
Slide 17: Why Invest in MPG
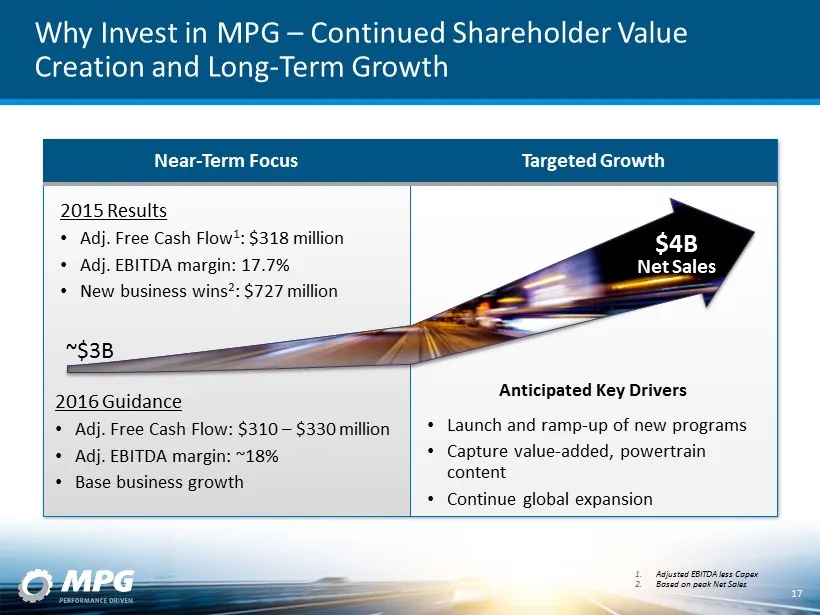
Why Invest in MPG – Continued Shareholder Value Creation and Long - Term Growth ~$3B 2016 Guidance • Adj. Free Cash Flow: $310 – $330 million • Adj. EBITDA margin: ~18% • Base business growth 2015 Results • Adj. Free Cash Flow 1 : $318 million • Adj. EBITDA margin: 17.7% • New business wins 2 : $727
Slide 18: Appendix
APPENDIX
Slide 19: Update on Non-Core Wheel Bearings
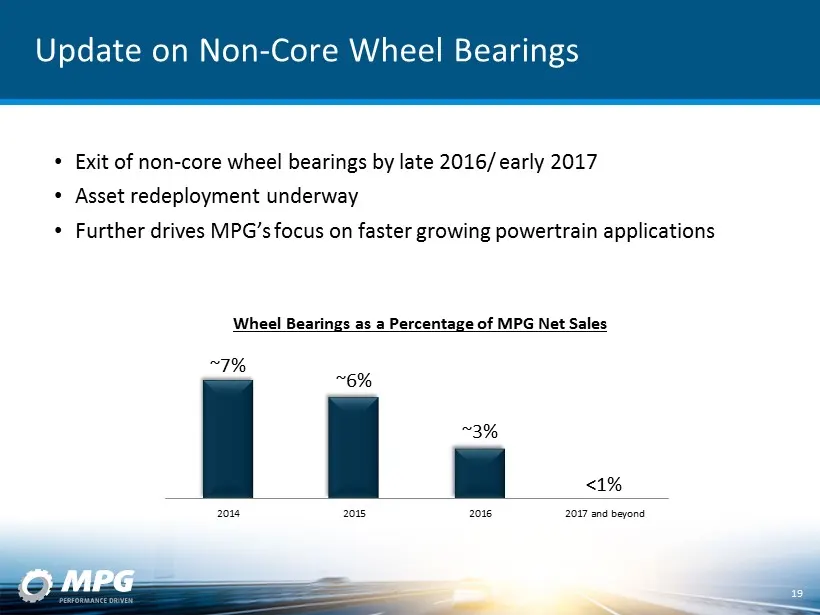
Update on Non - Core Wheel Bearings 19 • Exit of non - core wheel bearings by late 2016/ early 2017 • Asset redeployment underway • Further drives MPG’s focus on faster growing powertrain applications Wheel Bearings as a Percentage of MPG Net Sales ~7% ~6% ~3% <1% 2014 2015 2016 2017 and beyond
Slide 20: Metal Market and Currency Trends
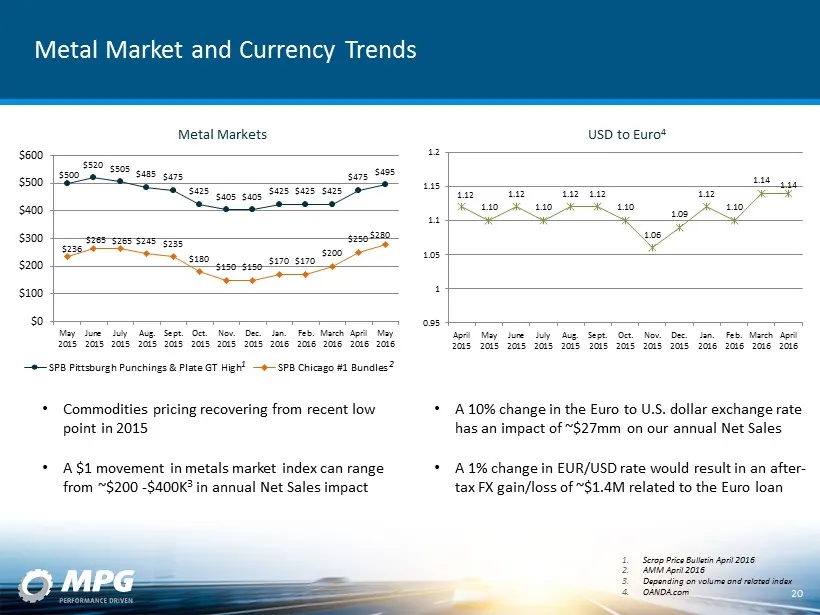
Metal Market and Currency Trends 20 1. Scrap Price Bulletin April 2016 2. AMM April 2016 3. Depending on volume and related index 4. OANDA.com Metal Markets USD to Euro 4 $500 $520 $505 $485 $475 $425 $405 $405 $425 $425 $425 $475 $495 $236 $265 $265 $245 $235 $180 $150 $150 $170 $170 $200 $250 $280
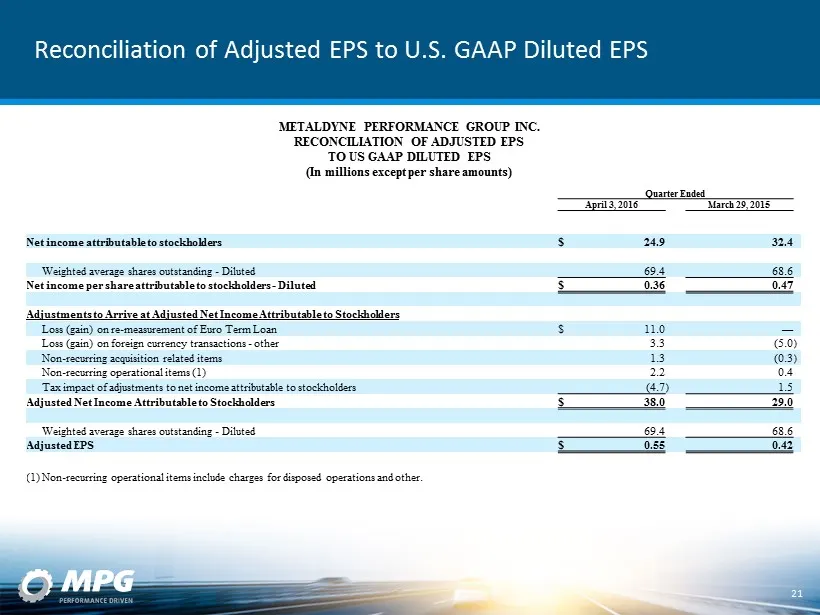
Slide 21: Reconciliation of Adjusted EPS to U.S. GAAP Diluted EPS
Reconciliation of Adjusted EPS to U.S. GAAP Diluted EPS 21 METALDYNE PERFORMANCE GROUP INC. RECONCILIATION OF ADJUSTED EPS TO US GAAP DILUTED EPS (In millions except per share amounts) Quarter Ended April 3, 2016 March 29, 2015 Net income attributable to stockholders $ 24.9 32.4 Weighted average sha
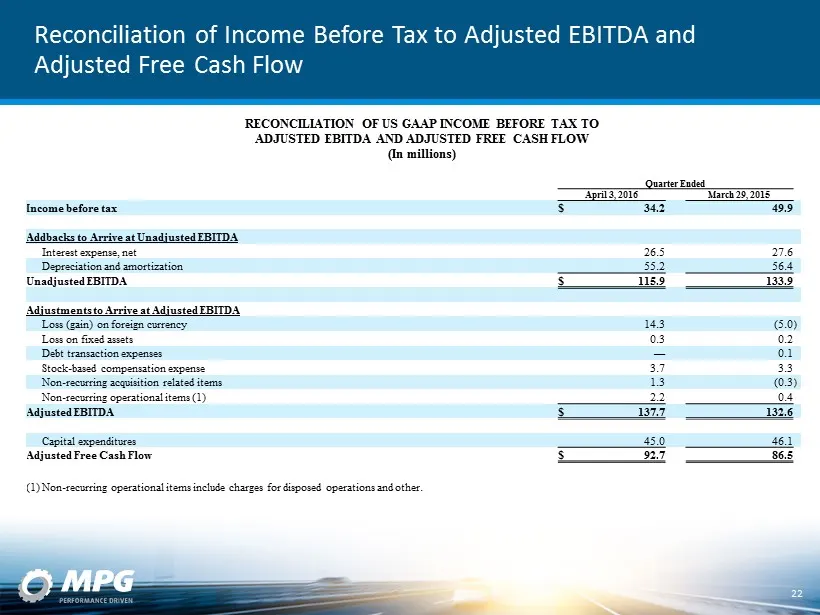
Slide 22: Reconciliation of Income Before Tax to Adjusted EBITDA and Adjusted Free Cash Flow
Reconciliation of Income Before Tax to Adjusted EBITDA and Adjusted Free Cash Flow Quarter Ended April 3, 2016 March 29, 2015 Income before tax $ 34.2 49.9 Addbacks to Arrive at Unadjusted EBITDA Interest expense, net 26.5 27.6 Depreciation and amortization 55.2 56.4 Unadjusted EBITDA $ 115.9 133.9
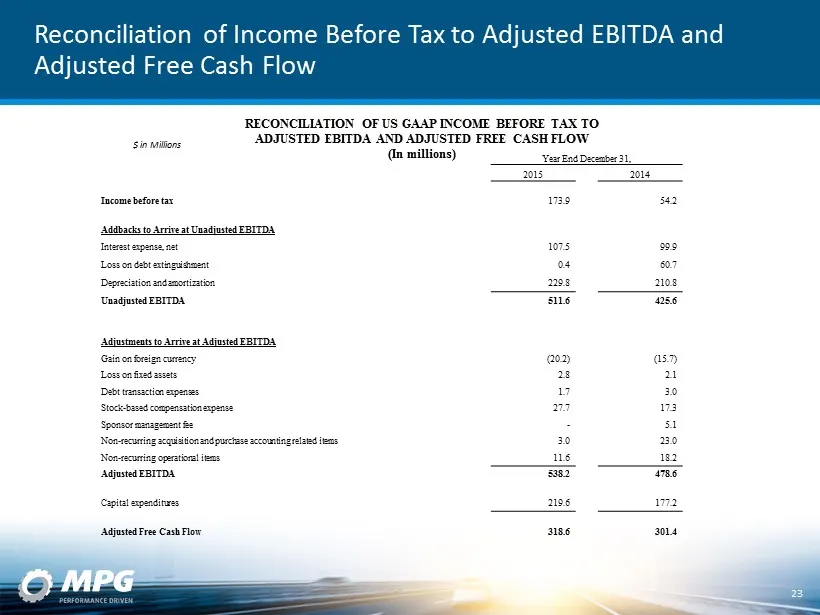
Slide 23: Reconciliation of Income Before Tax to Adjusted EBITDA and Adjusted Free Cash Flow
Reconciliation of Income Before Tax to Adjusted EBITDA and Adjusted Free Cash Flow $ in Millions Year End December 31, 2015 2014 Income before tax 173.9 54.2 Addbacks to Arrive at Unadjusted EBITDA Interest expense, net 107.5 99.9 Loss on debt extinguishment 0.4 60.7 Depreciation and amortization 22
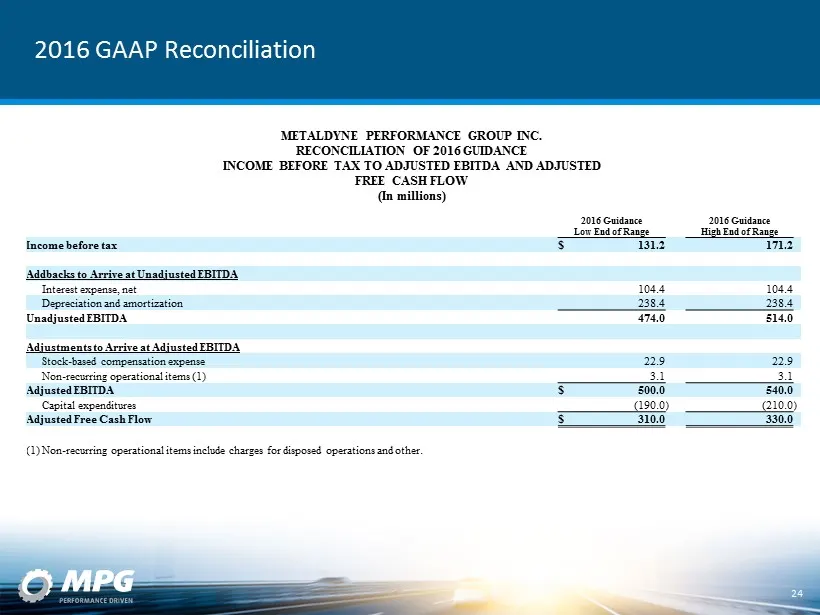
Slide 24: 2016 GAAP Reconciliation
2016 GAAP Reconciliation 2016 Guidance 2016 Guidance Low End of Range High End of Range Income before tax $ 131.2 171.2 Addbacks to Arrive at Unadjusted EBITDA Interest expense, net 104.4 104.4 Depreciation and amortization 238.4 238.4 Unadjusted EBITDA 474.0 514.0 Adjustments to Arrive at Adjusted
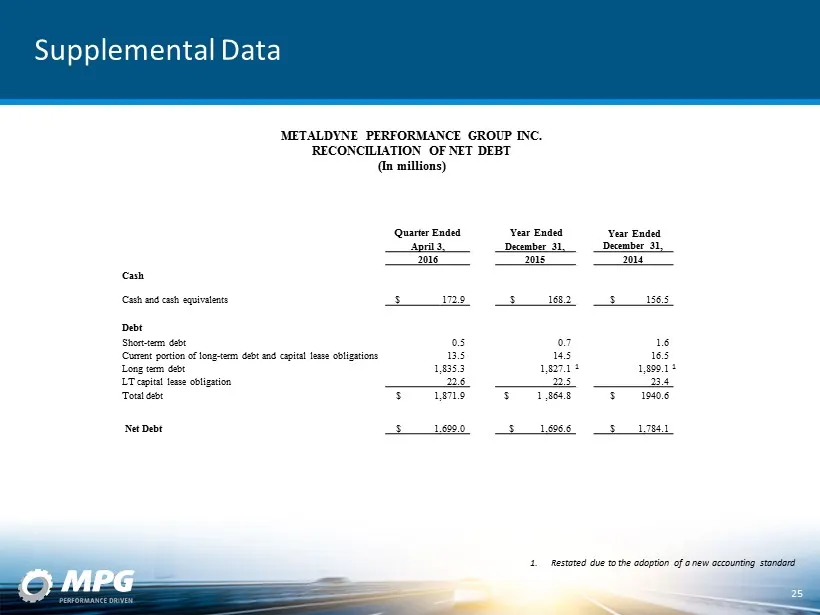
Slide 25: Supplemental Data: Reconciliation of Net Debt
Supplemental Data Quarter Ended April 3, Year Ended December 31, Year Ended December 31, 2016 2015 2014 Cash Cash and cash equivalents $ , 172.9 $ 168.2 $ 156.5 Debt Short - term debt 0.5 0.7 1.6 Current portion of long - term debt and capital lease obligations 13.5 14.5 16.5 Long term debt 1,835.3
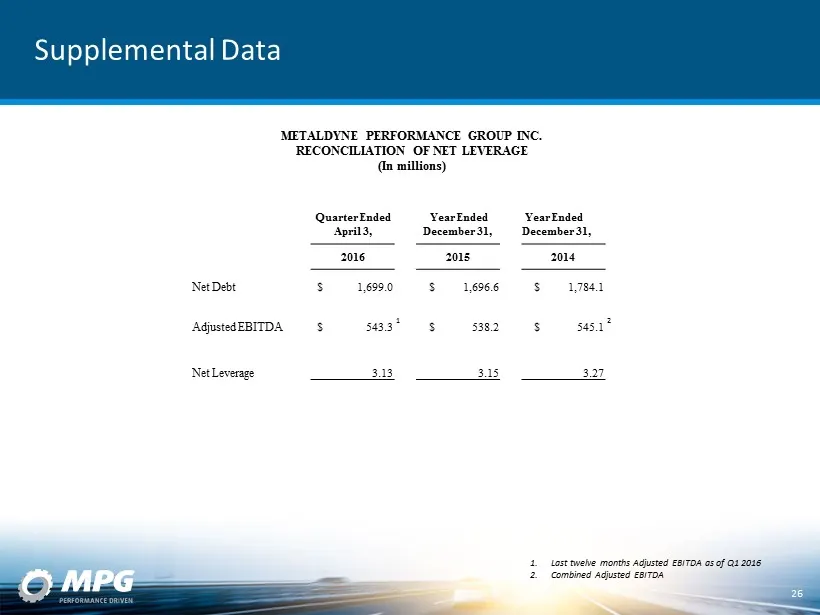
Slide 26: Supplemental Data: Reconciliation of Net Leverage
Supplemental Data Quarter Ended April 3, Year Ended December 31, Year Ended December 31, 2016 2015 2014 Net Debt $ 1,699.0 $ 1,696.6 $ 1,784.1 Adjusted EBITDA $ , 543.3 $ , 538.2 $ , 545.1 Net Leverage 3.13 3.15 3.27 26 METALDYNE PERFORMANCE GROUP INC. RECONCILIATION OF NET LEVERAGE (In millions) 1.
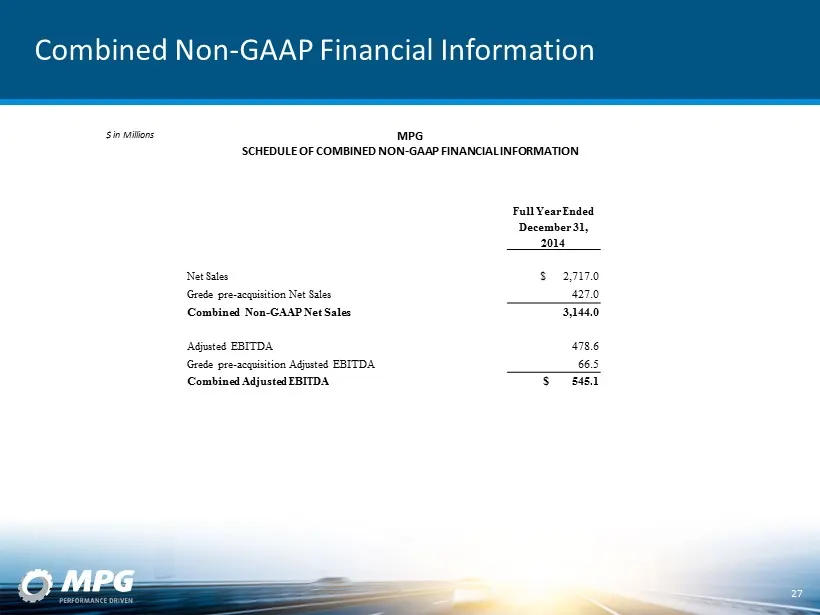
Slide 27: Combined Non-GAAP Financial Information
Combined Non - GAAP Financial Information MPG SCHEDULE OF COMBINED NON - GAAP FINANCIAL INFORMATION 27 Full Year Ended December 31, 2014 Net Sales $ 2,717.0 Grede pre - acquisition Net Sales 427.0 Combined Non - GAAP Net Sales 3,144.0 Adjusted EBITDA 478.6 Grede pre - acquisition Adjusted EBITDA 66.
Source: SEC EDGAR · 8-K filed May 17, 2016
More decks from Metaldyne Performance Group Inc
 Debt Investor Presentation (February 2017)55 slides · Feb 23, 2017
 Merger or Acquisition (January 2017)37 slides · Jan 11, 2017
 2016 Bank of America Merrill Lynch Leveraged Finance Conference38 slides · Nov 30, 2016
 Merger or Acquisition (November 2016)26 slides · Nov 17, 2016
 Merger or Acquisition (November 2016)25 slides · Nov 3, 2016
 Deutsche Bank Leveraged Finance Conference 201630 slides · Sep 27, 2016