Santander Holdings USA Inc · NYSE:SNUS/PH
Santander Holdings USA — Debt Investor Presentation (May 2025)
31 slides from Santander Holdings USA's debt investor presentation, May 2, 2025
Slide 1: First Quarter 2025 Fixed Income Investor Presentation
1 May 2, 2025 SANTANDER HOLDINGS USA, INC. First Quarter 2025 Fixed Income Investor Presentation
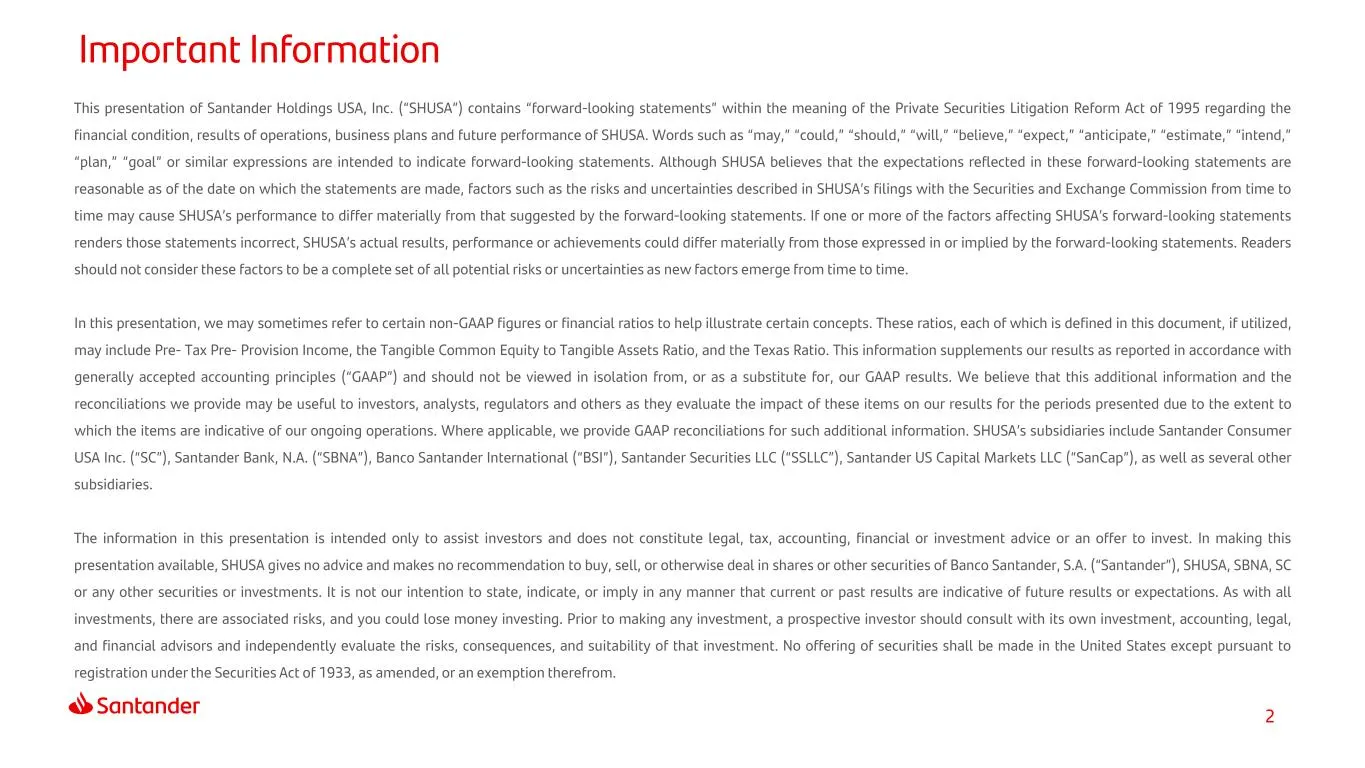
Slide 2: Forward-looking statements and non-GAAP disclaimer
2 This presentation of Santander Holdings USA, Inc. (“SHUSA”) contains “forward-looking statements” within the meaning of the Private Securities Litigation Reform Act of 1995 regarding the financial condition, results of operations, business plans and future performance of SHUSA. Words such as “may,
Slide 3: Index
3 1 At a glance 2 Results Appendix 4 Index 3 Core Business Activities
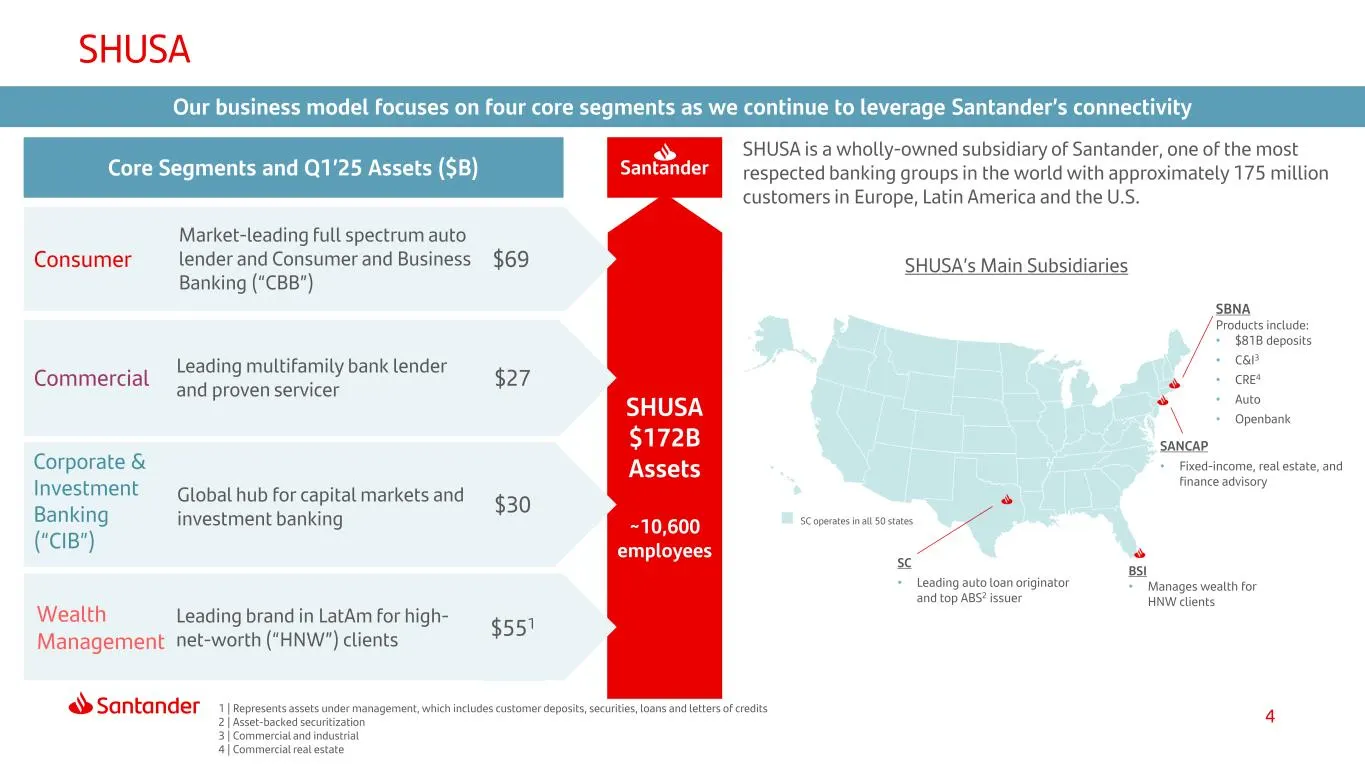
Slide 4: Santander SHUSA at a glance
4 Santander SHUSA $172B Assets ~10,600 employees Consumer Commercial Market-leading full spectrum auto lender and Consumer and Business Banking (“CBB”) Leading multifamily bank lender and proven servicer Global hub for capital markets and investment banking Leading brand in LatAm for high- net-worth
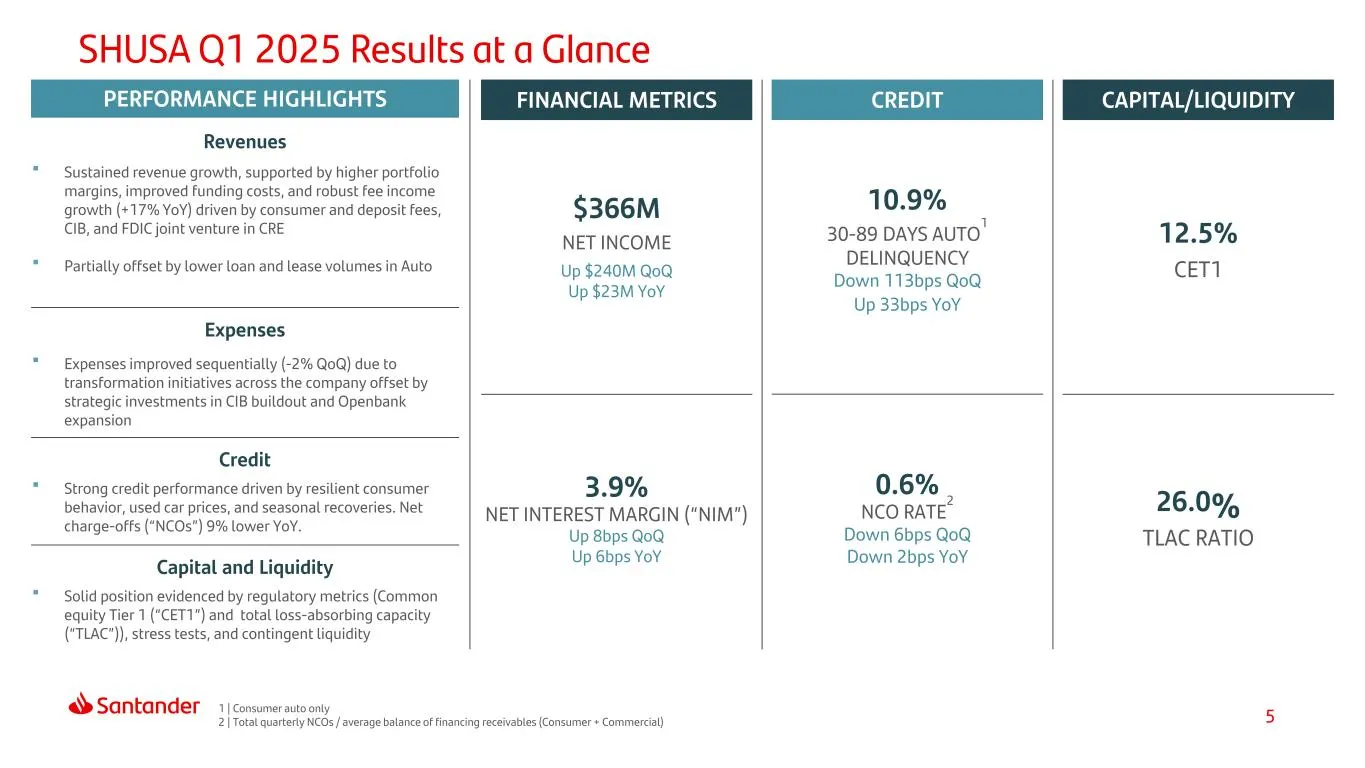
Slide 5: SHUSA Q1 2025 Results at a Glance
5 SHUSA Q1 2025 Results at a Glance FINANCIAL METRICS CREDIT CAPITAL/LIQUIDITY $366M NET INCOME Up $240M QoQ Up $23M YoY 10.9% 30-89 DAYS AUTO1 DELINQUENCY Down 113bps QoQ Up 33bps YoY 12.5% CET1 3.9% NET INTEREST MARGIN (“NIM”) Up 8bps QoQ Up 6bps YoY 0.6% NCO RATE2 Down 6bps QoQ Down 2bps YoY 26.0
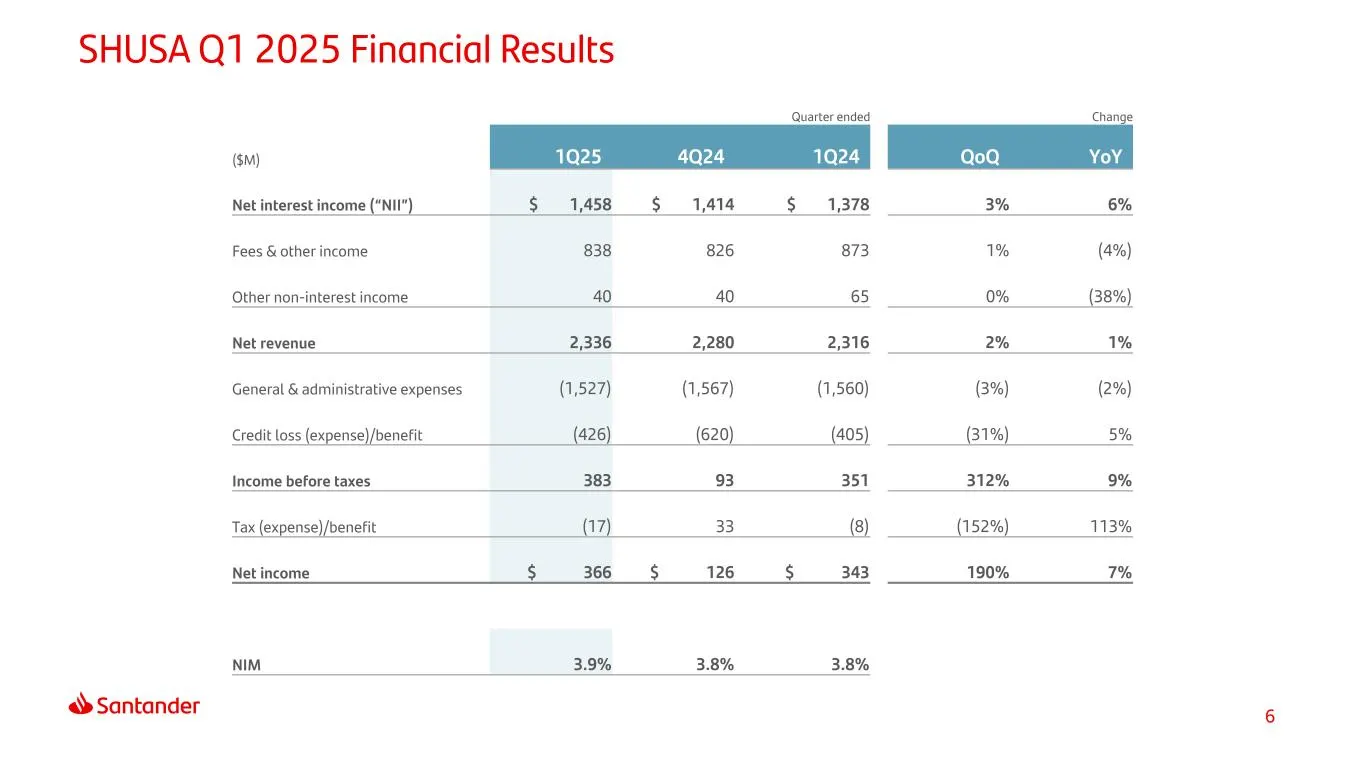
Slide 6: SHUSA Q1 2025 Financial Results
6 SHUSA Q1 2025 Financial Results Quarter ended Change ($M) 1Q25 4Q24 1Q24 QoQ YoY Net interest income (“NII”) $ 1,458 $ 1,414 $ 1,378 3% 6% Fees & other income 838 826 873 1% (4%) Other non-interest income 40 40 65 0% (38%) Net revenue 2,336 2,280 2,316 2% 1% General & administrative expenses (1,52
Slide 7: Index
7 1 At a Glance 2 Results Appendix 4 Index 3 Core Business Activities
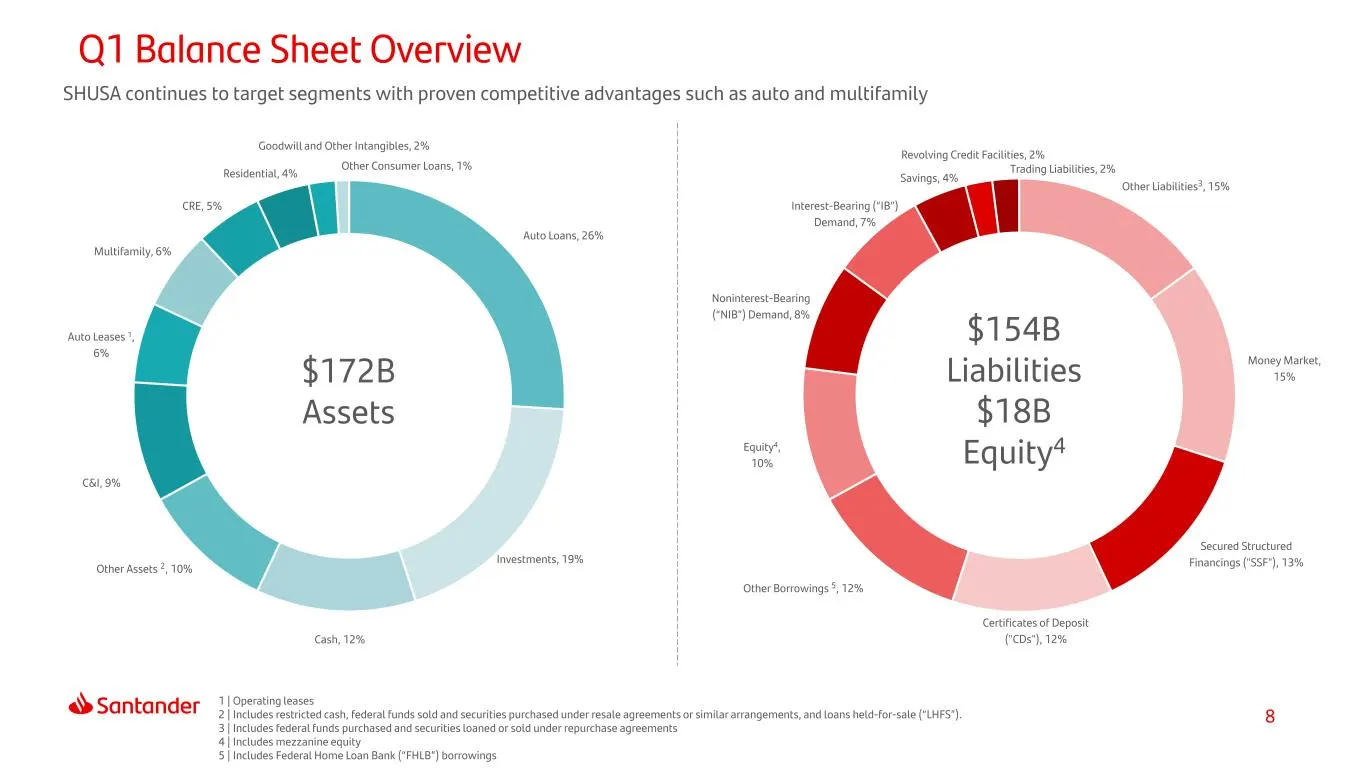
Slide 8: Q1 Balance Sheet Overview
8 Other Liabilities3, 15% Money Market, 15% Secured Structured Financings ("SSF"), 13% Certificates of Deposit ("CDs"), 12% Other Borrowings 5, 12% Equity4, 10% Noninterest-Bearing (“NIB”) Demand, 8% Interest-Bearing (“IB”) Demand, 7% Savings, 4% Revolving Credit Facilities, 2% Trading Liabilities,
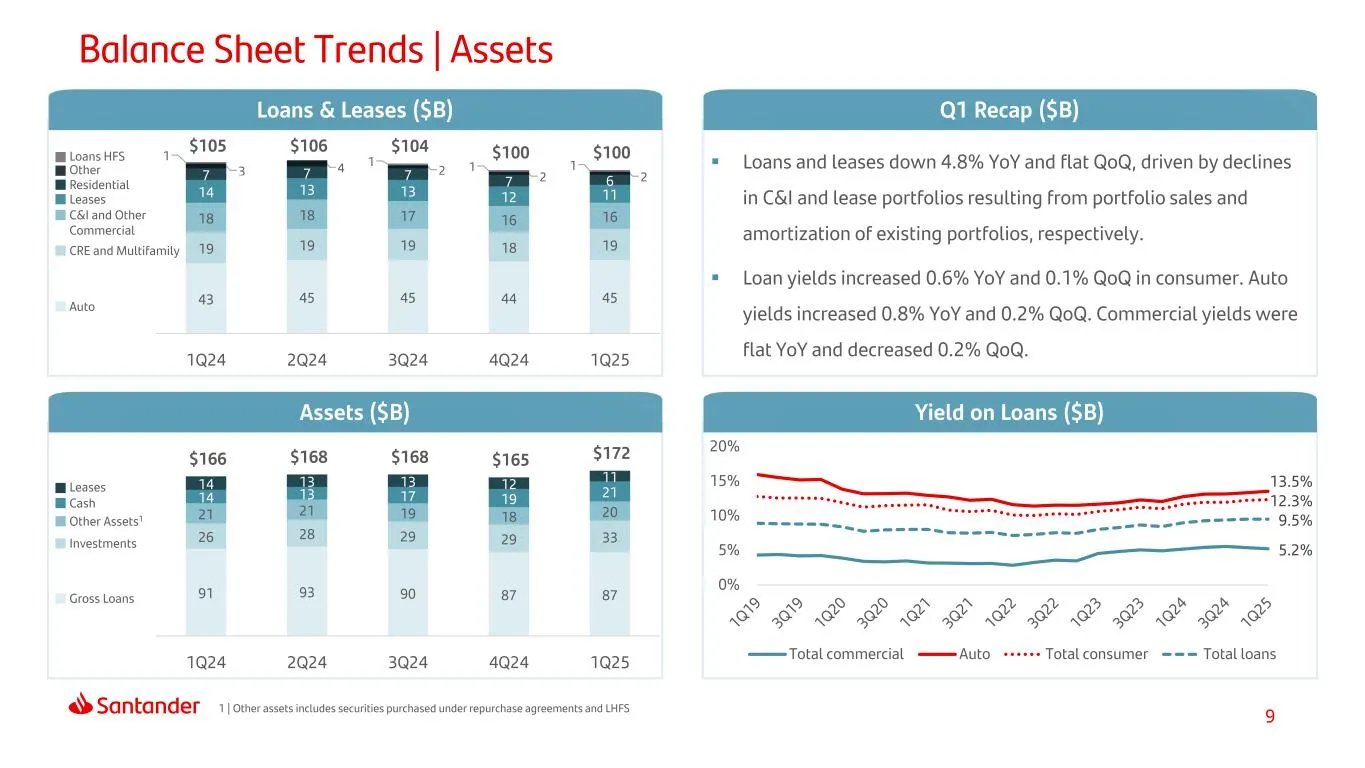
Slide 9: Balance Sheet Trends | Assets
9 43 45 45 44 45 19 19 19 18 19 18 18 17 16 16 14 13 13 12 11 7 7 7 7 6 3 4 2 2 2 1 1 1 1 $105 $106 $104 $100 $100 1Q24 2Q24 3Q24 4Q24 1Q25 Loans HFS Balance Sheet Trends | Assets 1 | Other assets includes securities purchased under repurchase agreements and LHFS Loans and leases down 4.8% YoY and
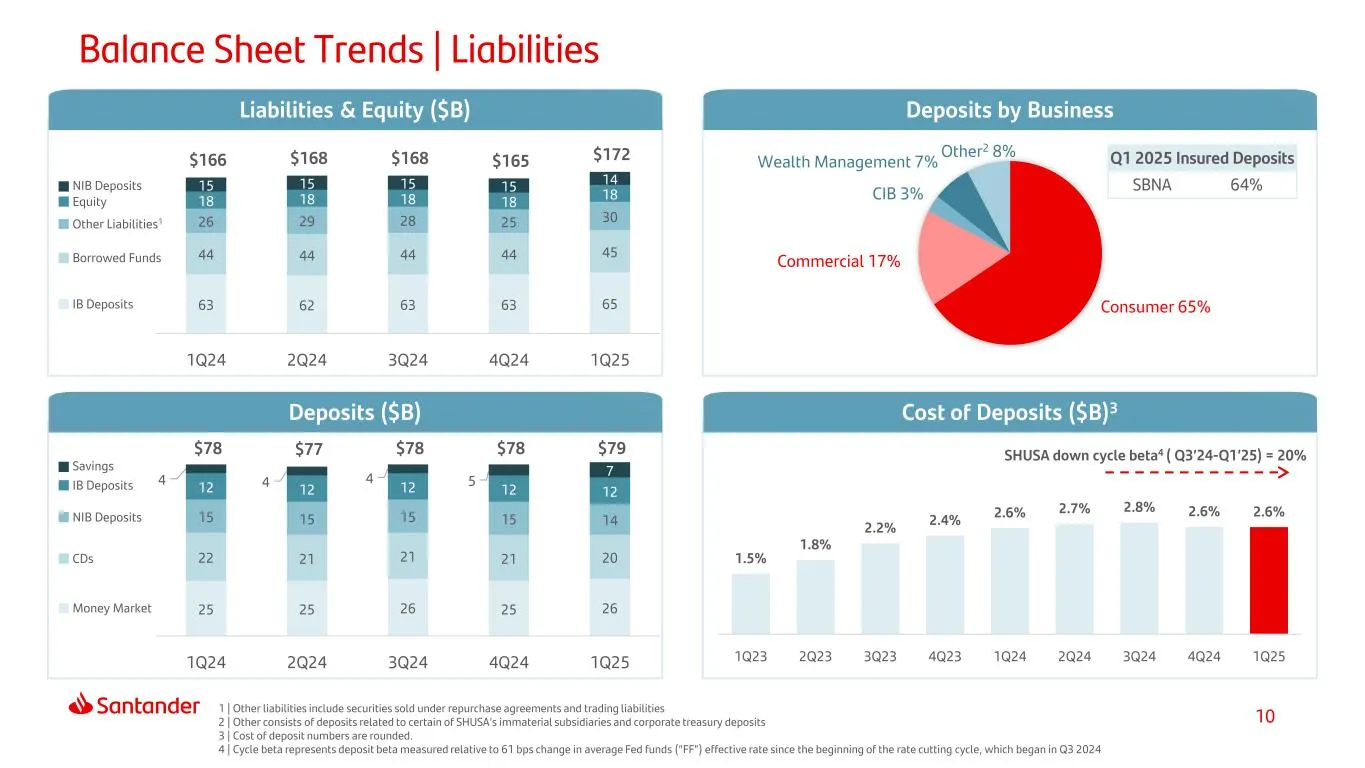
Slide 10: Balance Sheet Trends | Liabilities
10 Consumer 65% Commercial 17% CIB 3% Wealth Management 7% Other2 8% Balance Sheet Trends | Liabilities Deposits ($B) Cost of Deposits ($B)3 Liabilities & Equity ($B) Deposits by Business 1 | Other liabilities include securities sold under repurchase agreements and trading liabilities 2 | Other cons
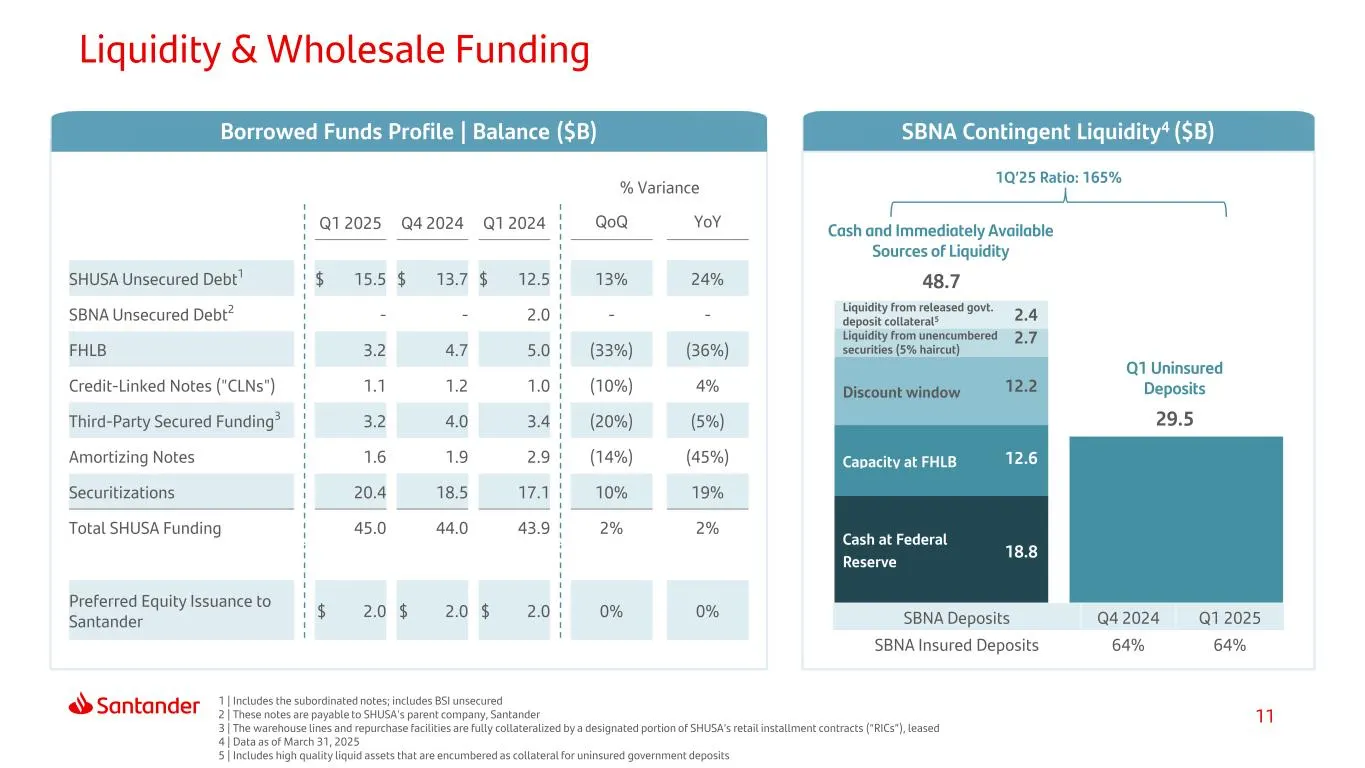
Slide 11: Liquidity & Wholesale Funding
11 Cash at Federal Reserve Capacity at FHLB Discount window Liquidity from unencumbered securities (5% haircut) Liquidity from released govt. deposit collateral5 48.7 29.5 Liquidity & Wholesale Funding Cash and Immediately Available Sources of Liquidity Q1 Uninsured Deposits SBNA Deposits Q4 2024 Q1
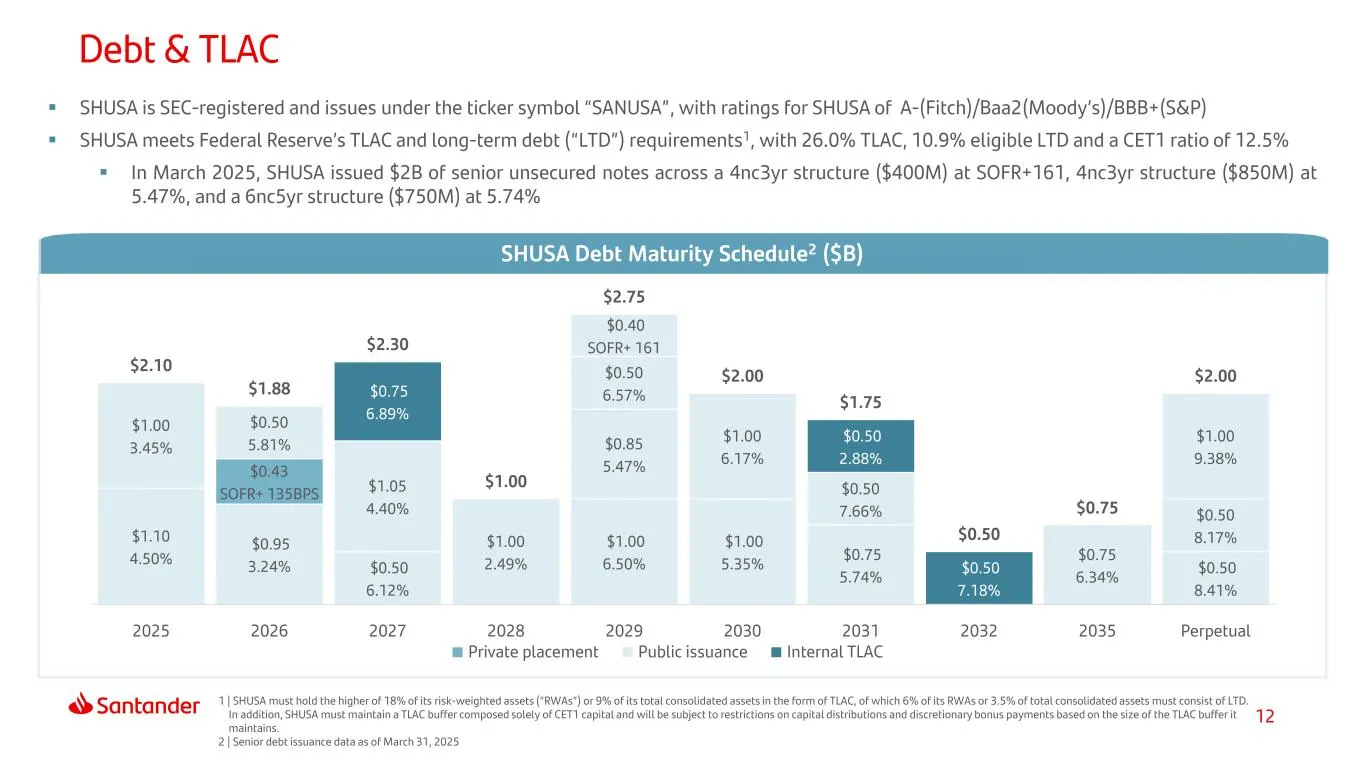
Slide 12: Debt & TLAC
12 Debt & TLAC 1 | SHUSA must hold the higher of 18% of its risk-weighted assets (“RWAs”) or 9% of its total consolidated assets in the form of TLAC, of which 6% of its RWAs or 3.5% of total consolidated assets must consist of LTD. In addition, SHUSA must maintain a TLAC buffer composed solely of CE
Slide 13: Capital Ratios
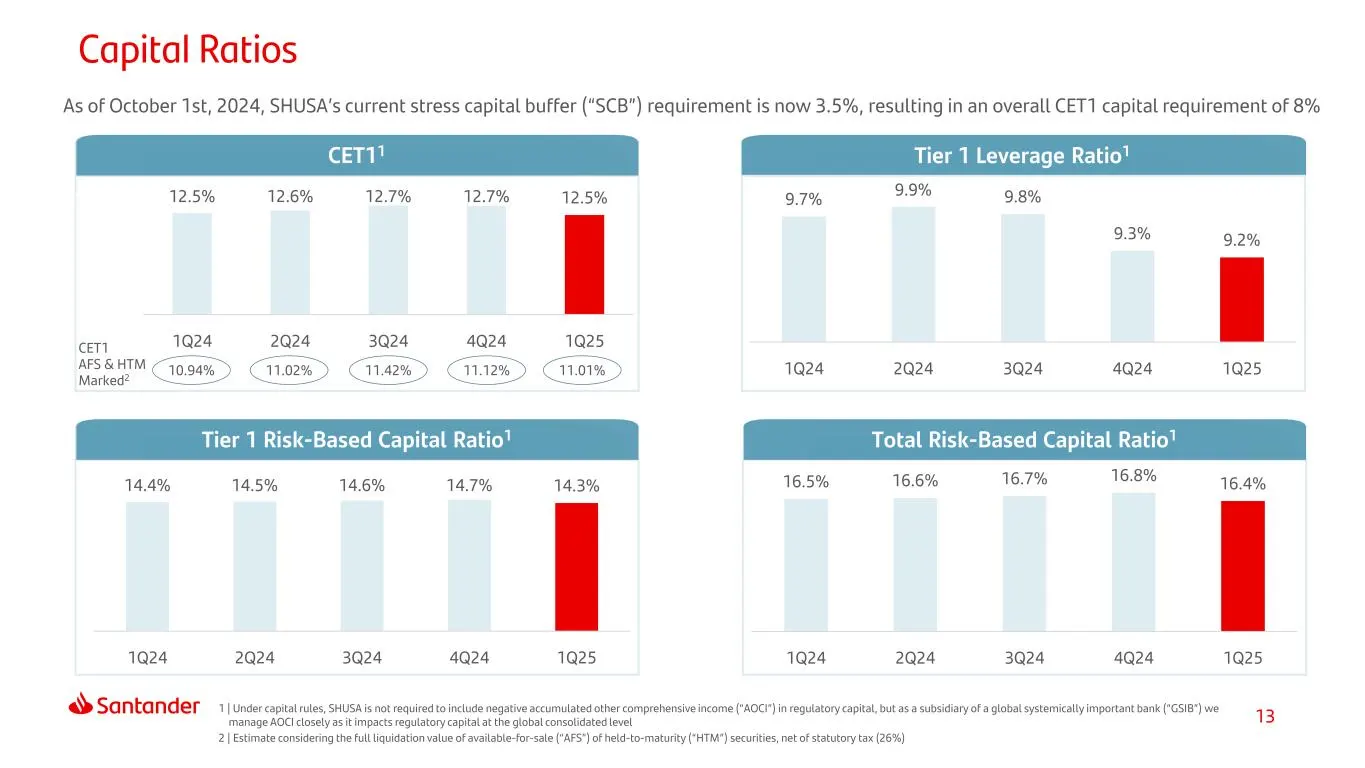
13 As of October 1st, 2024, SHUSA’s current stress capital buffer (“SCB”) requirement is now 3.5%, resulting in an overall CET1 capital requirement of 8% Capital Ratios Tier 1 Risk-Based Capital Ratio1 CET11 Tier 1 Leverage Ratio1 Total Risk-Based Capital Ratio1 1 | Under capital rules, SHUSA is not
Slide 14: Quarterly Profitability
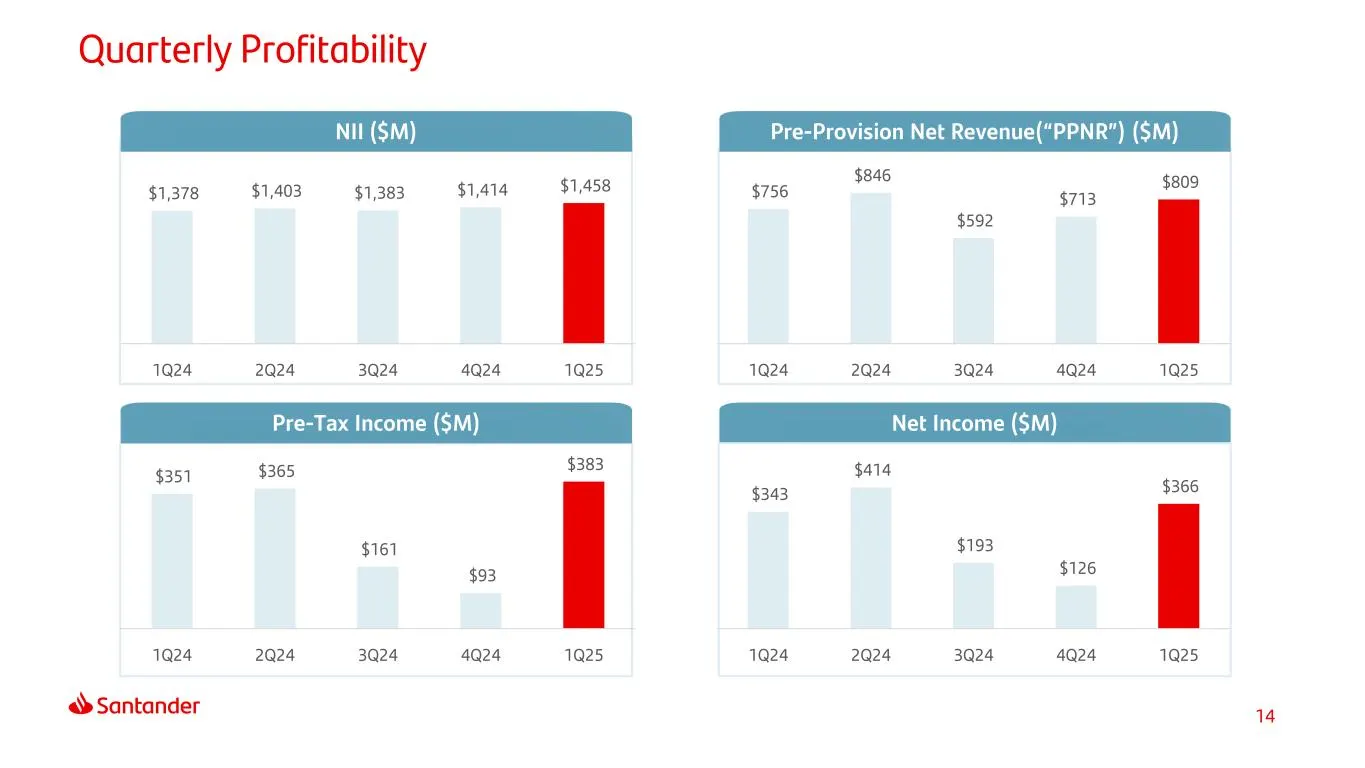
14 Quarterly Profitability NII ($M) Pre-Tax Income ($M) Net Income ($M) Pre-Provision Net Revenue(“PPNR”) ($M) $1,378 $1,403 $1,383 $1,414 $1,458 1Q24 2Q24 3Q24 4Q24 1Q25 $756 $846 $592 $713 $809 1Q24 2Q24 3Q24 4Q24 1Q25 $351 $365 $161 $93 $383 1Q24 2Q24 3Q24 4Q24 1Q25 $343 $414 $193 $126 $366 1Q24
Slide 15: Net Interest Income & Net Interest Margin
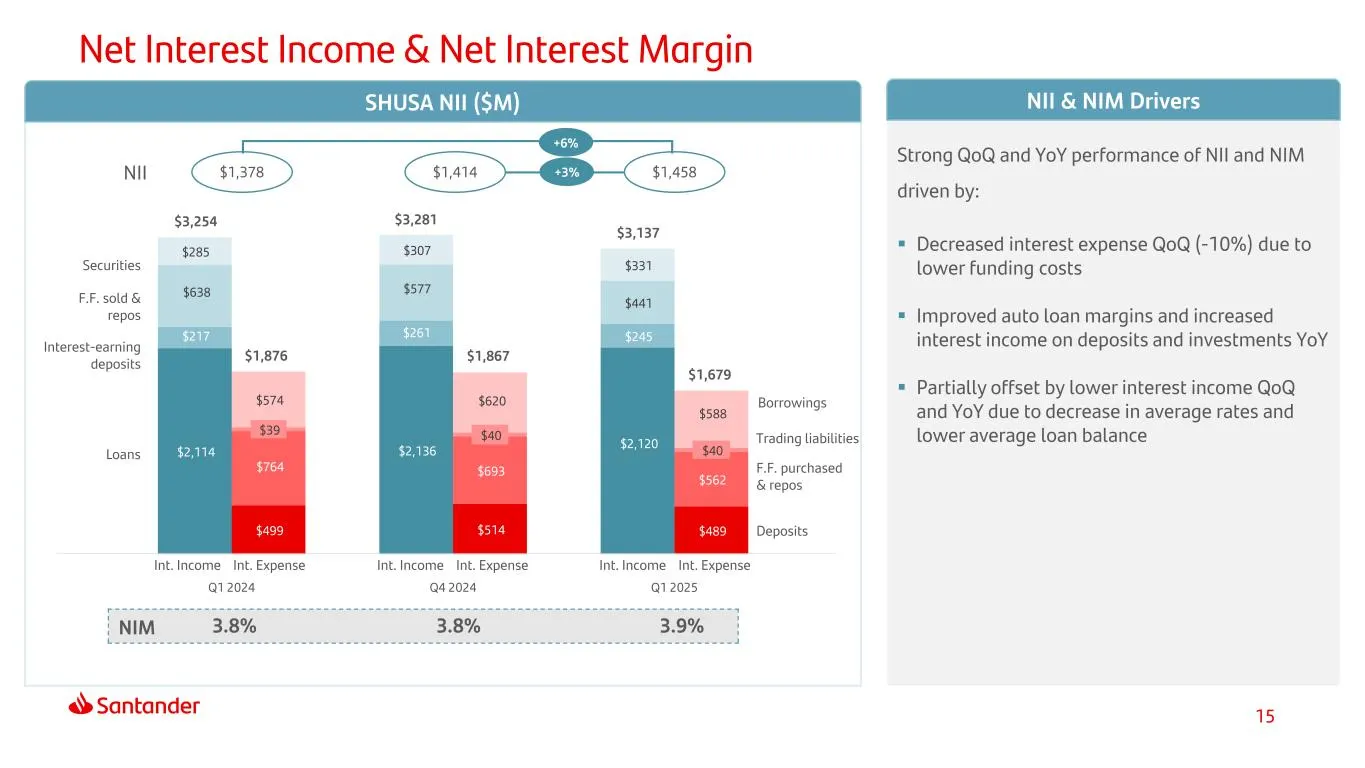
15 $2,114 $2,136 $2,120 $217 $261 $245 $638 $577 $441 $285 $307 $331 $499 $514 $489 $764 $693 $562 $39 $40 $40 $574 $620 $588 Q1 2024 Q4 2024 Q1 2025 $3,137 $3,254 $3,281 $1,876 $1,867 $1,679 NII $1,378 $1,414 $1,458+3% +6% Securities F.F. sold & repos Interest-earning deposits Loans Borrowings Trad
Slide 16: Non-Interest Income
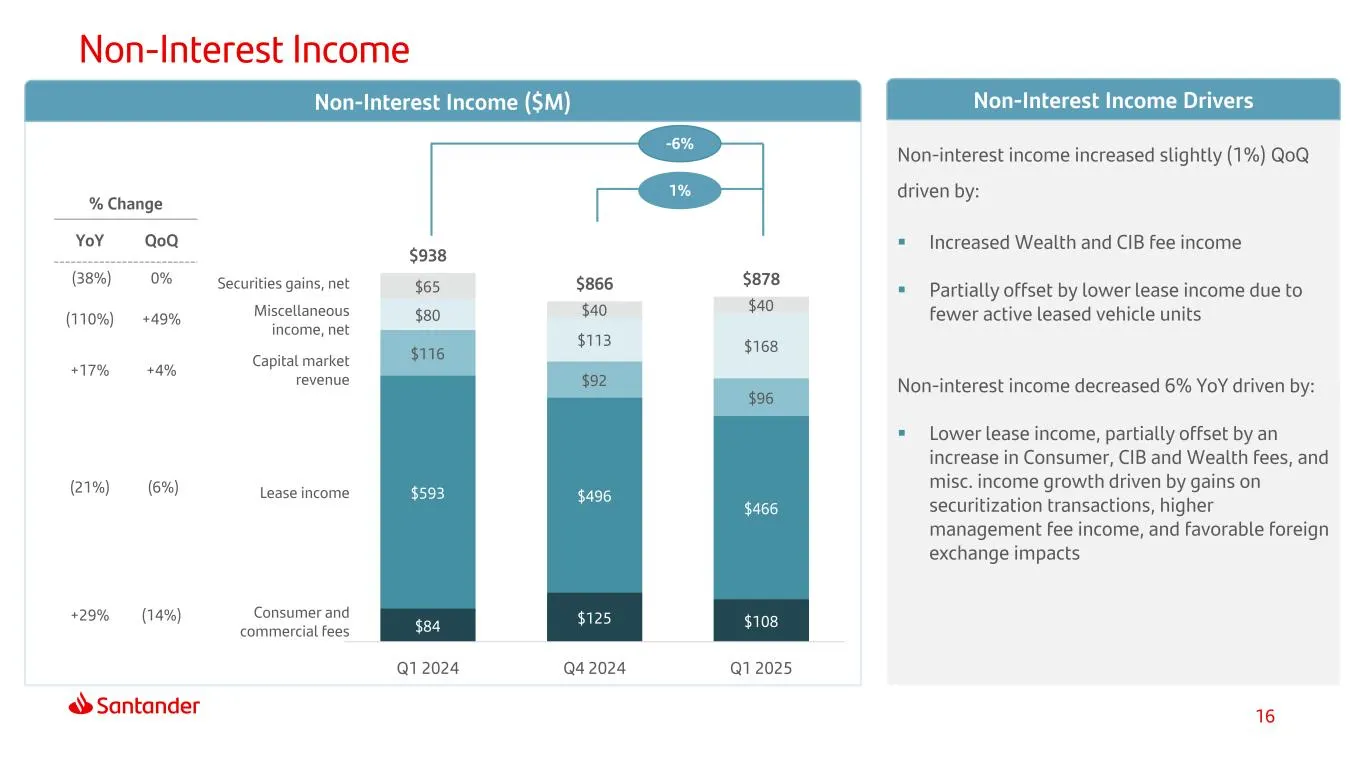
16 Non-Interest Income Non-Interest Income ($M) Non-Interest Income Drivers 1% -6% % Change YoY QoQ (38%) 0% (110%) +49% +17% +4% (21%) (6%) +29% (14%) $84 $125 $108 $593 $496 $466 $116 $92 $96 $80 $113 $168 $65 $40 $40 $938 $866 $878 Q1 2024 Q4 2024 Q1 2025 Securities gains, net Miscellaneous incom
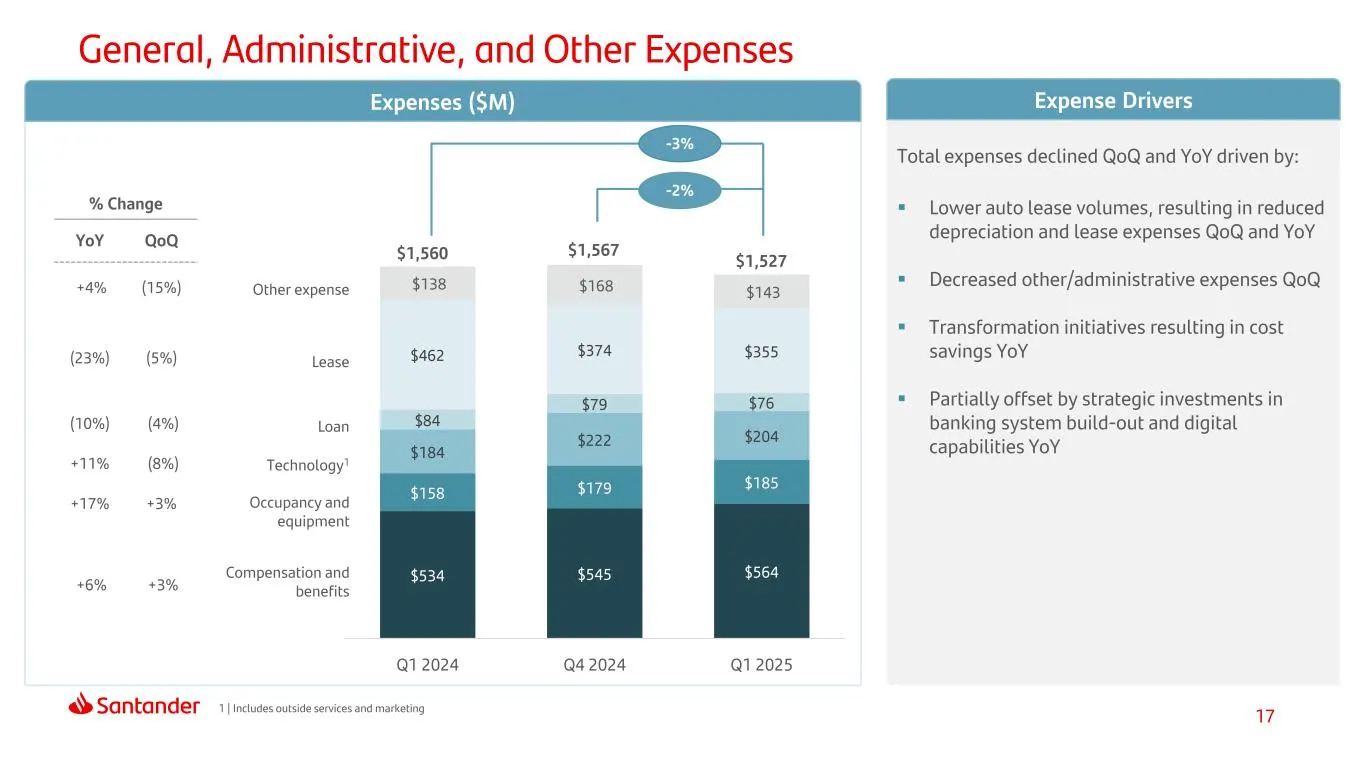
Slide 17: General, Administrative, and Other Expenses
17 $534 $545 $564 $158 $179 $185 $184 $222 $204 $84 $79 $76 $462 $374 $355 $138 $168 $143 Q1 2024 Q4 2024 Q1 2025 General, Administrative, and Other Expenses Expenses ($M) Expense Drivers % Change YoY QoQ +4% (15%) (23%) (5%) (10%) (4%) +11% (8%) +17% +3% +6% +3% $1,560 $1,567 $1,527 Other expense L
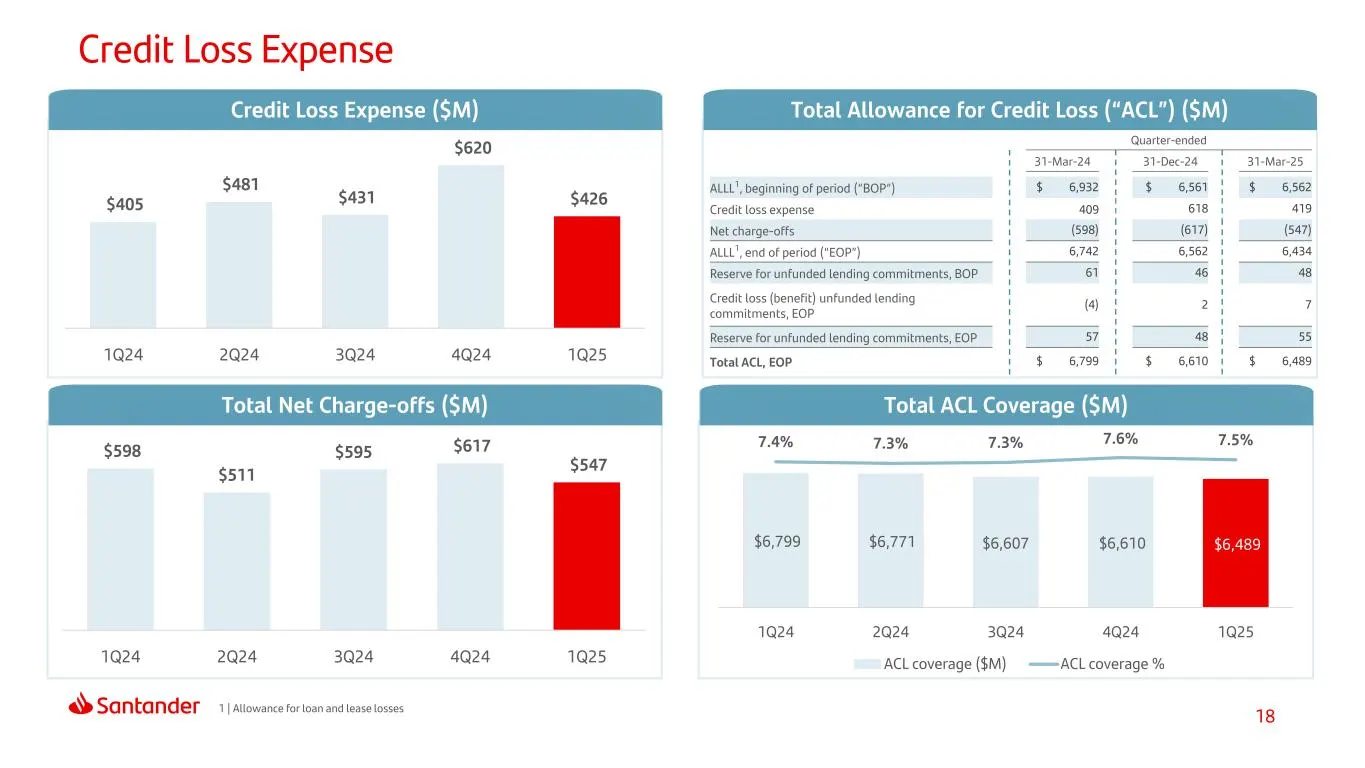
Slide 18: Credit Loss Expense
18 Credit Loss Expense Credit Loss Expense ($M) Total Allowance for Credit Loss (“ACL”) ($M) Total Net Charge-offs ($M) Total ACL Coverage ($M) 1 | Allowance for loan and lease losses Quarter-ended 31-Mar-24 31-Dec-24 31-Mar-25 ALLL1, beginning of period (“BOP”) $ 6,932 $ 6,561 $ 6,562 Credit loss e
Slide 19: Index
19 1 At a Glance 2 Results Appendix 4 Index 3 Core Business Activities
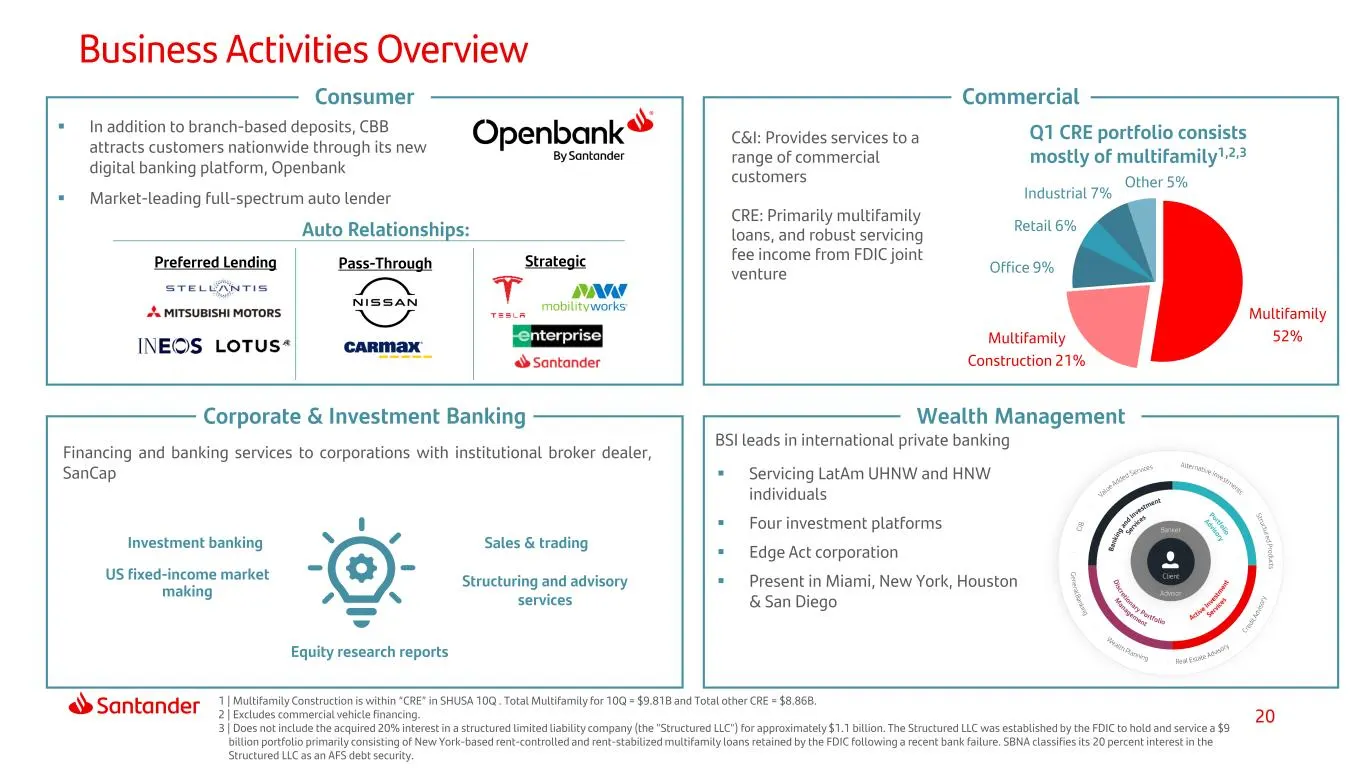
Slide 20: Core Business Activities
20 Consumer Corporate & Investment Banking Commercial Wealth Management In addition to branch-based deposits, CBB attracts customers nationwide through its new digital banking platform, Openbank Market-leading full-spectrum auto lender C&I: Provides services to a range of commercial customers CR
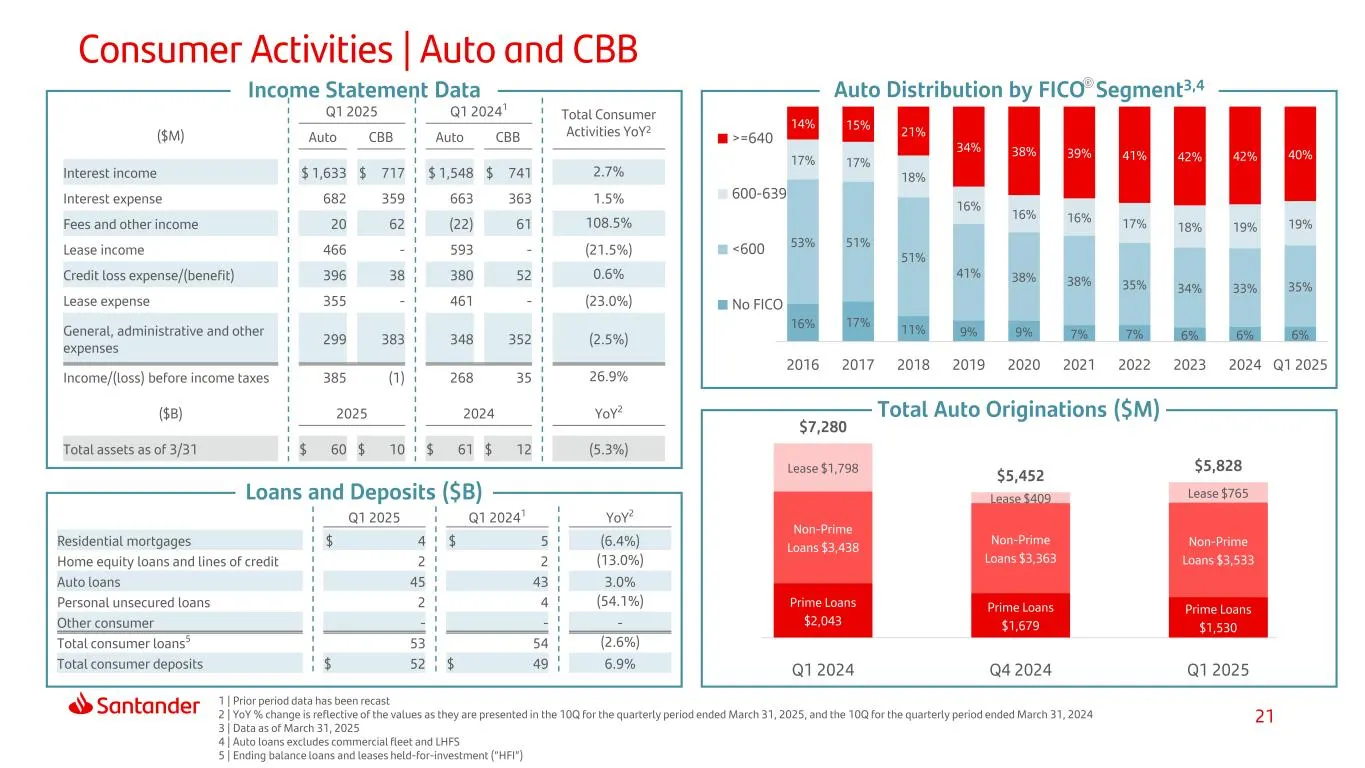
Slide 21: Consumer Activities | Auto and CBB
21 Income Statement Data Loans and Deposits ($B) Consumer Activities | Auto and CBB Auto Distribution by FICO Segment3,4 Total Auto Originations ($M) 1 | Prior period data has been recast 2 | YoY % change is reflective of the values as they are presented in the 10Q for the quarterly period ended Mar
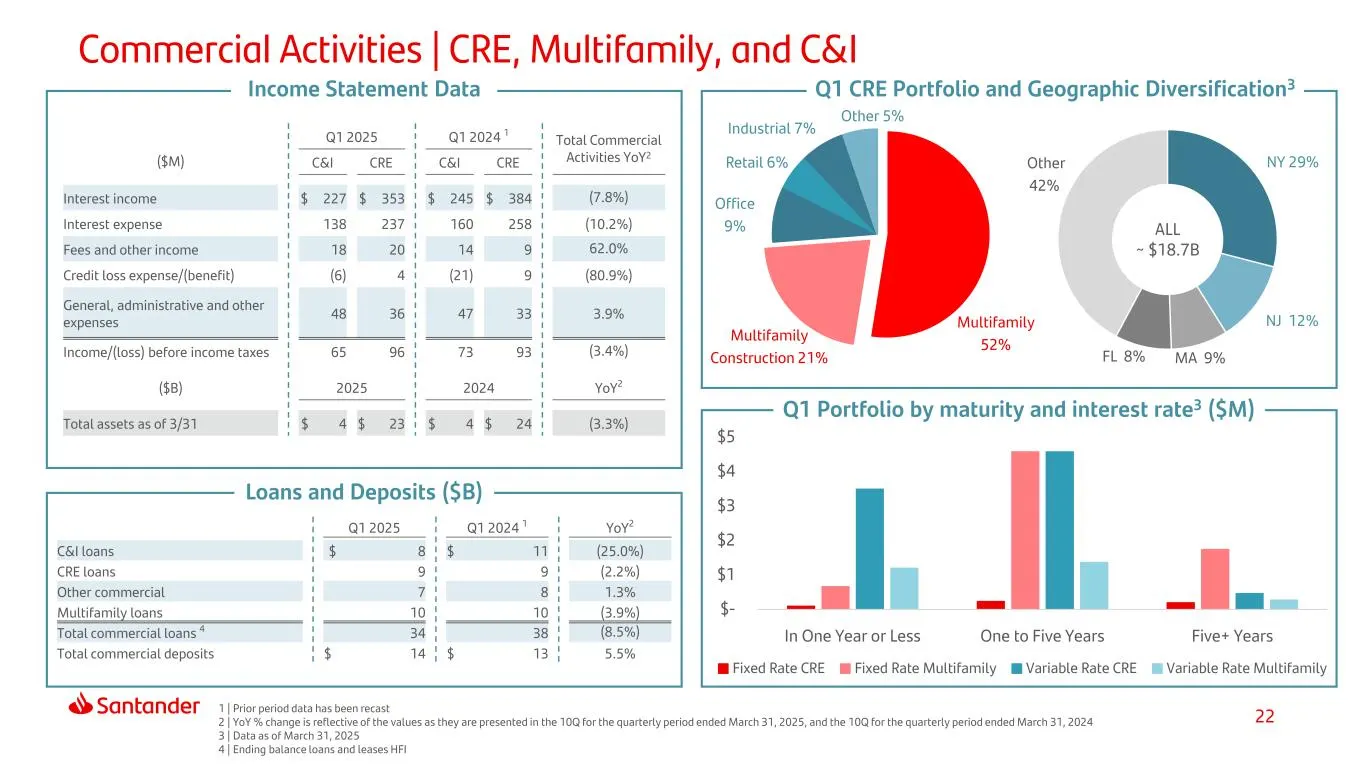
Slide 22: Commercial Activities | CRE, Multifamily, and C&I
22 Income Statement Data Loans and Deposits ($B) Commercial Activities | CRE, Multifamily, and C&I Q1 CRE Portfolio and Geographic Diversification3 Q1 Portfolio by maturity and interest rate3 ($M) 1 | Prior period data has been recast 2 | YoY % change is reflective of the values as they are presente
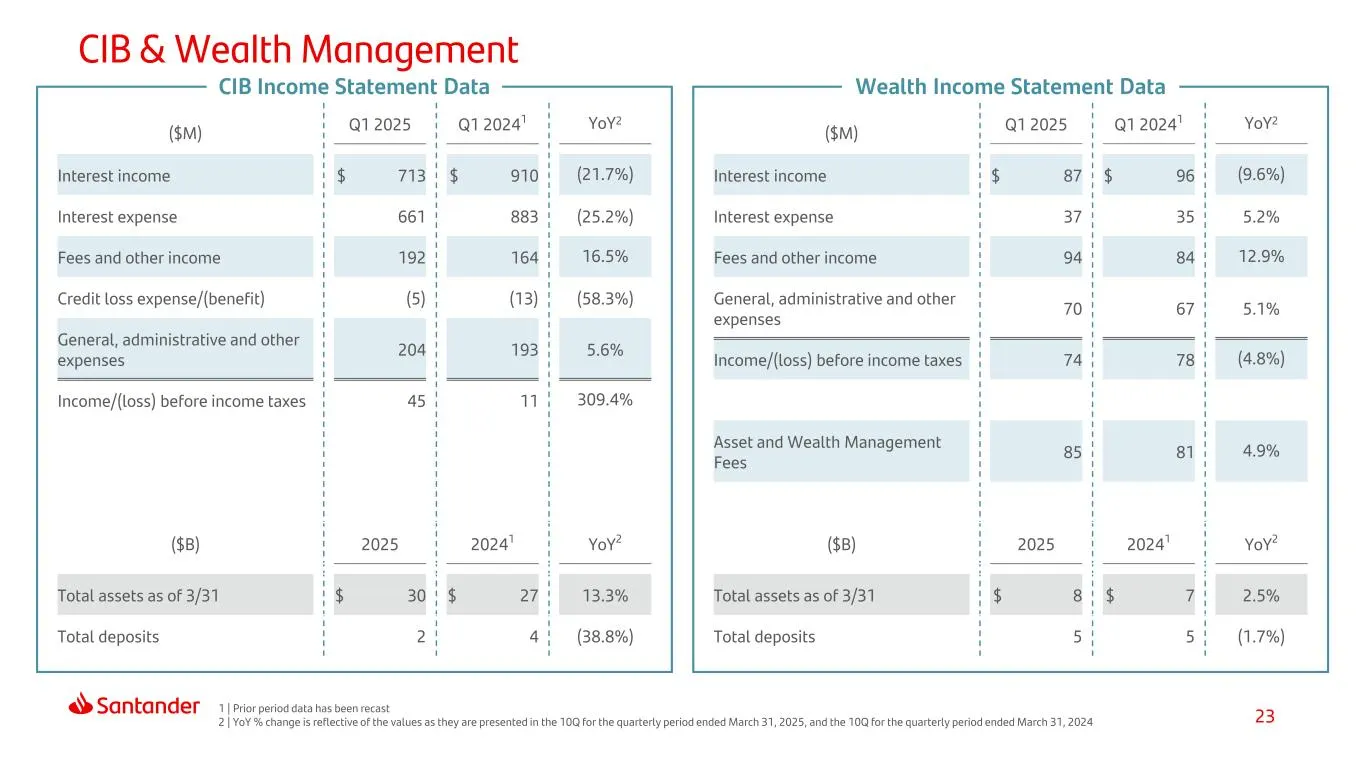
Slide 23: CIB & Wealth Management
23 CIB Income Statement Data Wealth Income Statement Data 1 | Prior period data has been recast 2 | YoY % change is reflective of the values as they are presented in the 10Q for the quarterly period ended March 31, 2025, and the 10Q for the quarterly period ended March 31, 2024 CIB & Wealth Manageme
Slide 24: Index
24 1 At a Glance 2 Results Appendix 4 Index 3 Core Business Activities
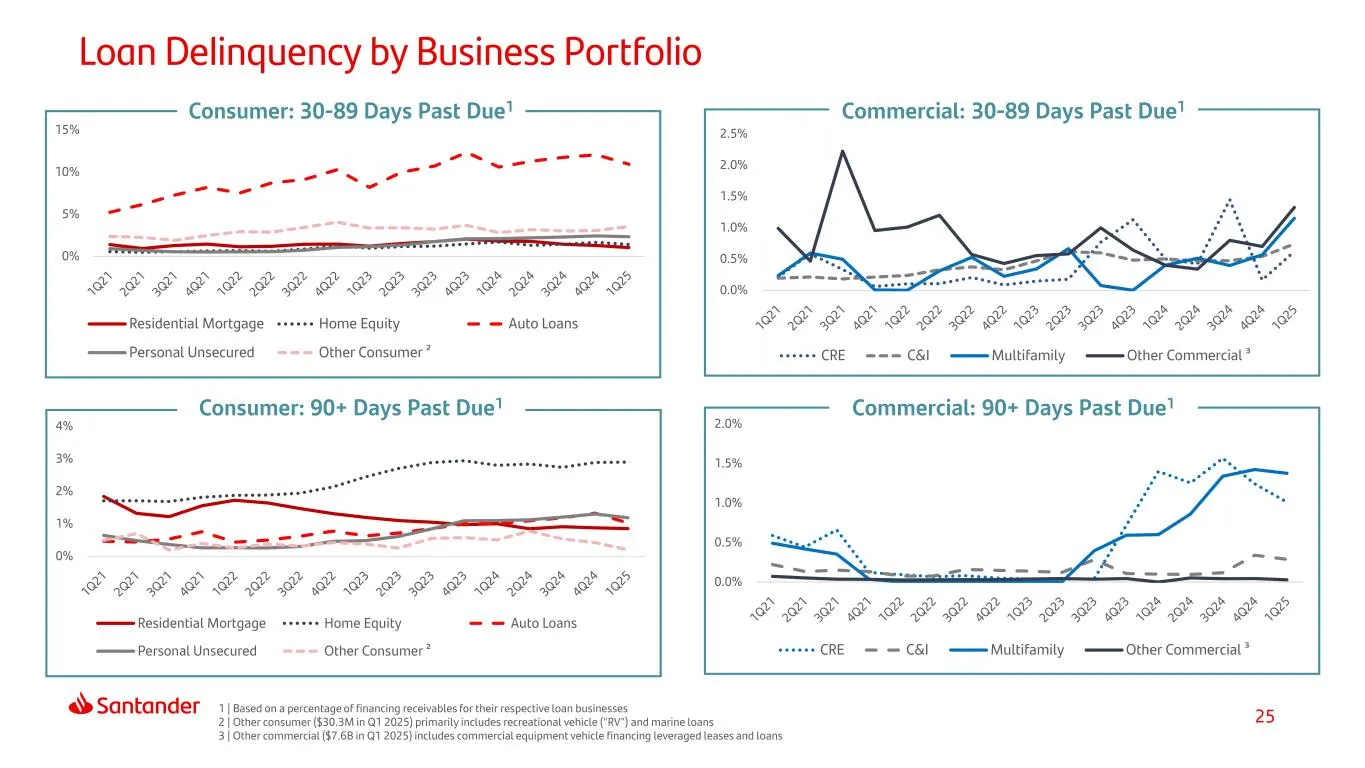
Slide 25: Loan Delinquency by Business Portfolio
25 Loan Delinquency by Business Portfolio 1 | Based on a percentage of financing receivables for their respective loan businesses 2 | Other consumer ($30.3M in Q1 2025) primarily includes recreational vehicle ("RV") and marine loans 3 | Other commercial ($7.6B in Q1 2025) includes commercial equipme
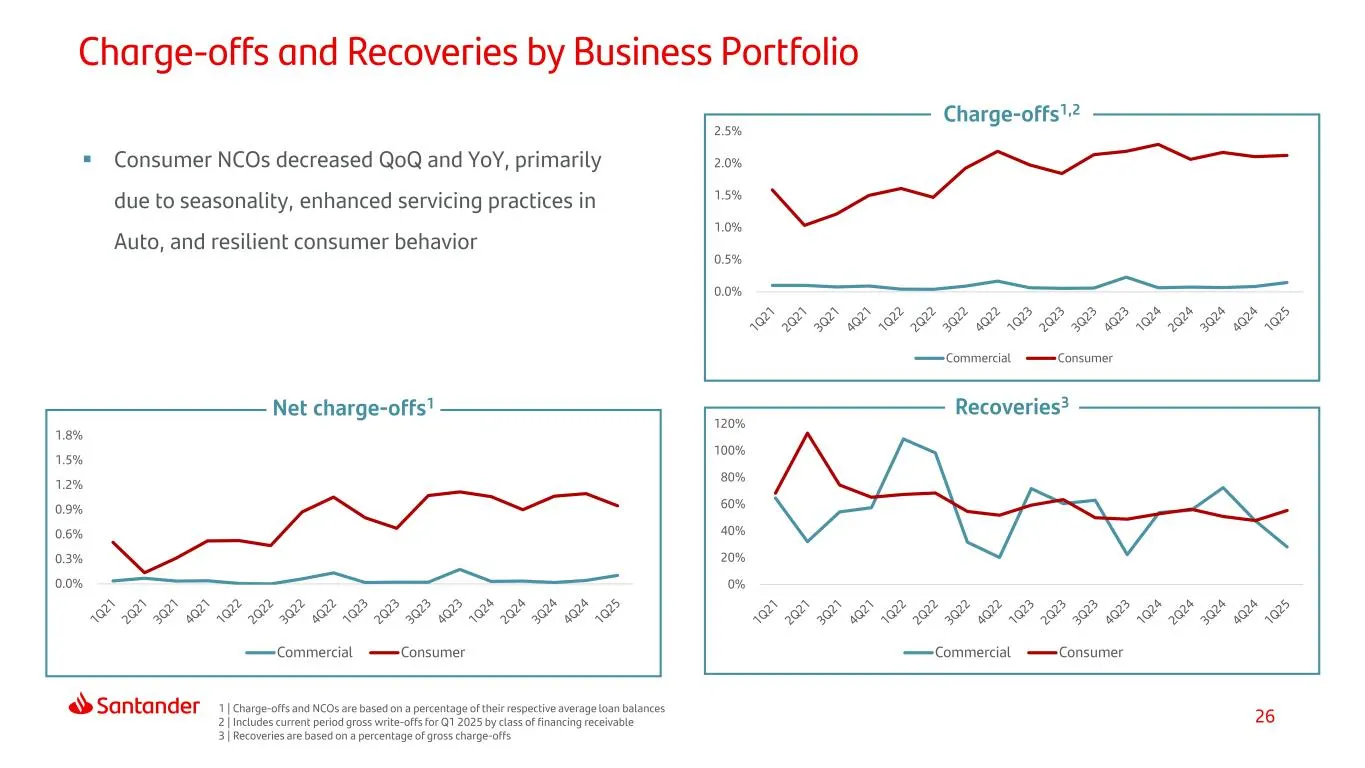
Slide 26: Charge-offs and Recoveries by Business Portfolio
26 Charge-offs and Recoveries by Business Portfolio Charge-offs1,2 Recoveries3 1 | Charge-offs and NCOs are based on a percentage of their respective average loan balances 2 | Includes current period gross write-offs for Q1 2025 by class of financing receivable 3 | Recoveries are based on a percenta
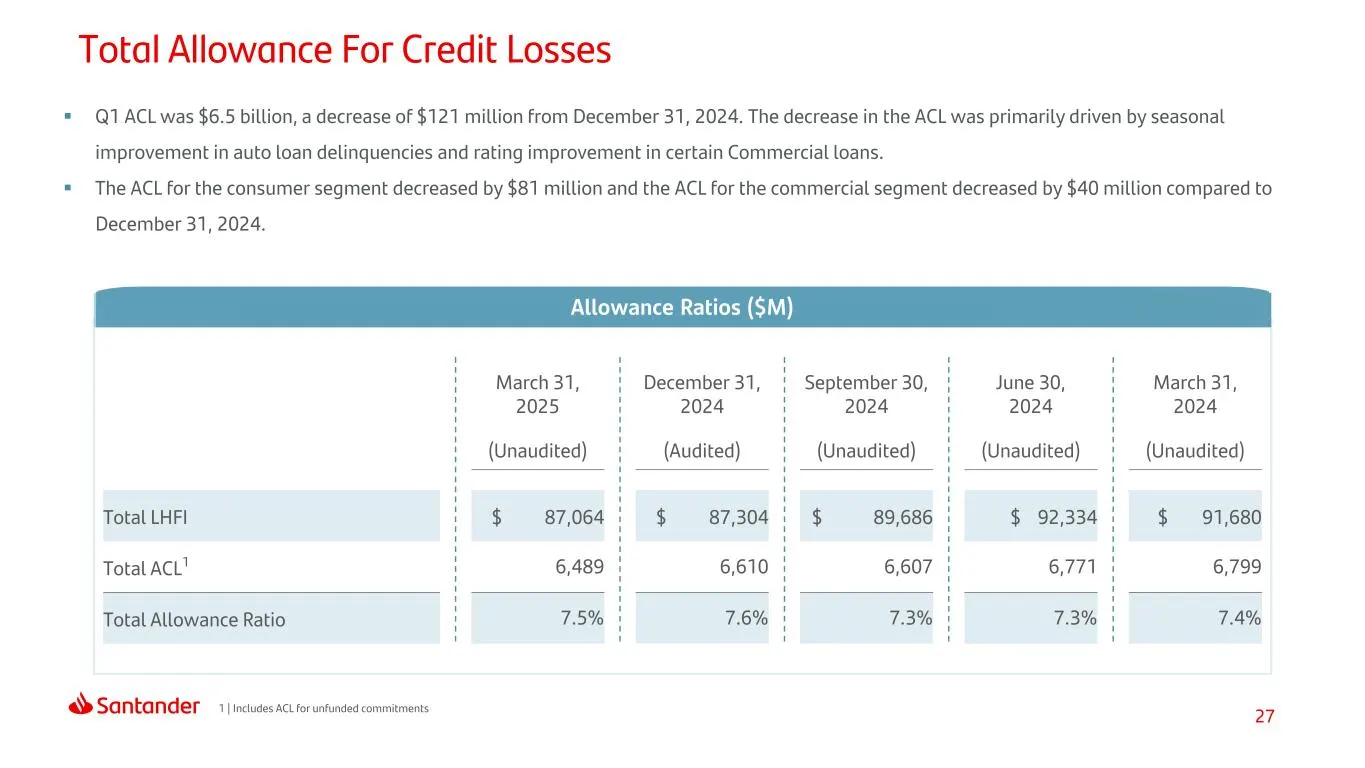
Slide 27: Total Allowance For Credit Losses
27 Q1 ACL was $6.5 billion, a decrease of $121 million from December 31, 2024. The decrease in the ACL was primarily driven by seasonal improvement in auto loan delinquencies and rating improvement in certain Commercial loans. The ACL for the consumer segment decreased by $81 million and the ACL
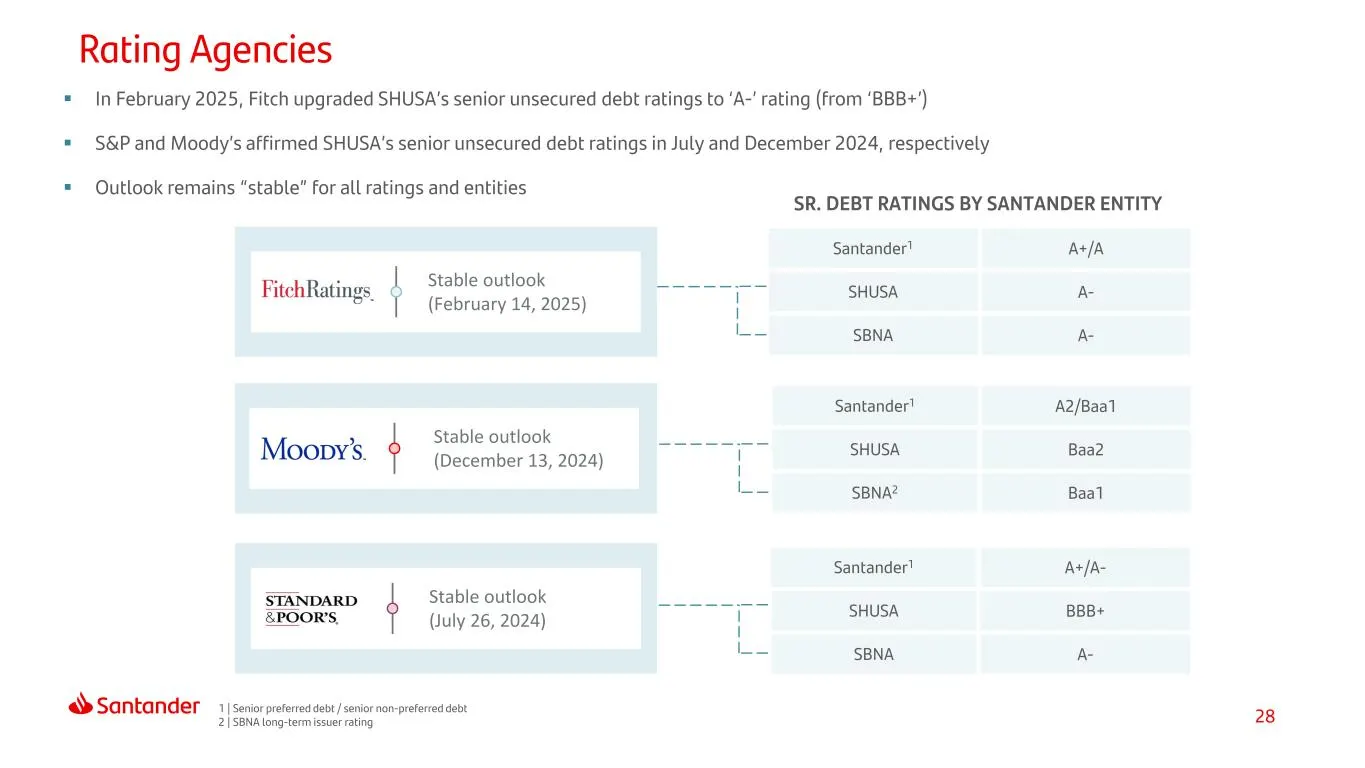
Slide 28: Rating Agencies
28 Santander1 A2/Baa1 SHUSA Baa2 SBNA2 Baa1 Santander1 A+/A- SHUSA BBB+ SBNA A- Stable outlook (February 14, 2025) In February 2025, Fitch upgraded SHUSA’s senior unsecured debt ratings to ‘A-’ rating (from ‘BBB+’) S&P and Moody’s affirmed SHUSA’s senior unsecured debt ratings in July and Decemb
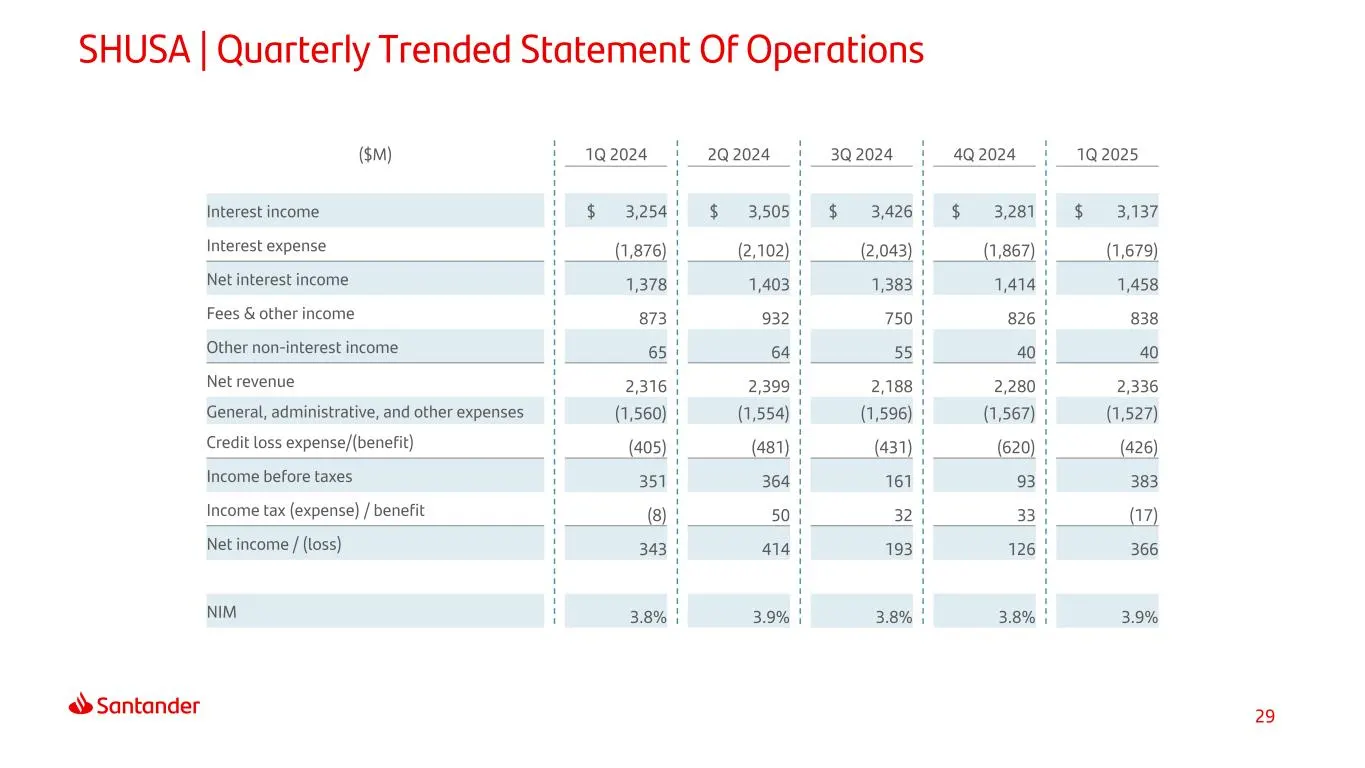
Slide 29: SHUSA | Quarterly Trended Statement Of Operations
29 SHUSA | Quarterly Trended Statement Of Operations ($M) 1Q 2024 2Q 2024 3Q 2024 4Q 2024 1Q 2025 Interest income $ 3,254 $ 3,505 $ 3,426 $ 3,281 $ 3,137 Interest expense (1,876) (2,102) (2,043) (1,867) (1,679) Net interest income 1,378 1,403 1,383 1,414 1,458 Fees & other income 873 932 750 826 838
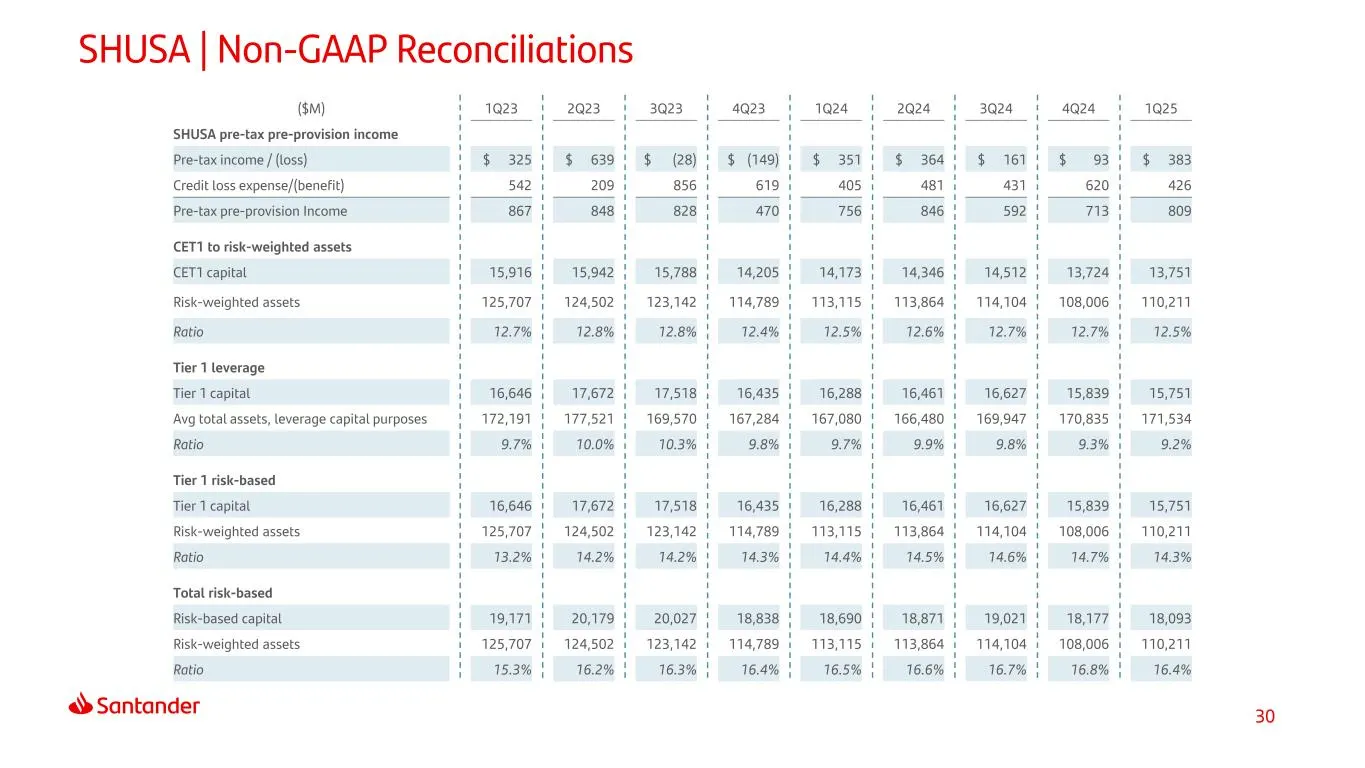
Slide 30: SHUSA | Non-GAAP Reconciliations
30 SHUSA | Non-GAAP Reconciliations ($M) 1Q23 2Q23 3Q23 4Q23 1Q24 2Q24 3Q24 4Q24 1Q25 SHUSA pre-tax pre-provision income Pre-tax income / (loss) $ 325 $ 639 $ (28) $ (149) $ 351 $ 364 $ 161 $ 93 $ 383 Credit loss expense/(benefit) 542 209 856 619 405 481 431 620 426 Pre-tax pre-provision Income 867

Slide 31: Thank You
Thank You. Our purpose is to help people and businesses prosper. Our culture is based on believing that everything we do should be:
Source: SEC EDGAR · 8-K filed May 2, 2025
More decks from Santander Holdings USA Inc
 Debt Investor Presentation (August 2026)30 slides · Aug 12, 2026
 Debt Investor Presentation (August 2026)30 slides · Aug 12, 2026
 Debt Investor Presentation (June 2026)29 slides · Jun 12, 2026
 Debt Investor Presentation (June 2026)29 slides · Jun 12, 2026
 Debt Investor Presentation (March 2026)36 slides · Mar 6, 2026
 Debt Investor Presentation (March 2026)36 slides · Mar 6, 2026