AmREIT — Q3 2008 Earnings Presentation
18 slides from AmREIT's earnings presentation, Nov 5, 2008
Slide 1: AmREIT Supplemental Financial Information
Exhibit 99.2 AmREIT Supplemental Financial Information September 30, 2008 (Unaudited)
Slide 2: Table of Contents
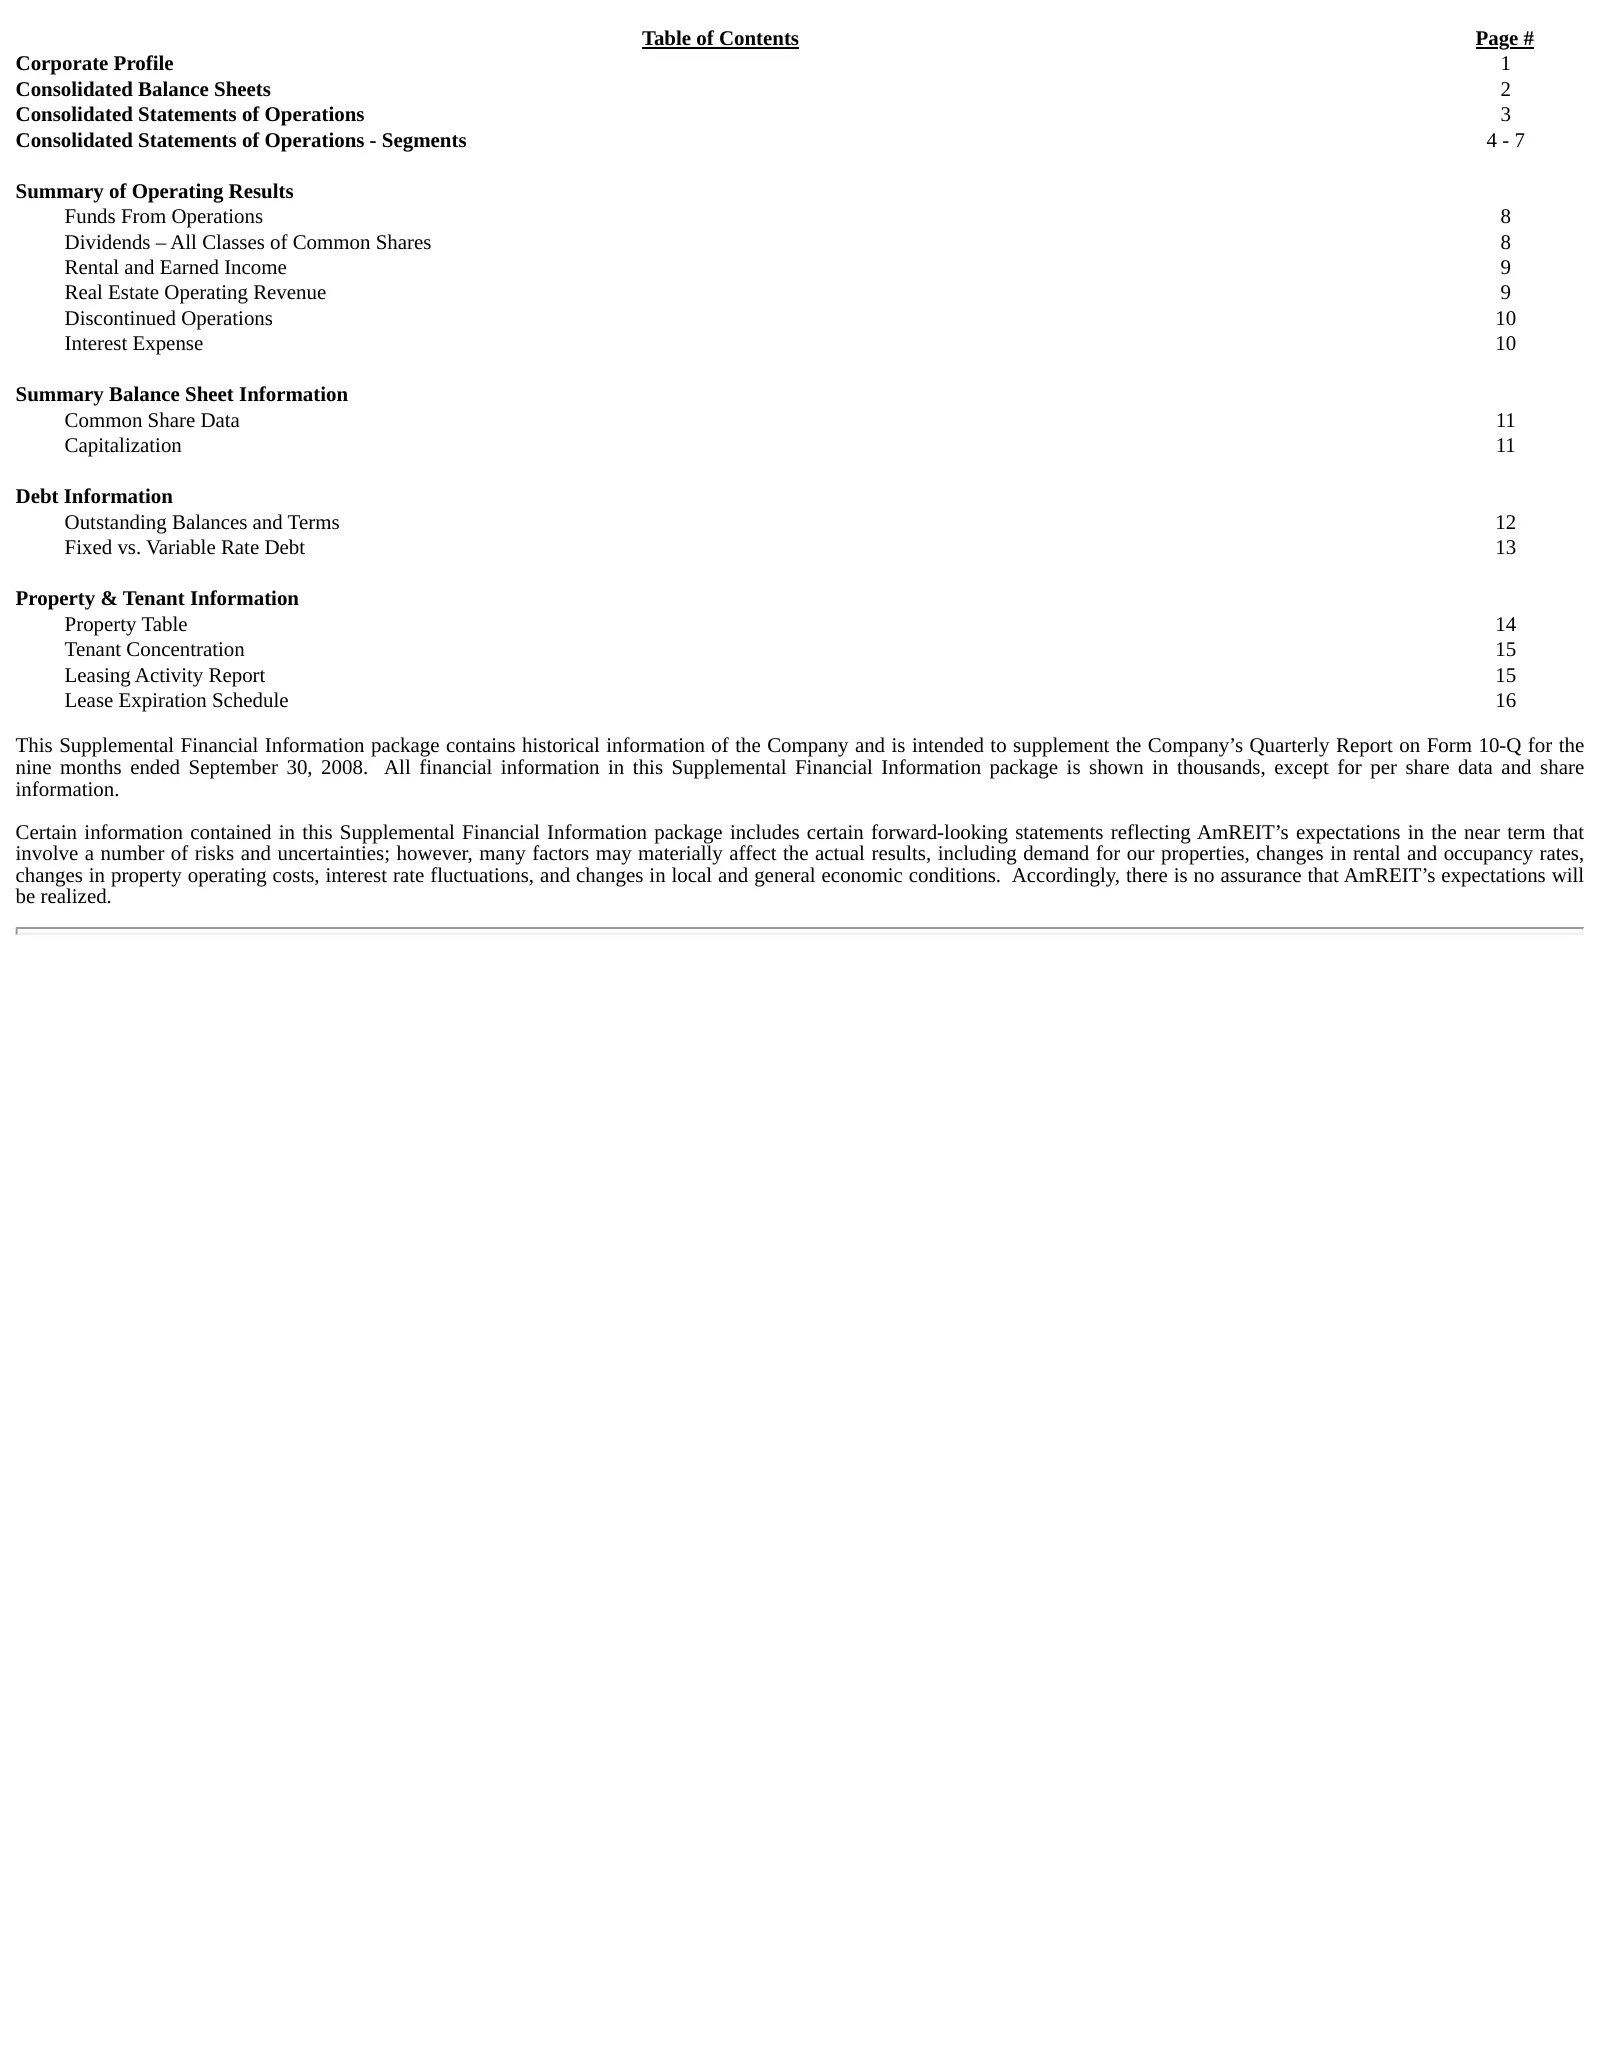
Table of Contents Page # Corporate Profile 1 Consolidated Balance Sheets 2 Consolidated Statements of Operations 3 Consolidated Statements of Operations - Segments 4-7 Summary of Operating Results Funds From Operations 8 Dividends – All Classes of Common Shares 8 Rental and Earned Income 9 Real Esta
Slide 3: Corporate Profile
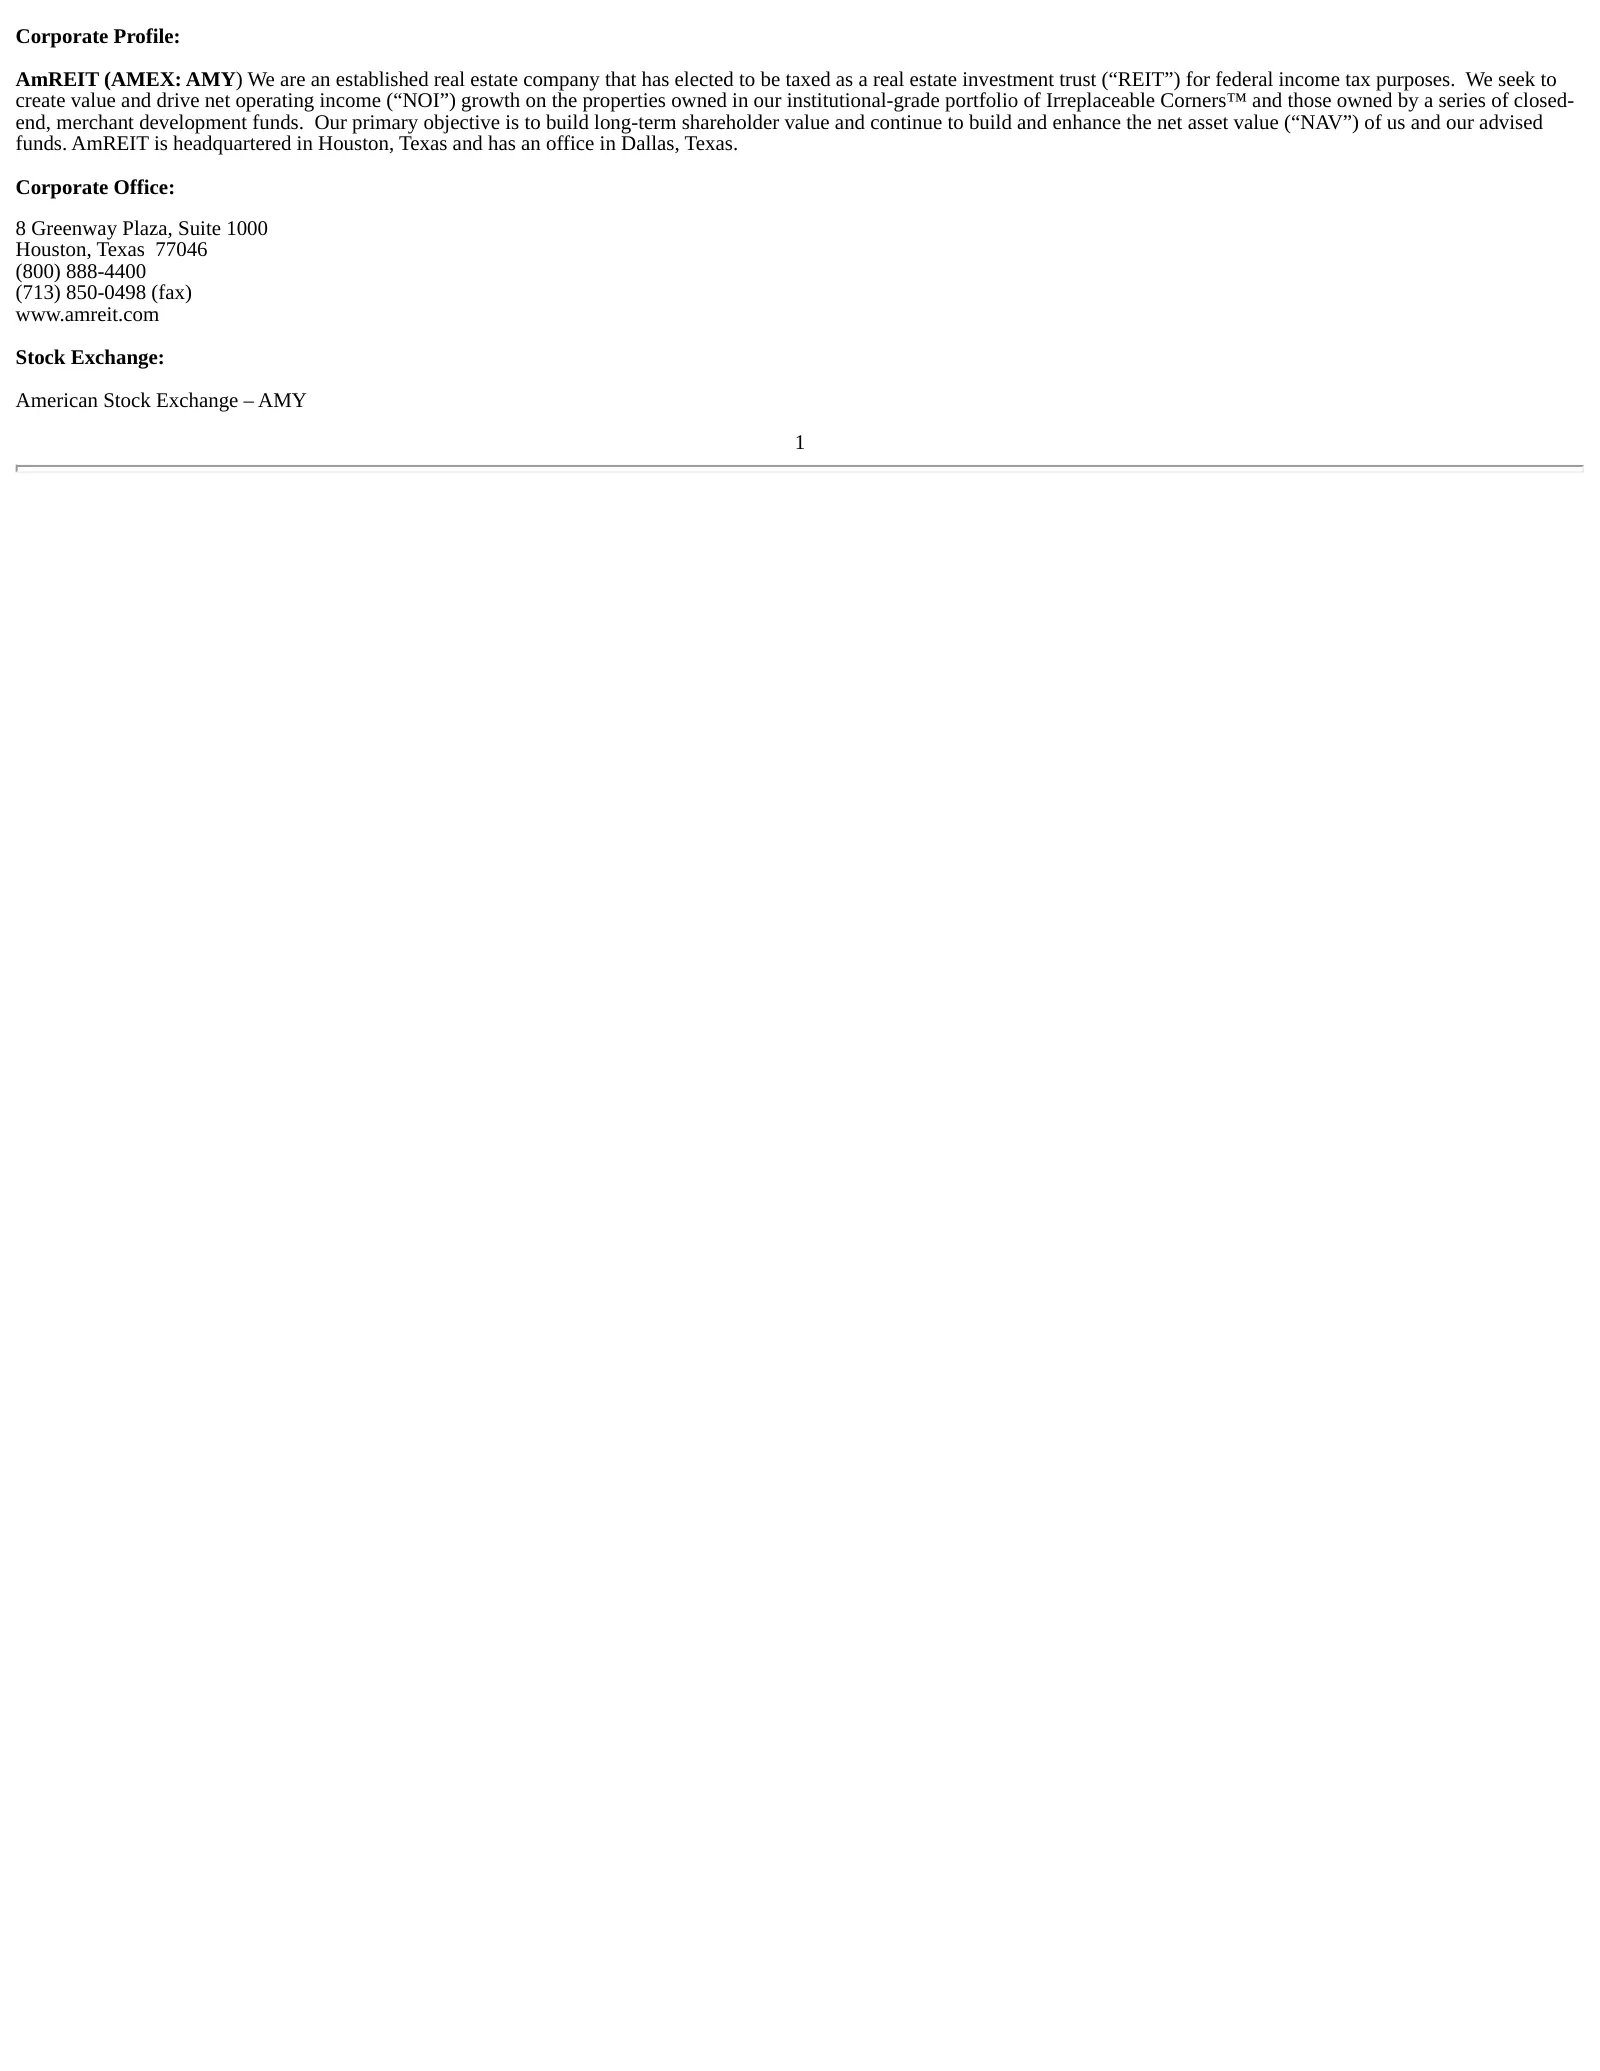
Corporate Profile: AmREIT (AMEX: AMY) We are an established real estate company that has elected to be taxed as a real estate investment trust (“REIT”) for federal income tax purposes. We seek to create value and drive net operating income (“NOI”) growth on the properties owned in our institutional-
Slide 4: Consolidated Balance Sheets
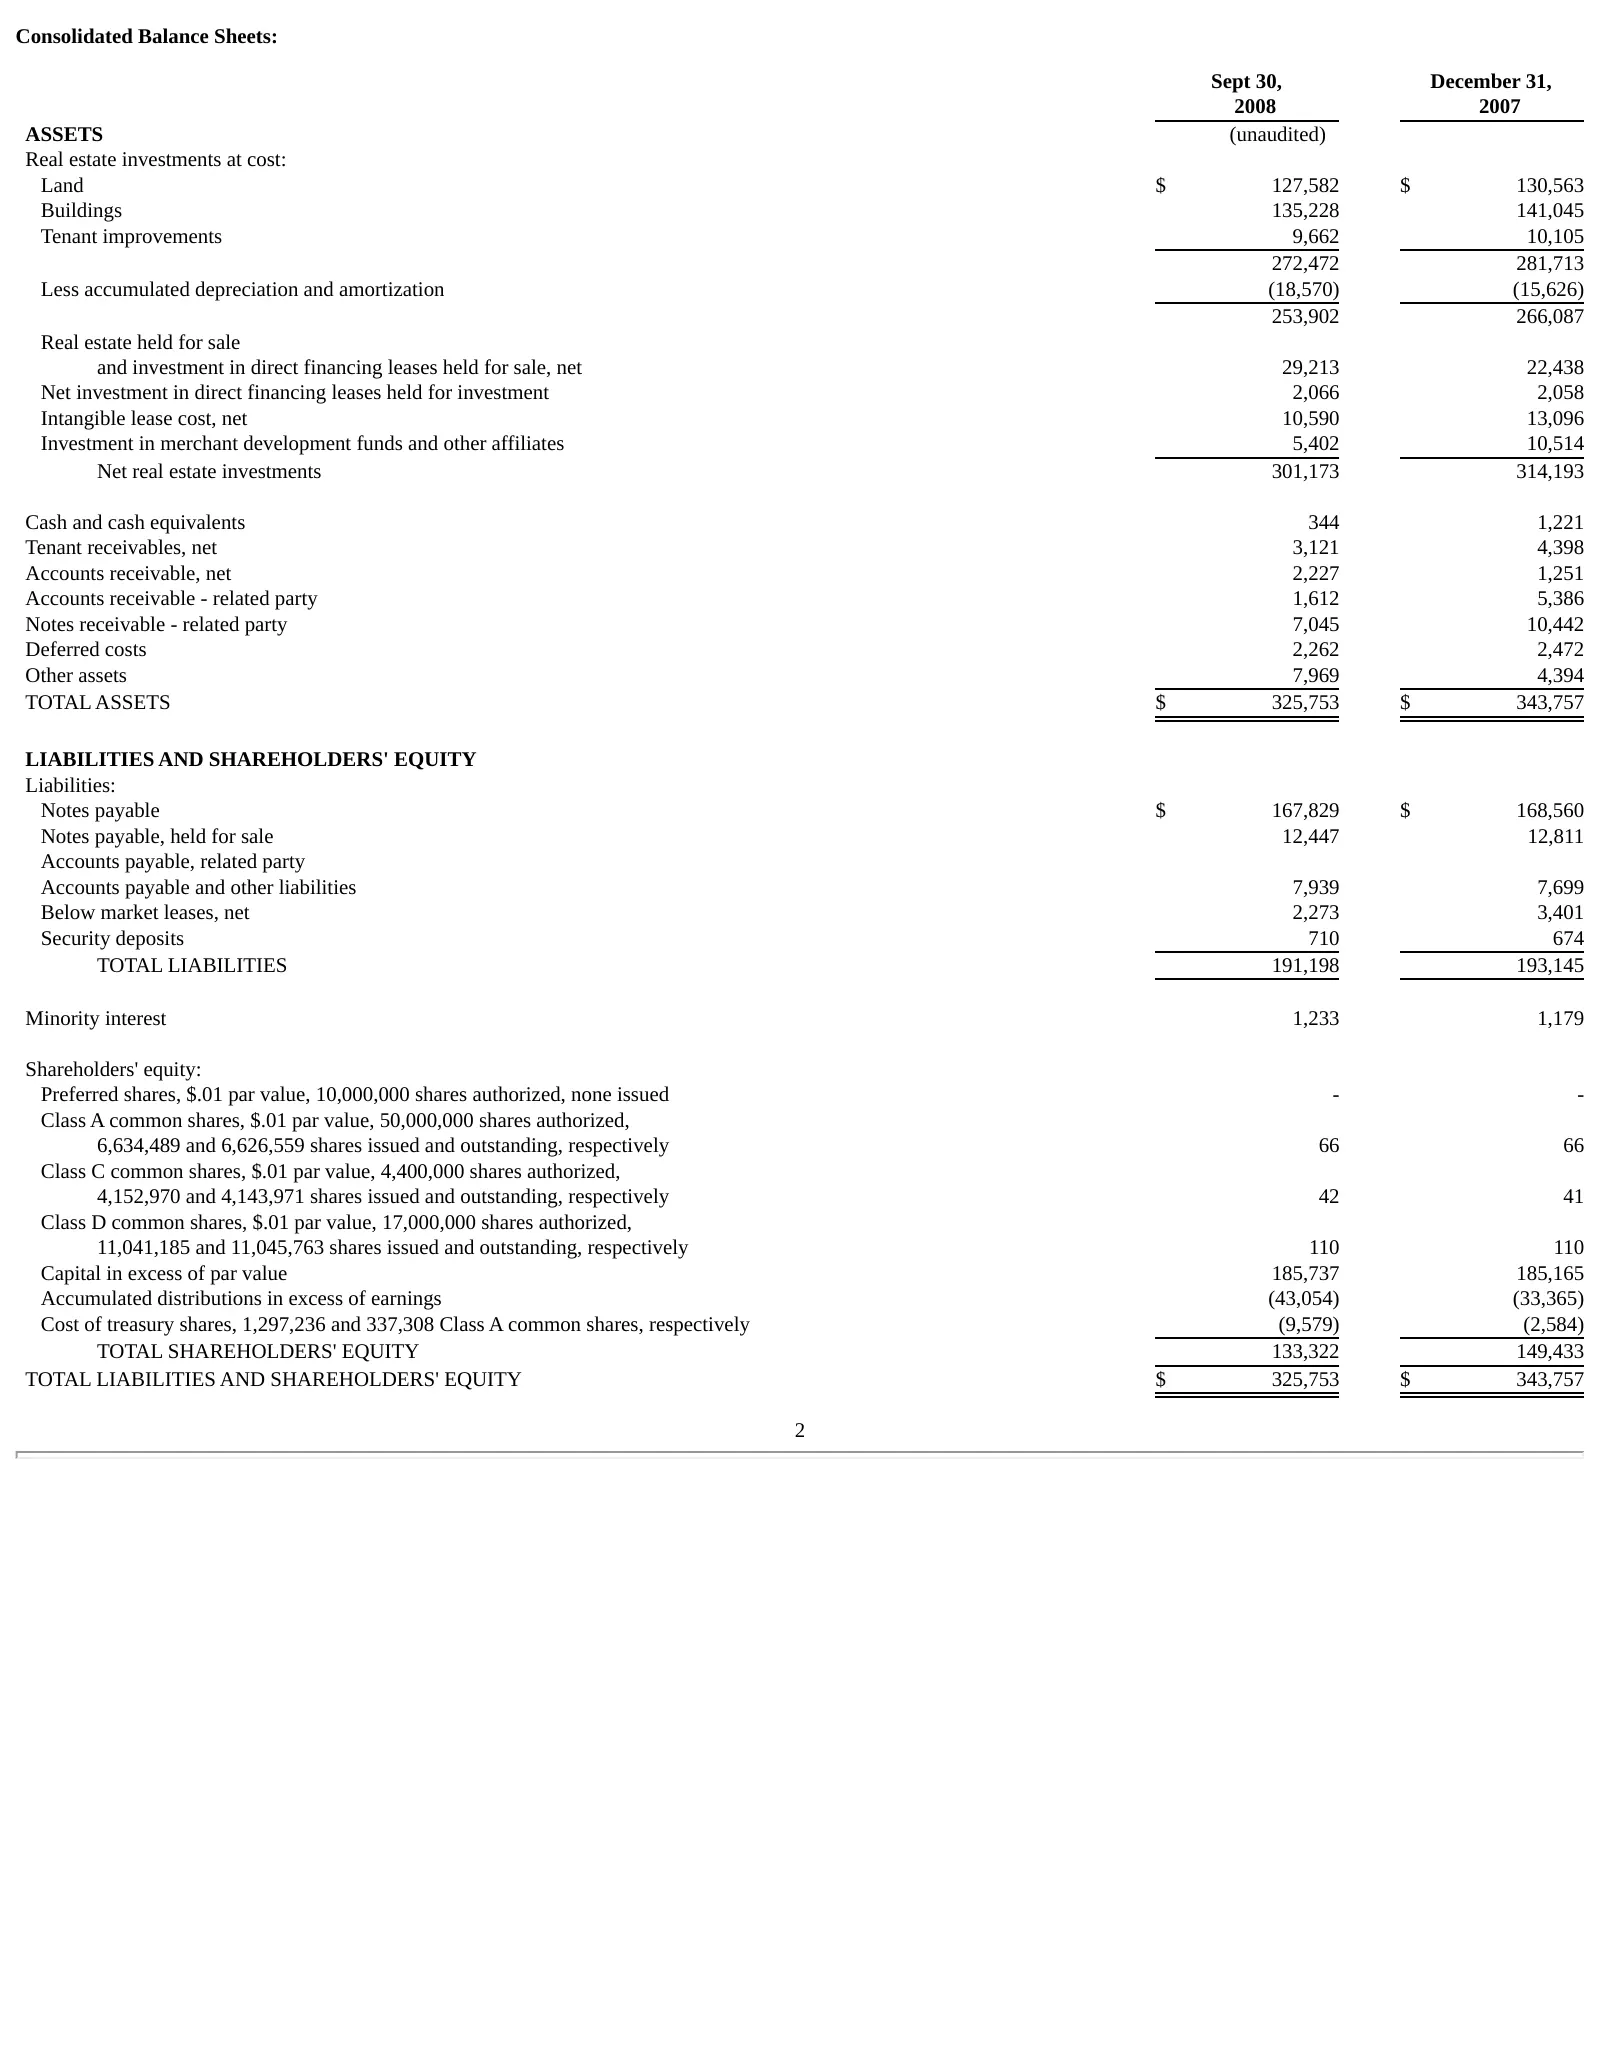
Consolidated Balance Sheets: Sept 30, December 31, 2008 2007 ASSETS (unaudited) Real estate investments at cost: Land $ 127,582 $ 130,563 Buildings 135,228 141,045 Tenant improvements 9,662 10,105 272,472 281,713 Less accumulated depreciation and amortization (18,570) (15,626) 253,902 266,087 Real e
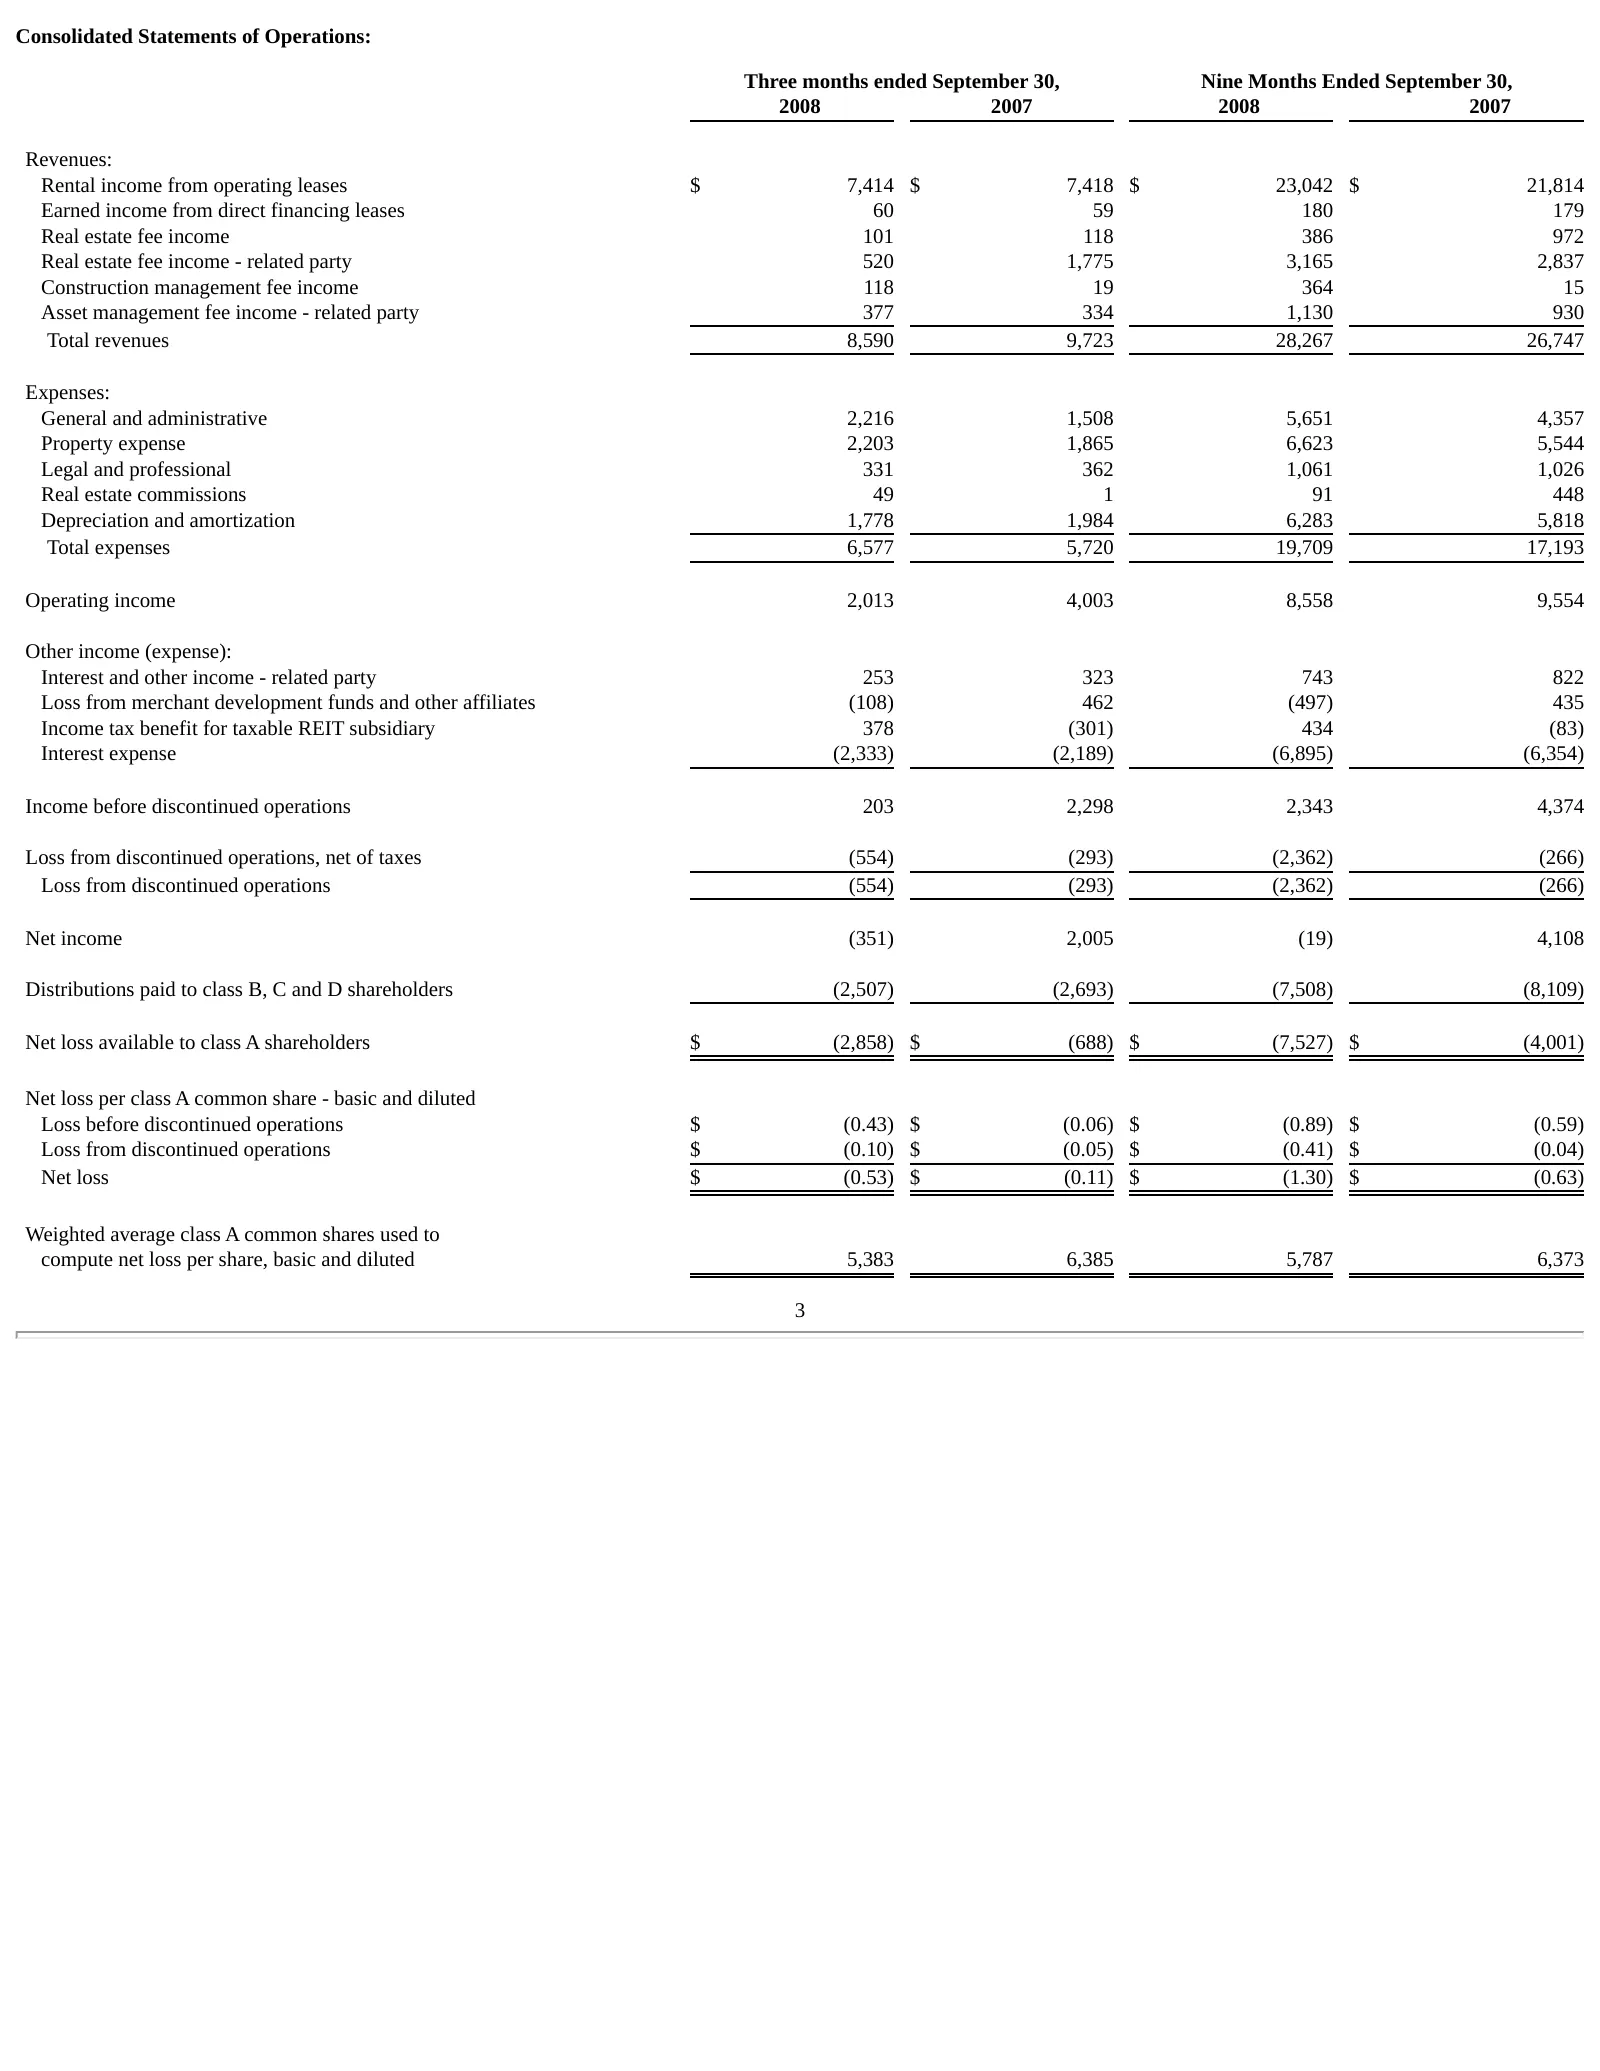
Slide 5: Consolidated Statements of Operations
Consolidated Statements of Operations: Three months ended September 30, Nine Months Ended September 30, 2008 2007 2008 2007 Revenues: Rental income from operating leases $ 7,414 $ 7,418 $ 23,042 $ 21,814 Earned income from direct financing leases 60 59 180 179 Real estate fee income 101 118 386 972
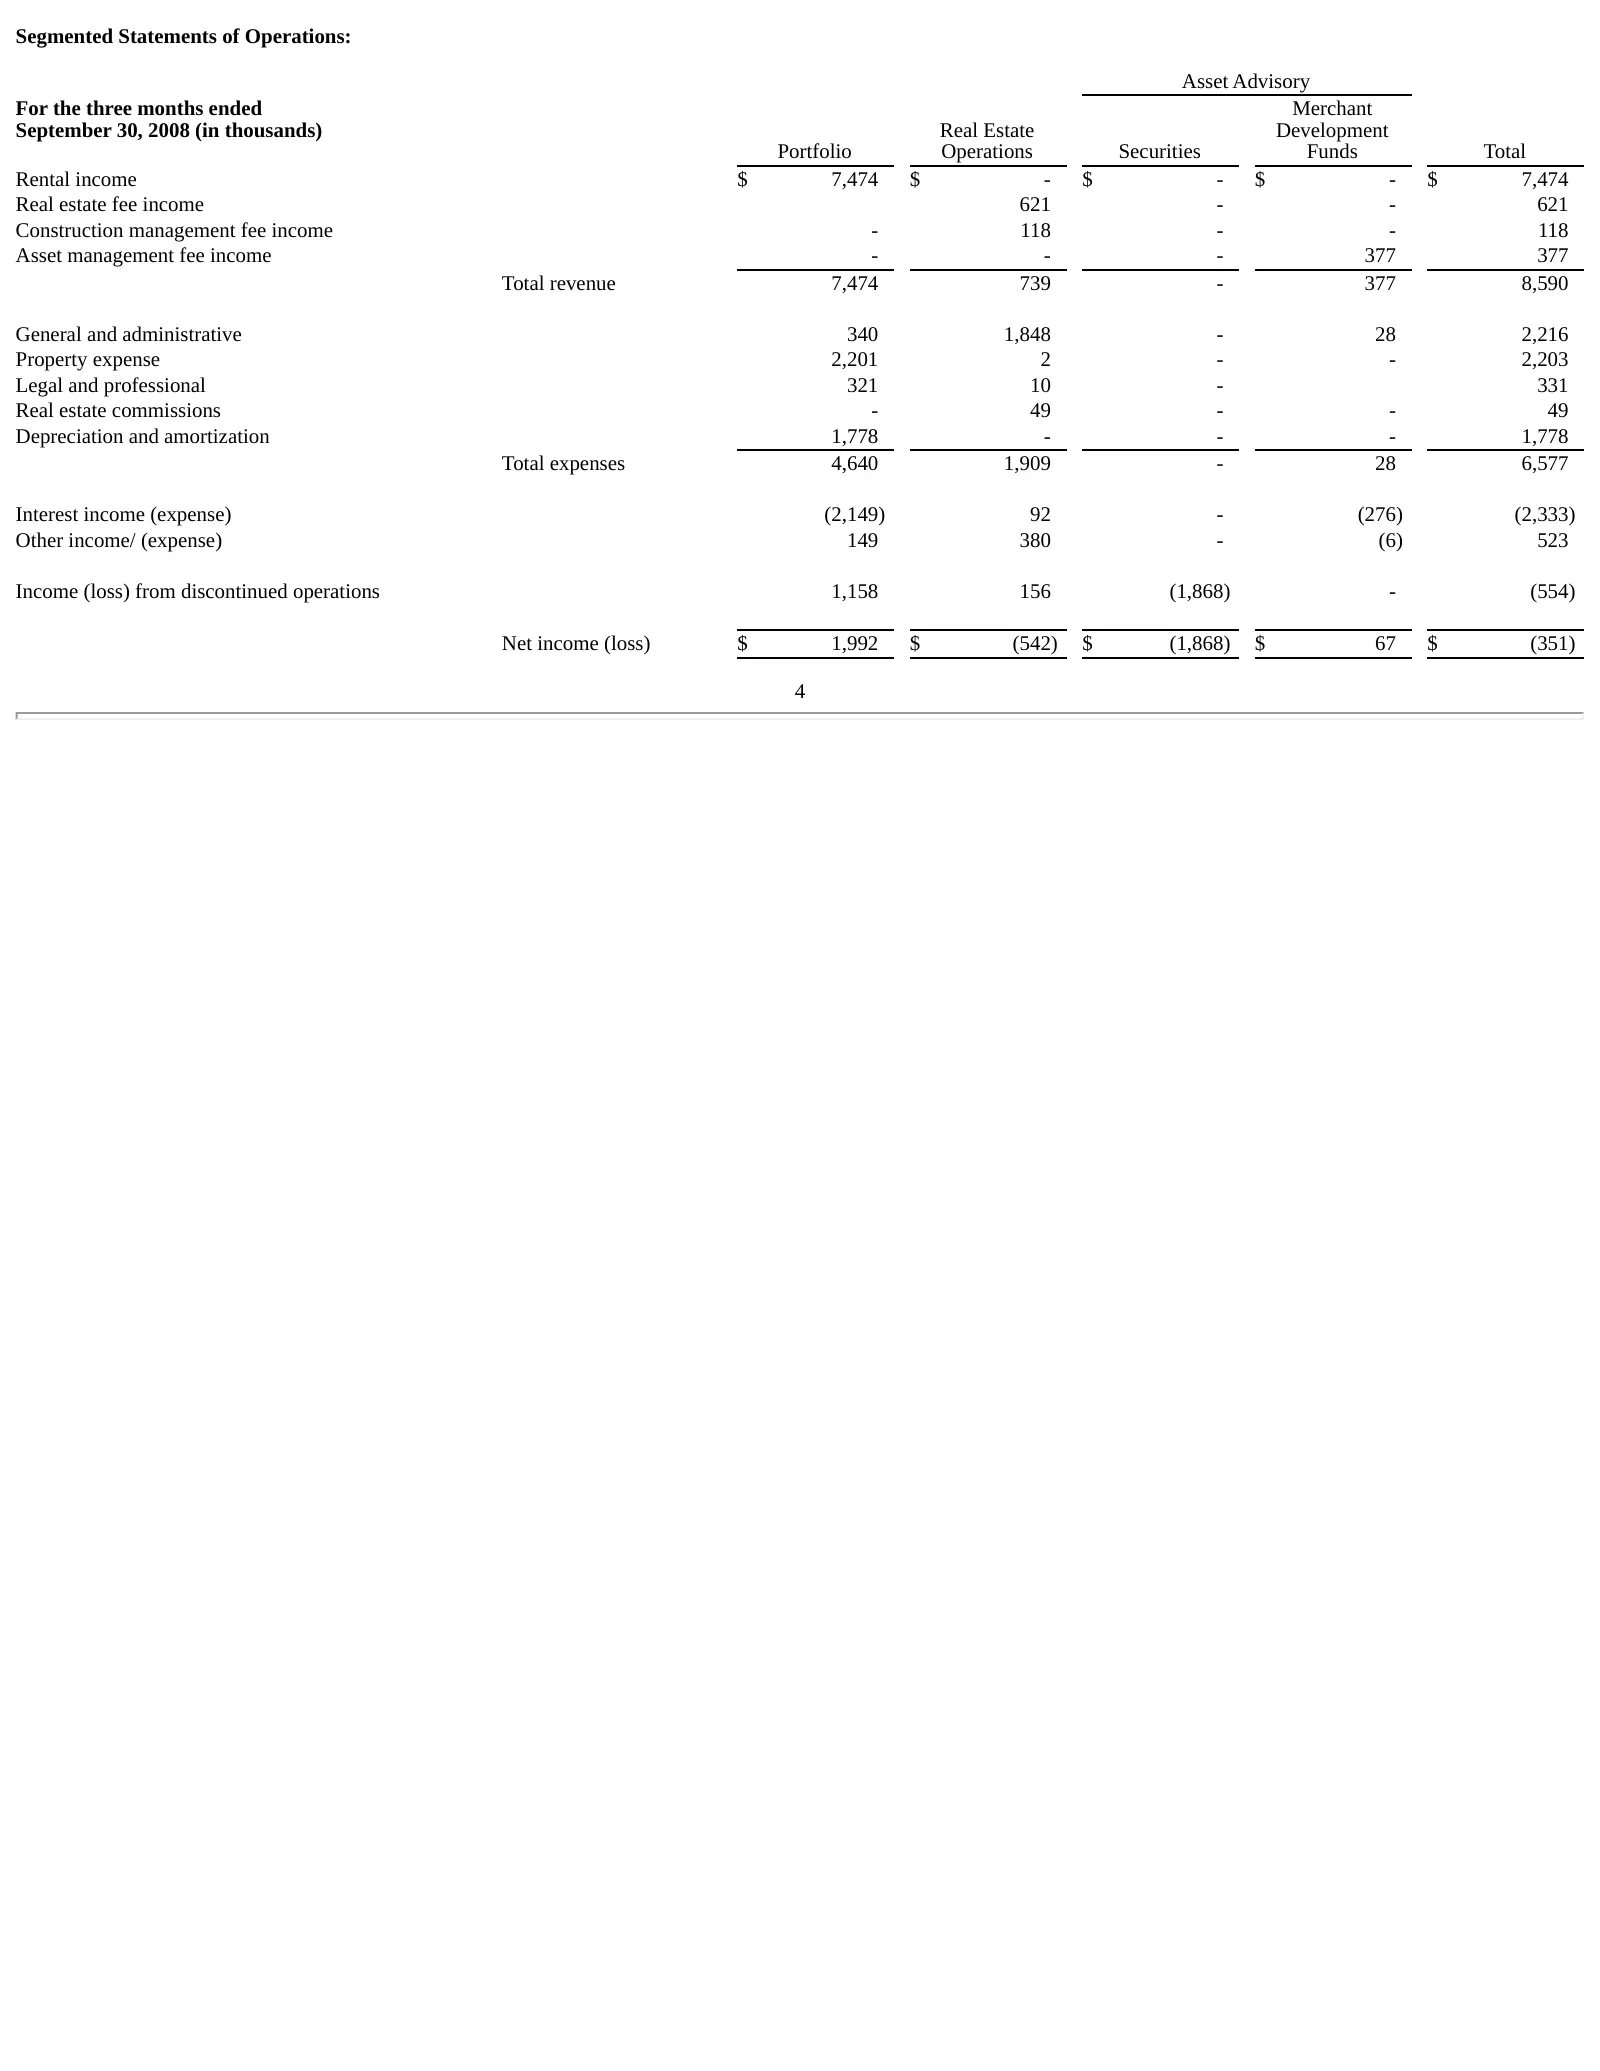
Slide 6: Segmented Statements of Operations: Three Months Ended September 30, 2008
Segmented Statements of Operations: Asset Advisory For the three months ended Merchant September 30, 2008 (in thousands) Real Estate Development Portfolio Operations Securities Funds Total Rental income $ 7,474 $ - $ - $ - $ 7,474 Real estate fee income 621 - - 621 Construction management fee income
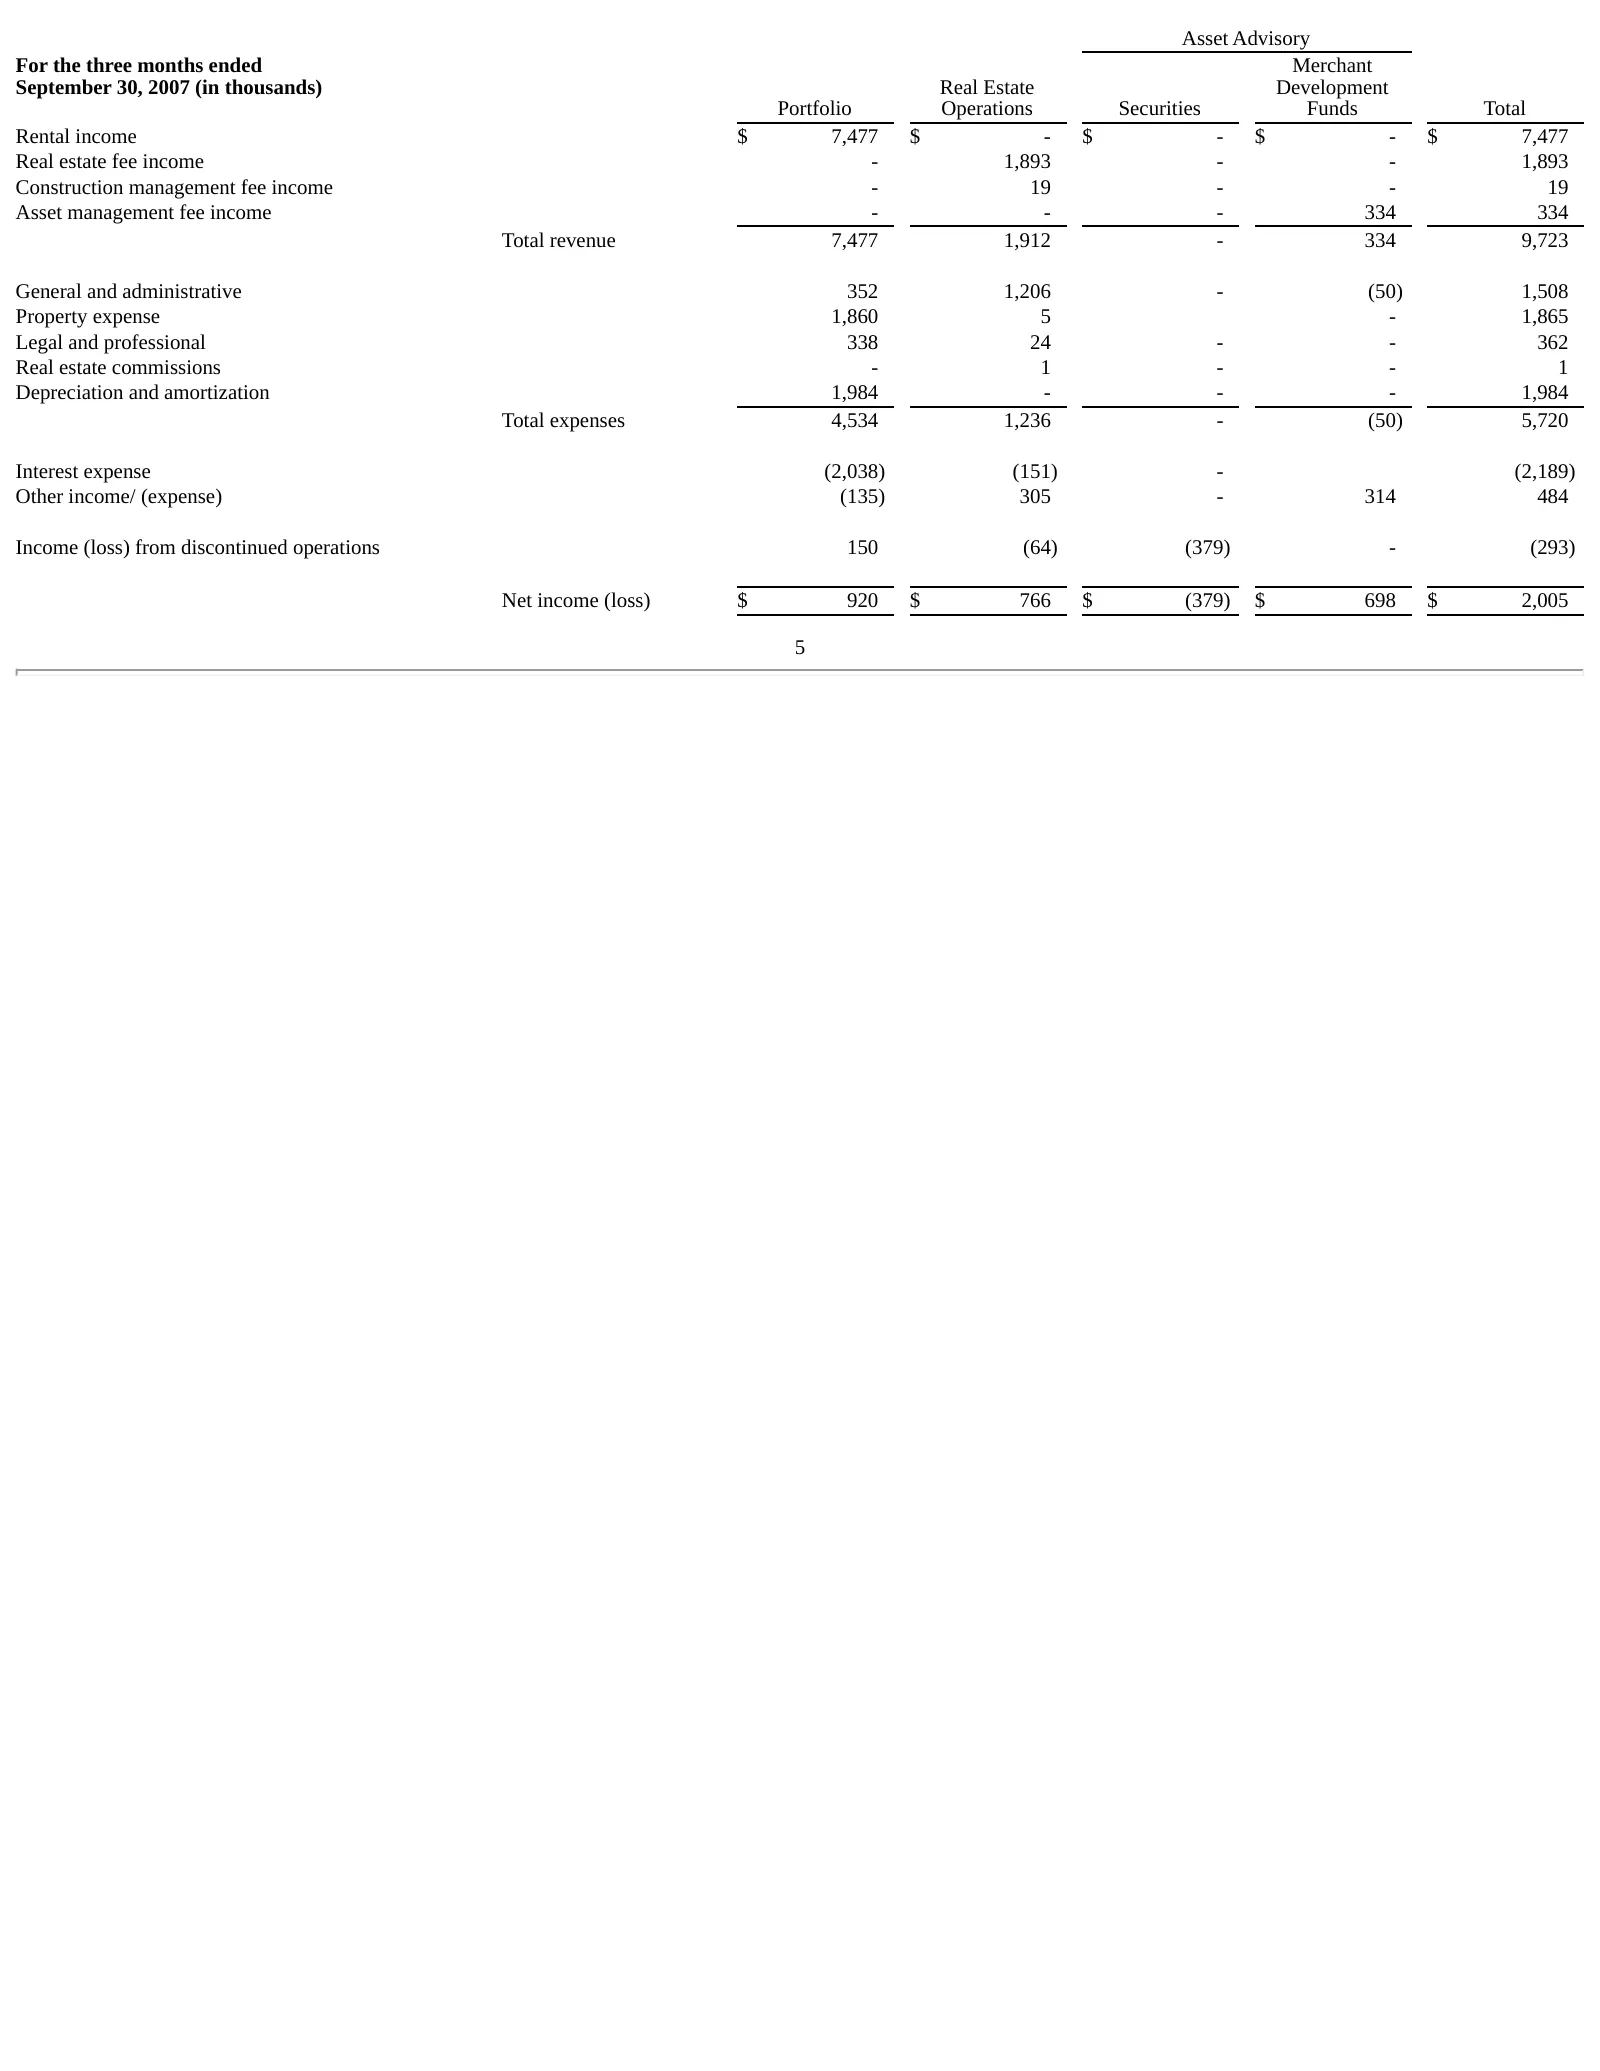
Slide 7: Segmented Statements of Operations: Three Months Ended September 30, 2007
Asset Advisory For the three months ended Merchant September 30, 2007 (in thousands) Real Estate Development Portfolio Operations Securities Funds Total Rental income $ 7,477 $ - $ - $ - $ 7,477 Real estate fee income - 1,893 - - 1,893 Construction management fee income - 19 - - 19 Asset management
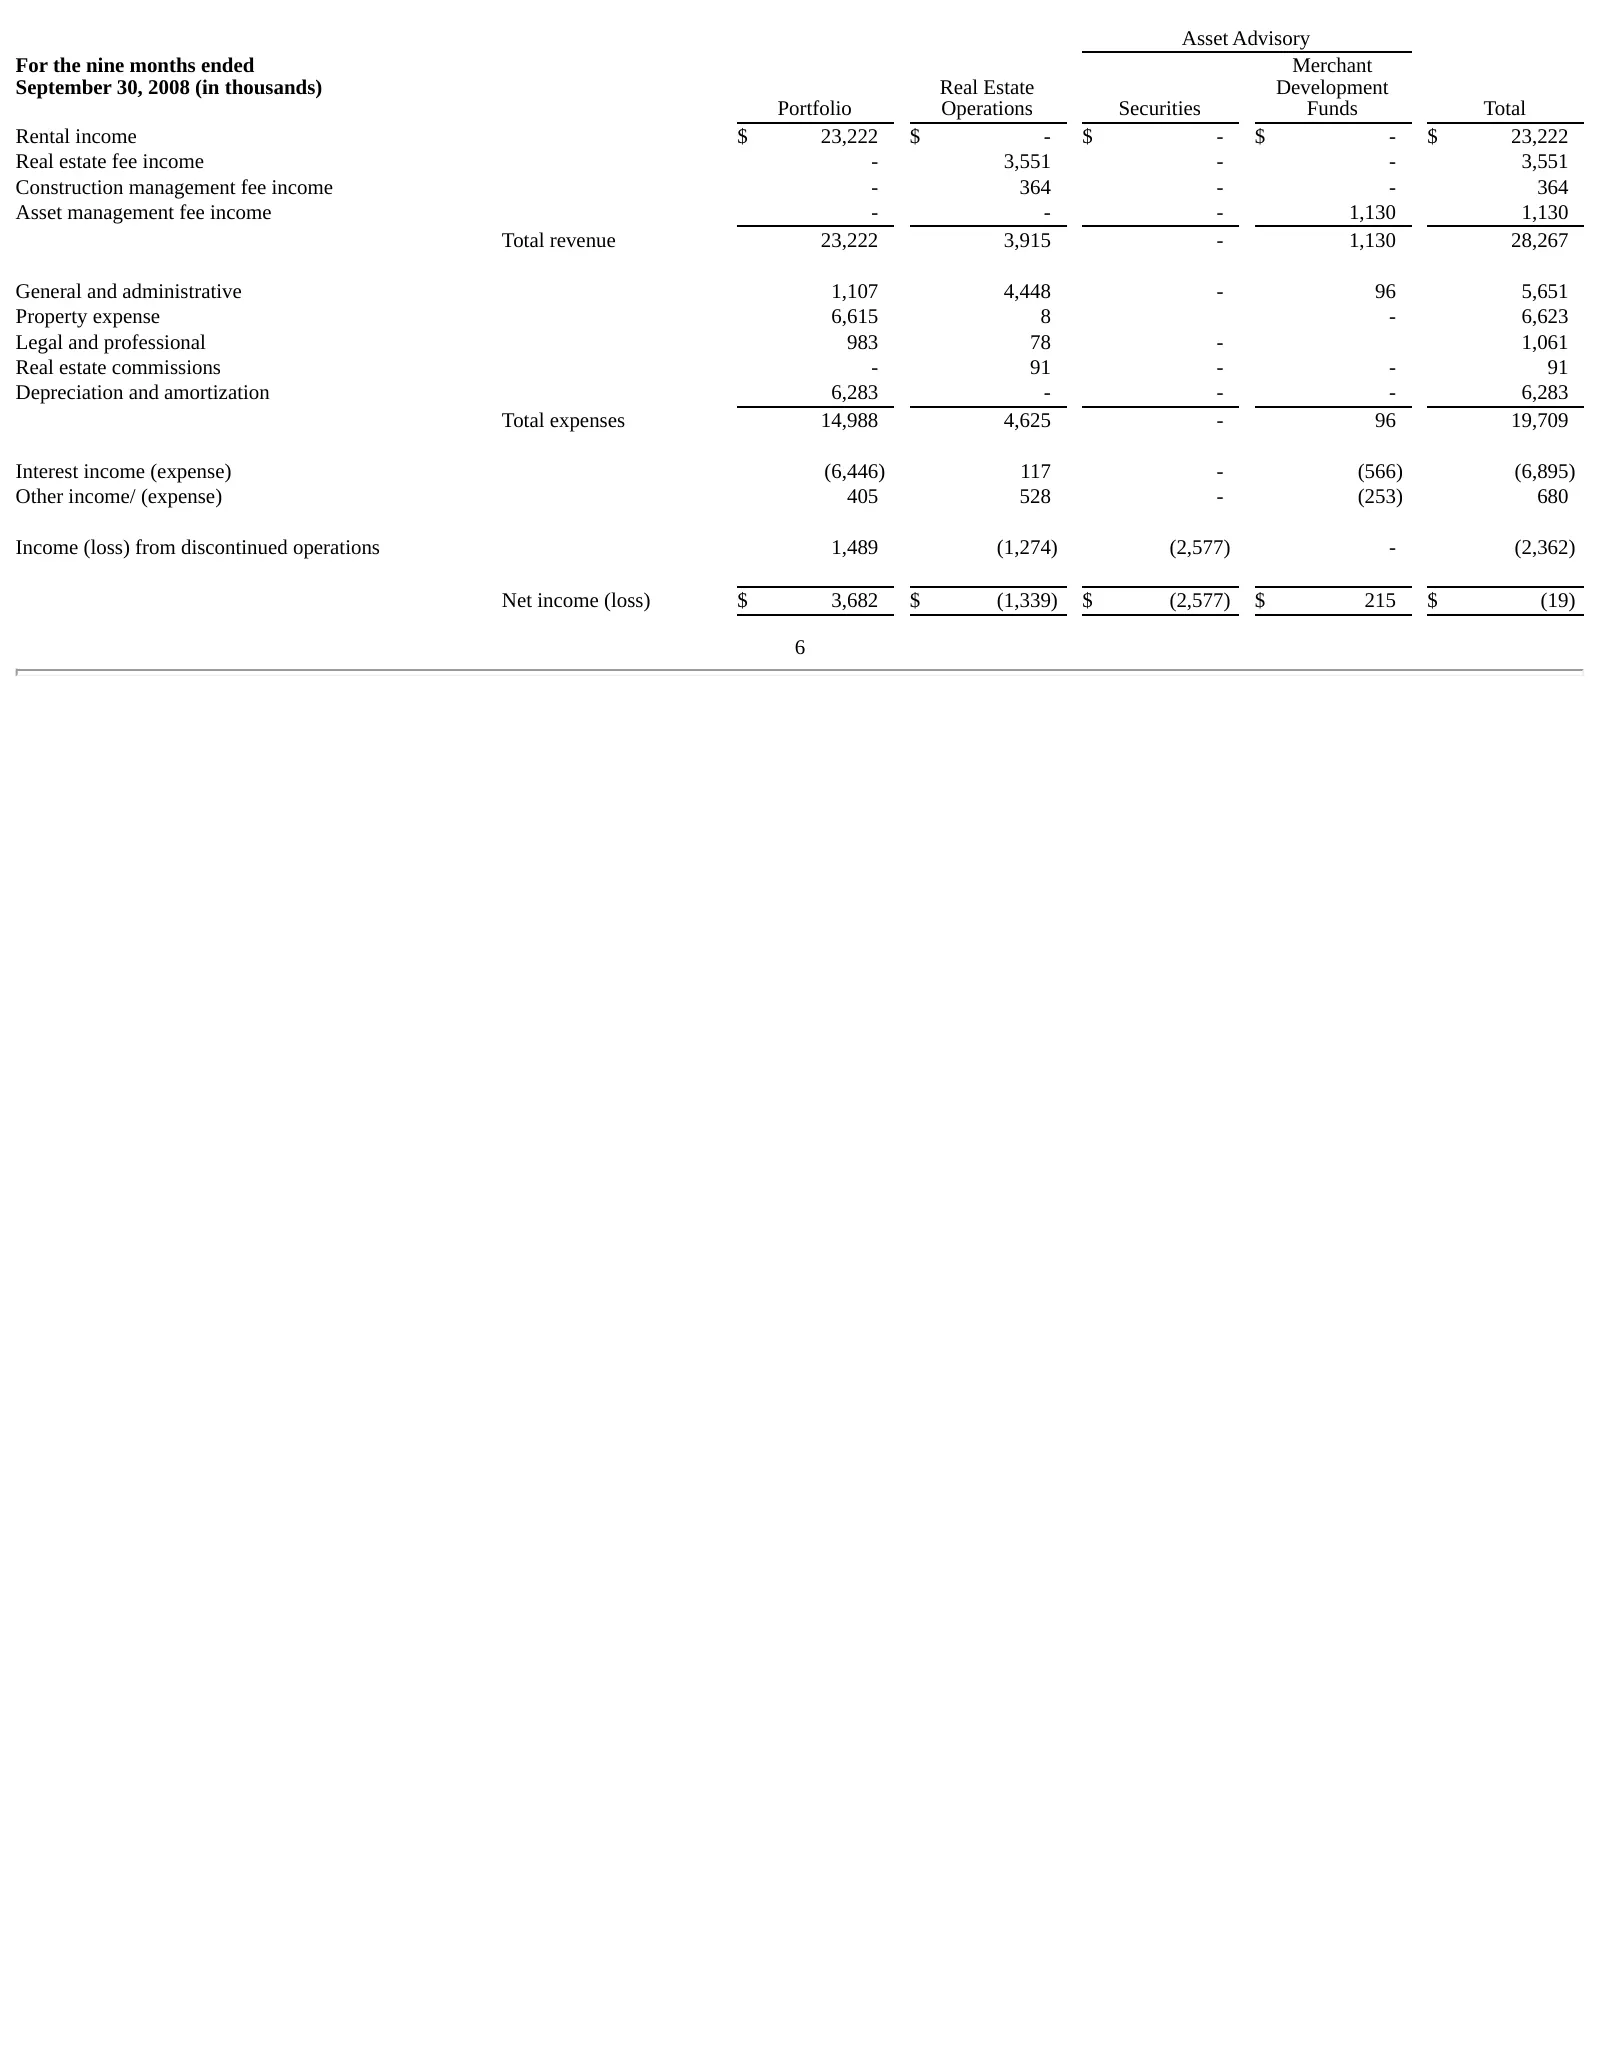
Slide 8: Segmented Statements of Operations: Nine Months Ended September 30, 2008
Asset Advisory For the nine months ended Merchant September 30, 2008 (in thousands) Real Estate Development Portfolio Operations Securities Funds Total Rental income $ 23,222 $ - $ - $ - $ 23,222 Real estate fee income - 3,551 - - 3,551 Construction management fee income - 364 - - 364 Asset manageme
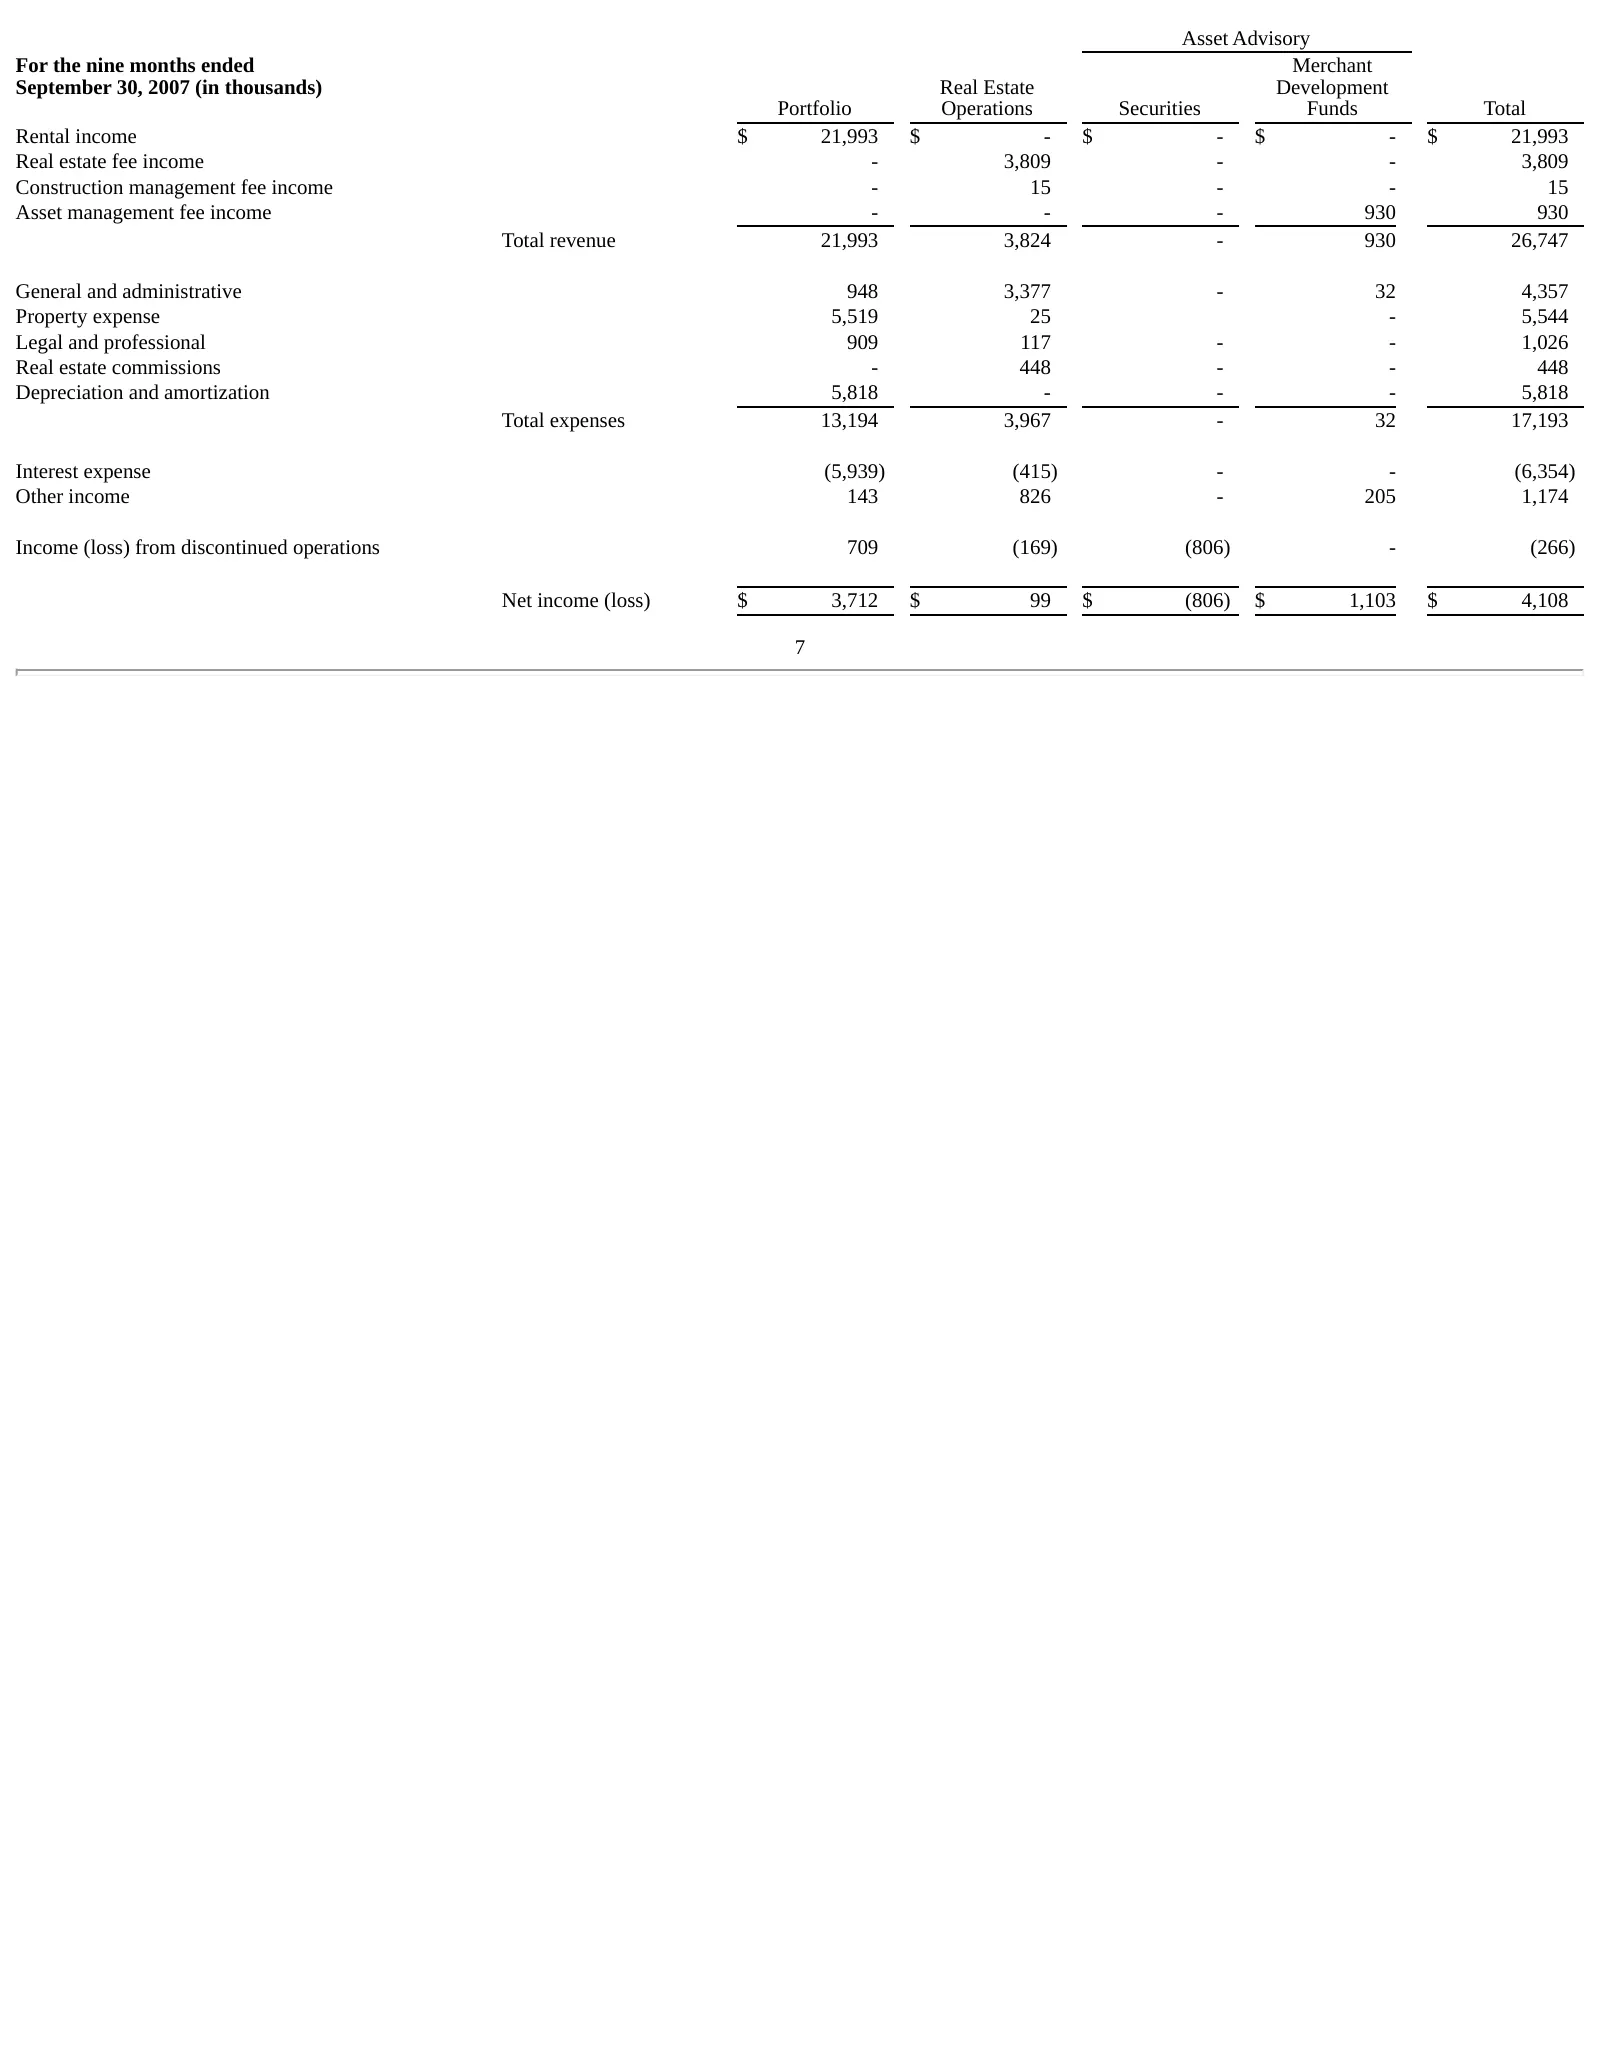
Slide 9: Segmented Statements of Operations: Nine Months Ended September 30, 2007
Asset Advisory For the nine months ended Merchant September 30, 2007 (in thousands) Real Estate Development Portfolio Operations Securities Funds Total Rental income $ 21,993 $ - $ - $ - $ 21,993 Real estate fee income - 3,809 - - 3,809 Construction management fee income - 15 - - 15 Asset management
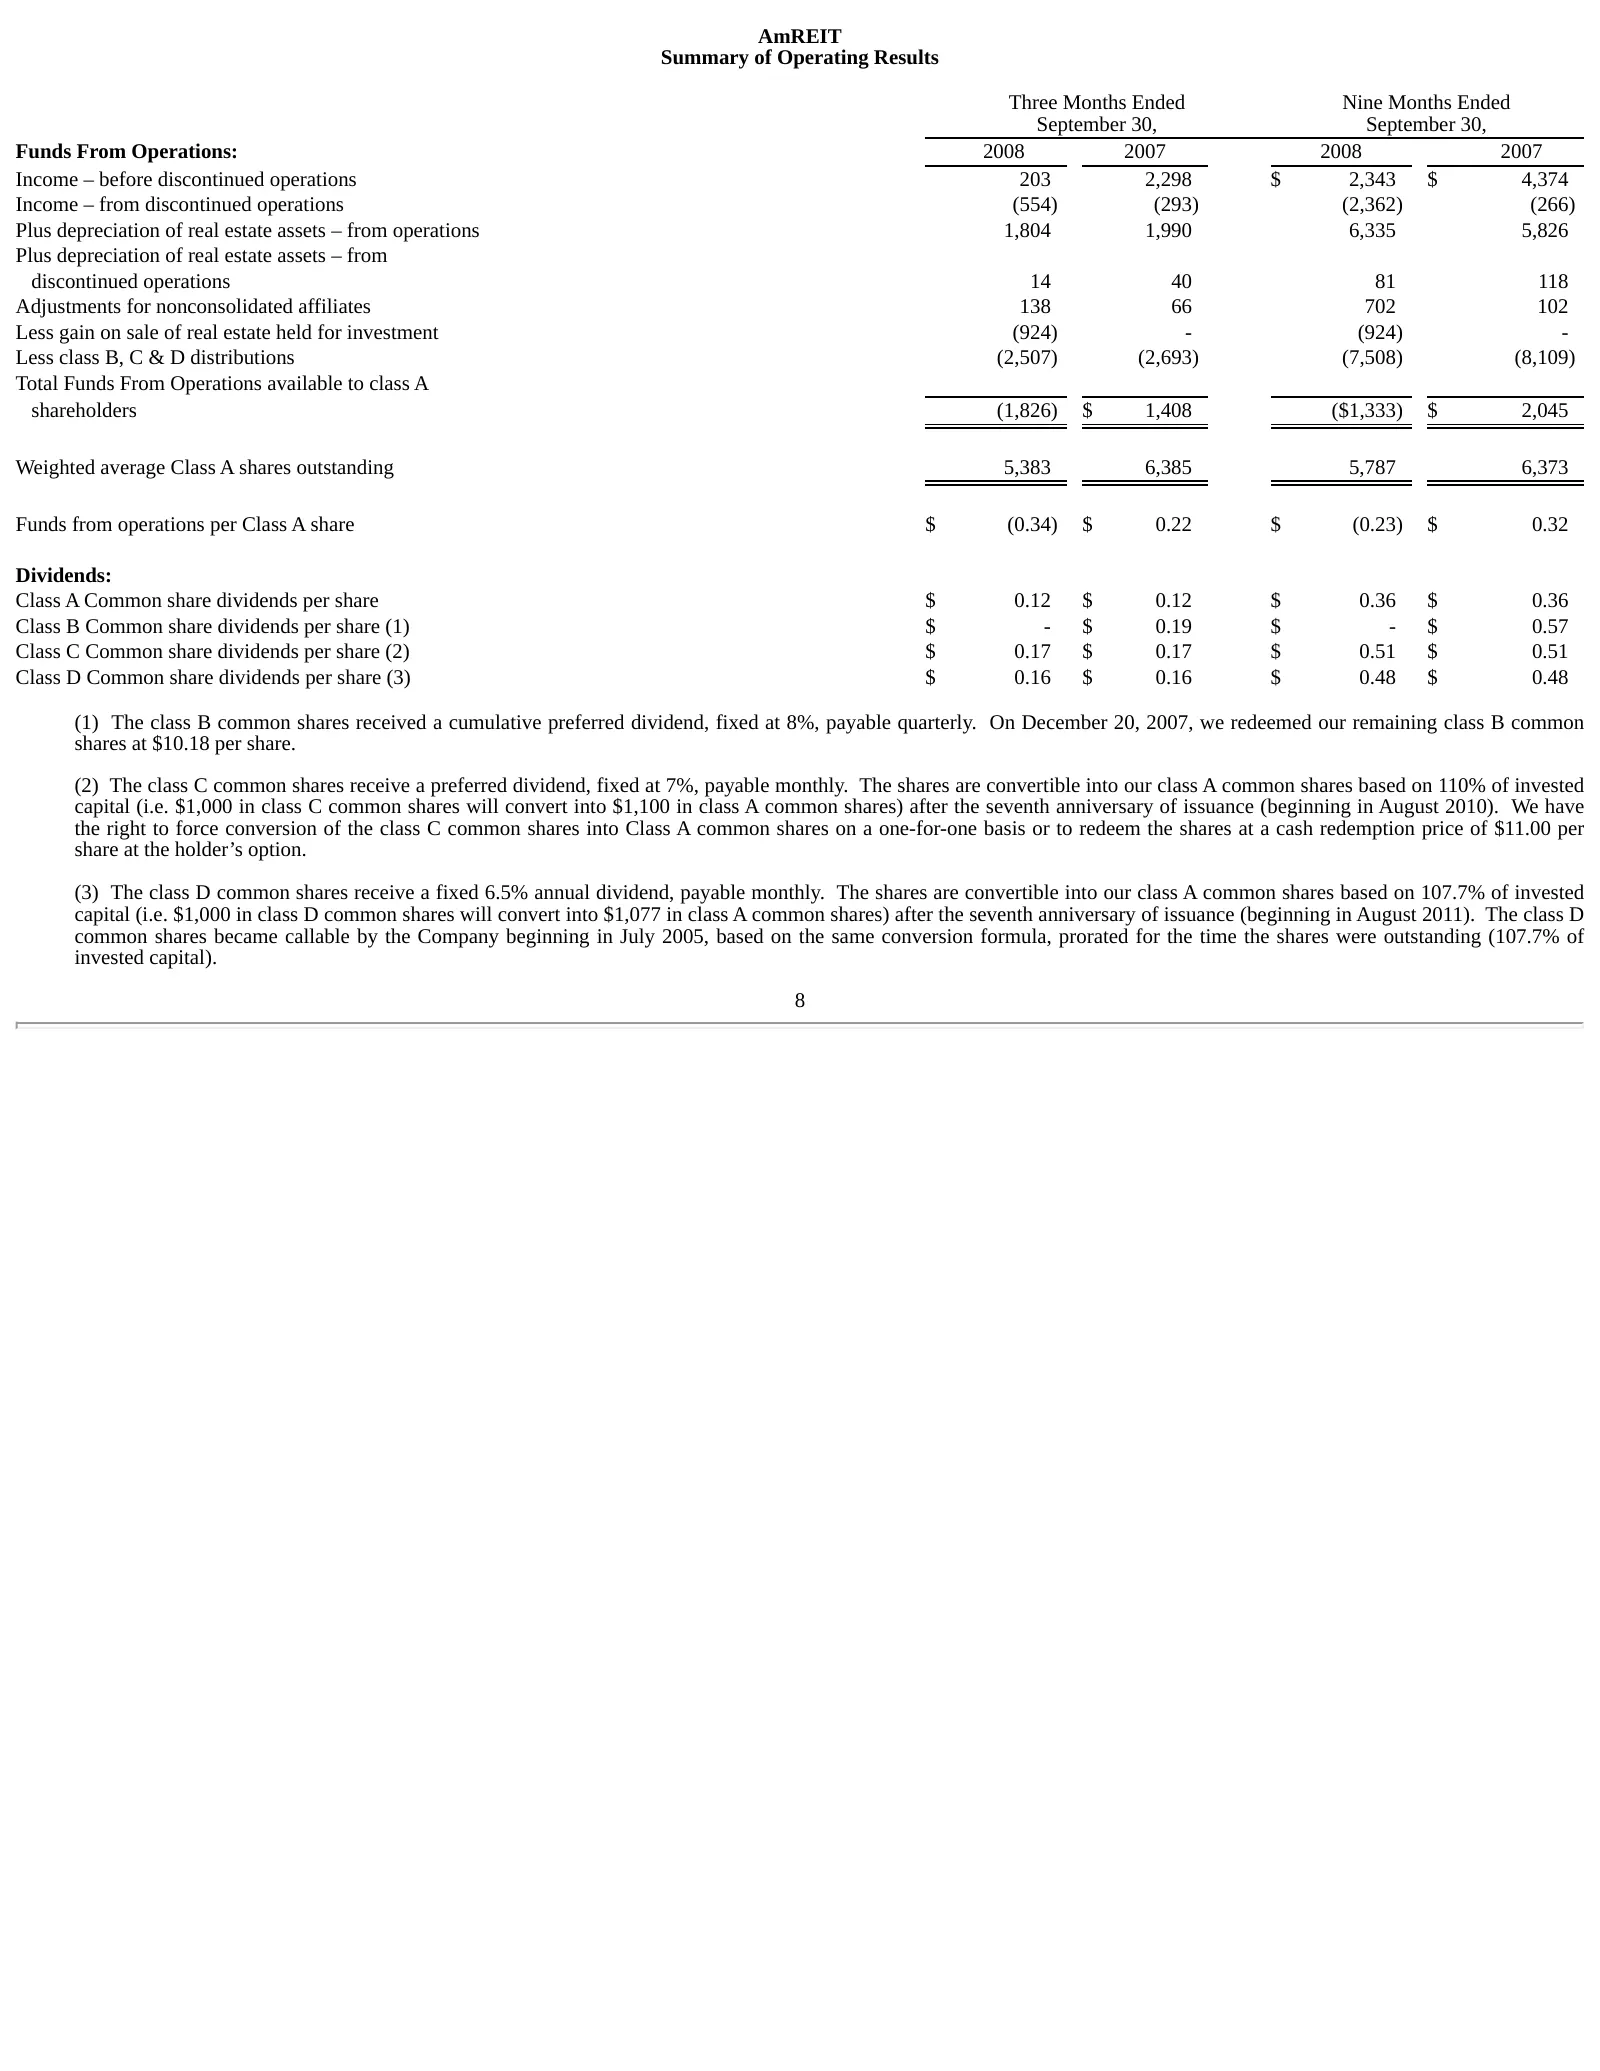
Slide 10: Summary of Operating Results
AmREIT Summary of Operating Results Three Months Ended Nine Months Ended September 30, September 30, Funds From Operations: 2008 2007 2008 2007 Income – before discontinued operations 203 2,298 $ 2,343 $ 4,374 Income – from discontinued operations (554) (293) (2,362) (266) Plus depreciation of real
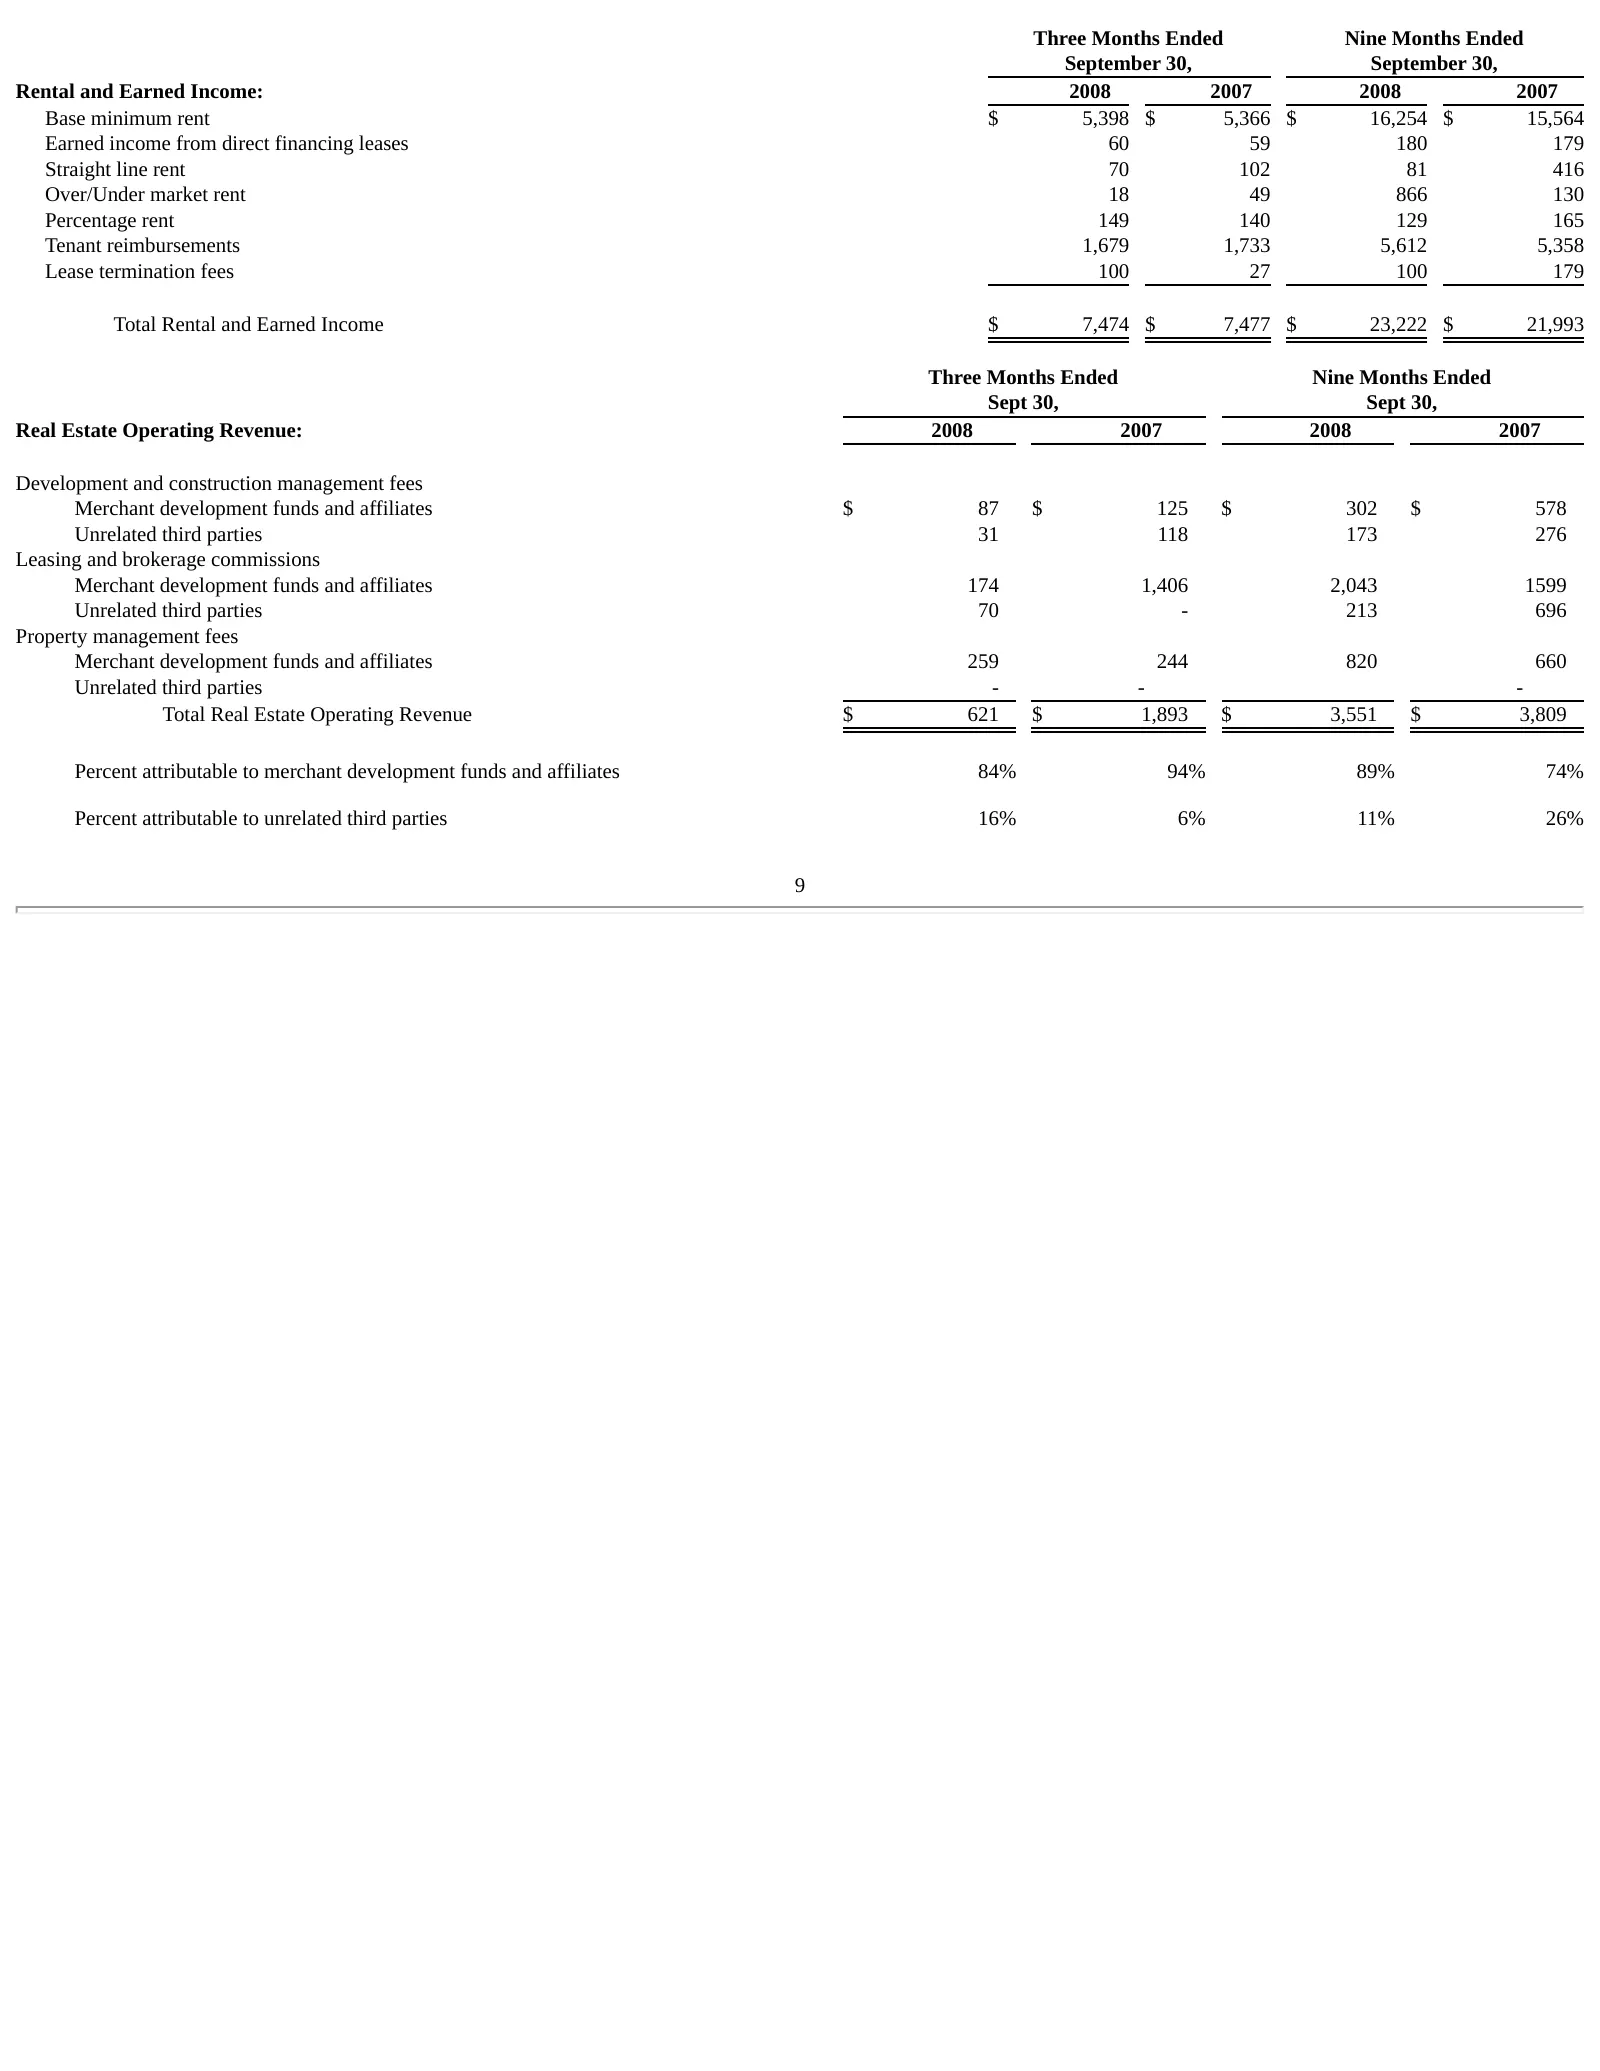
Slide 11: Rental and Earned Income
Three Months Ended Nine Months Ended September 30, September 30, Rental and Earned Income: 2008 2007 2008 2007 Base minimum rent $ 5,398 $ 5,366 $ 16,254 $ 15,564 Earned income from direct financing leases 60 59 180 179 Straight line rent 70 102 81 416 Over/Under market rent 18 49 866 130 Percentage
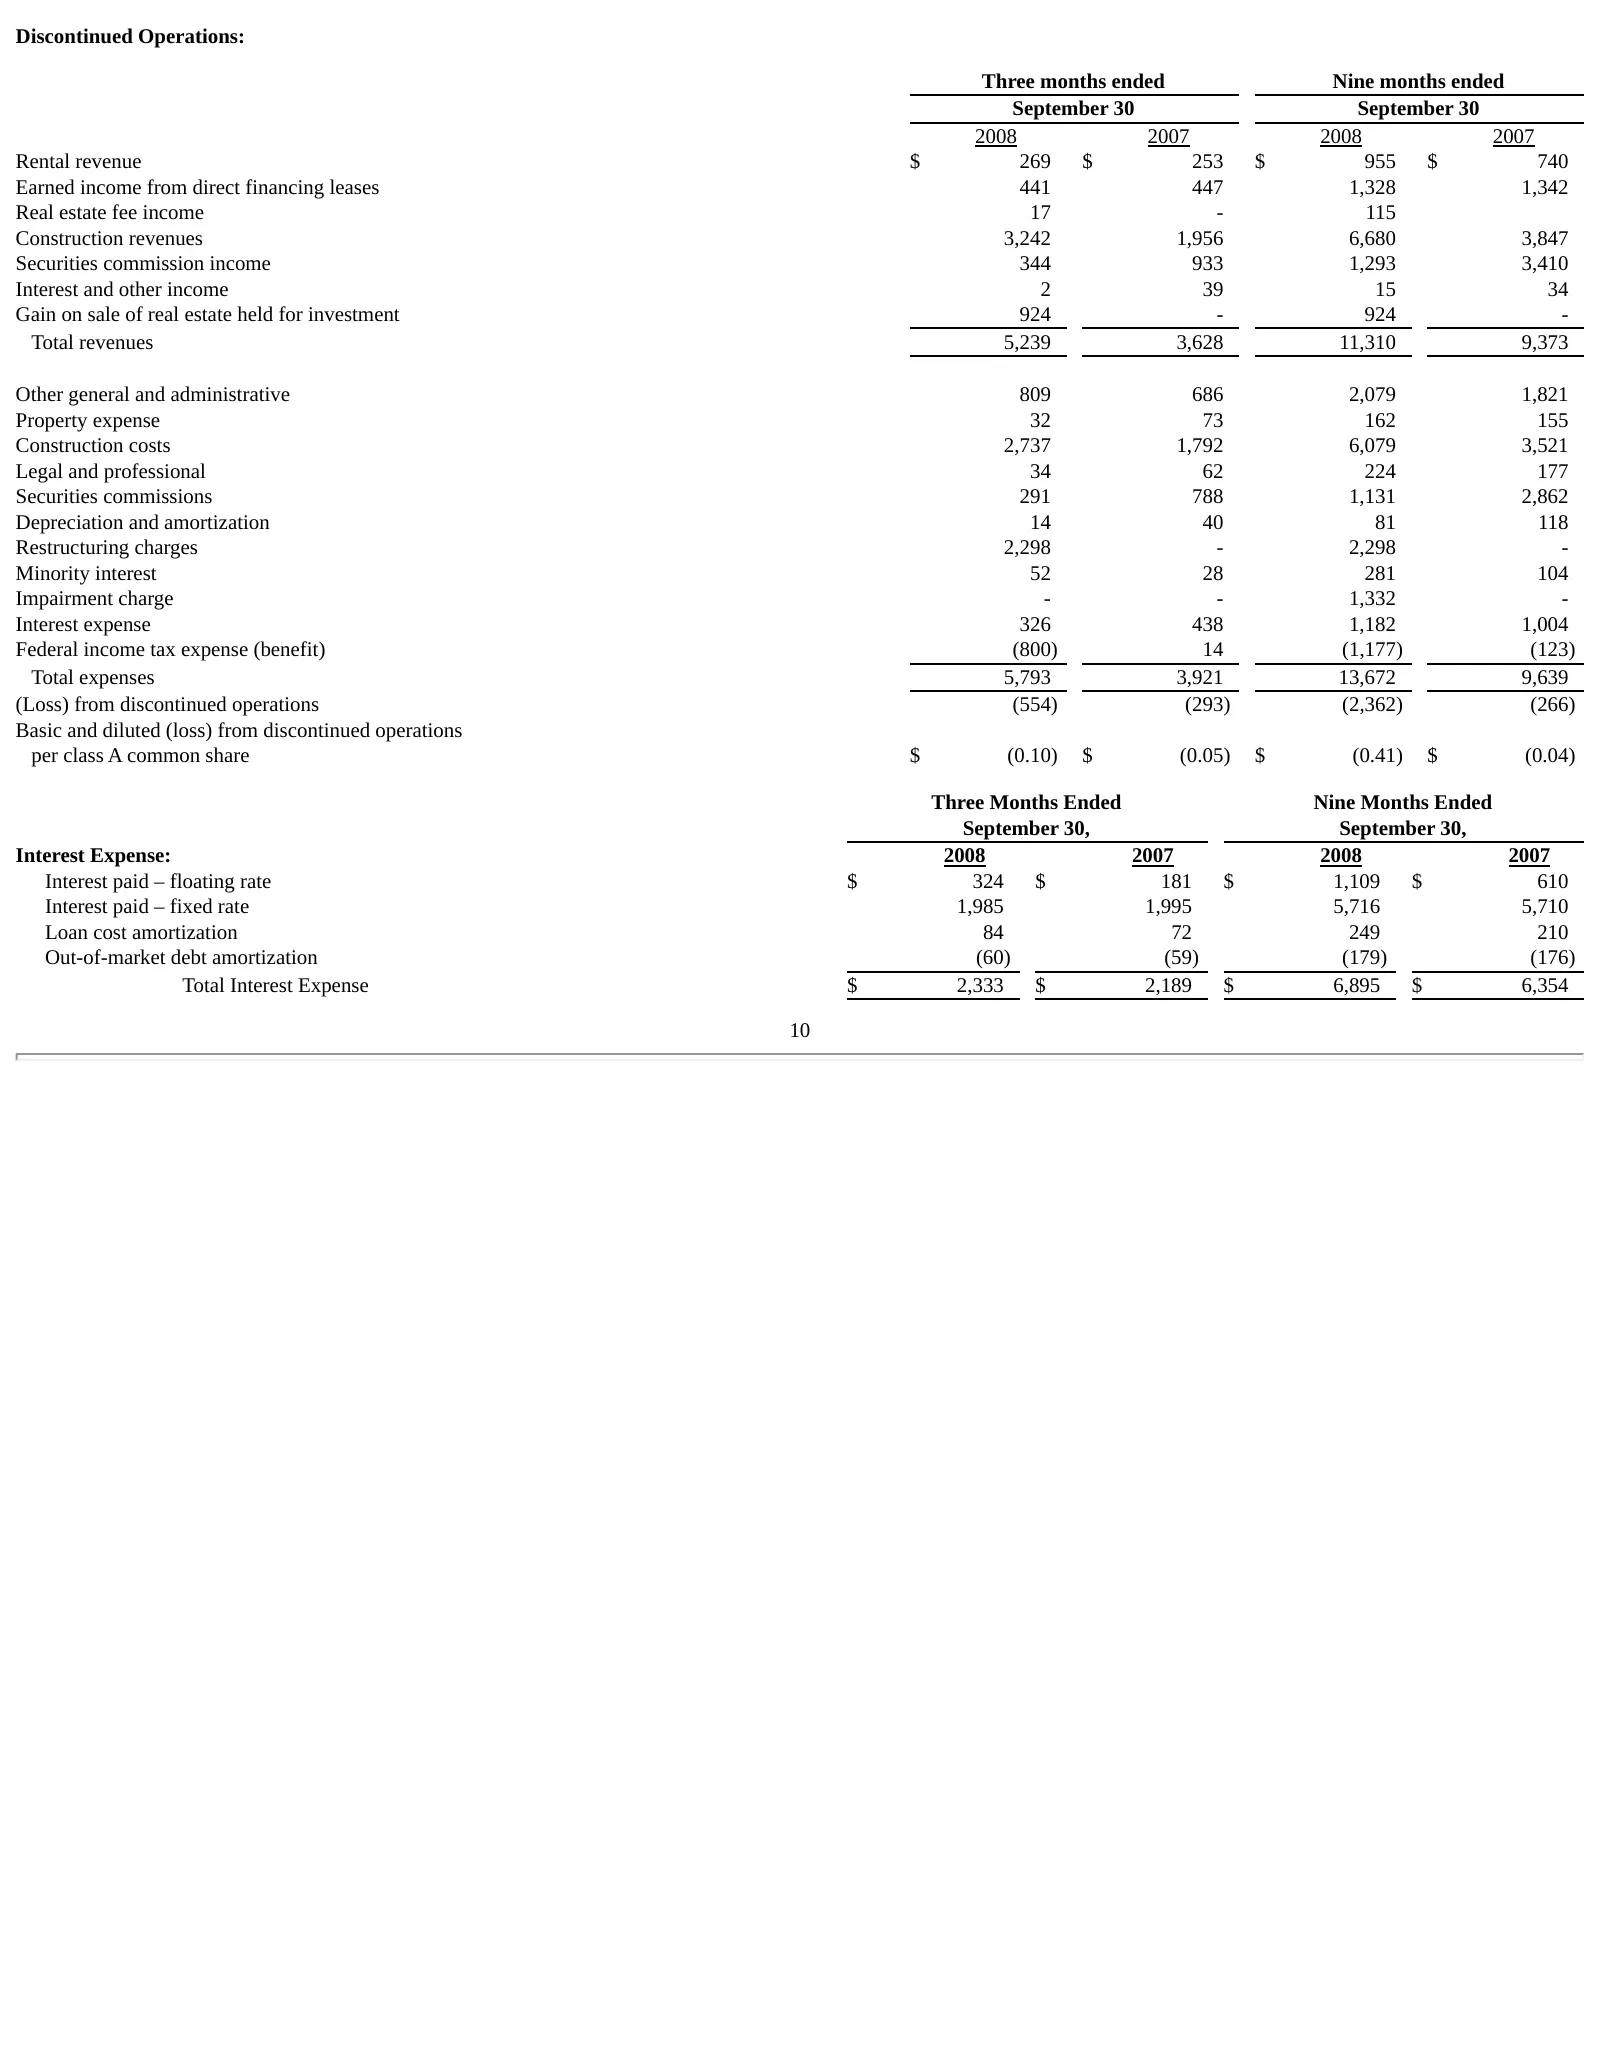
Slide 12: Discontinued Operations
Discontinued Operations: Three months ended Nine months ended September 30 September 30 2008 2007 2008 2007 Rental revenue $ 269 $ 253 $ 955 $ 740 Earned income from direct financing leases 441 447 1,328 1,342 Real estate fee income 17 - 115 Construction revenues 3,242 1,956 6,680 3,847 Securities c
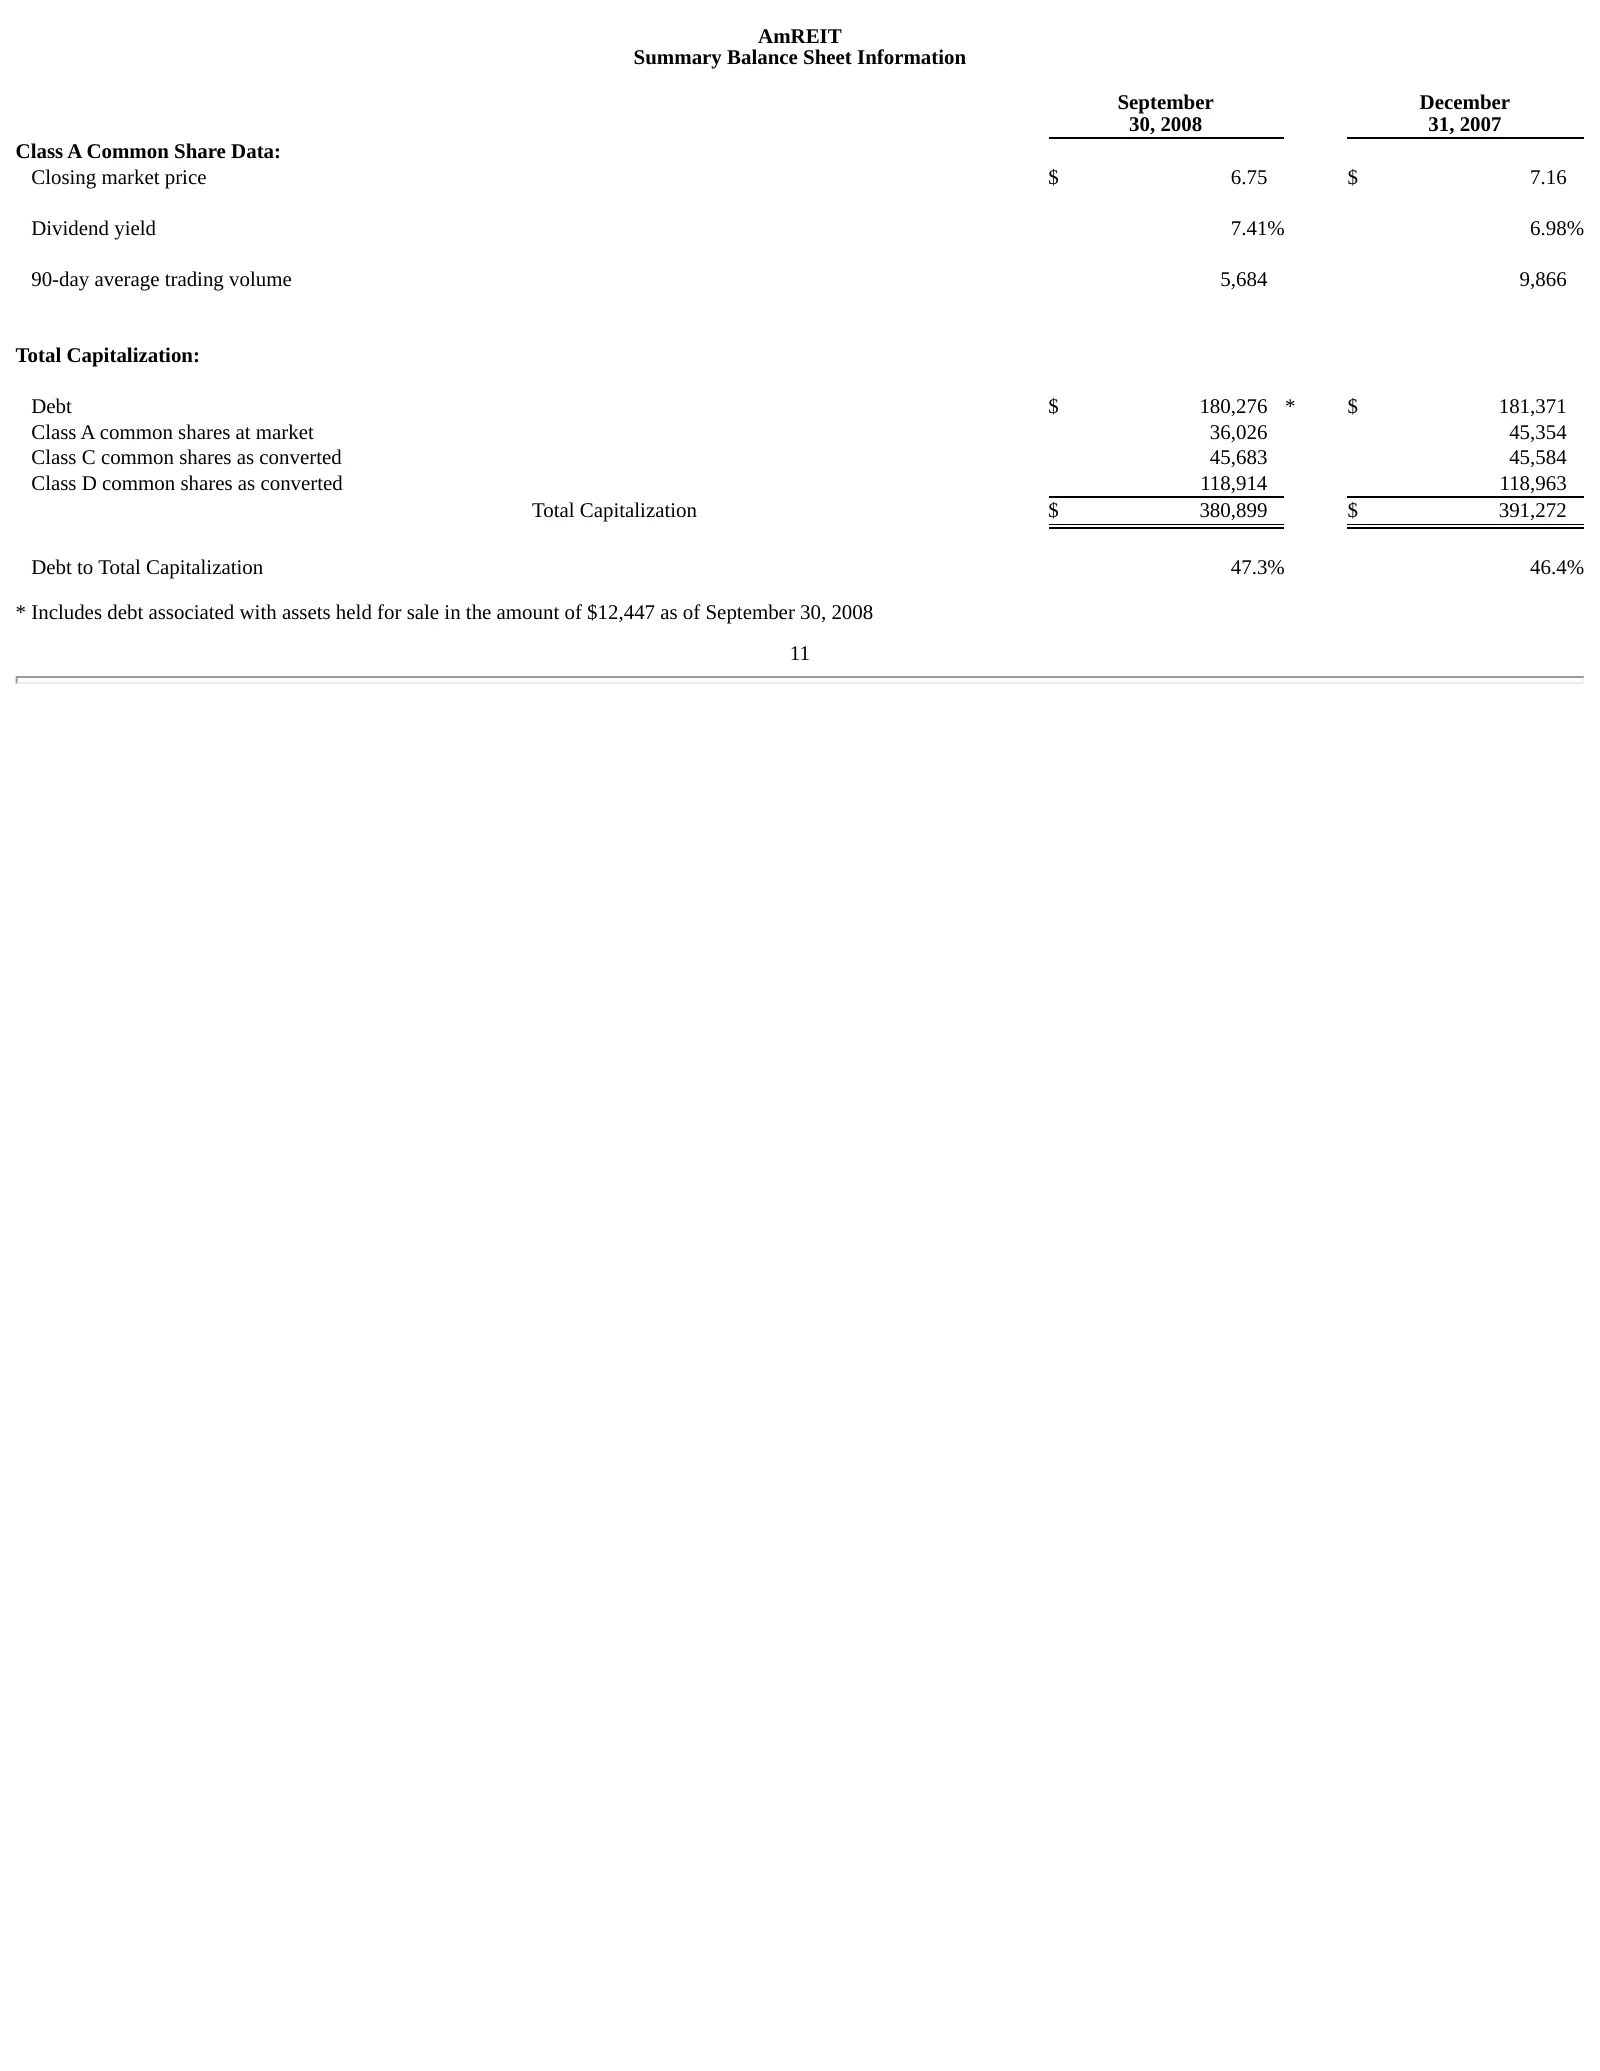
Slide 13: Summary Balance Sheet Information
AmREIT Summary Balance Sheet Information September December 30, 2008 31, 2007 Class A Common Share Data: Closing market price $ 6.75 $ 7.16 Dividend yield 7.41% 6.98% 90-day average trading volume 5,684 9,866 Total Capitalization: Debt $ 180,276 * $ 181,371 Class A common shares at market 36,026 45,
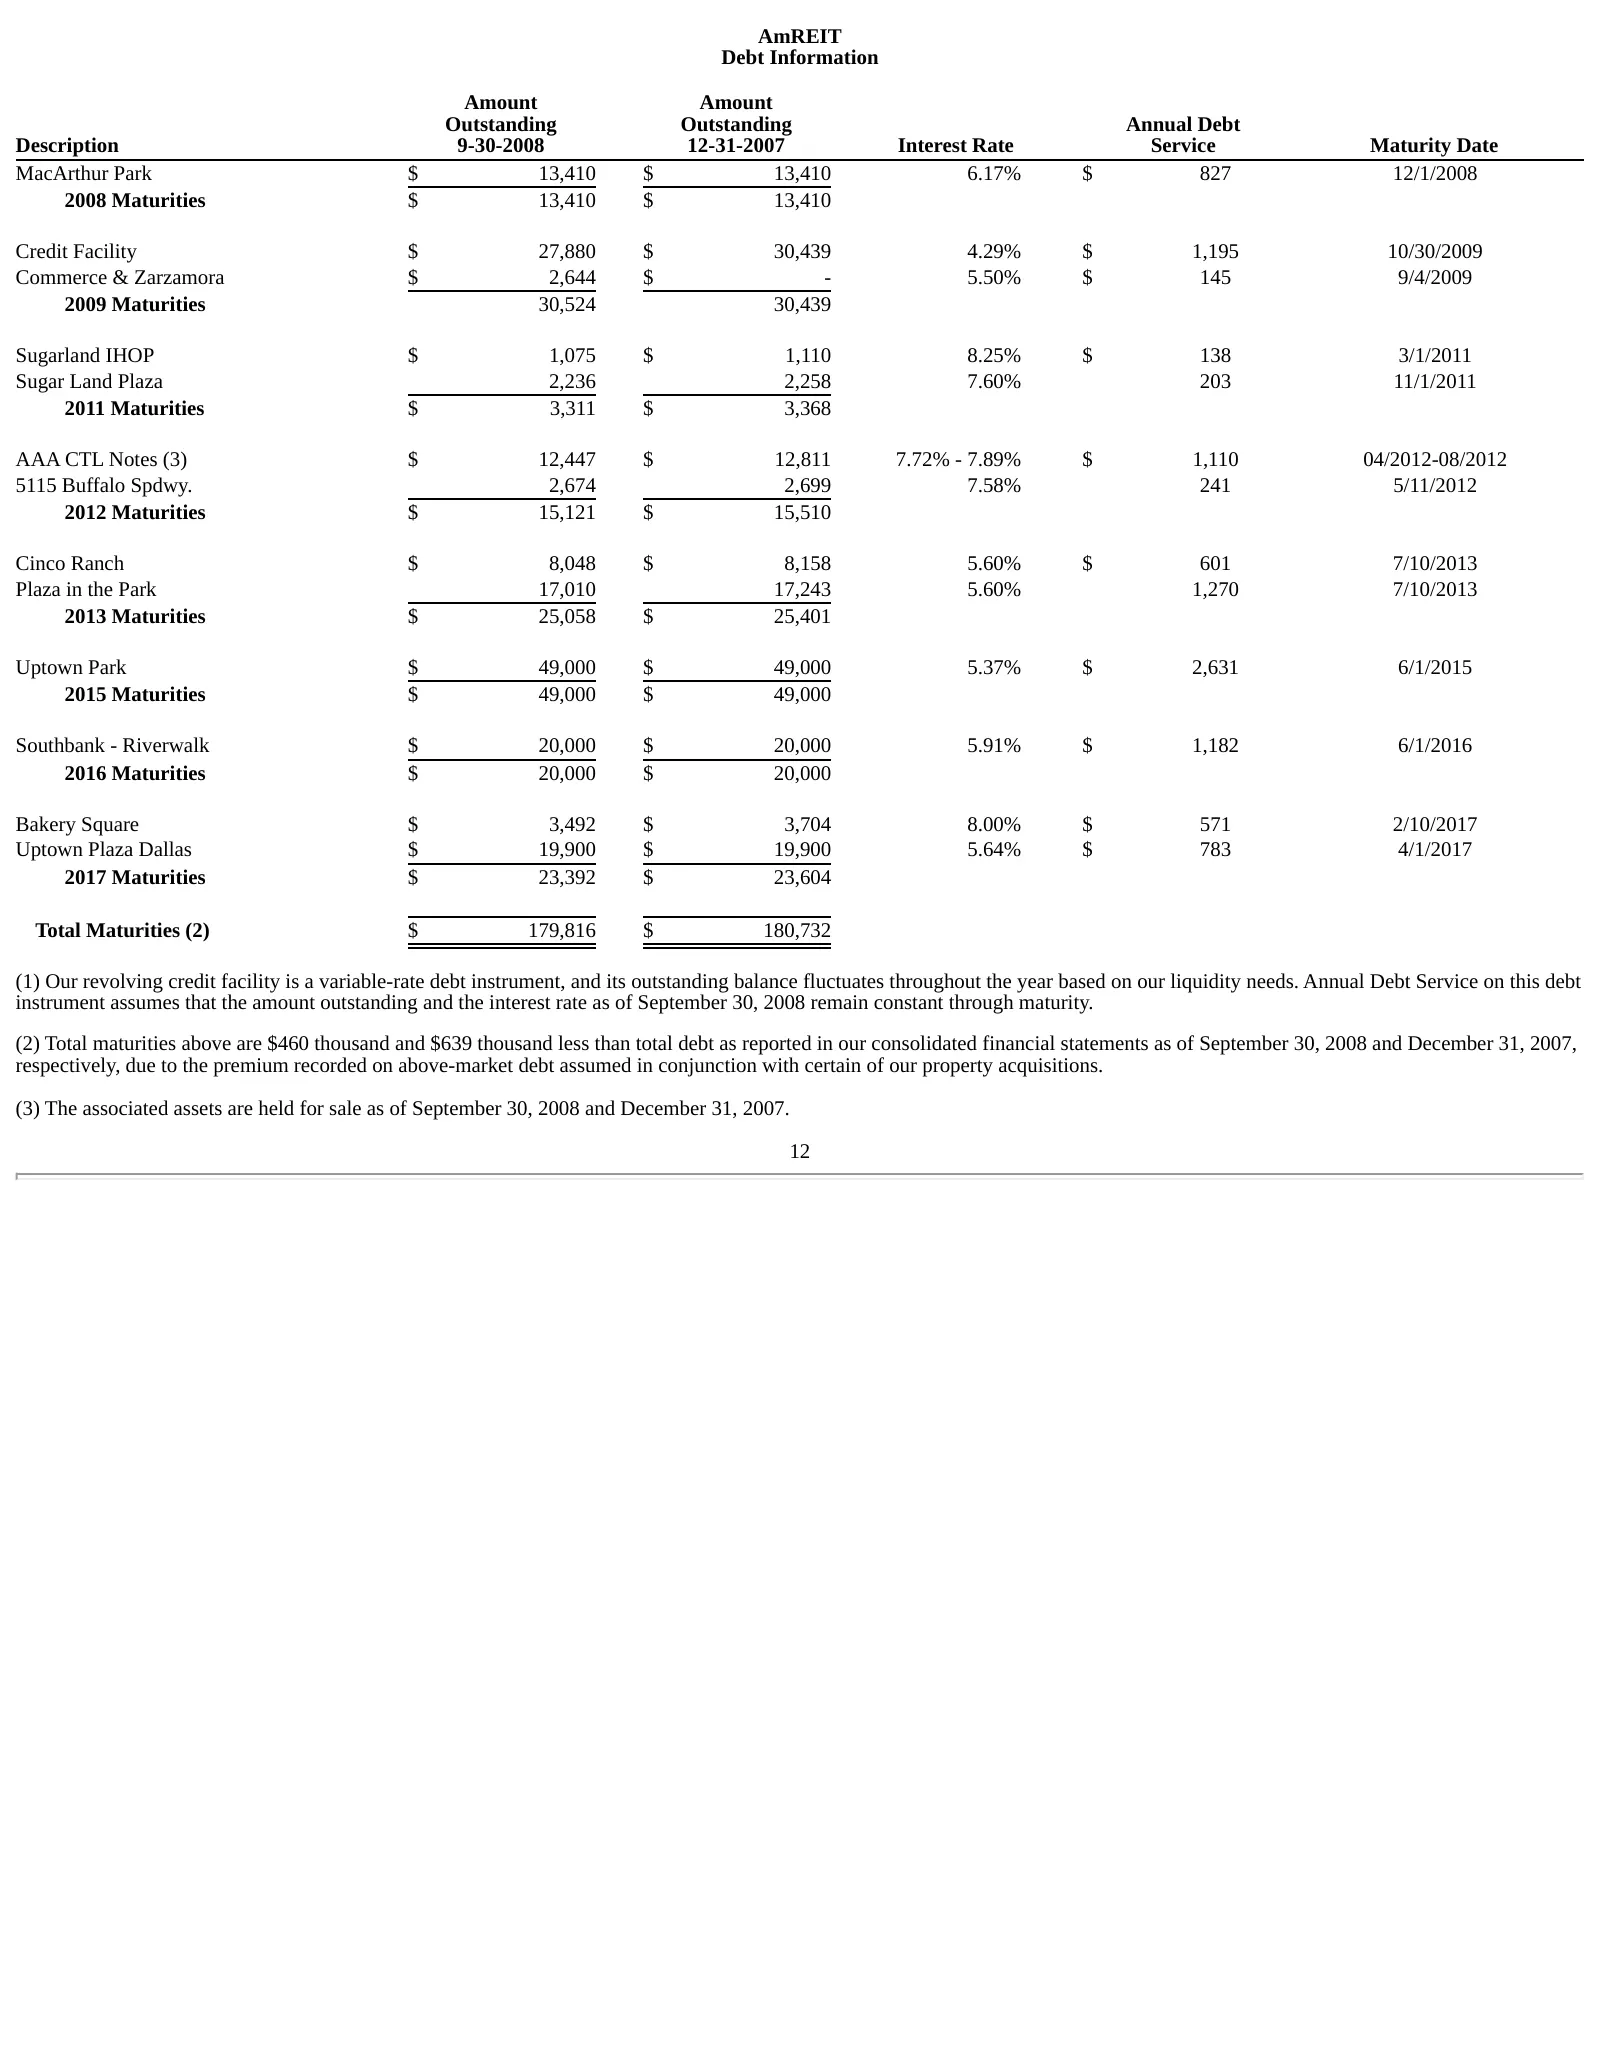
Slide 14: Debt Information
AmREIT Debt Information Amount Amount Outstanding Outstanding Annual Debt Description 9-30-2008 12-31-2007 Interest Rate Service Maturity Date MacArthur Park $ 13,410 $ 13,410 6.17% $ 827 12/1/2008 2008 Maturities $ 13,410 $ 13,410 Credit Facility $ 27,880 $ 30,439 4.29% $ 1,195 10/30/2009 Commerce
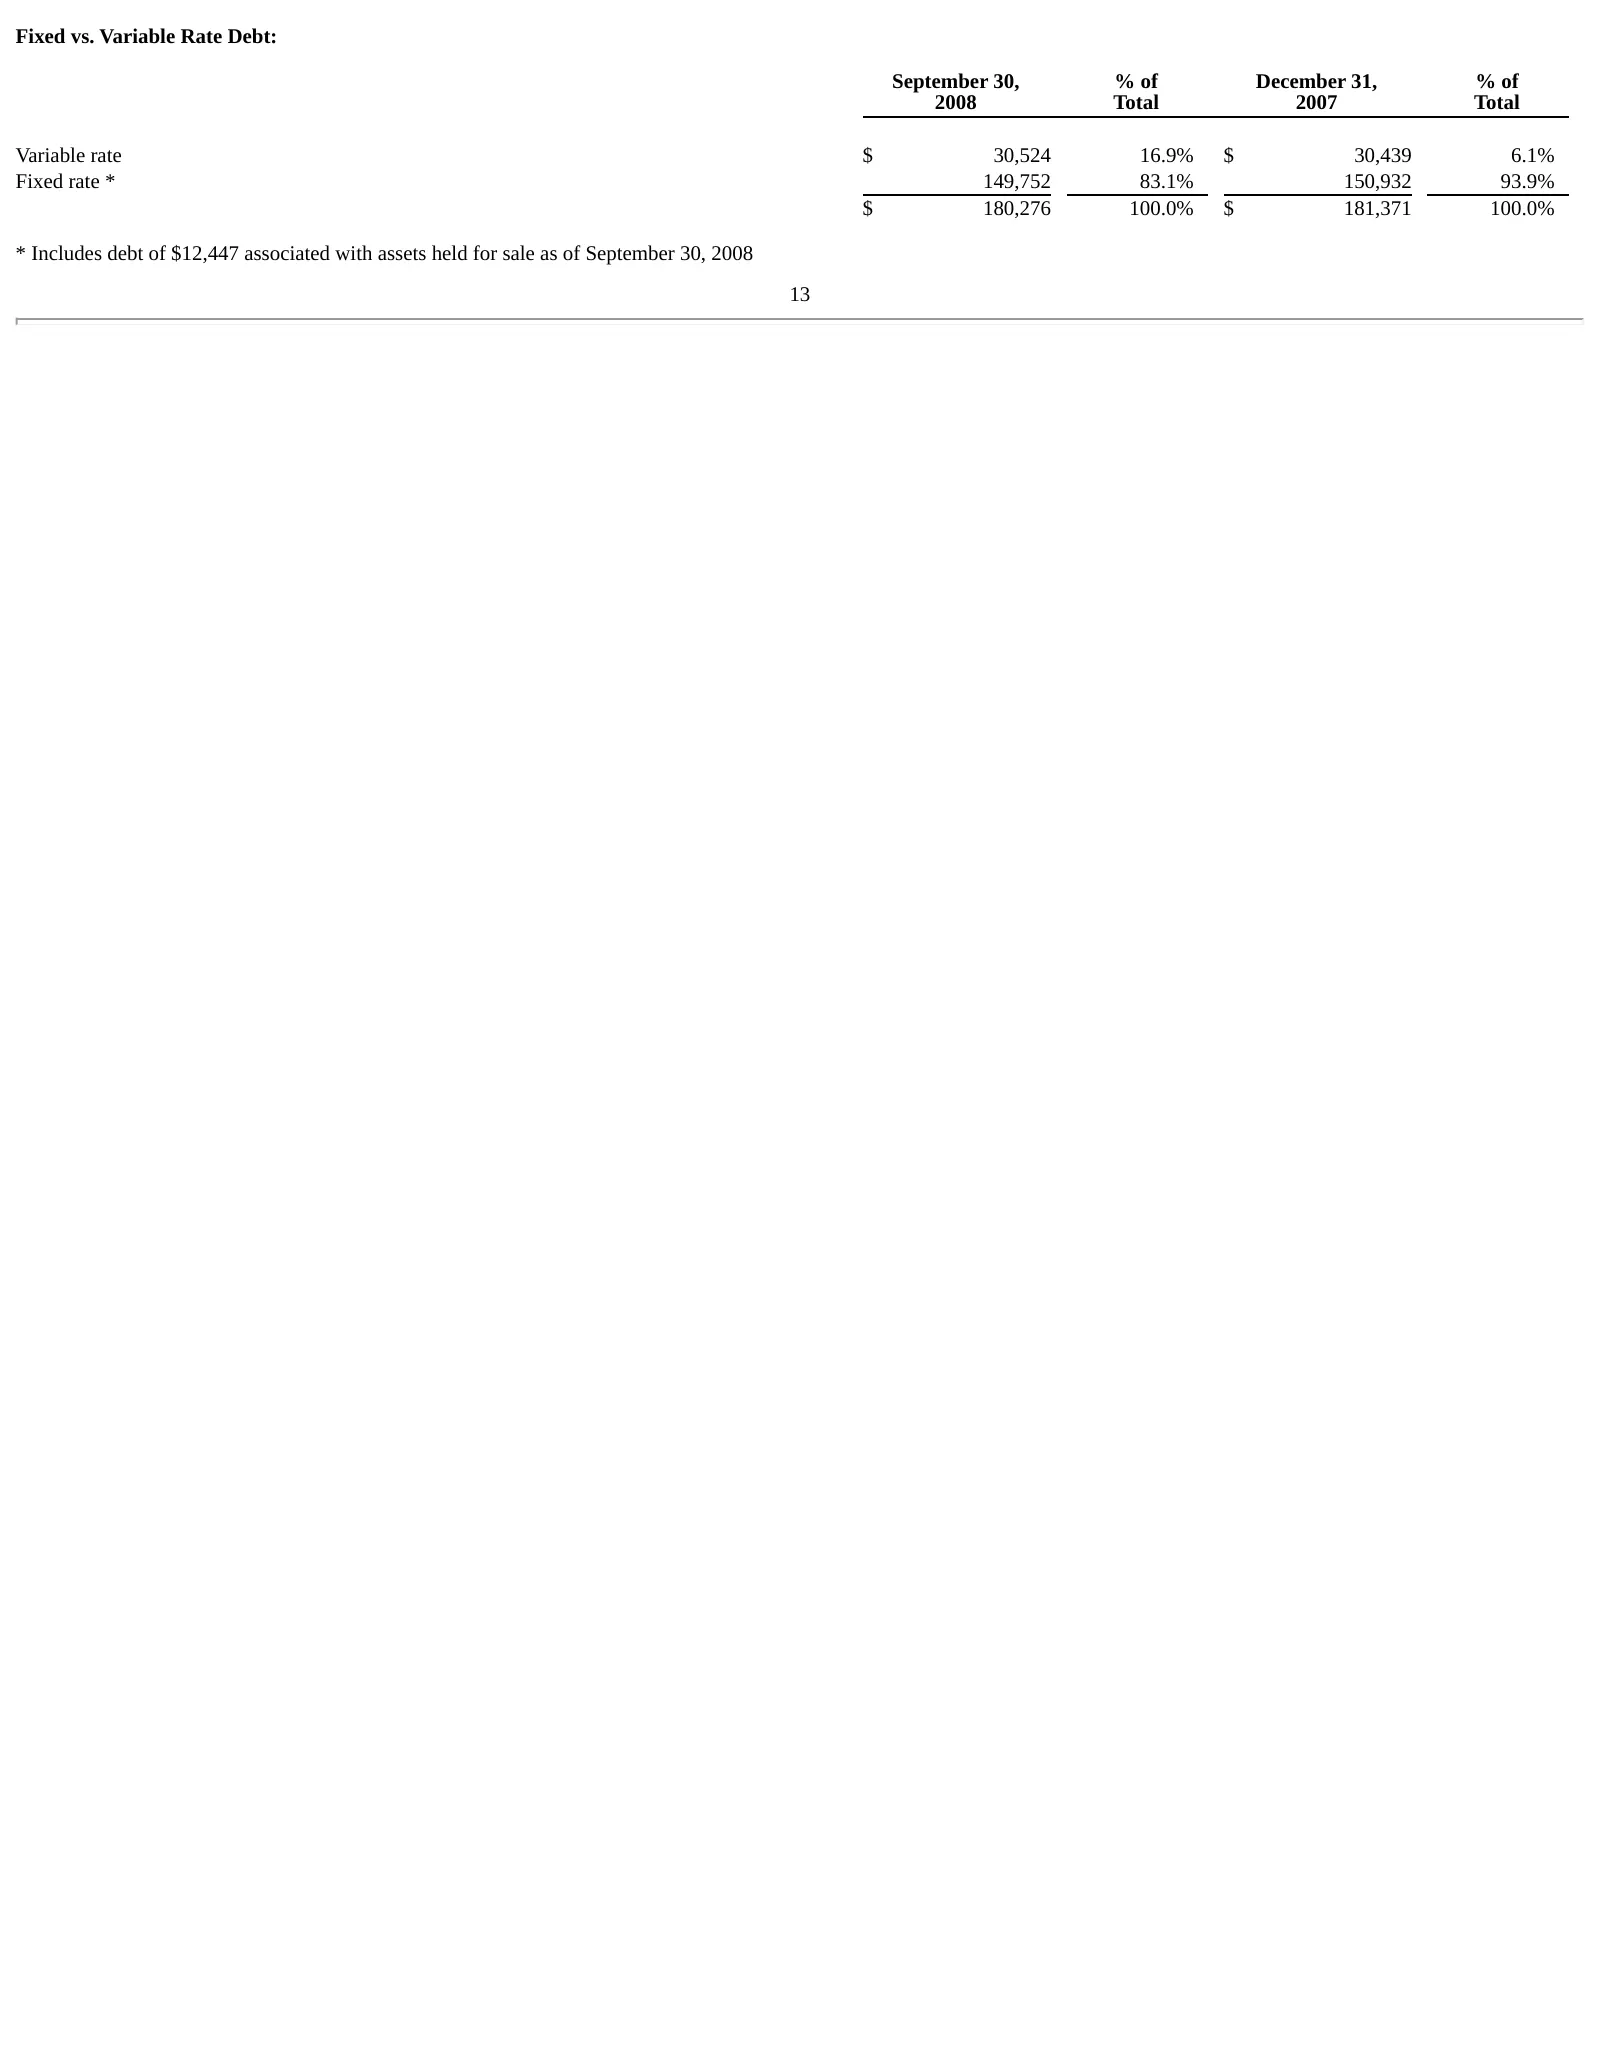
Slide 15: Fixed vs. Variable Rate Debt
Fixed vs. Variable Rate Debt: September 30, % of December 31, % of 2008 Total 2007 Total Variable rate $ 30,524 16.9% $ 30,439 6.1% Fixed rate * 149,752 83.1% 150,932 93.9% $ 180,276 100.0% $ 181,371 100.0% * Includes debt of $12,447 associated with assets held for sale as of September 30, 2008 13
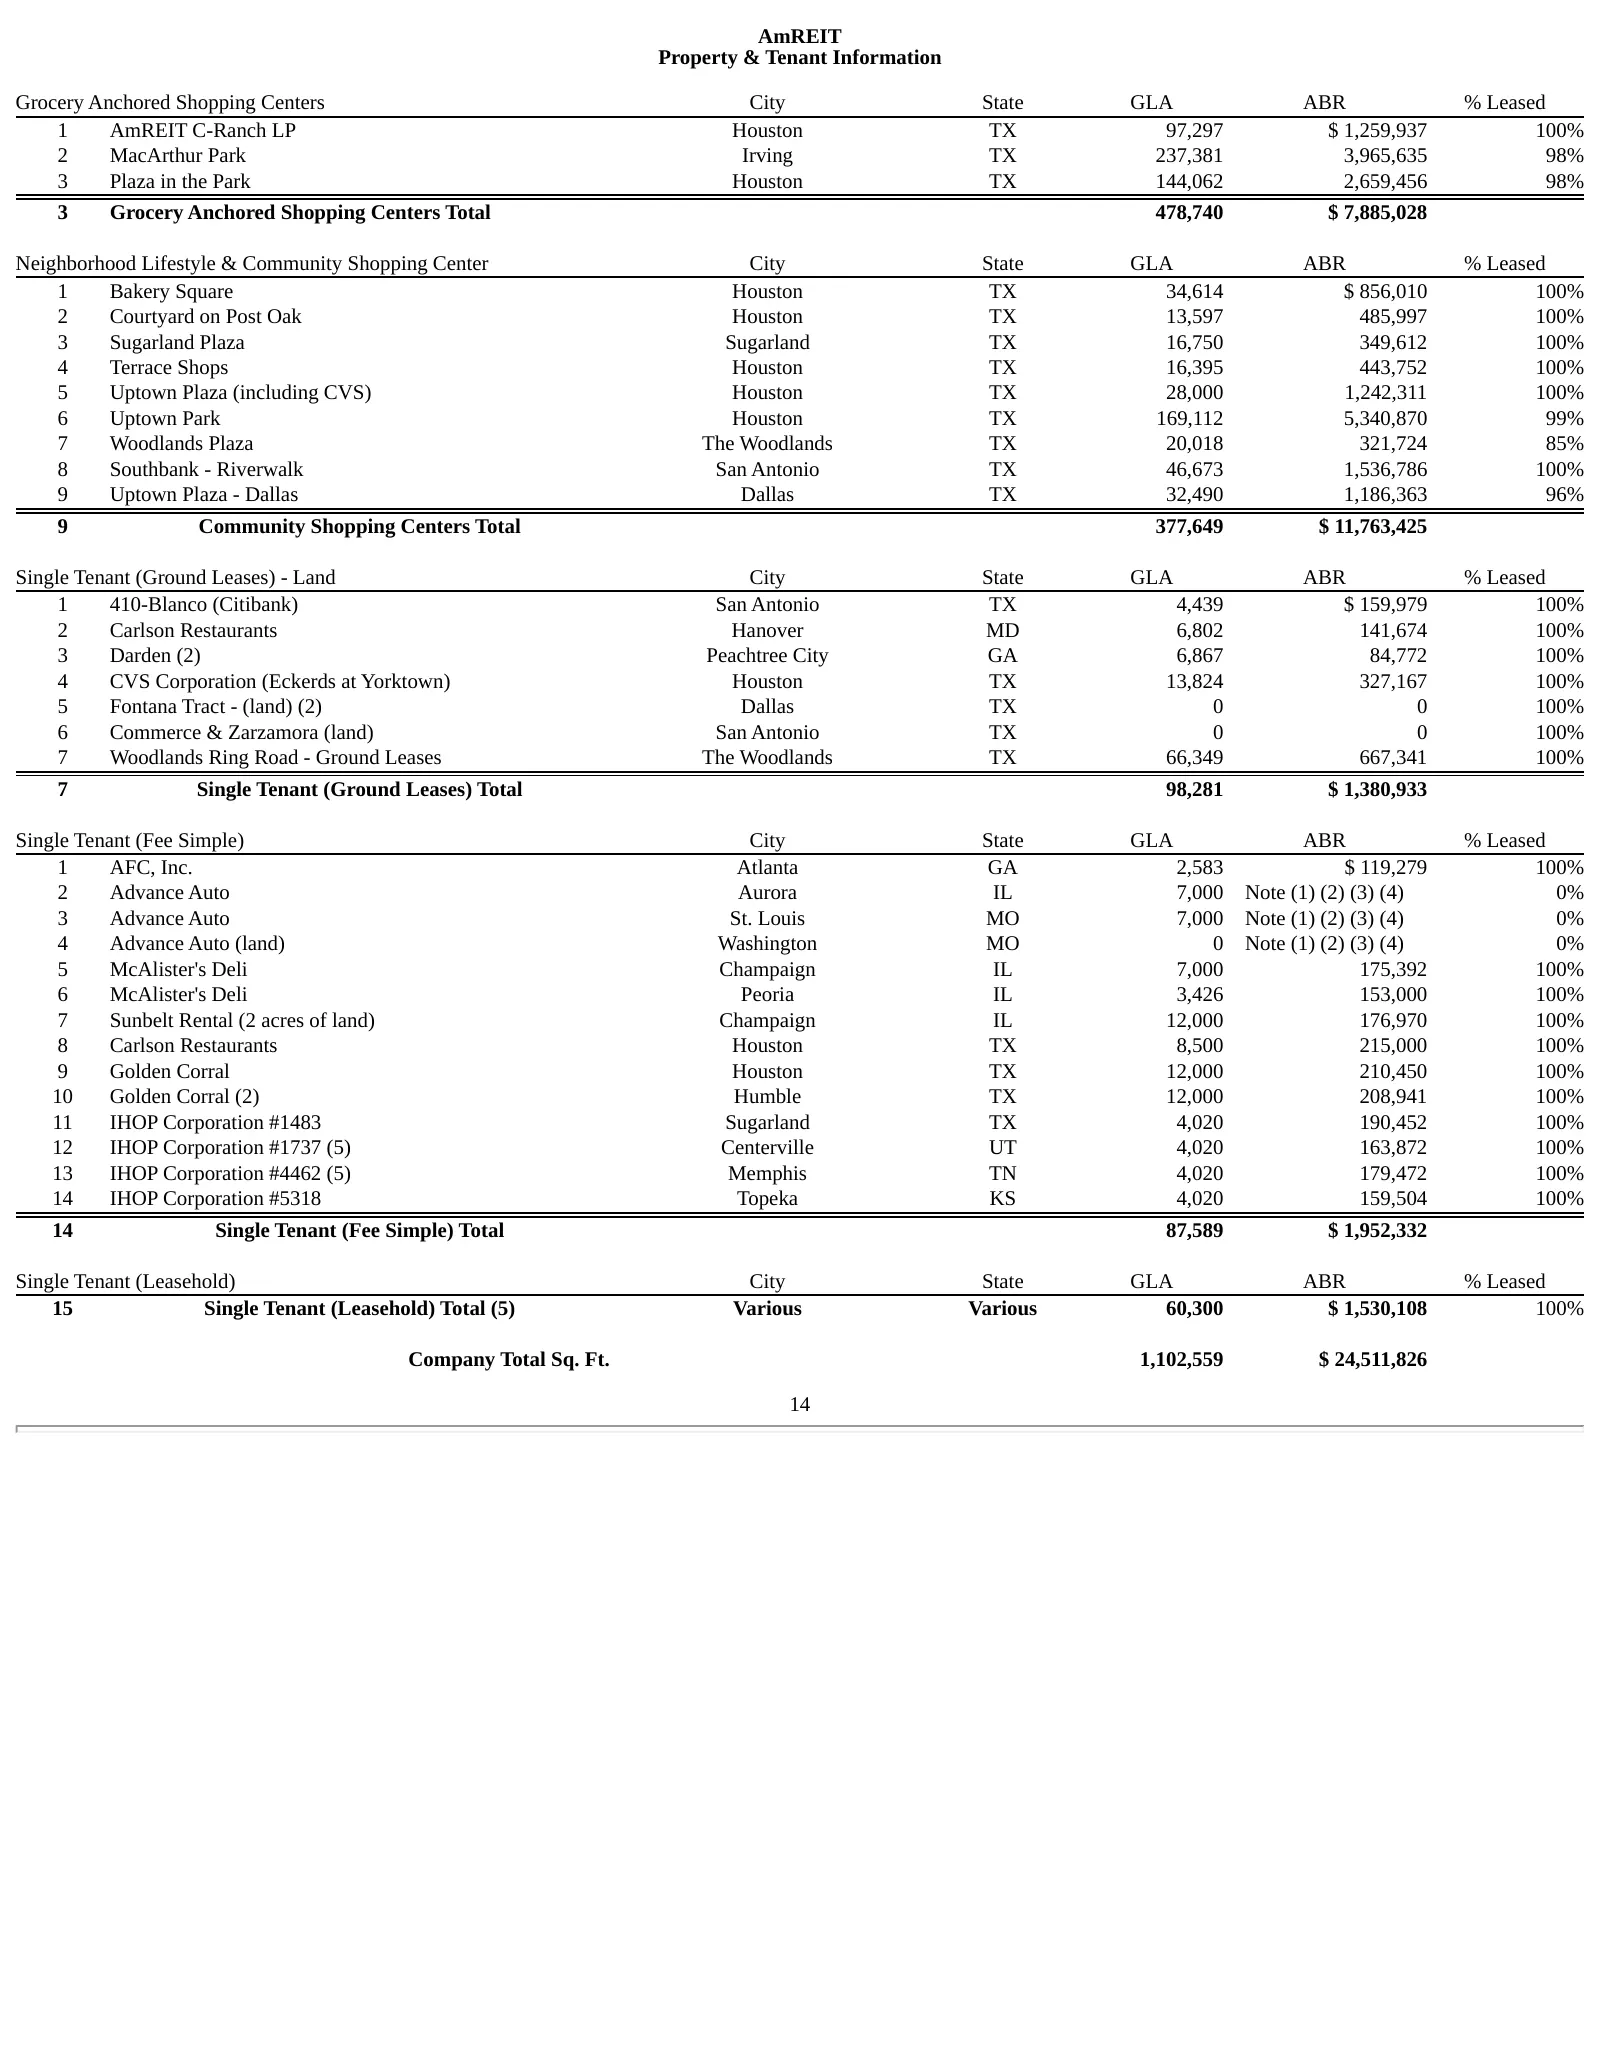
Slide 16: Property & Tenant Information
AmREIT Property & Tenant Information Grocery Anchored Shopping Centers City State GLA ABR % Leased 1 AmREIT C-Ranch LP Houston TX 97,297 $ 1,259,937 100% 2 MacArthur Park Irving TX 237,381 3,965,635 98% 3 Plaza in the Park Houston TX 144,062 2,659,456 98% 3 Grocery Anchored Shopping Centers Total 47
Slide 17: Property Table Footnotes
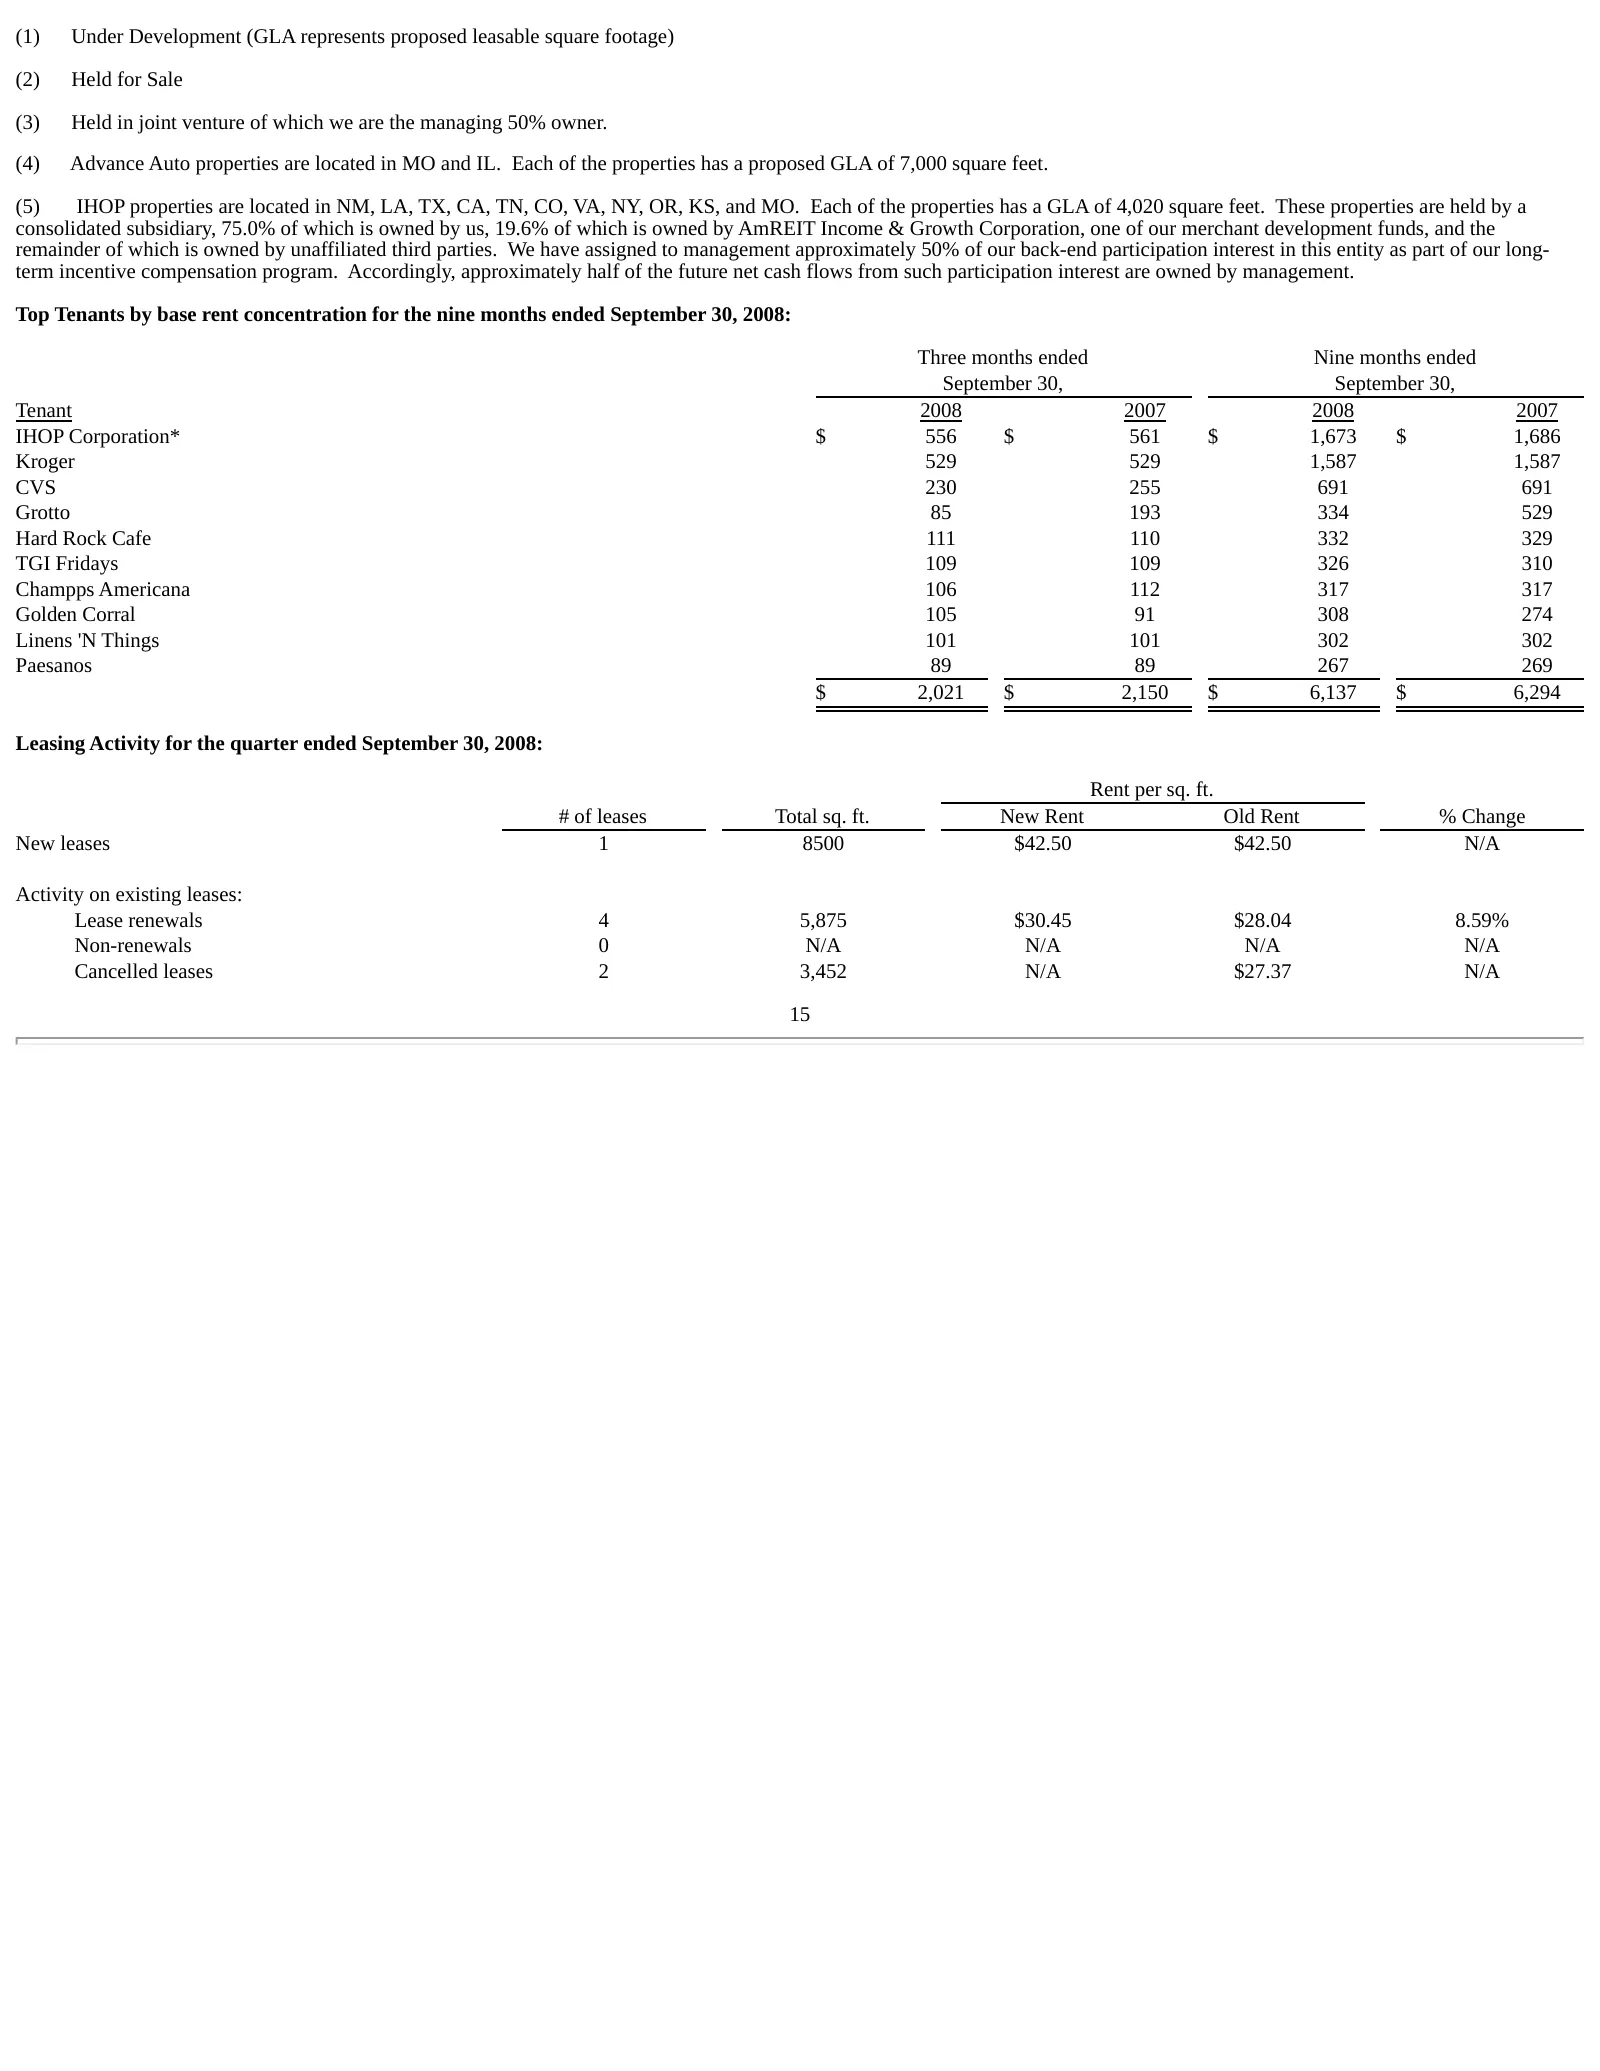
(1) Under Development (GLA represents proposed leasable square footage) (2) Held for Sale (3) Held in joint venture of which we are the managing 50% owner. (4) Advance Auto properties are located in MO and IL. Each of the properties has a proposed GLA of 7,000 square feet. (5) IHOP properties are lo
Slide 18: Lease Expirations by Year
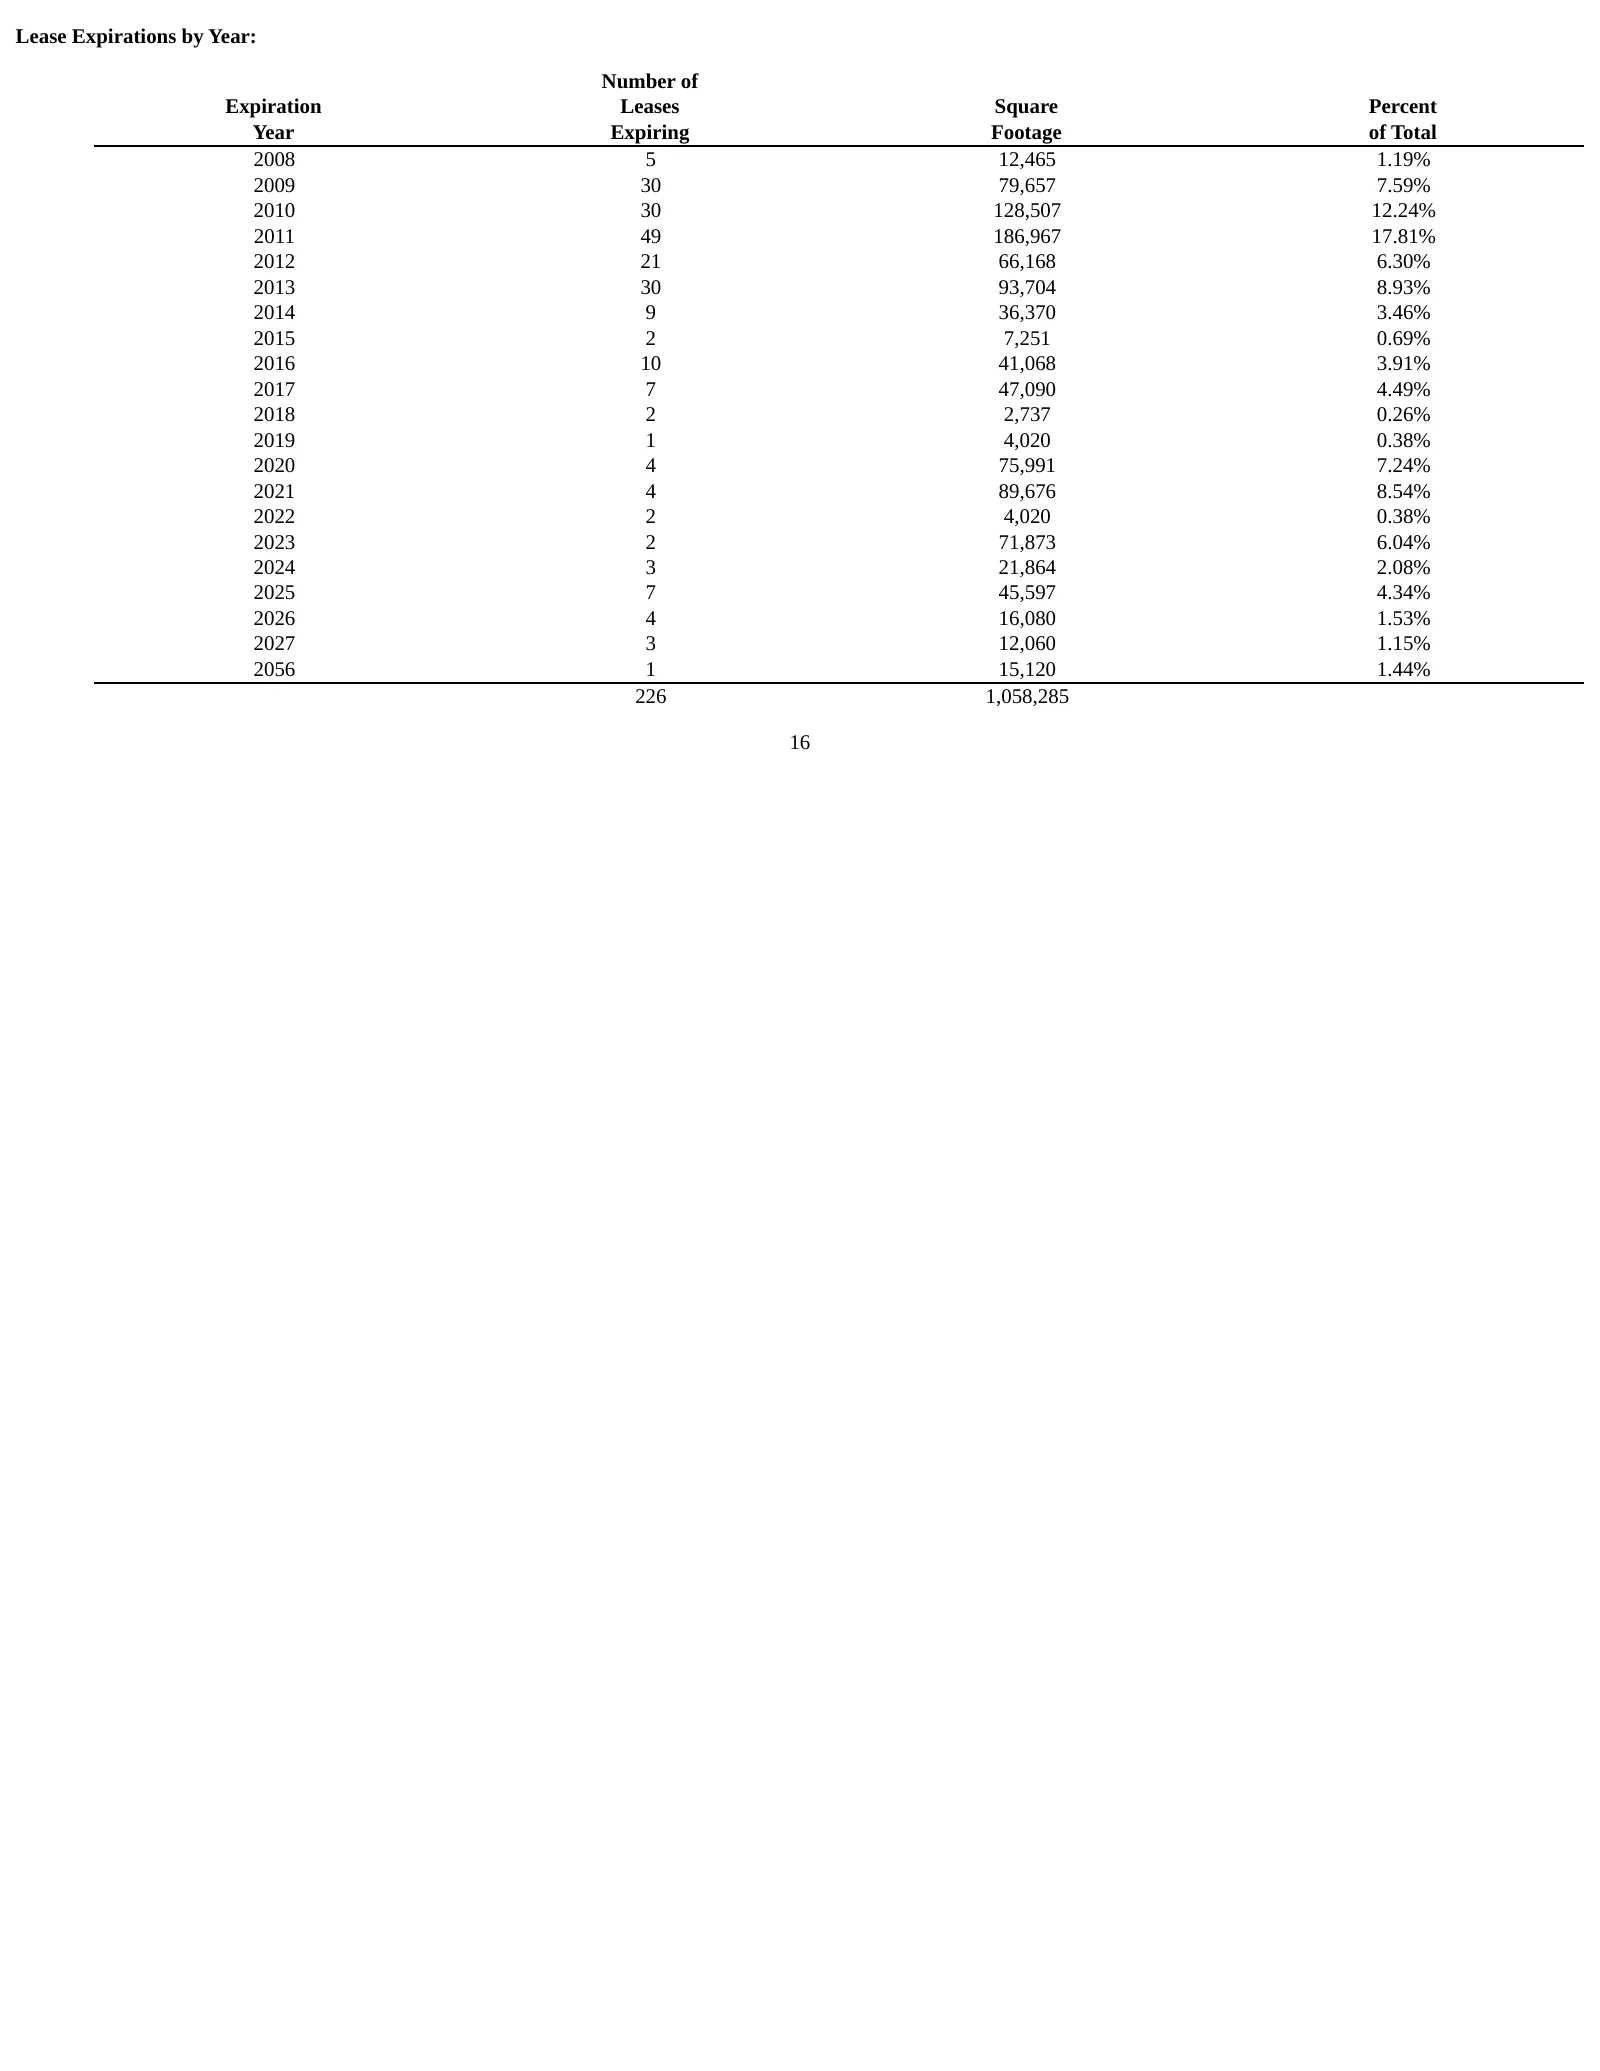
Lease Expirations by Year: Number of Expiration Leases Square Percent Year Expiring Footage of Total 2008 5 12,465 1.19% 2009 30 79,657 7.59% 2010 30 128,507 12.24% 2011 49 186,967 17.81% 2012 21 66,168 6.30% 2013 30 93,704 8.93% 2014 9 36,370 3.46% 2015 2 7,251 0.69% 2016 10 41,068 3.91% 2017 7 47,
Source: SEC EDGAR · 8-K filed Nov 5, 2008
More decks from AmREIT Inc
 Merger or Acquisition (June 2009)26 slides · Jun 4, 2009
 Investor Presentation (December 2008)24 slides · Dec 2, 2008
 Q3 2008 Earnings Presentation17 slides · Nov 5, 2008
 Q2 2006 Earnings Presentation15 slides · Aug 8, 2006
 Q1 2006 Earnings Presentation16 slides · May 4, 2006
 Q3 2005 Earnings Presentation9 slides · Oct 27, 2005