AmREIT — Q3 2008 Earnings Presentation
17 slides from AmREIT's earnings presentation, Nov 5, 2008
Slide 1: Earnings Call – November, 2008 AmREIT Portfolio Presentation
1 Earnings Call – November, 2008 AmREIT Portfolio Presentation
Slide 2: Investing in Three of the Top Seven U.S. Growth Markets
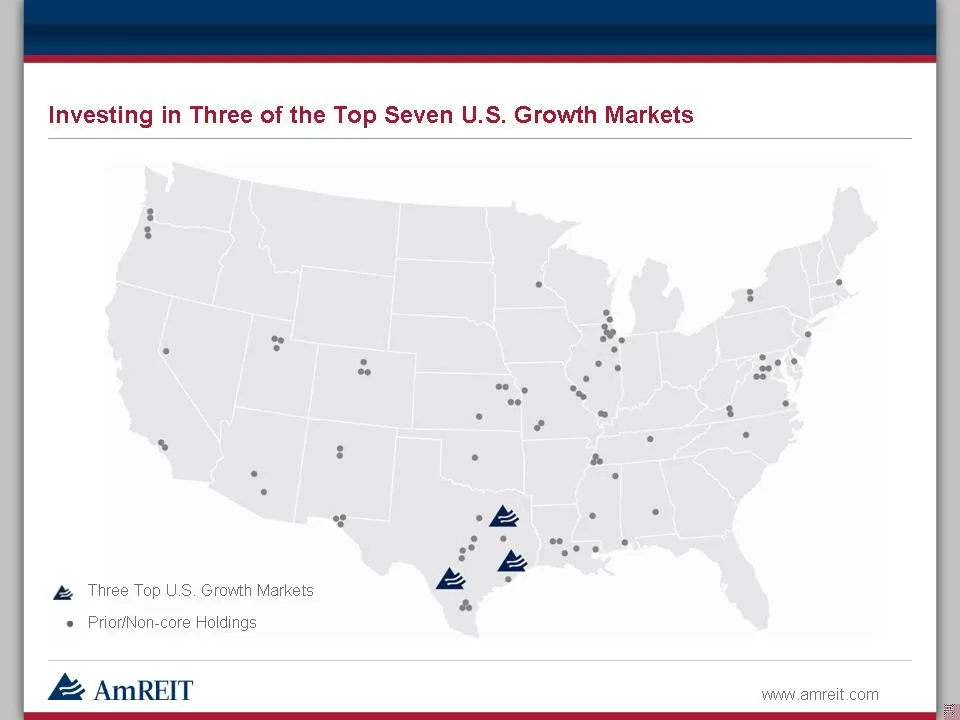
2 Investing in Three of the Top Seven U.S. Growth Markets (Gp:) Three Top U.S. Growth Markets (Gp:) Prior/Non-core Holdings
Slide 3: AmREIT Portfolio Operating Platform Approaching $1 Billion
3 AmREIT Portfolio Operating Platform Approaching $1 Billion Institutional Quality Real Estate Invested in Three of the Top Seven Employment Growth Markets Creating Value for a Quarter of a Century
Slide 4: Top Twelve Population Growth Markets
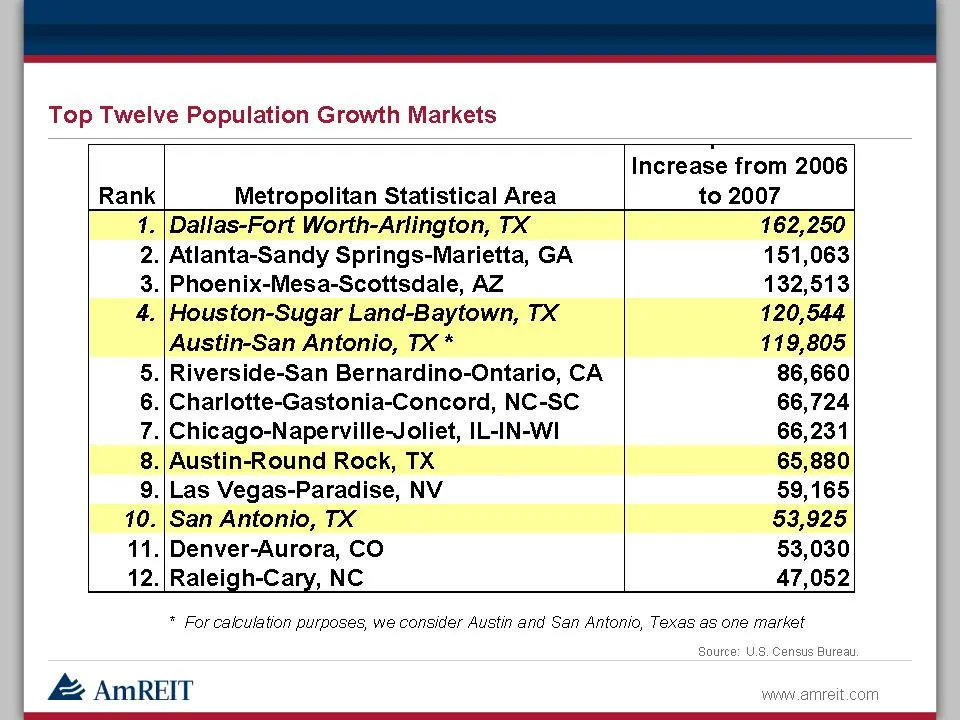
4 Top Twelve Population Growth Markets Source: U.S. Census Bureau.
Slide 5: Top Twelve Employment Growth Markets
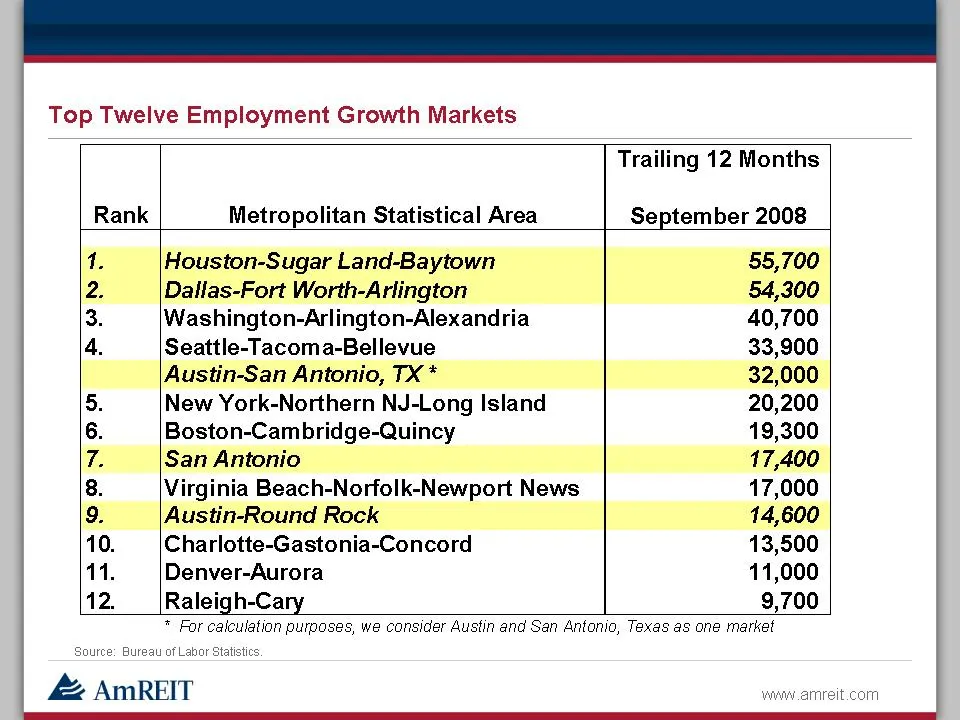
5 Top Twelve Employment Growth Markets Source: Bureau of Labor Statistics.
Slide 6: AmREIT – Debt Maturities as of September 30, 2008
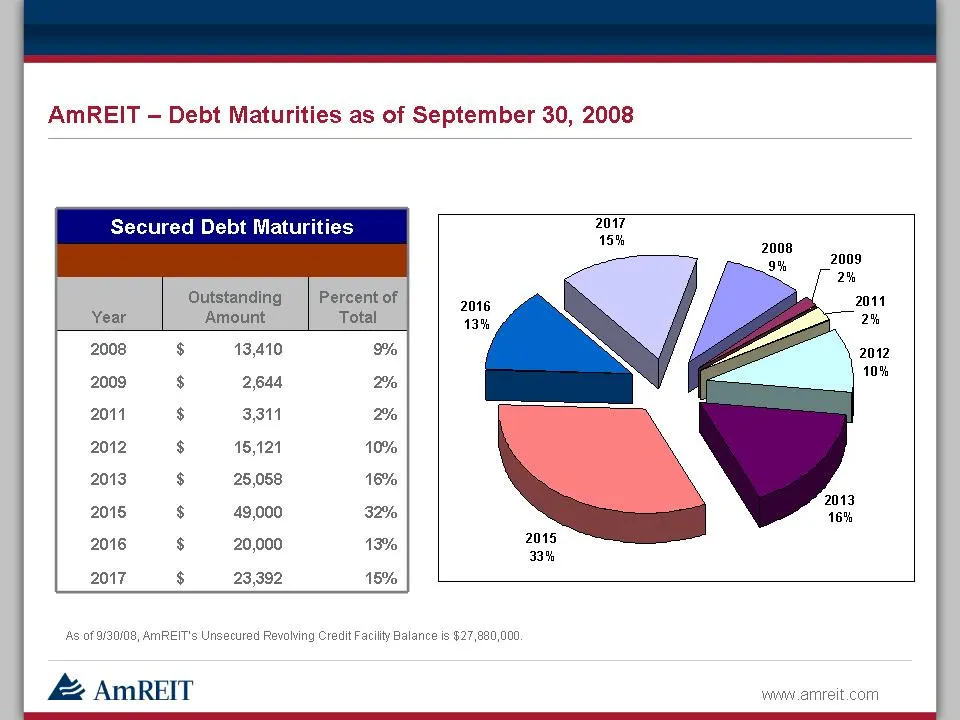
6 AmREIT – Debt Maturities as of September 30, 2008 As of 9/30/08, AmREIT’s Unsecured Revolving Credit Facility Balance is $27,880,000.
Slide 7: AmREIT Portfolio - Household Population Density Comparison
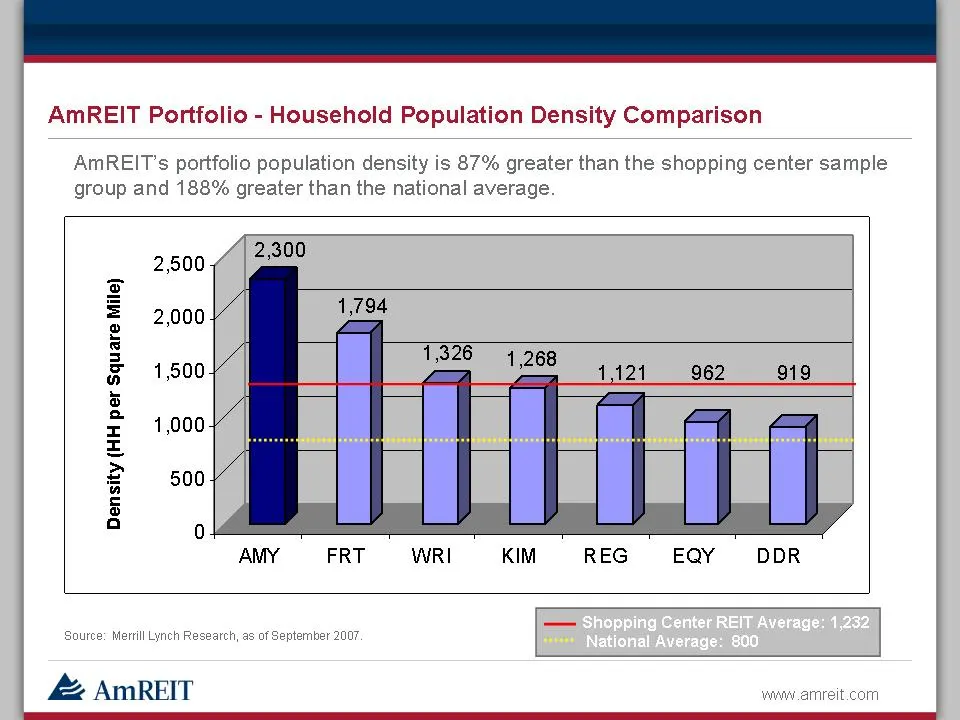
7 AmREIT Portfolio - Household Population Density Comparison (Gp:) Shopping Center REIT Average: 1,232 National Average: 800 Source: Merrill Lynch Research, as of September 2007. AmREIT’s portfolio population density is 87% greater than the shopping center sample group and 188% greater than the nati
Slide 8: AmREIT Portfolio - Household Income Comparison
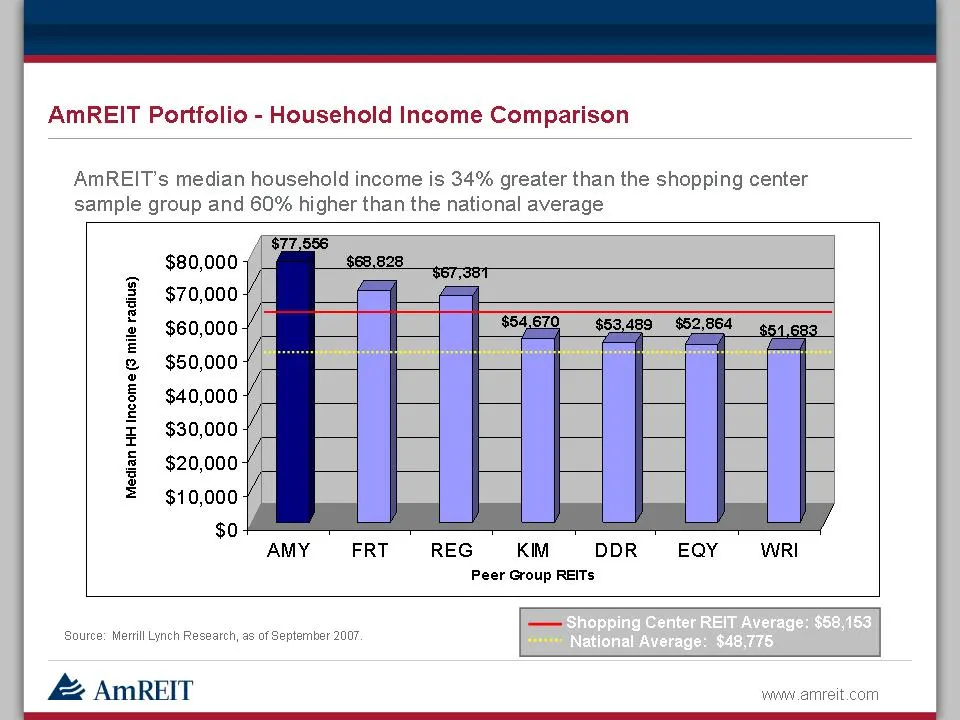
8 AmREIT Portfolio - Household Income Comparison (Gp:) Shopping Center REIT Average: $58,153 National Average: $48,775 Source: Merrill Lynch Research, as of September 2007. AmREIT’s median household income is 34% greater than the shopping center sample group and 60% higher than the national average
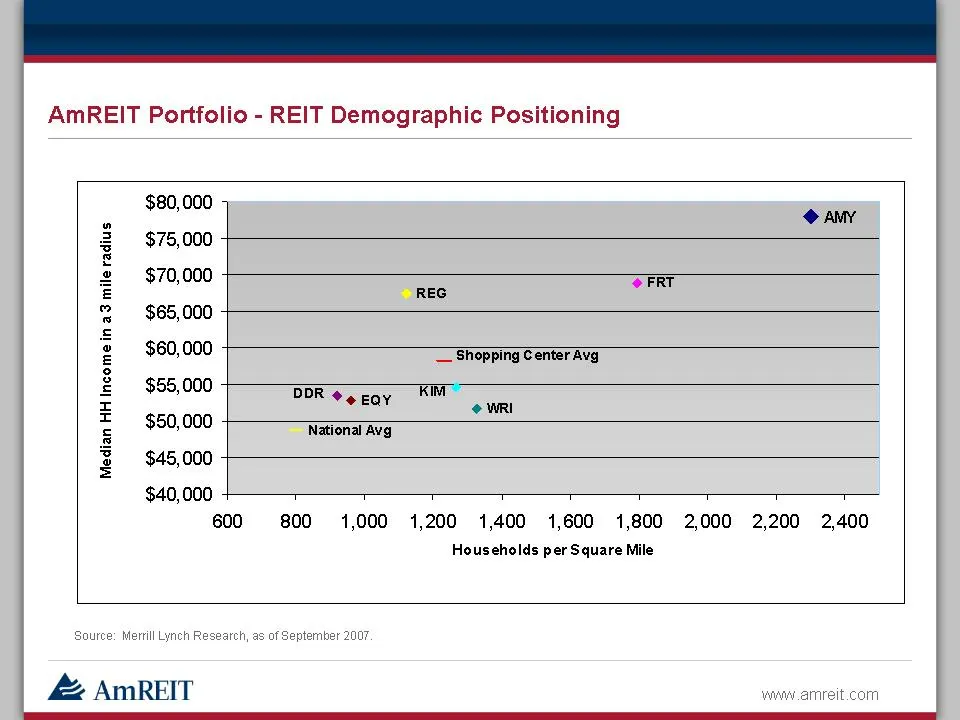
Slide 9: AmREIT Portfolio - REIT Demographic Positioning
9 AmREIT Portfolio - REIT Demographic Positioning Source: Merrill Lynch Research, as of September 2007.
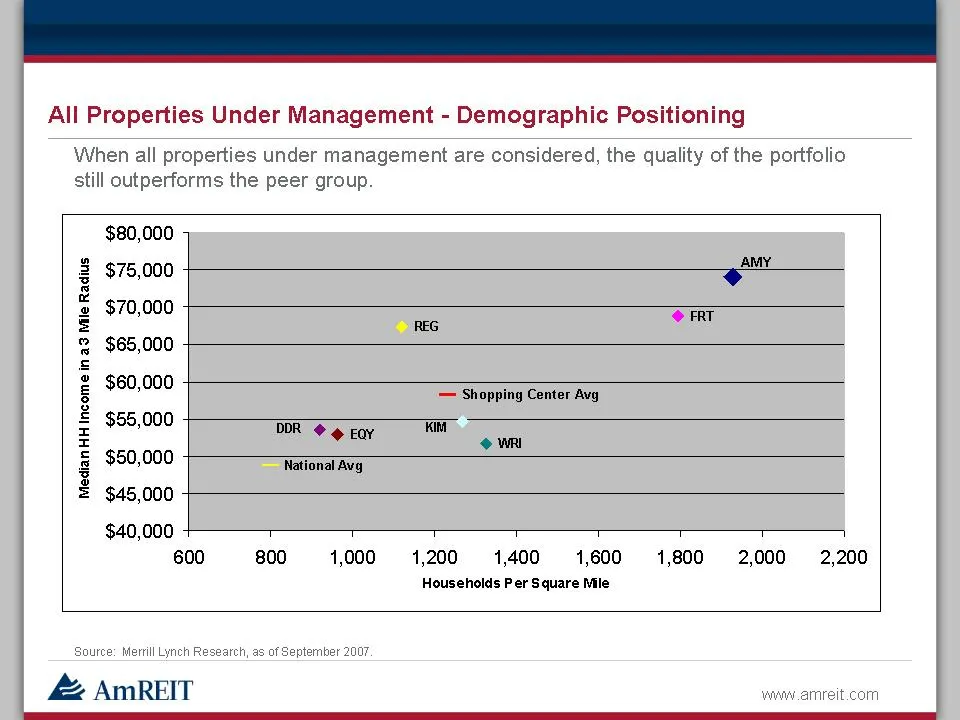
Slide 10: All Properties Under Management - Demographic Positioning
10 All Properties Under Management - Demographic Positioning Source: Merrill Lynch Research, as of September 2007. When all properties under management are considered, the quality of the portfolio still outperforms the peer group.
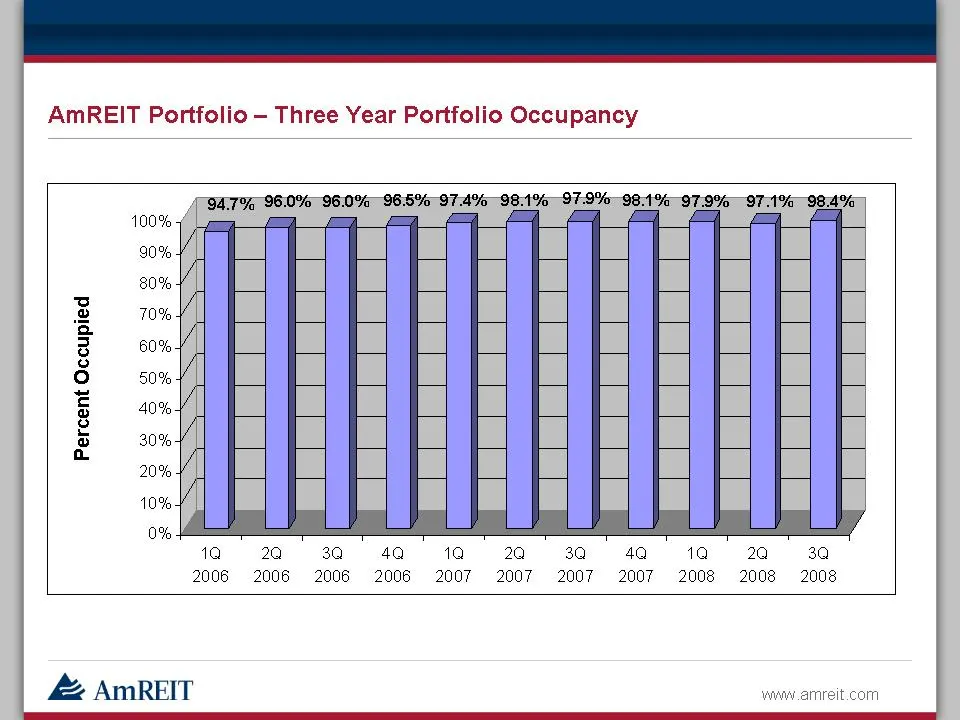
Slide 11: AmREIT Portfolio – Three Year Portfolio Occupancy
11 AmREIT Portfolio – Three Year Portfolio Occupancy
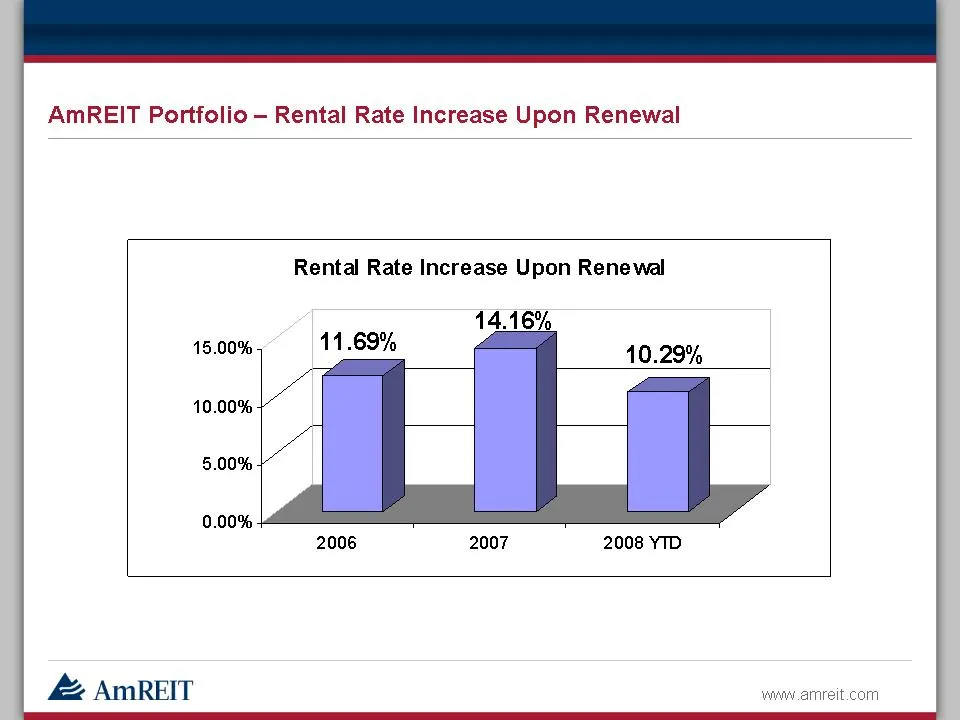
Slide 12: AmREIT Portfolio – Rental Rate Increase Upon Renewal
12 AmREIT Portfolio – Rental Rate Increase Upon Renewal
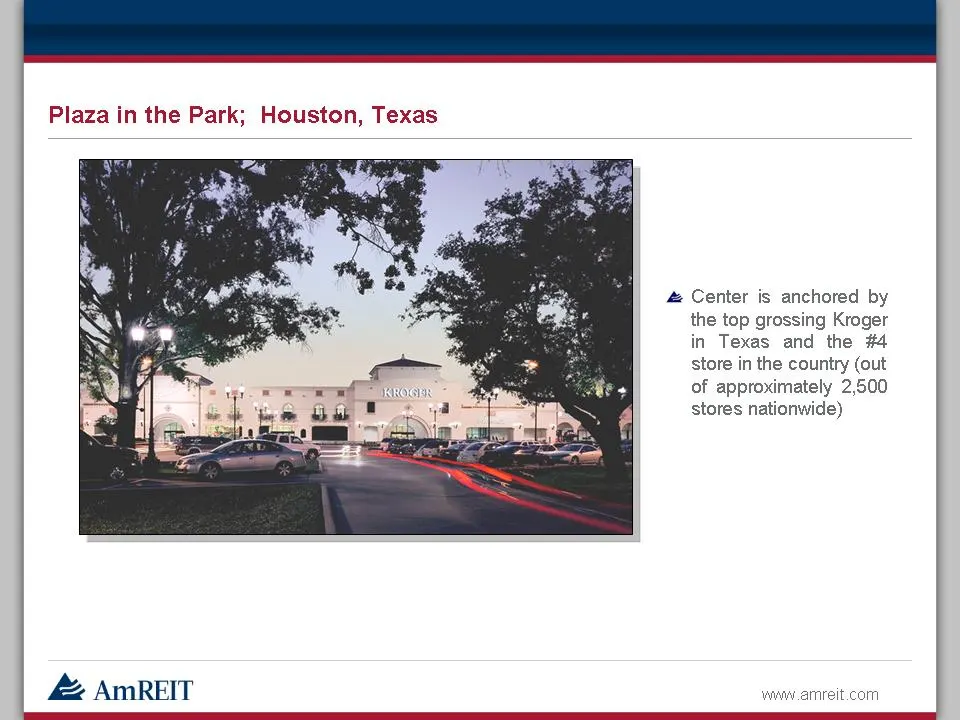
Slide 13: Plaza in the Park; Houston, Texas
13 Plaza in the Park; Houston, Texas Center is anchored by the top grossing Kroger in Texas and the #4 store in the country (out of approximately 2,500 stores nationwide)
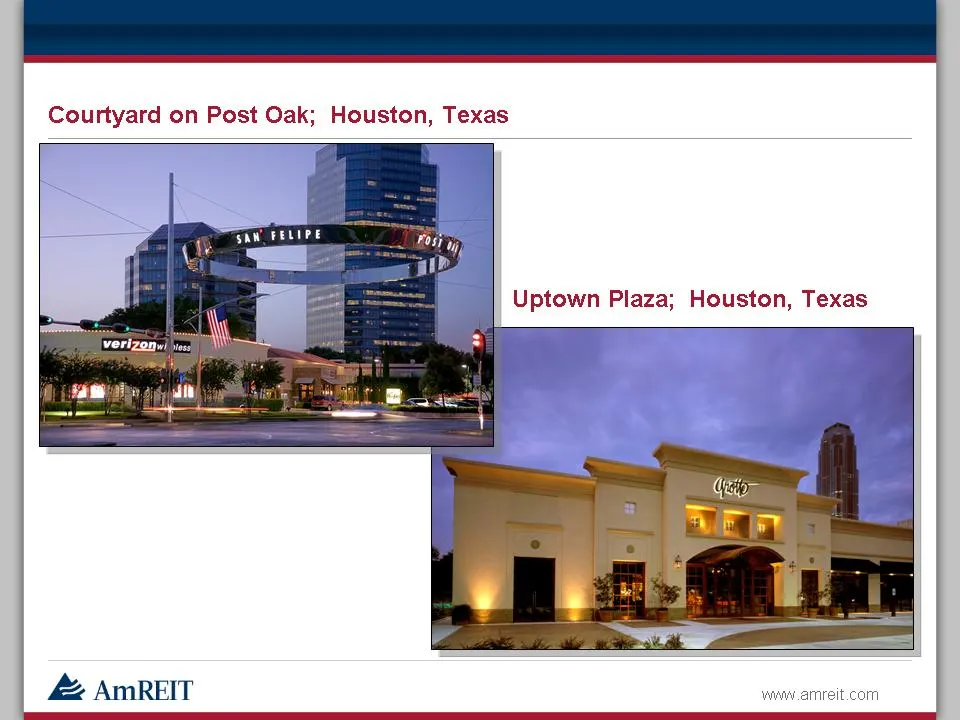
Slide 14: Courtyard on Post Oak; Uptown Plaza; Houston, Texas
14 Courtyard on Post Oak; Houston, Texas Uptown Plaza; Houston, Texas
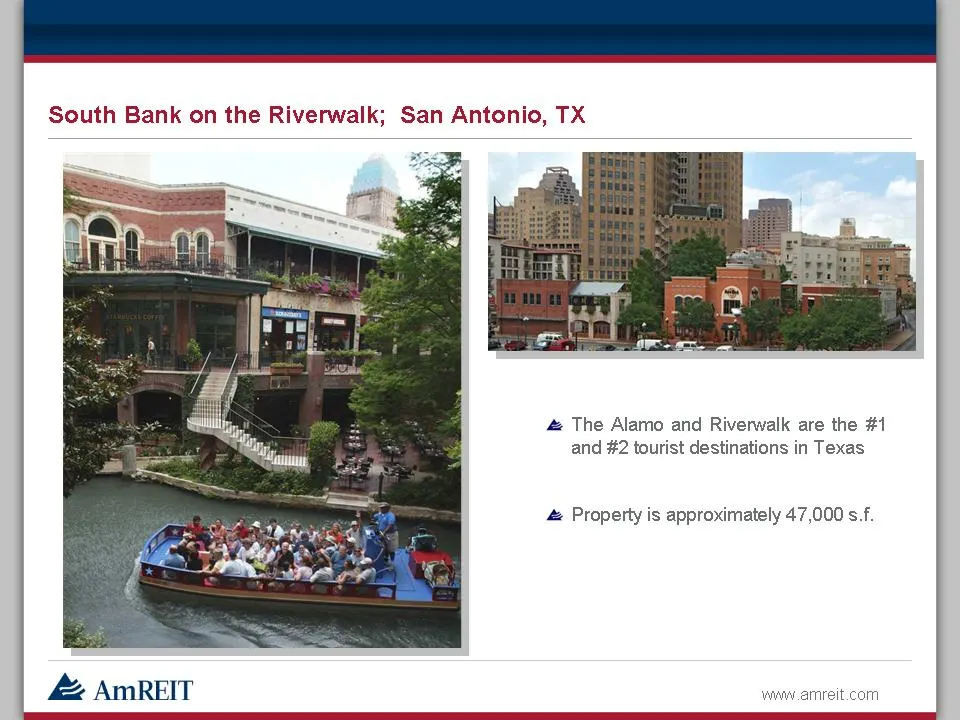
Slide 15: South Bank on the Riverwalk; San Antonio, TX
15 South Bank on the Riverwalk; San Antonio, TX The Alamo and Riverwalk are the #1 and #2 tourist destinations in Texas Property is approximately 47,000 s.f.
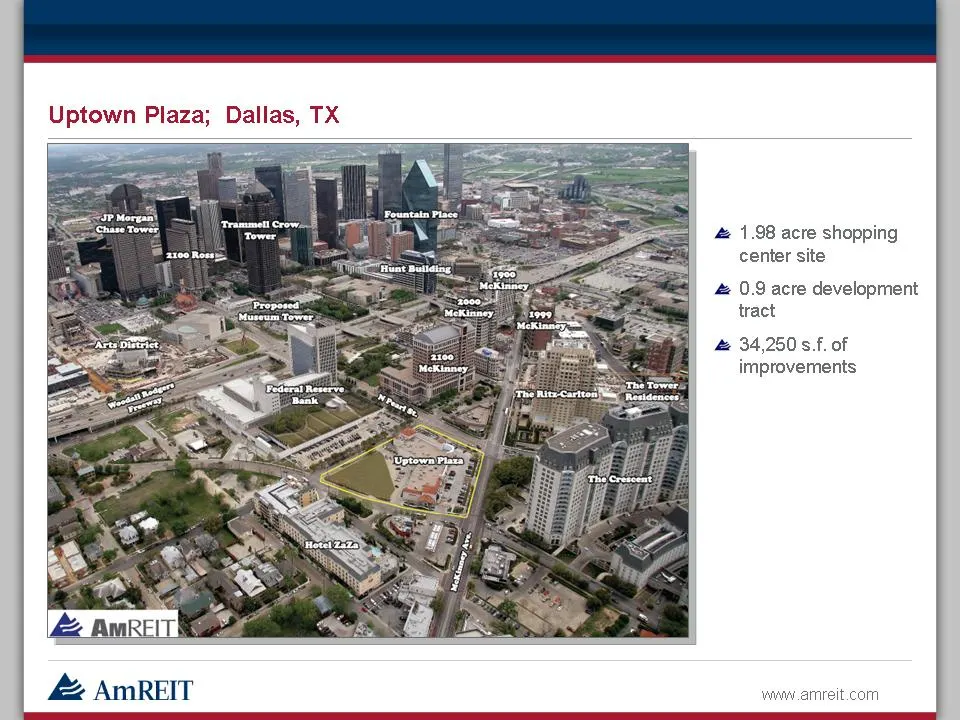
Slide 16: Uptown Plaza; Dallas, TX
16 Uptown Plaza; Dallas, TX 1.98 acre shopping center site 0.9 acre development tract 34,250 s.f. of improvements
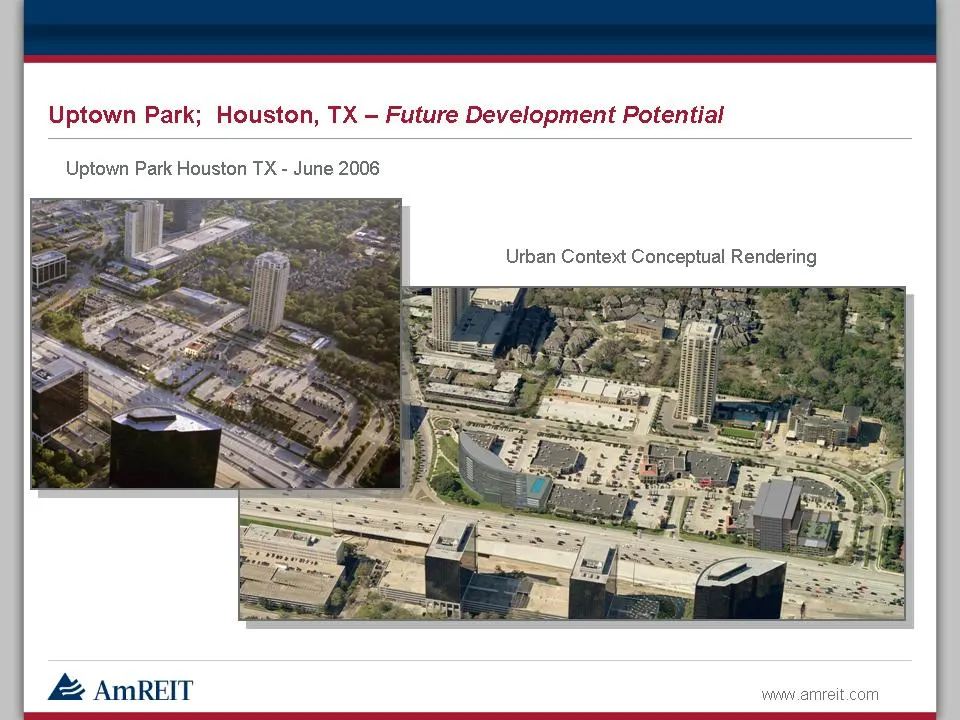
Slide 17: Uptown Park; Houston, TX – Future Development Potential
17 Uptown Park; Houston, TX – Future Development Potential Uptown Park Houston TX - June 2006 Urban Context Conceptual Rendering
Source: SEC EDGAR · 8-K filed Nov 5, 2008
More decks from AmREIT Inc
 Merger or Acquisition (June 2009)26 slides · Jun 4, 2009
 Investor Presentation (December 2008)24 slides · Dec 2, 2008
 Q3 2008 Earnings Presentation18 slides · Nov 5, 2008
 Q2 2006 Earnings Presentation15 slides · Aug 8, 2006
 Q1 2006 Earnings Presentation16 slides · May 4, 2006
 Q3 2005 Earnings Presentation9 slides · Oct 27, 2005