AmREIT — Q1 2006 Earnings Presentation
16 slides from AmREIT's earnings presentation, May 4, 2006
Slide 1: AmREIT Earnings Webcast 1st Quarter 2006
Slide 2: Forward Looking Statement
Forward Looking Statement In addition to historical information, this presentation contains forward-looking statements under the federal securities law These statements are based on current expectations, estimates and projections about the industry and markets in which &mREIT operates, and beliefs a
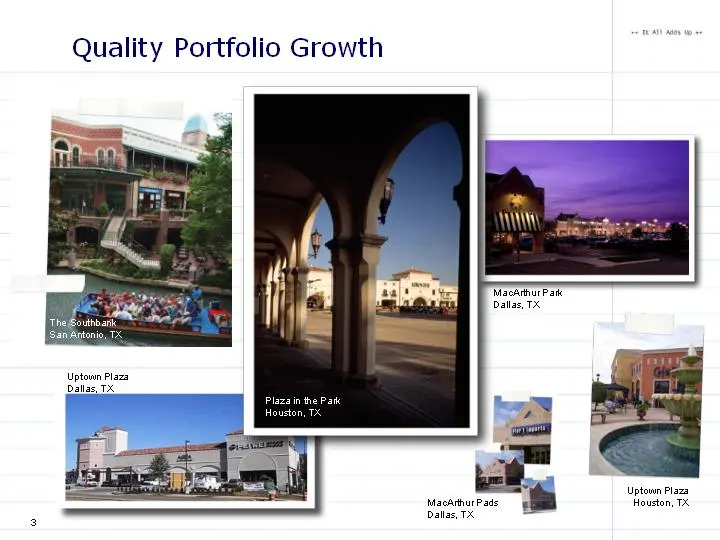
Slide 3: Quality Portfolio Growth
Quality Portfolio Growth WacumurPan Dallas, TX Uptown Plaza Mackhur Pads Houston, TX Dallas, TX Uptown Plaza Dallas, TX.
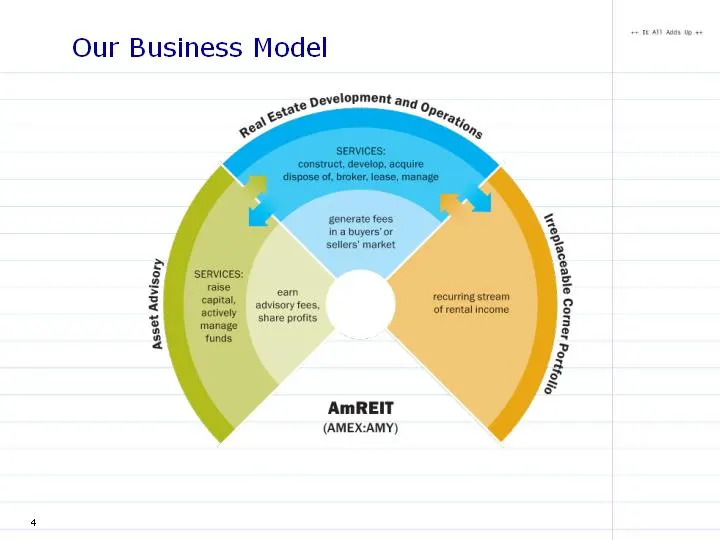
Slide 4: Our Business Model
Our Business Model
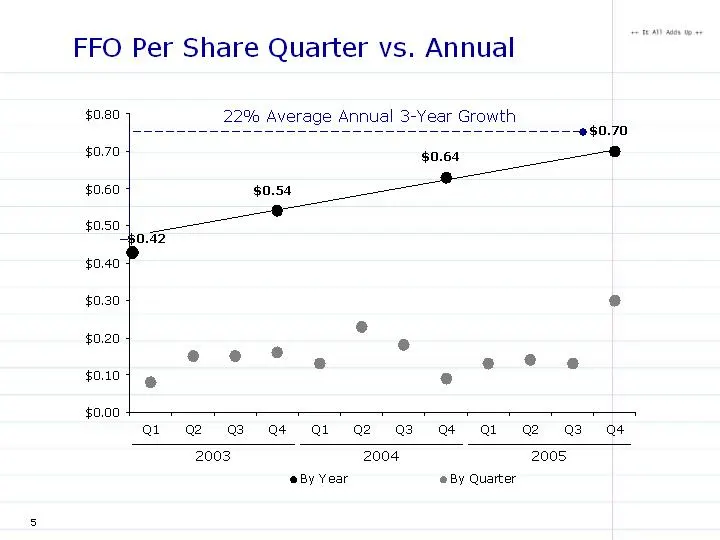
Slide 5: FFO Per Share Quarter vs. Annual
FFO Per Share Quarter vs. Annual $0.80 $0170 $0.64 $0.60 $0.54 soso | soso? $0.30 ° $020 e $0.10] @ e $0.00 eBy Year @ By Quarter
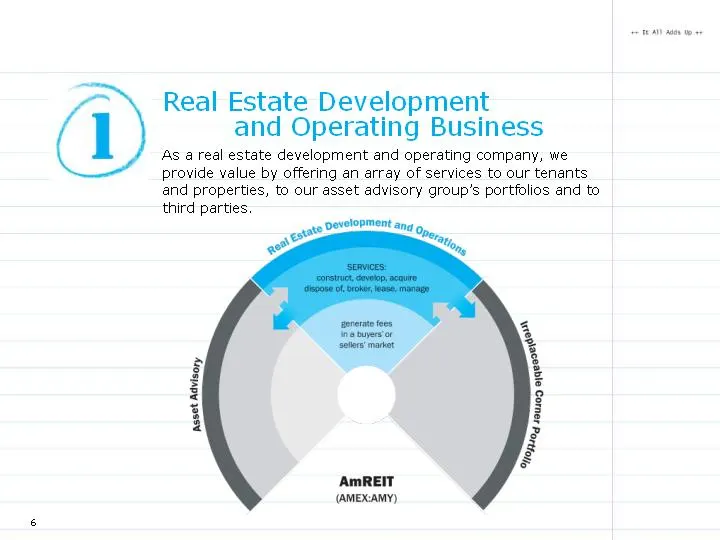
Slide 6: Real Estate Development and Operating Business
Real Estate Development and Operating Business As a real estate development and operating company, we provide value by offering an array of services to our tenants and properties, to our asset advisory group’s portfolios and to third parties. oe ea and On, Asset Advisory
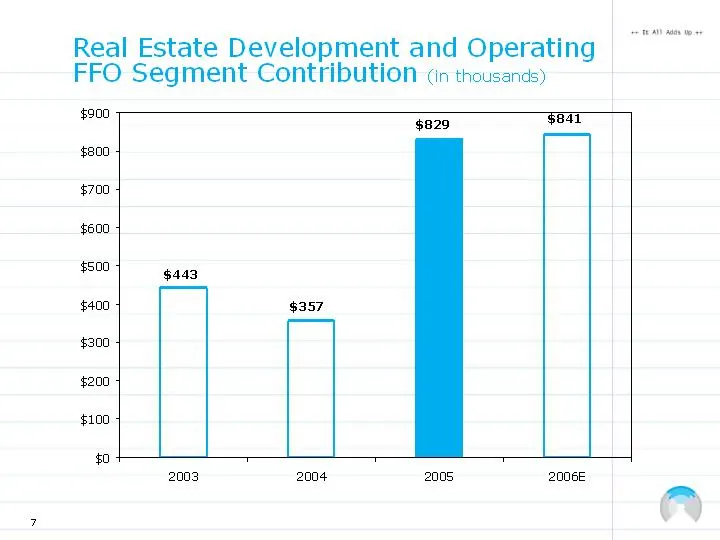
Slide 7: Real Estate Development and Operating
Real Estate Development and Operating FFO Segment Contribution cn thousands) $900 $800 $700 $600 $500 $400 $300 $200 $100 $0 $443 $357 $829 $841 2003 2004 2005 2006E
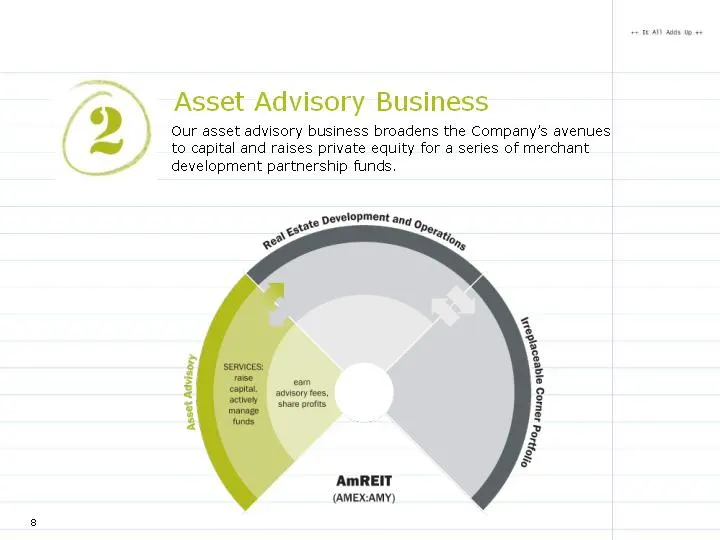
Slide 8: Asset Advisory Business
Asset Advisory Business Our asset advisory business broadens the Company's avenues to capital and raises private equity for a series of merchant development partnership funds <j He sousog oe AmREIT (AMEXAMY)
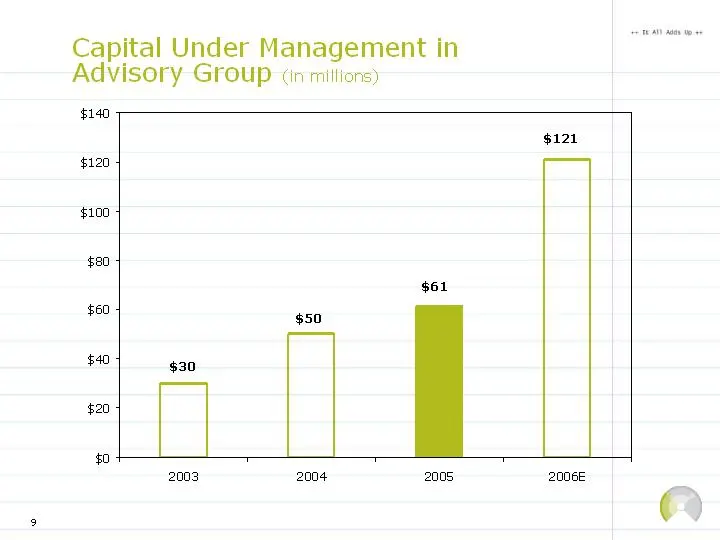
Slide 9: Capital Under Management in Advisory Group
Capital Under Management in Advisory Group cn millions) $140 $121 $120 $100 $80 $60 $50 £0 $30 $20 $0 2003 2004 2005 2006E €
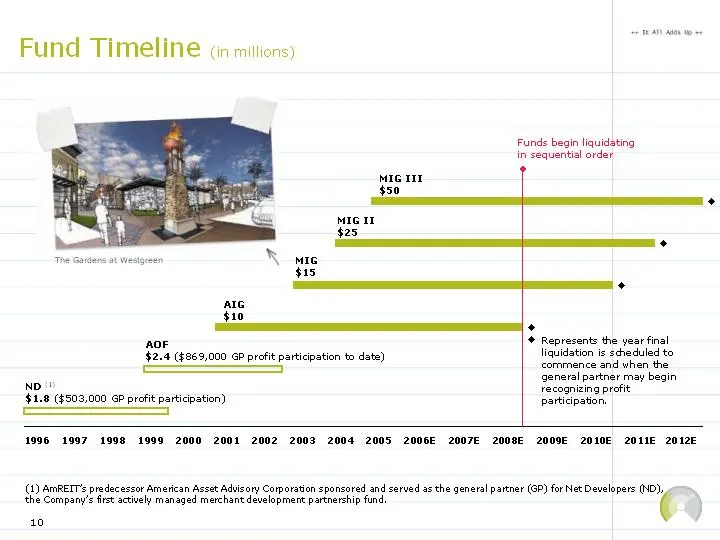
Slide 10: Fund Timeline
Fund Timeline (in mitiions) Funds begin liquidating In sequential order MIG 11 $50 . Represents the year final Aor $2.4 ($055,000 GP profit participation to dats) lgdton Eel to fiscecpcne peti ccrnansaisben the not Seraralpatner ray beain recegnising PAE $2.8 ($503,000 6P profit participation) recoa
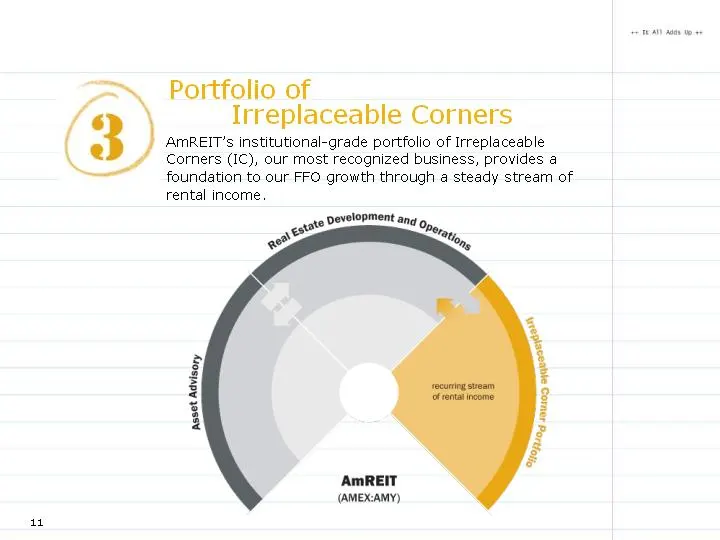
Slide 11: Portfolio of Irreplaceable Corners
an 5} Portfolio of Irreplaceable Corners AMmREIT’s institutional-grade portfolio of Irreplaceable Corners (IC), our most recognized business, provides a foundation to our FFO growth through a steady stream of rental income i i 3 3 H AmREIT (AMEXAMY)
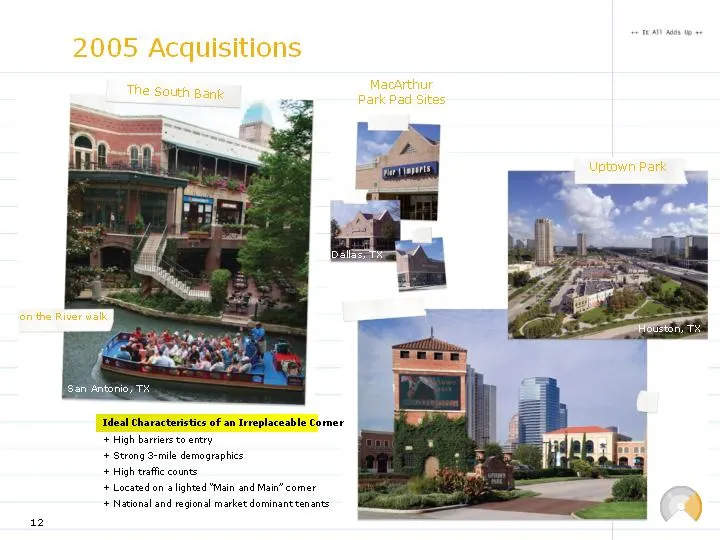
Slide 12: Ideal Characteristics of an Irreplaceable Corner
32 deal Characteristics of an Irreplaceable Comer + High barriers to entry + Strong 3-mile demographics + High trafic counts + Located on alighted “Main and Main” comer + National and regional market dominant tenants
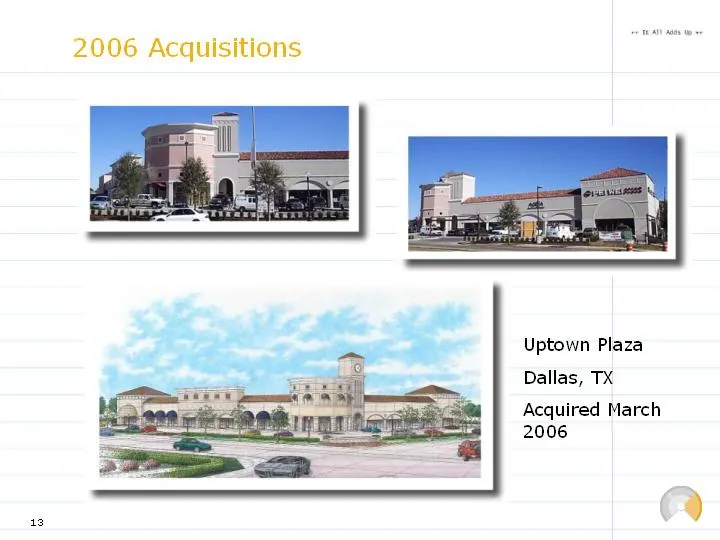
Slide 13: 2006 Acquisitions
13 2006 Acquisitions Uptown Plaza Dallas, TX Acquired March 2006
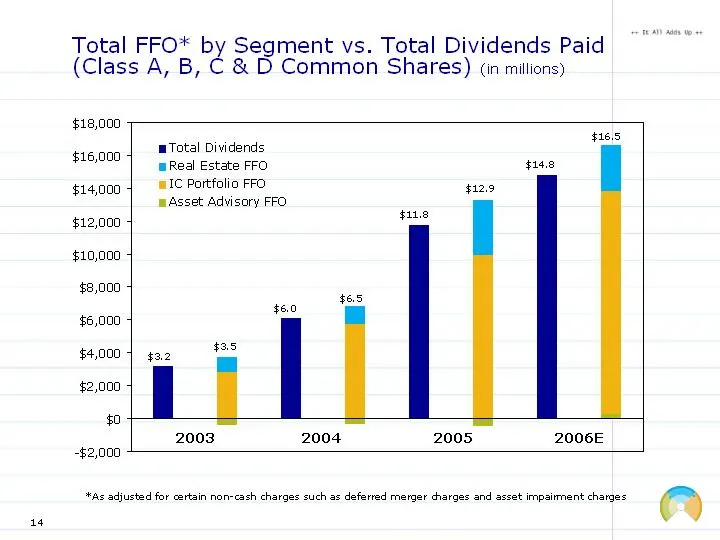
Slide 14: Total FFO by Segment vs. Total Dividends Paid
Total FFO* by Segment vs. Total Dividends Paid (Class A, B, C & D Common Shares) (in mitions) $18,000 Total Dividend: Bt ste007 Real Estate FFO $14.8 $14,000 | BIC Portfolio FFO ror " Asset Advisory FFO. $12,000 ibe. $10,000 $8,000 i $6,000 to $4,000) 432 — $0 2003 2004 2005 2006E -$2,000 “As adjust
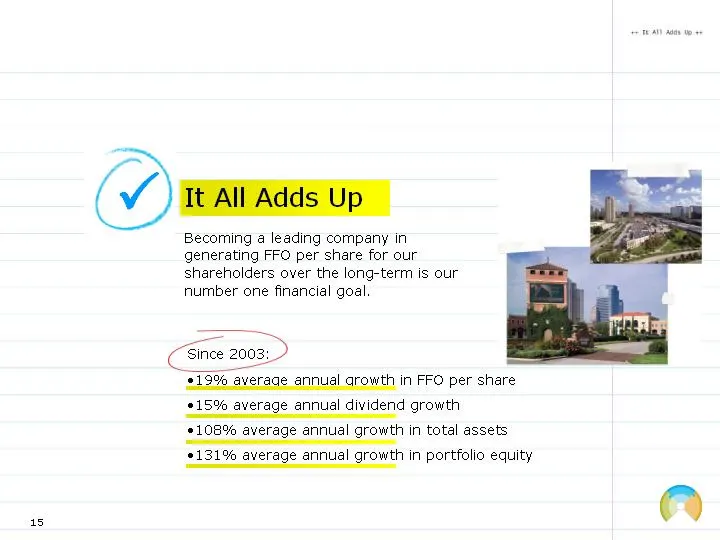
Slide 15: Becoming a leading company in generating FFO per share
as Becoming a leading company in generating FFO per share for our shareholders over the long-term is our number one financial goal Gince 2008, > 19% average annual growth in FFO per share 15% average annual dividend growth *108% average annual growth in total assets 131% average annual growth in por
Slide 16: [GRAPHIC APPEARS HERE]
Exhibit 99.2 [GRAPHIC APPEARS HERE] ++ Earnings Webcast ++ AMY:06 1 st Quarter 2006 May 4, 2006 Forward Looking Statement In addition to historical information, this presentation contains forward-looking statements under the federal securities law. These statements are based on current expectations,
Source: SEC EDGAR · 8-K filed May 4, 2006
More decks from AmREIT Inc
 Merger or Acquisition (June 2009)26 slides · Jun 4, 2009
 Investor Presentation (December 2008)24 slides · Dec 2, 2008
 Q3 2008 Earnings Presentation18 slides · Nov 5, 2008
 Q3 2008 Earnings Presentation17 slides · Nov 5, 2008
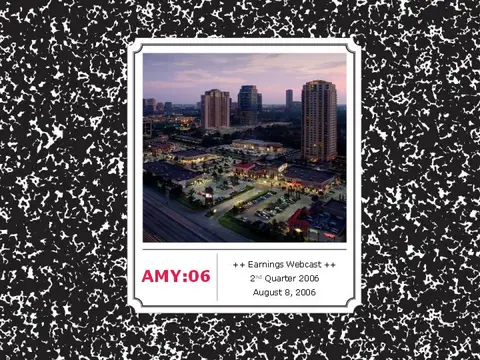 Q2 2006 Earnings Presentation15 slides · Aug 8, 2006
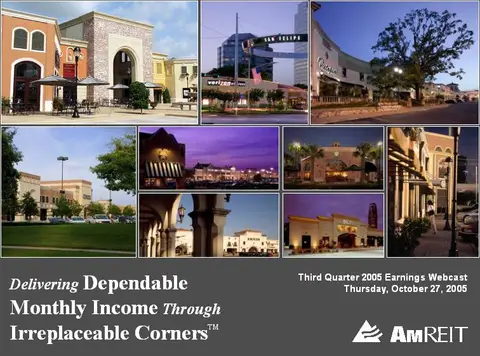 Q3 2005 Earnings Presentation9 slides · Oct 27, 2005