Santander Holdings USA Inc · NYSE:SNUS/PH
Santander Holdings USA — Debt Investor Presentation (May 2023)
37 slides from Santander Holdings USA's debt investor presentation, May 9, 2023

Slide 1: First Quarter 2023 Fixed Income Investor Presentation
May 9, 2023 SANTANDER HOLDINGS USA, INC. First Quarter 2023 Fixed Income Investor Presentation «> Santander
Slide 2: Important Information
Important Information This presentation of Santander Holdings USA, Inc. (“SHUSA") contains “forward-looking statements” within the meaning of the Private Securities Litigation Reform Act of 1995 regarding the financial condition, results of operations, business plans and future performance of SHUSA.
Slide 3: Index
Index @ ] ¢ = Oo rm) 2 <=
Slide 4: SHUSA Q1 2023 Highlights
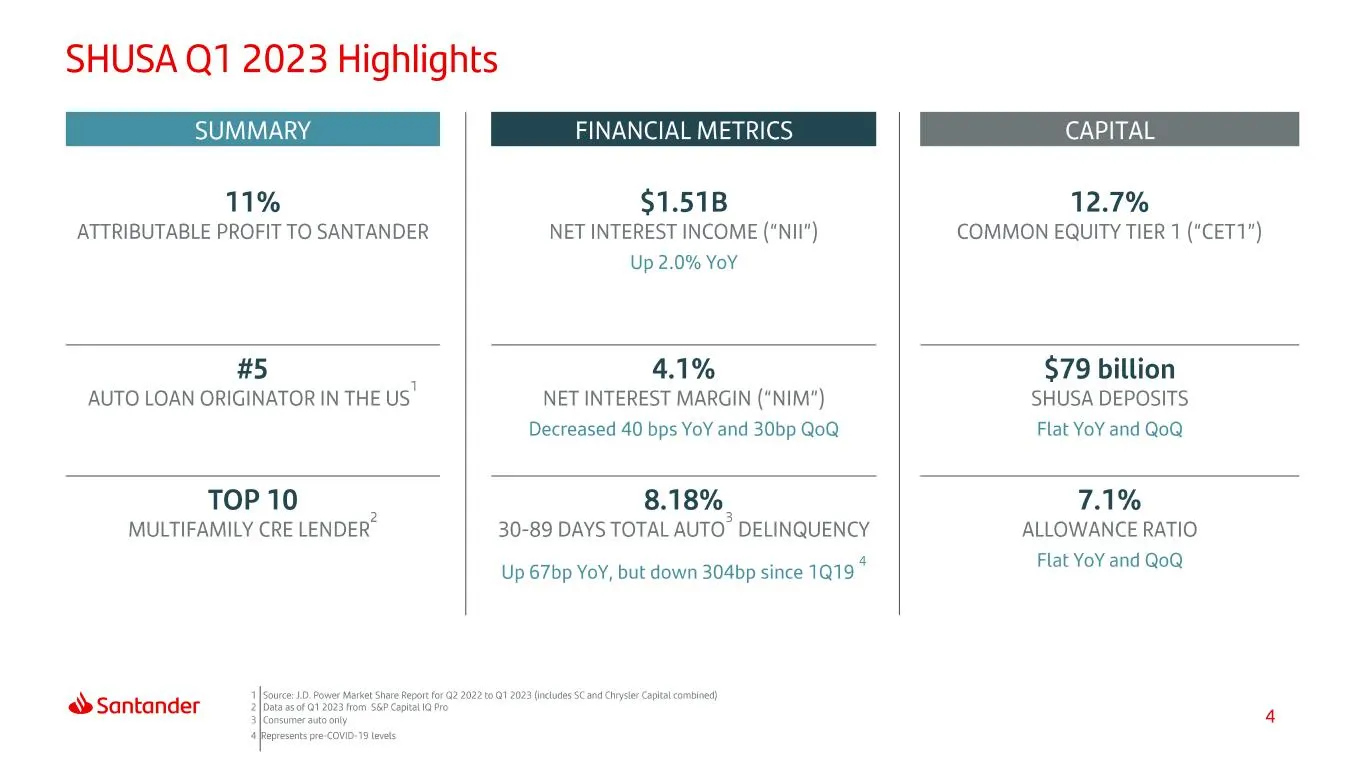
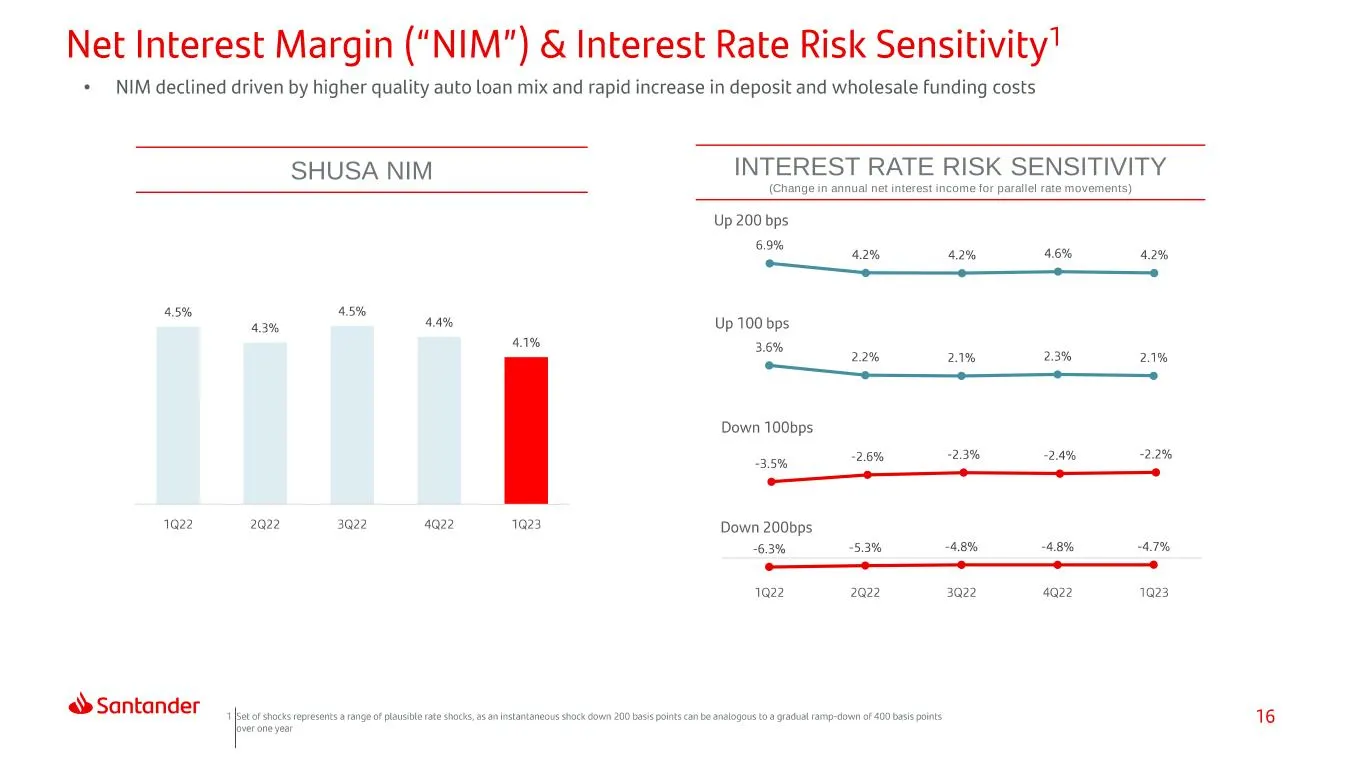
SHUSA Q1 2023 Highlights PSUMMARY 11% ATTRIBUTABLE PROFIT TO SANTANDER FINANCIAL METRICS $1.51B NET INTEREST INCOME ("NII") Up 2.0% YoY CAPITAL 12.7% COMMON EQUITY TIER 1 ("CET1”) #5 AUTO LOAN ORIGINATOR IN THE US’ 4.1% NET INTEREST MARGIN ("NIM") Decreased 40 bps YoY and 30bp QoQ $79 billion SHUSA
Slide 5: SHUSA subsidiaries and footprint
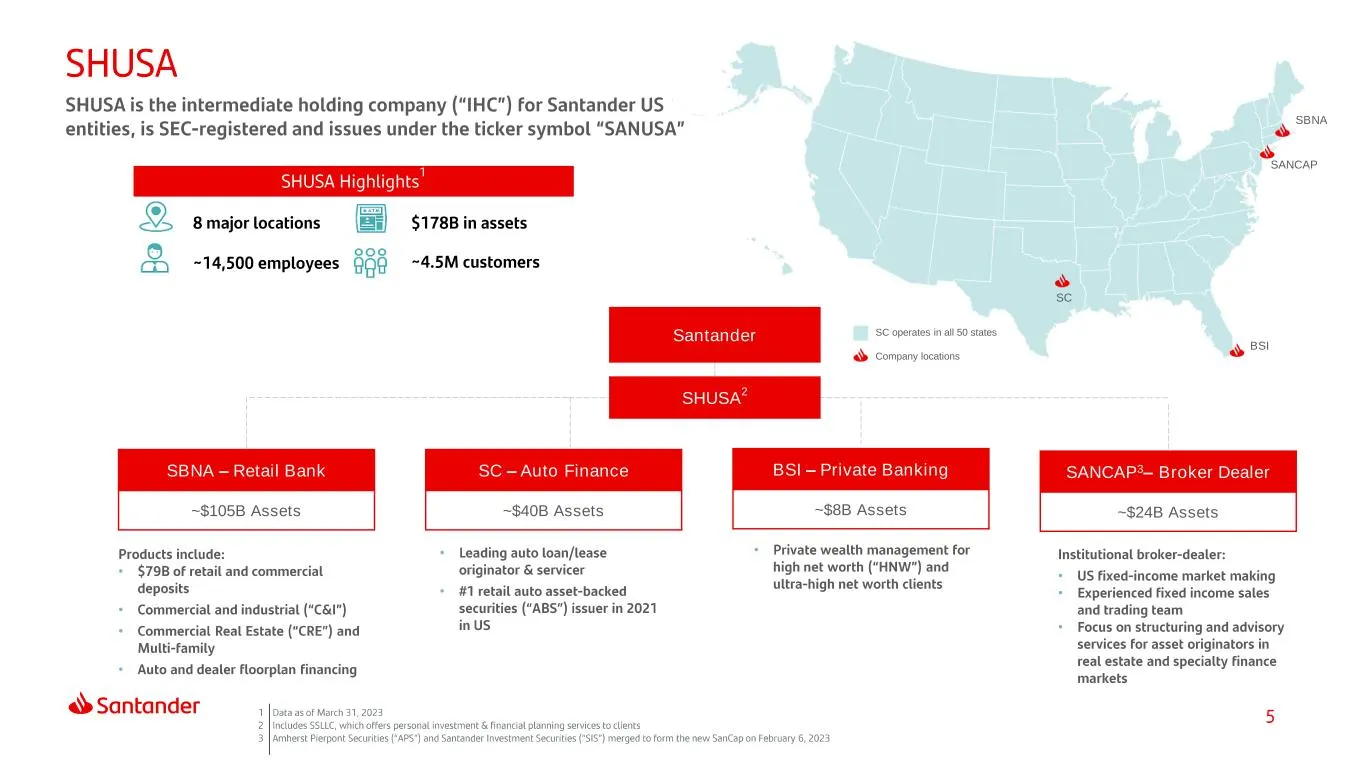
SBNA – Retail Bank ~$105B Assets SC – Auto Finance ~$40B Assets BSI – Private Banking ~$8B Assets SANCAP3– Broker Dealer ~$24B Assets • • • • • • • • • • SHUSA 2 Santander SC operates in all 50 states Company locations SC BSI SBNA SANCAP
Slide 6: Index
Index At a Glance Recent Areas Results of Focus
Slide 7: Deposits and liquidity
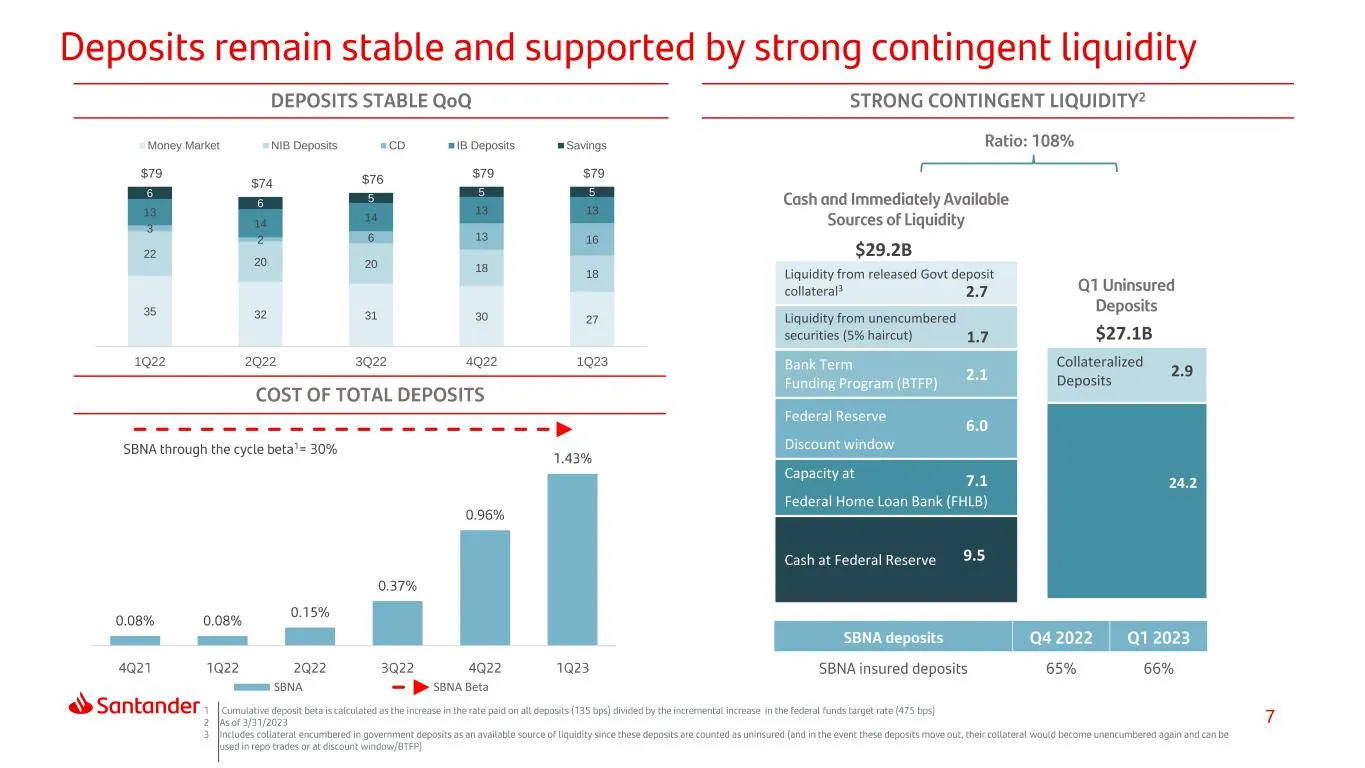
0% 0% 0% 1% 1% 1% 1% 1% 2% 2% 2% SBNA SBNA Beta 35 32 31 30 27 22 20 20 18 18 3 2 6 13 16 13 14 14 13 13 6 6 5 5 5 $79 $74 $76 $79 $79 1Q22 2Q22 3Q22 4Q22 1Q23 Money Market NIB Deposits CD IB Deposits Savings As of March 31, 2023, balances in $MM Deposits Total Deposits 78,000 (a) Total Uninsured de
Slide 8: Strong balance sheet position with risk management standards in line with GSIB banks
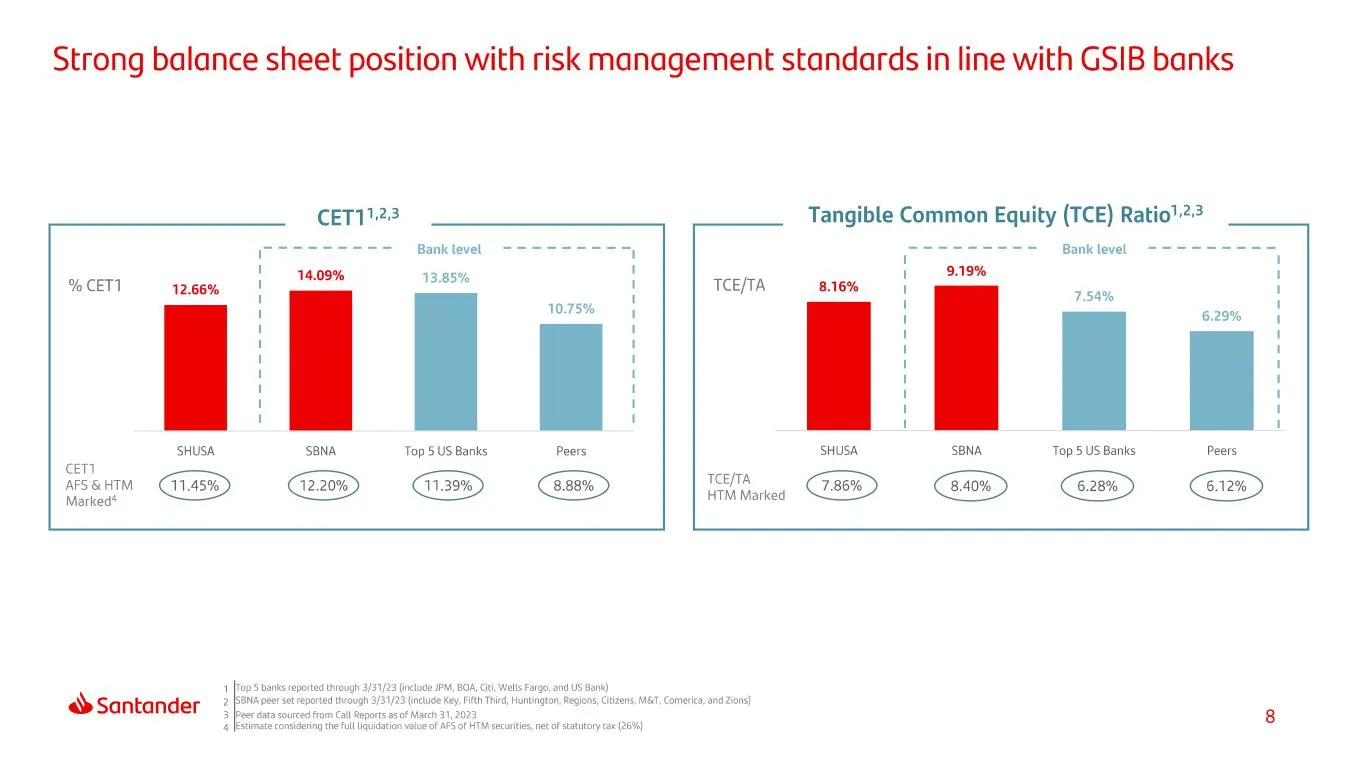
Strong balance sheet position with risk management standards in line with GSIB banks CET1123 Tangible Common Equity (TCE) Ratio!> yroccsccce Bank level ---------, . Seeeseees Banklevel --------=- ; 1 ' 9.19% 14.09% a t 1 % CETI aoe: || 17a 1 TCE/TA 8.16% {i i H = 1 i 7.54% i ! 10.75% 4 i 6.29% 4 : .
Slide 9: Multifamily makes up approximately 70% of total CRE portfolio exposure at SBNA
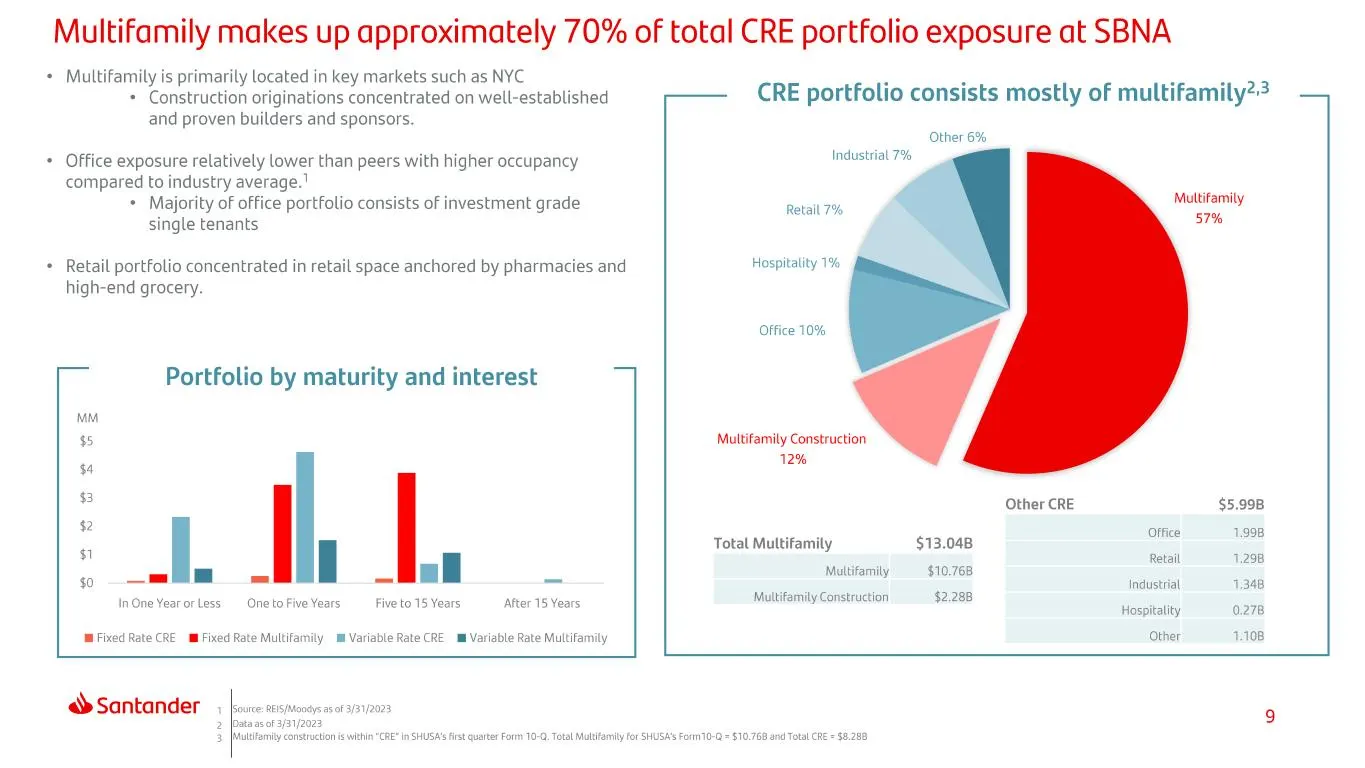
Multifamily makes up approximately 70% of total CRE portfolio exposure at SBNA + Multifamily is primarily located in key markets such as NYC * Construction originations concentrated on well-established and proven builders and sponsors. * Office exposure relatively lower than peers with higher occupa
Slide 10: Index
Index At a Glance Recent Areas Results of Focus
Slide 11: NII, pre-tax income, net income and PPNR
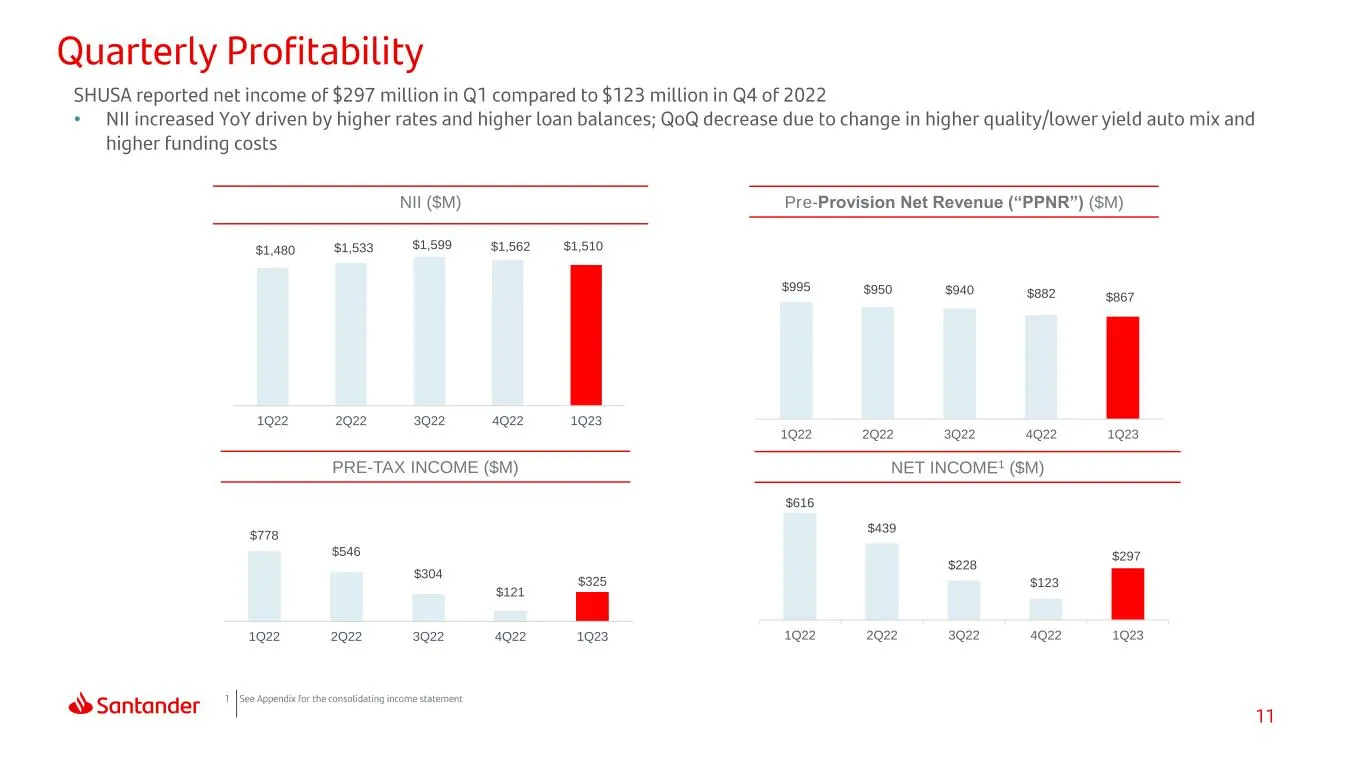
$616 $439 $228 $123 $297 1Q22 2Q22 3Q22 4Q22 1Q23 NII ($M) PRE-TAX INCOME ($M) NET INCOME1 ($M) Pre-Provision Net Revenue (“PPNR”) ($M) • $1,480 $1,533 $1,599 $1,562 $1,510 1Q22 2Q22 3Q22 4Q22 1Q23 $995 $950 $940 $882 $867 1Q22 2Q22 3Q22 4Q22 1Q23 $778 $546 $304 $121 $325 1Q22 2Q22 3Q22 4Q22 1Q23
Slide 12: Segment Overview
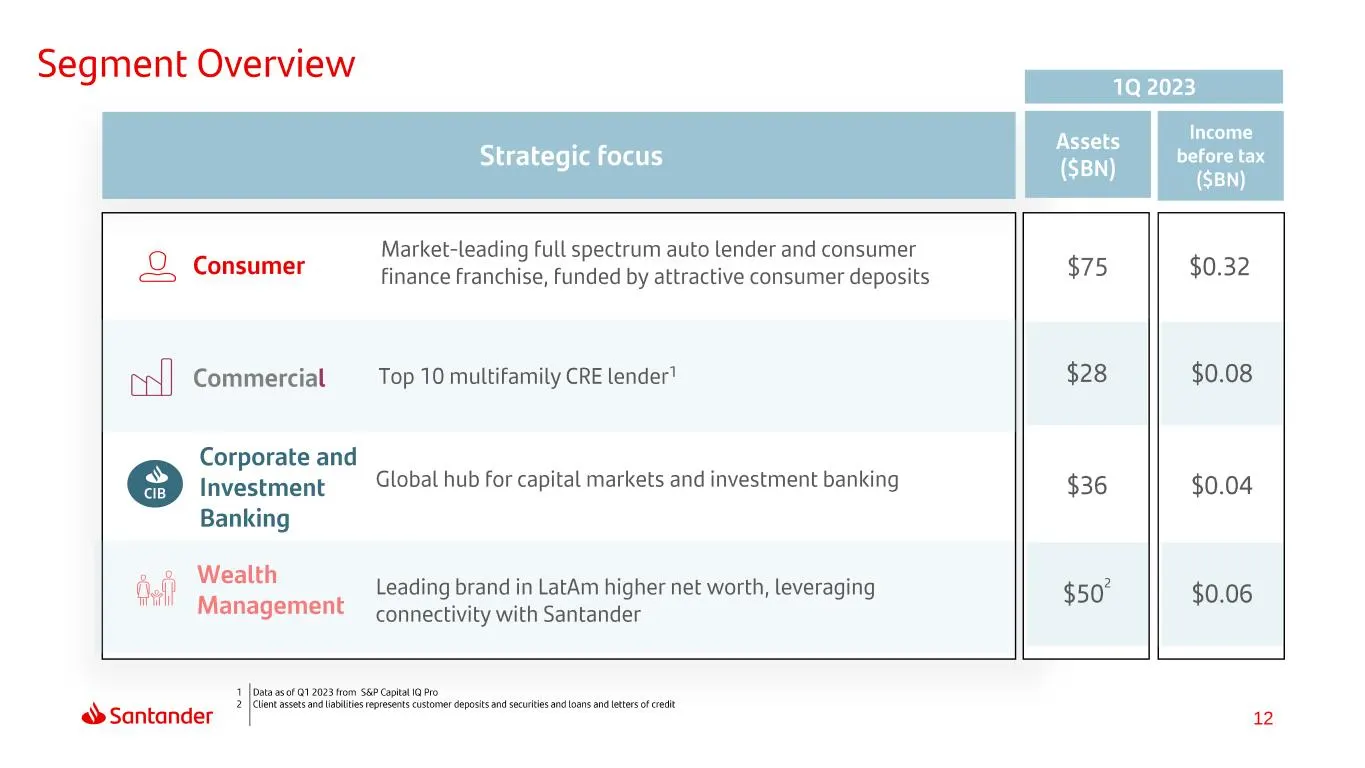
Segment Overview ieee 205 ae , Assets income Strategic focus before tax ee (SBN) (§BN) Market-leading Full spectrum auto lender and consumer = Consumer finance Franchise, Funded by attractive consumer deposits $75 $0.32 wy] Commercial Top 10 multifamily CRE lender? $28 $0.08 Corporate and , Investme
Slide 13: Q1 Balance Sheet Overview
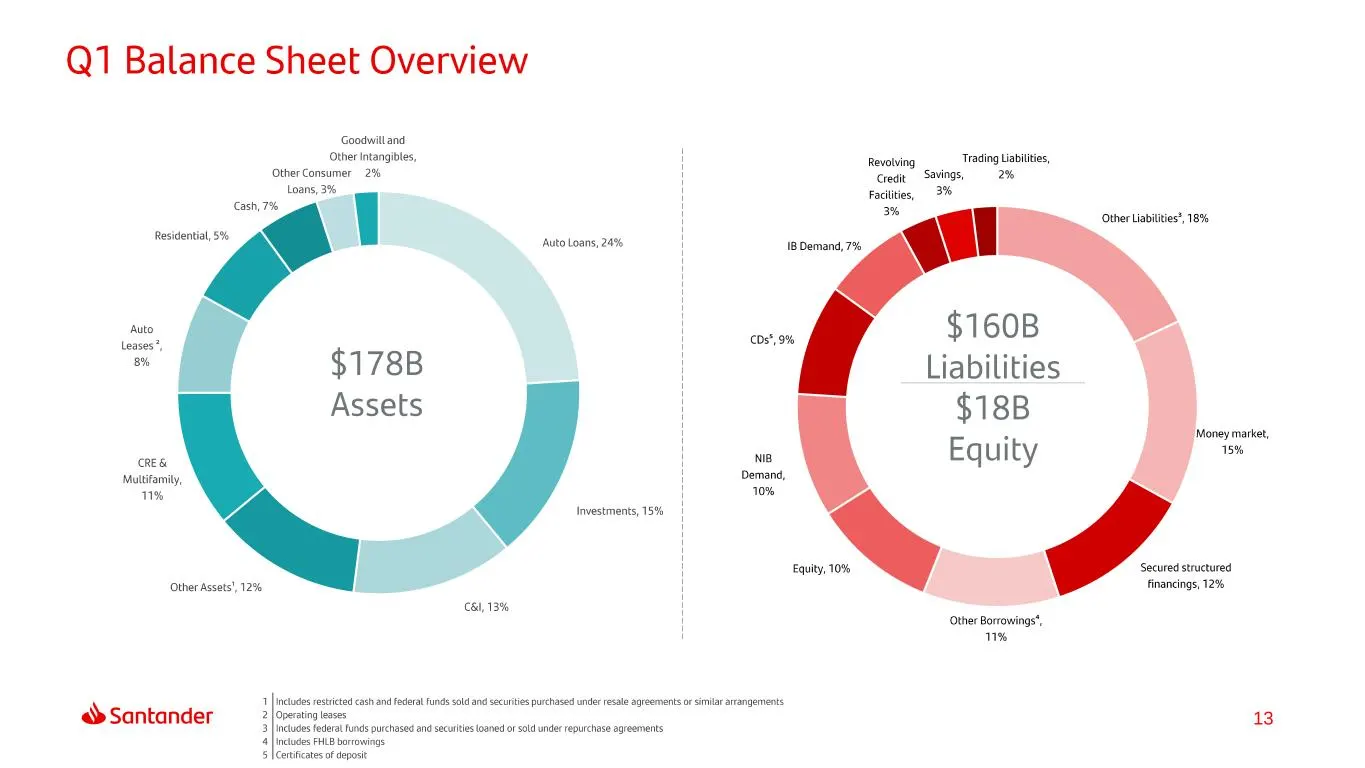
Q1 Balance Sheet Overview Goodwill and Other Intangibles, Other Consumer 2% Loans, 3% ee ¢$ Aiton Leases*, a $178B Assets CREE Multifamily, 1% Investments, 15% Other Assets! 1236 CB, 13% Revolving ‘Trading Liabilities, credit Savings, 2% Facilites, 3% 3% ave $160B Liabilities $18B i Equity a Demand,
Slide 14: Assets and loan composition
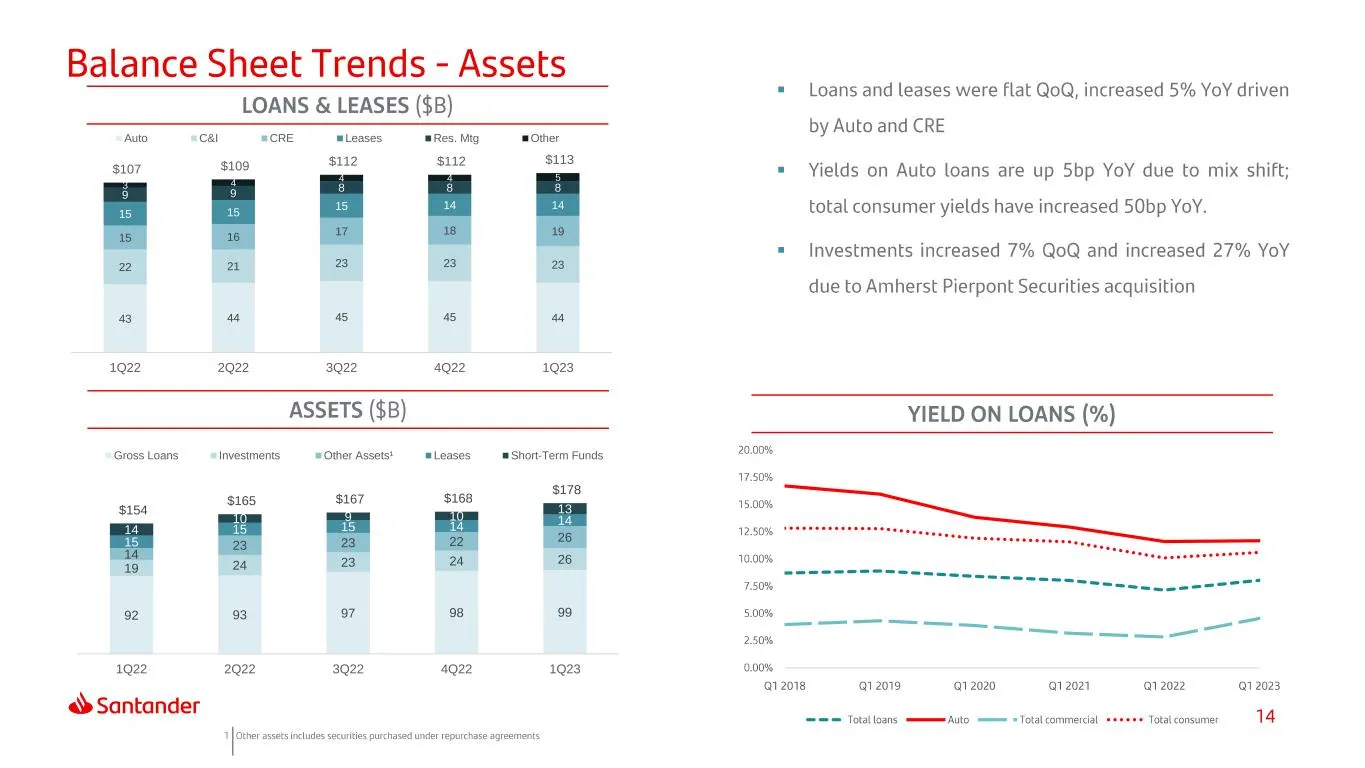
▪ ▪ ▪ 92 93 97 98 99 19 24 23 24 2614 23 23 22 2615 15 15 14 14 14 10 9 10 13$154 $165 $167 $168 $178 1Q22 2Q22 3Q22 4Q22 1Q23 Gross Loans Investments Other Assets¹ Leases Short-Term Funds 43 44 45 45 44 22 21 23 23 23 15 16 17 18 19 15 15 15 14 14 9 9 8 8 83 4 4 4 5 $107 $109 $112 $112 $113 1Q22 2Q
Slide 15: Liabilities and deposits
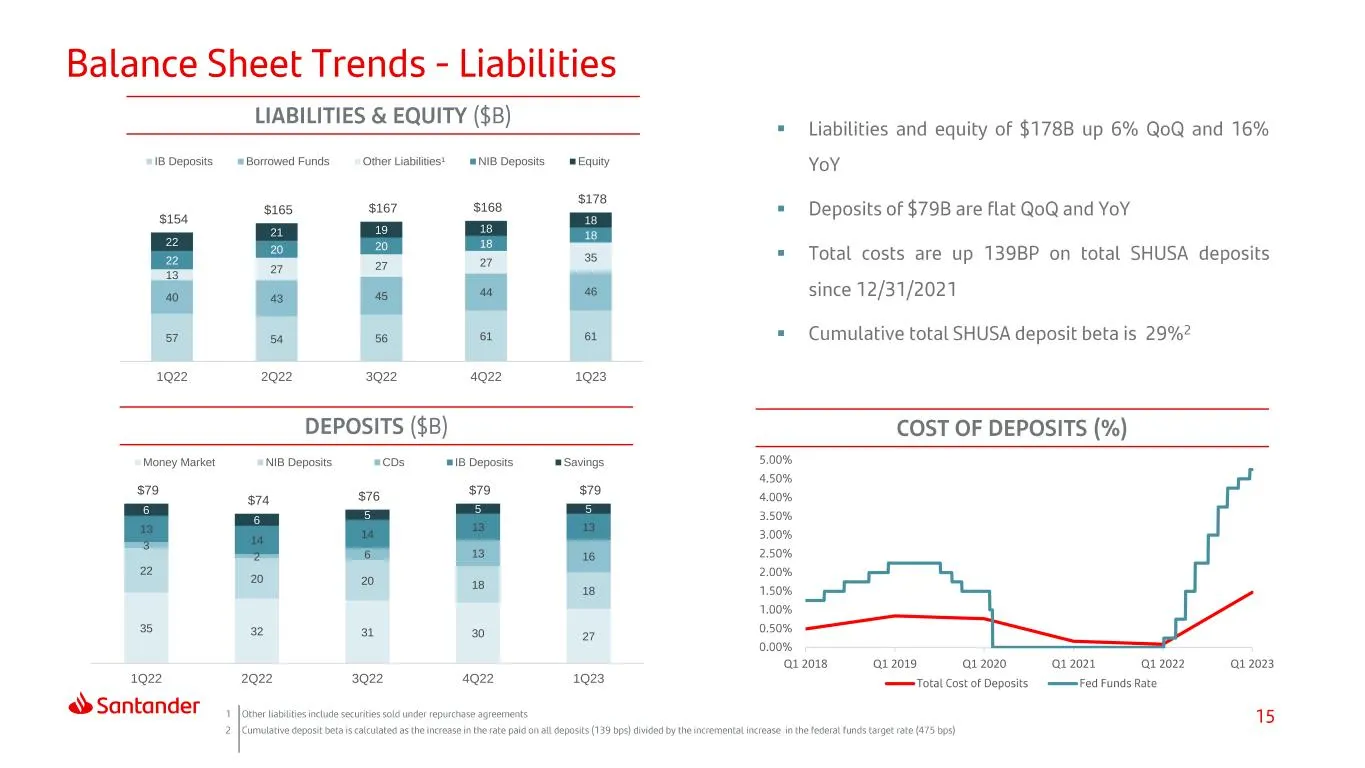
57 54 56 61 61 40 43 45 44 46 13 27 27 27 3522 20 20 18 18 22 21 19 18 18$154 $165 $167 $168 $178 1Q22 2Q22 3Q22 4Q22 1Q23 IB Deposits Borrowed Funds Other Liabilities¹ NIB Deposits Equity 35 32 31 30 27 22 20 20 18 18 3 2 6 13 16 13 14 14 13 13 6 6 5 5 5 $79 $74 $76 $79 $79 1Q22 2Q22 3Q22 4Q22 1Q23
Slide 16: SHUSA NIM interest rate risk sensitivity
• SHUSA NIM INTEREST RATE RISK SENSITIVITY (Change in annual net interest income for parallel rate movements)
Slide 17: Auto originations
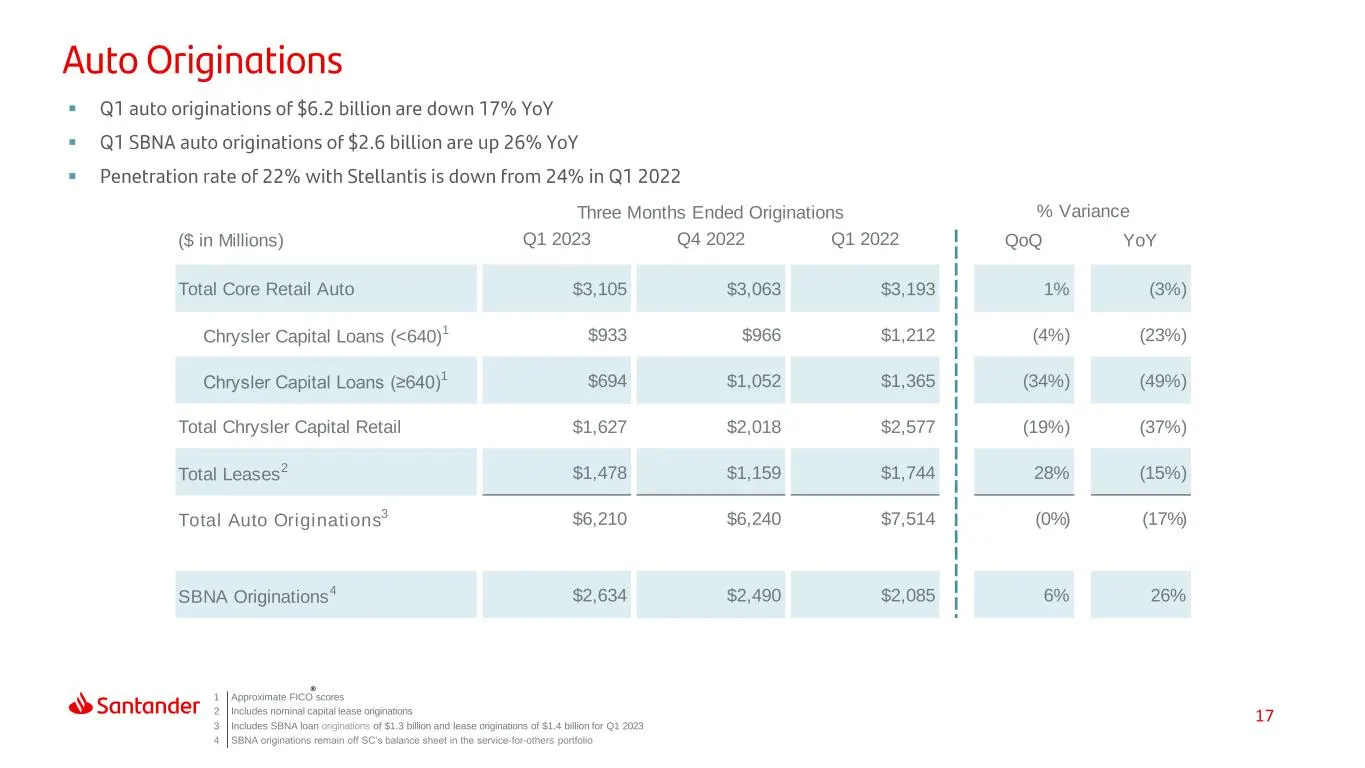
▪ ▪ ▪ 17 1 Approximate FICO scores 2 Includes nominal capital lease originations 3 Includes SBNA loan originations of $1.3 billion and lease originations of $1.4 billion for Q1 2023 4 SBNA originations remain off SC’s balance sheet in the service-for-others portfolio Three Months Ended Originations
Slide 18: Auto Loan Distribution
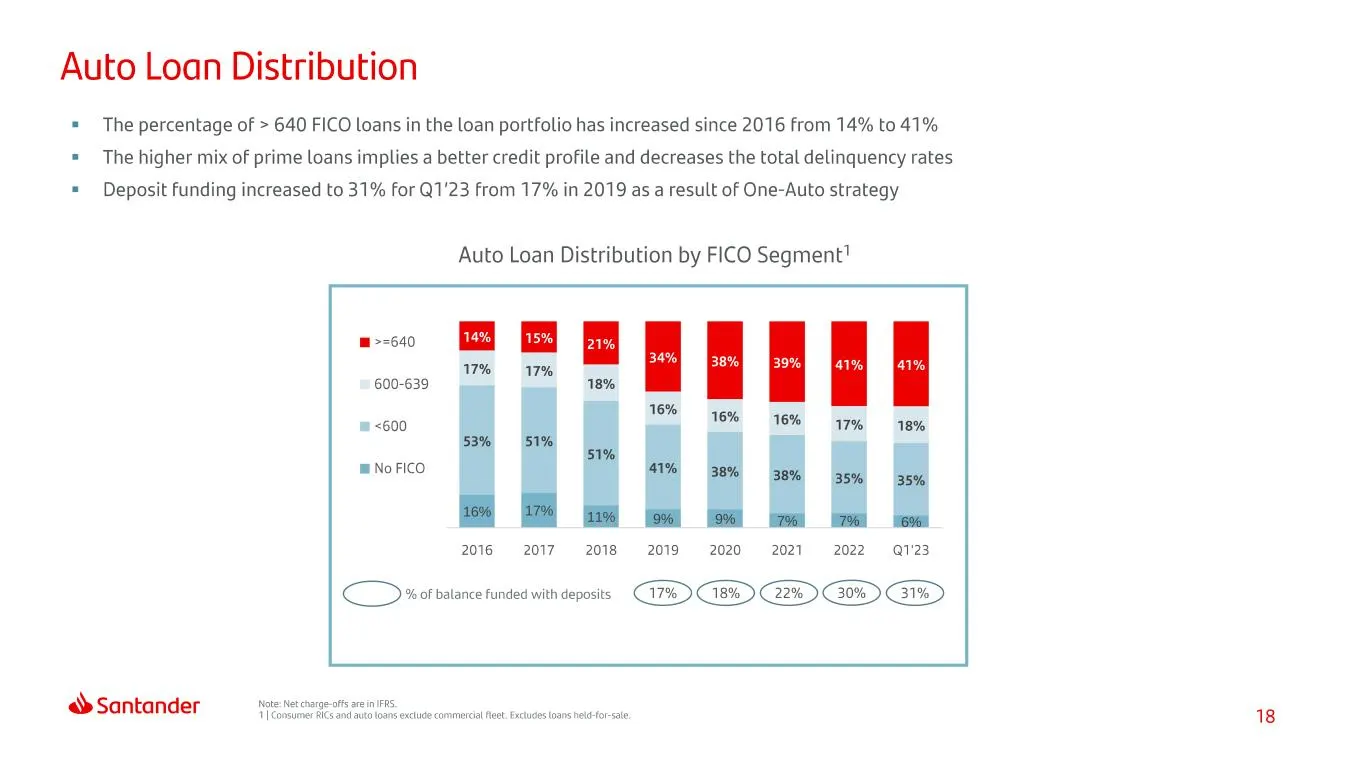
Auto Loan Distribution = The percentage of > 640 FICO Loans in the loan portfolio has increased since 2016 from 14% to 41% = The higher mix of prime loans implies a better credit profile and decreases the total delinquency rates = Deposit Funding increased to 31% for Q1'23 from 17% in 2019 as a resu
Slide 19: Past due loans: commercial and consumer
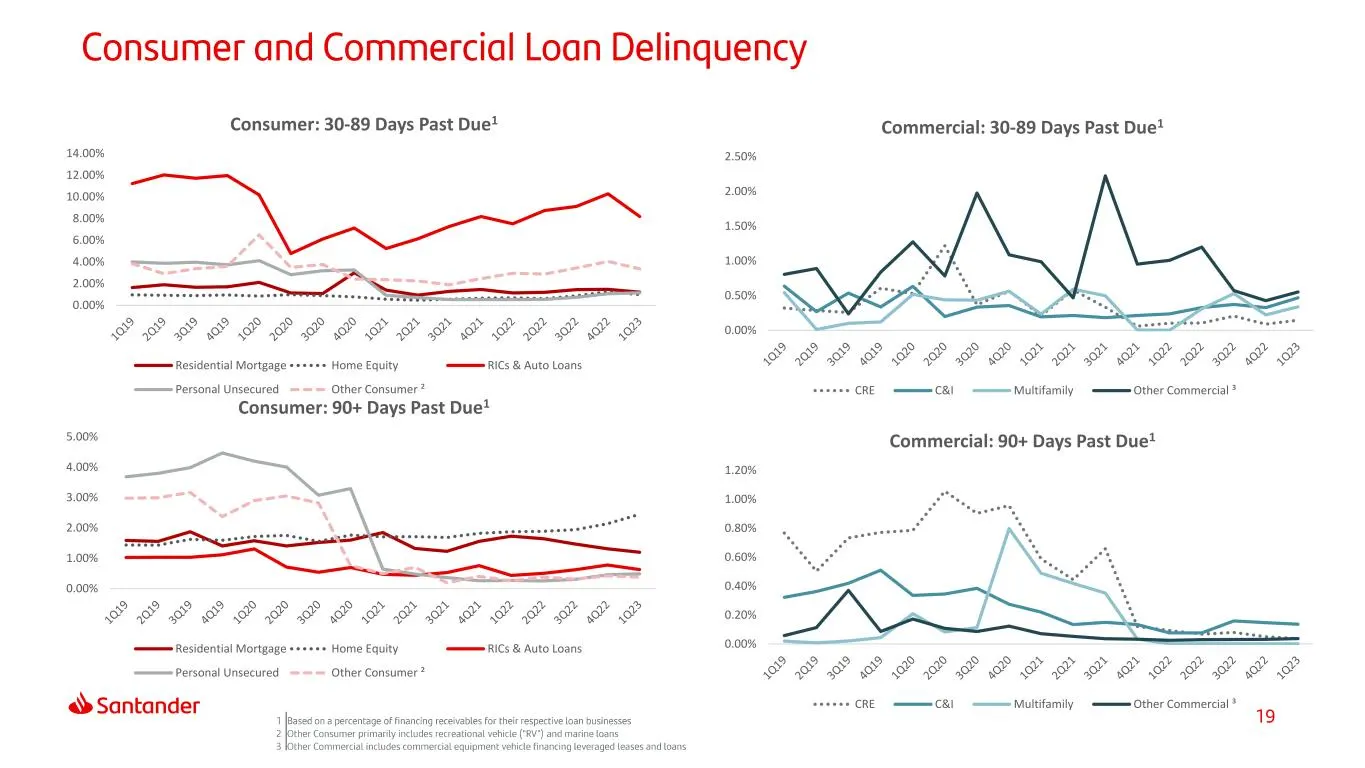
0.00% 0.50% 1.00% 1.50% 2.00% 2.50% Commercial: 30-89 Days Past Due1 CRE C&I Multifamily Other Commercial ³ 0.00% 0.20% 0.40% 0.60% 0.80% 1.00% 1.20% Commercial: 90+ Days Past Due1 CRE C&I Multifamily Other Commercial ³ 0.00% 2.00% 4.00% 6.00% 8.00% 10.00% 12.00% 14.00% Consumer: 30-89 Days Past Due
Slide 20: Net charge-offs and recoveries
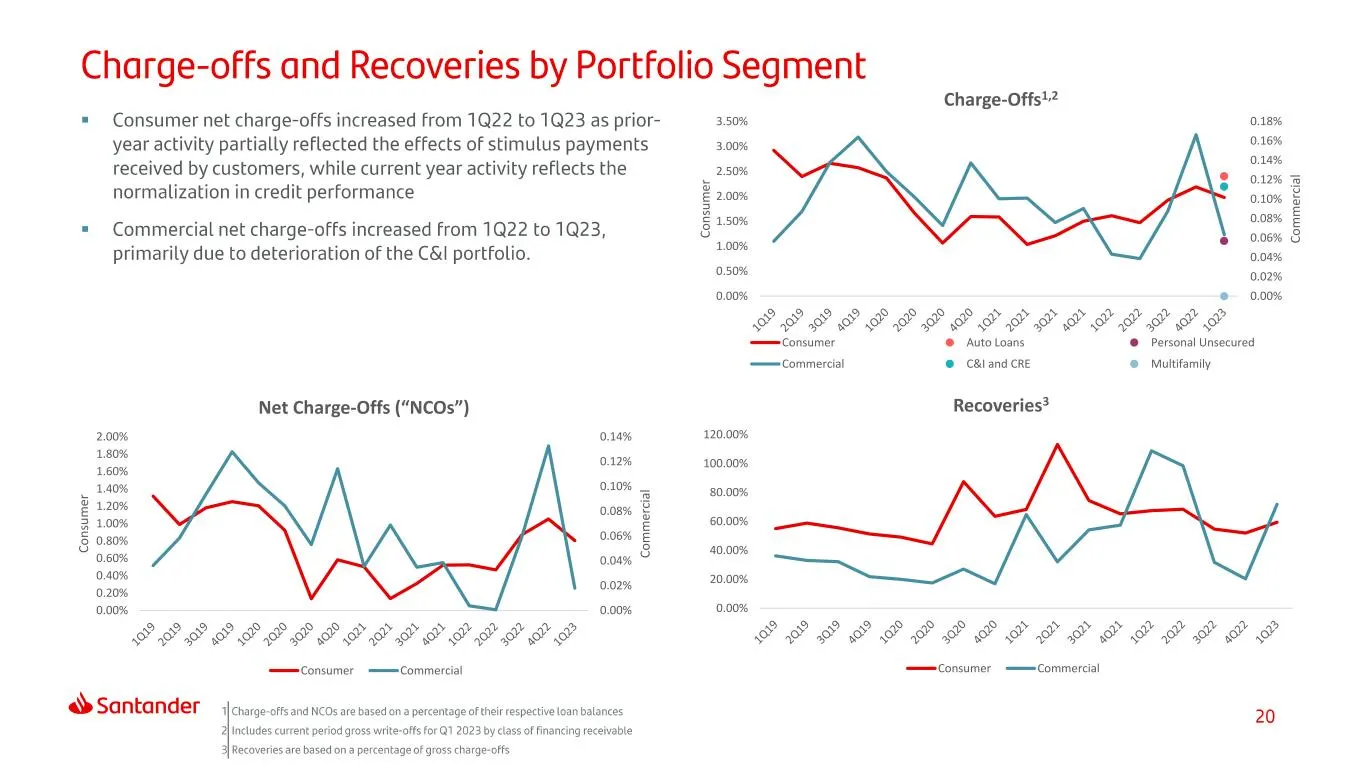
▪ ▪ 0.00% 20.00% 40.00% 60.00% 80.00% 100.00% 120.00% Recoveries3 Consumer Commercial 0.00% 0.02% 0.04% 0.06% 0.08% 0.10% 0.12% 0.14% 0.00% 0.20% 0.40% 0.60% 0.80% 1.00% 1.20% 1.40% 1.60% 1.80% 2.00% C o m m er ci al C o n su m er Net Charge-Offs (“NCOs”) Consumer Commercial 0.00% 0.02% 0.04% 0.06%
Slide 21: Allowance ratios
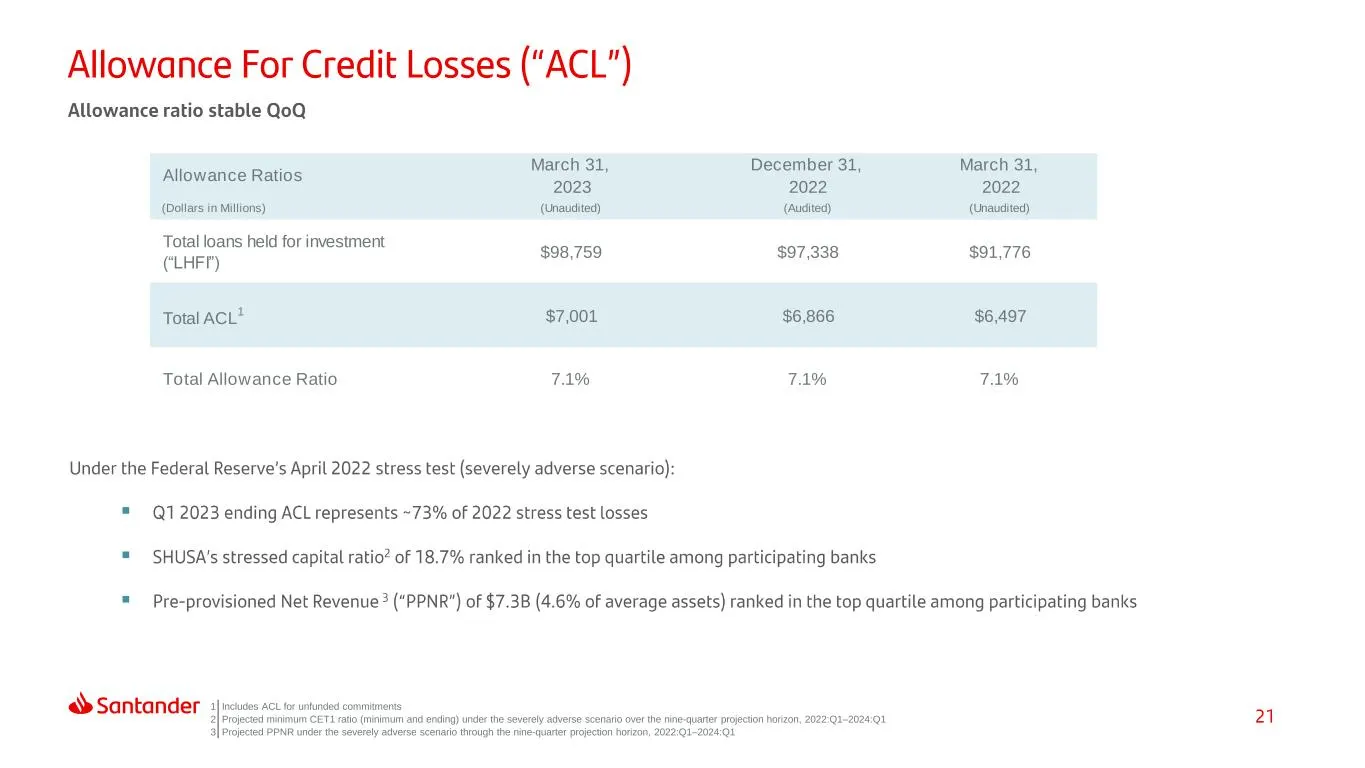
▪ ▪ ▪ 1 Includes ACL for unfunded commitments 2 Projected minimum CET1 ratio (minimum and ending) under the severely adverse scenario over the nine-quarter projection horizon, 2022:Q1–2024:Q1 3 Projected PPNR under the severely adverse scenario through the nine-quarter projection horizon, 2022:Q1–20
Slide 22: Index
Index At a Glance Recent Areas Results Capital & of Focus Liquidity
Slide 23: SHUSA funding
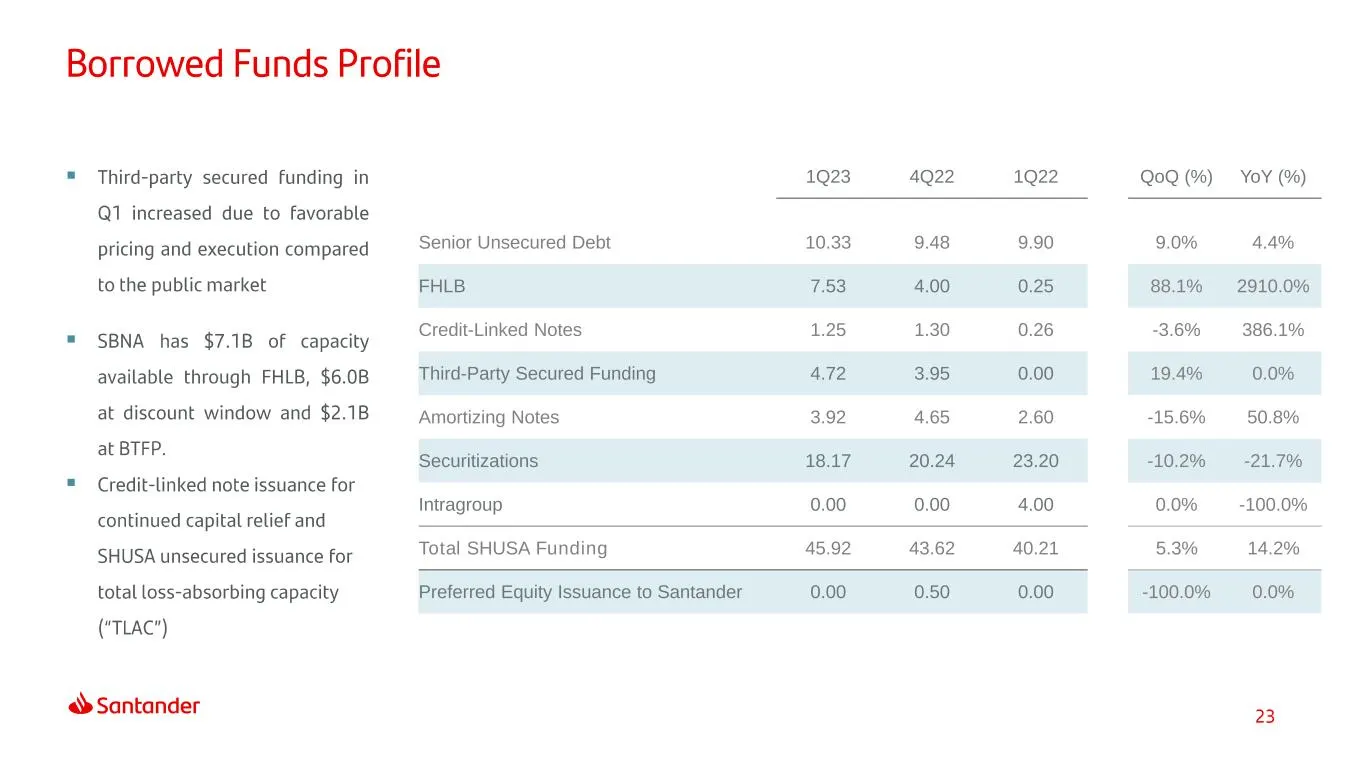
▪ ▪ ▪ 1Q23 4Q22 1Q22 QoQ (%) YoY (%) Senior Unsecured Debt 10.33 9.48 9.90 9.0% 4.4% FHLB 7.53 4.00 0.25 88.1% 2910.0% Credit-Linked Notes 1.25 1.30 0.26 -3.6% 386.1% Third-Party Secured Funding 4.72 3.95 0.00 19.4% 0.0% Amortizing Notes 3.92 4.65 2.60 -15.6% 50.8% Securitizations 18.17 20.24 23.20
Slide 24: Debt & TLAC
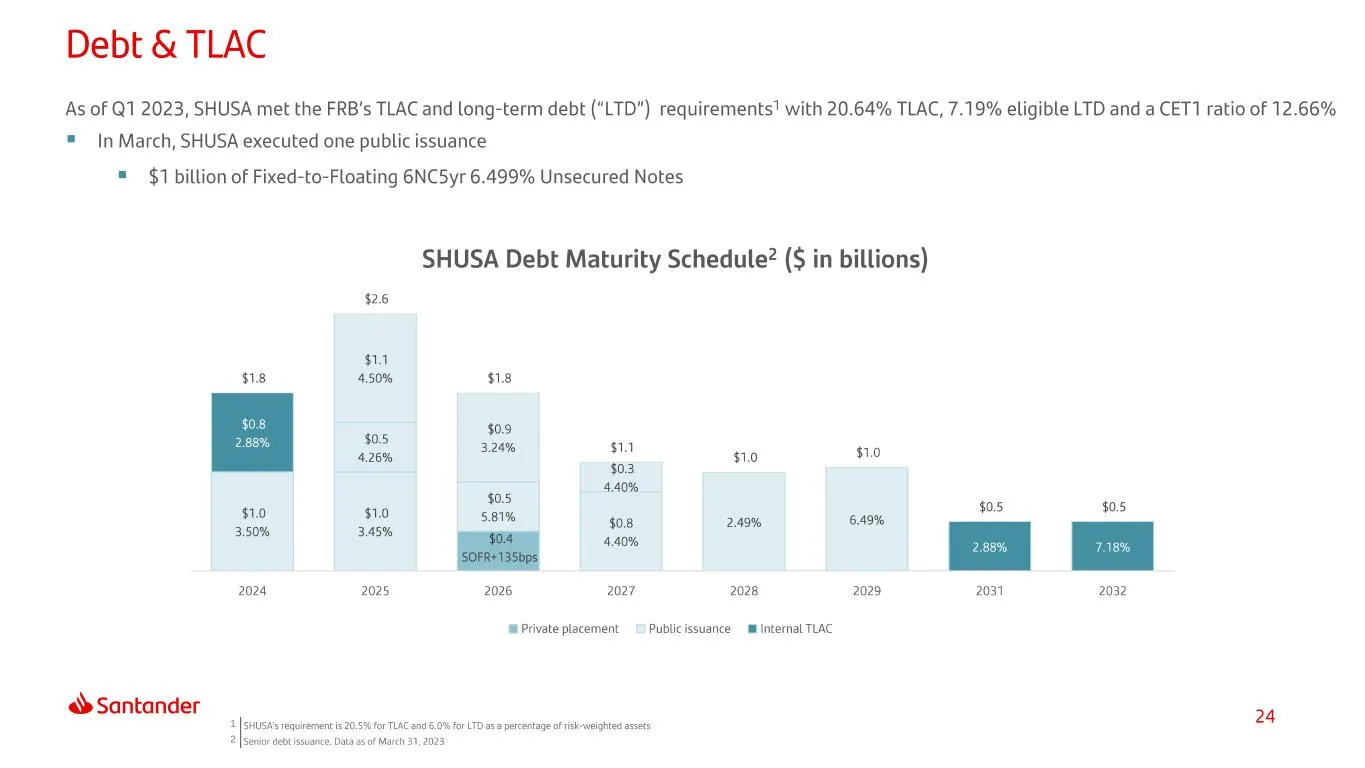
Debt & TLAC As of Q1 2023, SHUSA met the FRB's TLAC and long-term debt ("LTD") requirements! with 20.64% TLAC, 7.19% eligible LTD and a CET1 ratio of 12.66% = In March, SHUSA executed one public issuance = $1 billion of Fixed-to-Floating 6NC5yr 6.499% Unsecured Notes SHUSA Debt Maturity Schedule? ($
Slide 25: Regulatory capital ratios
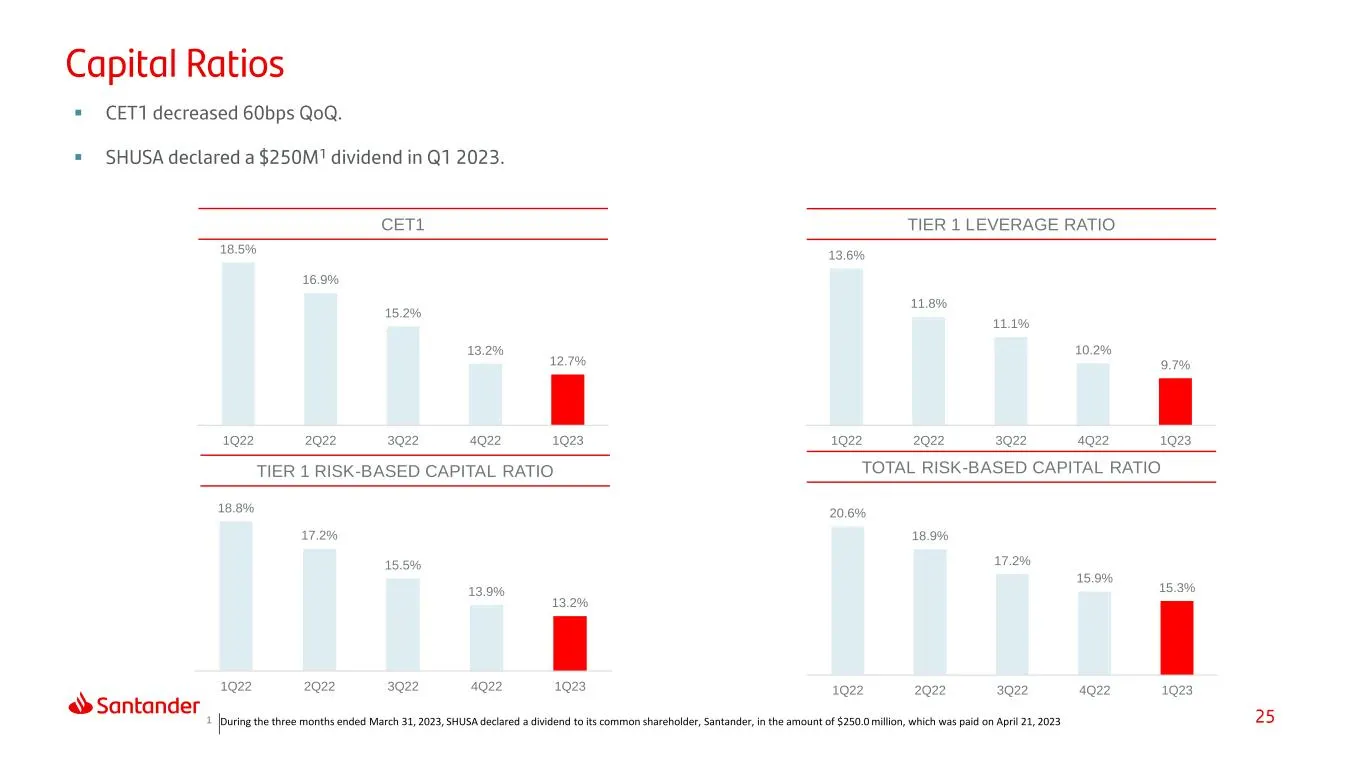
CET1 TIER 1 RISK-BASED CAPITAL RATIO TOTAL RISK-BASED CAPITAL RATIO TIER 1 LEVERAGE RATIO ▪ ▪ 18.5% 16.9% 15.2% 13.2% 12.7% 1Q22 2Q22 3Q22 4Q22 1Q23 13.6% 11.8% 11.1% 10.2% 9.7% 1Q22 2Q22 3Q22 4Q22 1Q23 18.8% 17.2% 15.5% 13.9% 13.2% 1Q22 2Q22 3Q22 4Q22 1Q23 20.6% 18.9% 17.2% 15.9% 15.3% 1Q22 2Q22 3Q
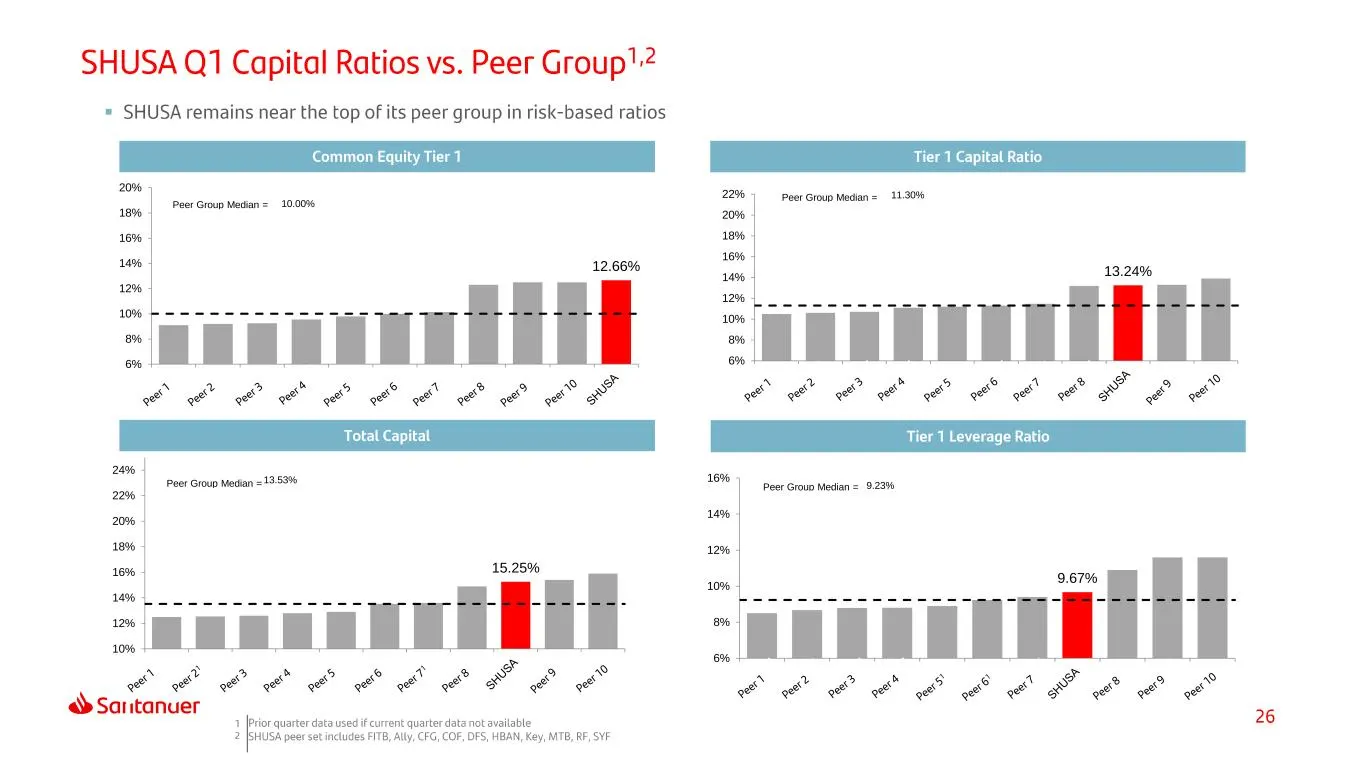
Slide 26: Capital ratios vs peer group median
▪ 12.66% 10.00% 6% 8% 10% 12% 14% 16% 18% 20% Peer Group Median = 13.24% 11.30% 6% 8% 10% 12% 14% 16% 18% 20% 22% Peer Group Median = 15.25% 13.53% 10% 12% 14% 16% 18% 20% 22% 24% Peer Group Median = 9.67% 9.23% 6% 8% 10% 12% 14% 16% Peer Group Median =
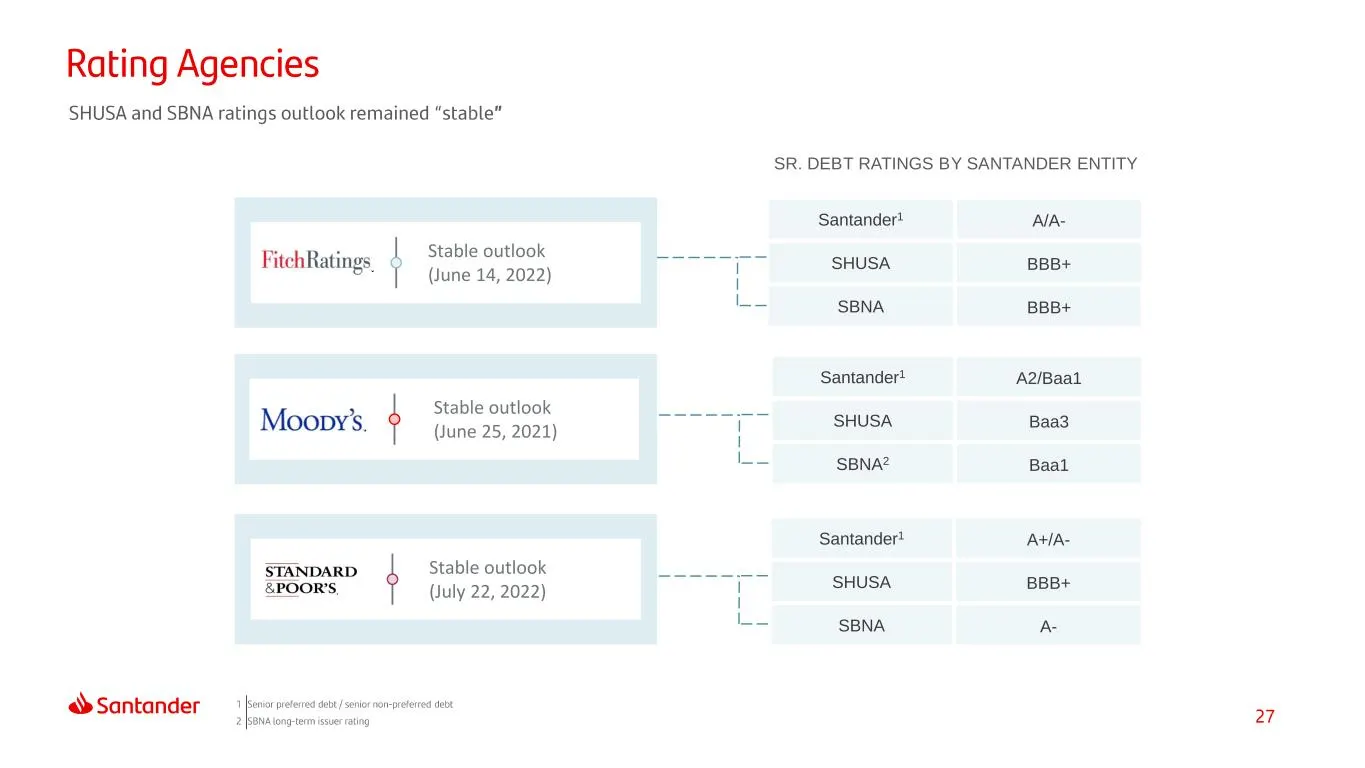
Slide 27: Senior debt ratings by Santander entity
Santander1 A2/Baa1 SHUSA Baa3 SBNA2 Baa1 Santander1 A+/A- SHUSA BBB+ SBNA A- Stable outlook (June 14, 2022) SR. DEBT RATINGS BY SANTANDER ENTITY Santander1 A/A- SHUSA BBB+ SBNA BBB+ Stable outlook (June 25, 2021) Stable outlook (July 22, 2022)
Slide 28: Index
Index At a Glance Recent Areas Results Capital & Appendix of Focus
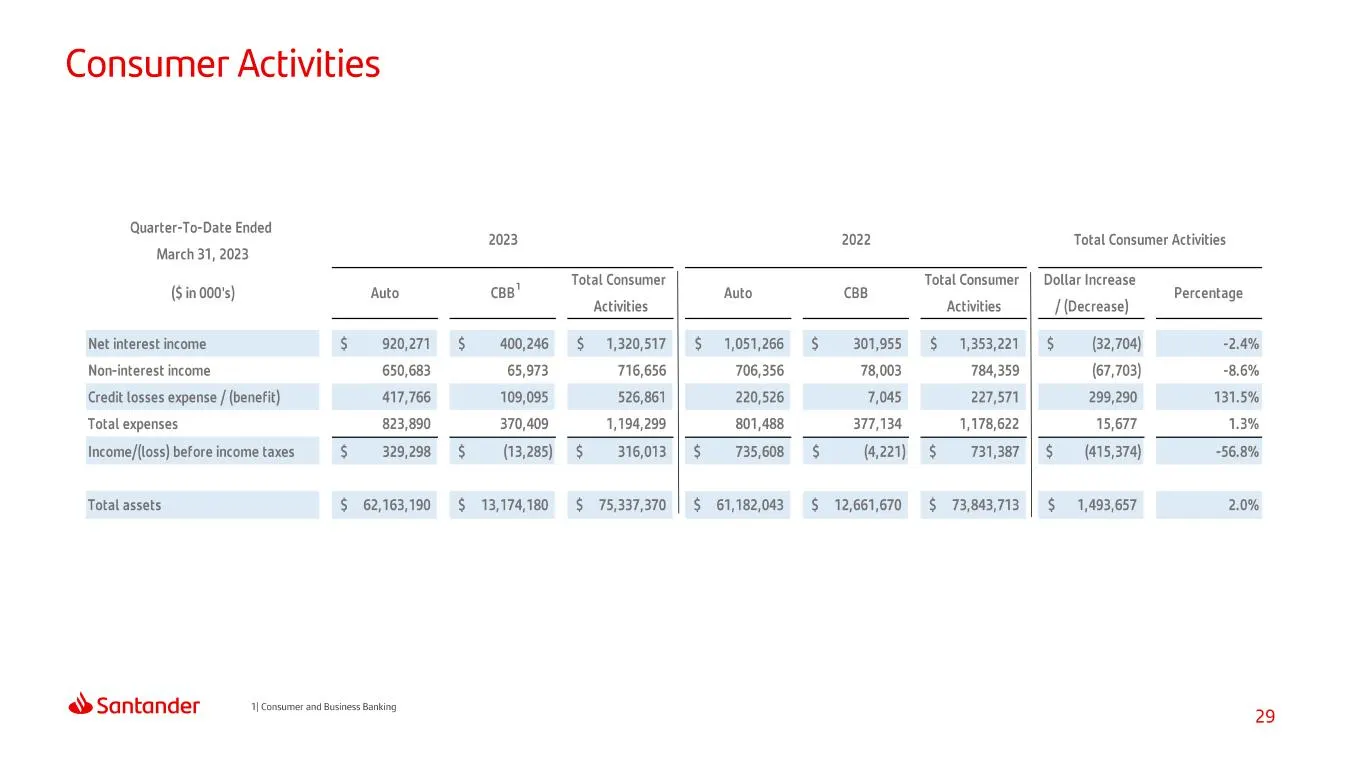
Slide 29: Consumer Activities
Consumer Activities Quarter-To-Date Ended March 31, 2023 (in 000's) Net interest income Non-interest income Credit losses expense / (benefit) Total expenses Income/(loss) before income taxes Total assets 2023 2022 Total Consumer Activities 4 Total Consumer Total Consumer | Dollar Increase Auto eB _
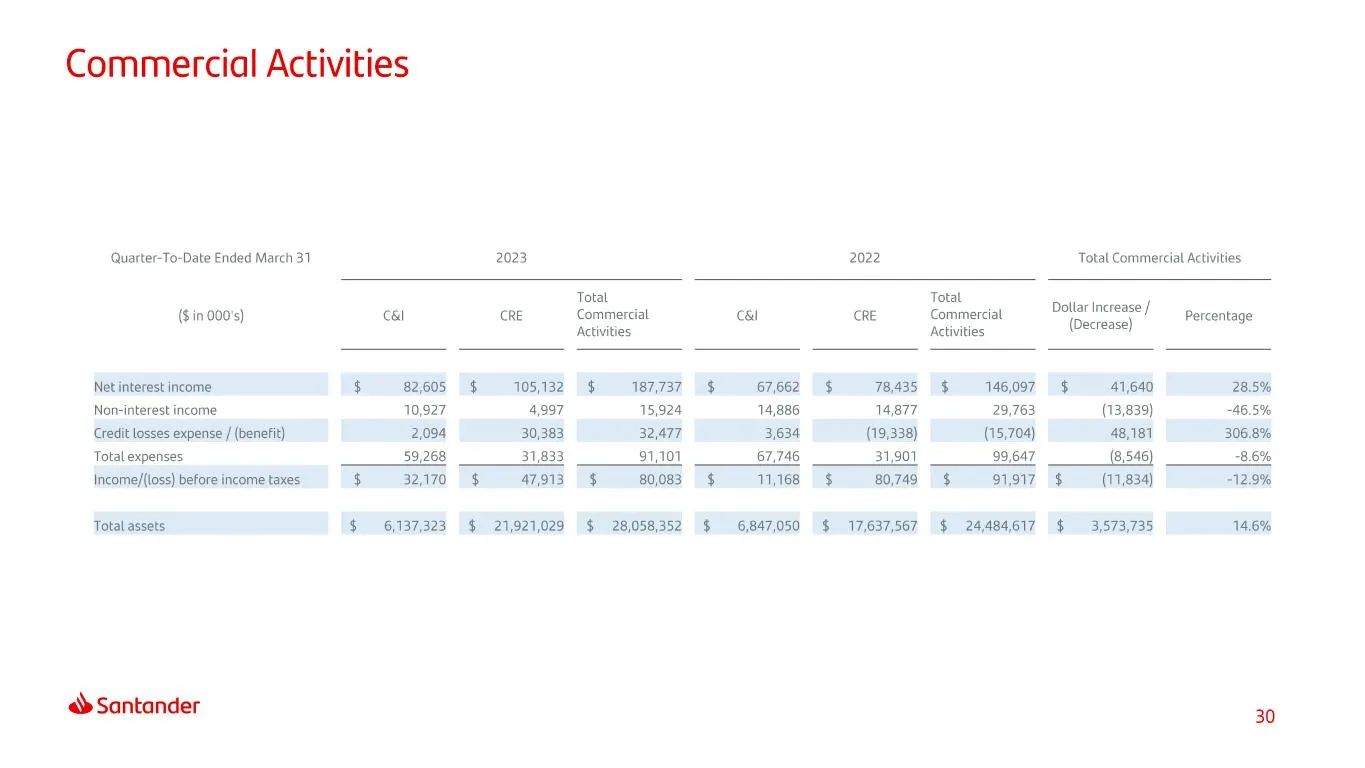
Slide 30: Commercial Activities
Commercial Activities Quarter-To-Date Ended March 31 2023 2022 Total Commercial Activities Total Total ($in 00's) cél CRE Commercial er) CRE Commercial Activi Activities Non-interest income 10,927 4,997 15,924 14,886 14,877 29,763 (13,839) 46.5% Total expenses 59,268 31,833 91,101 67,746 31,901 99,6
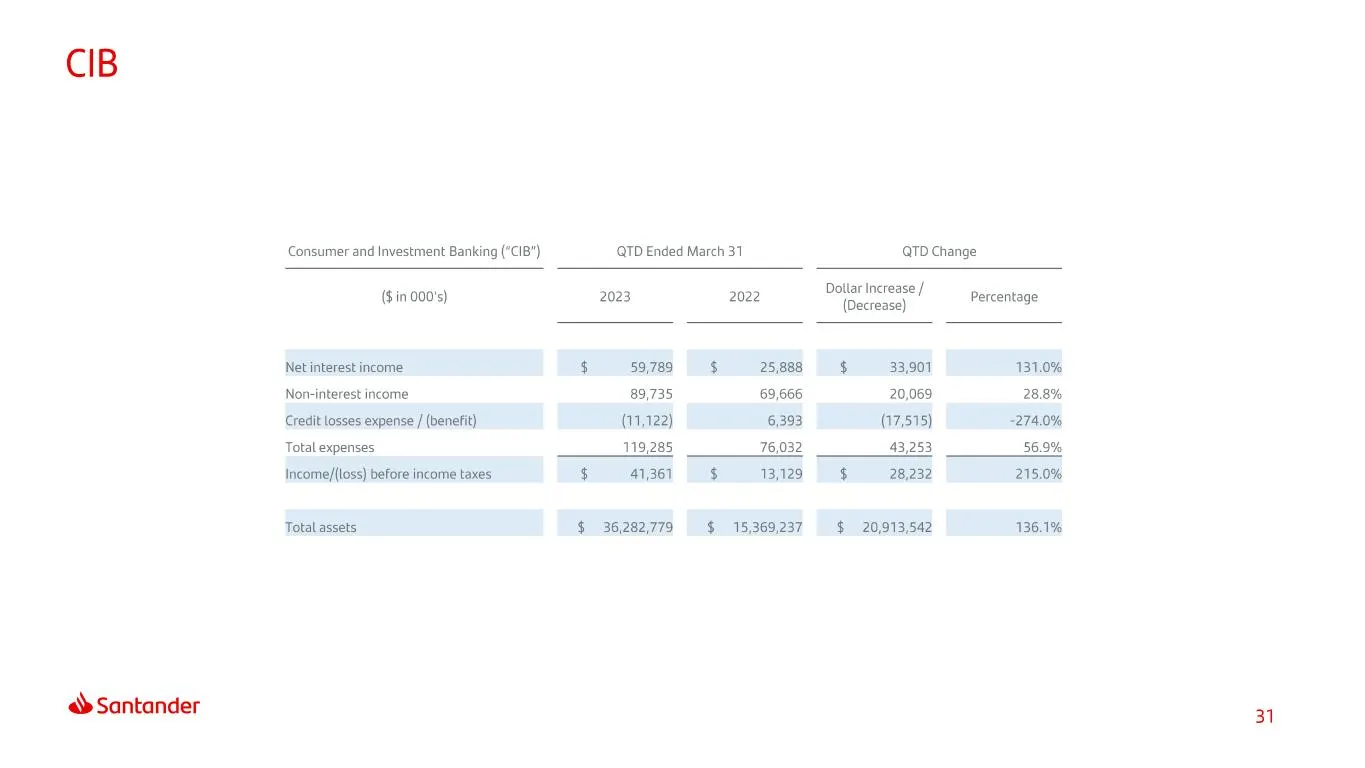
Slide 31: CIB
CIB Santander ‘Consumer and Investment Banking ("CIB") QTD Ended March 31 QTD Change ($in 00's) 2023 2022 a slid Percentage Non-interest income 89,735 69,666 20,069 28.8% Hone 119,285 76,032 43,253 56.9% 31
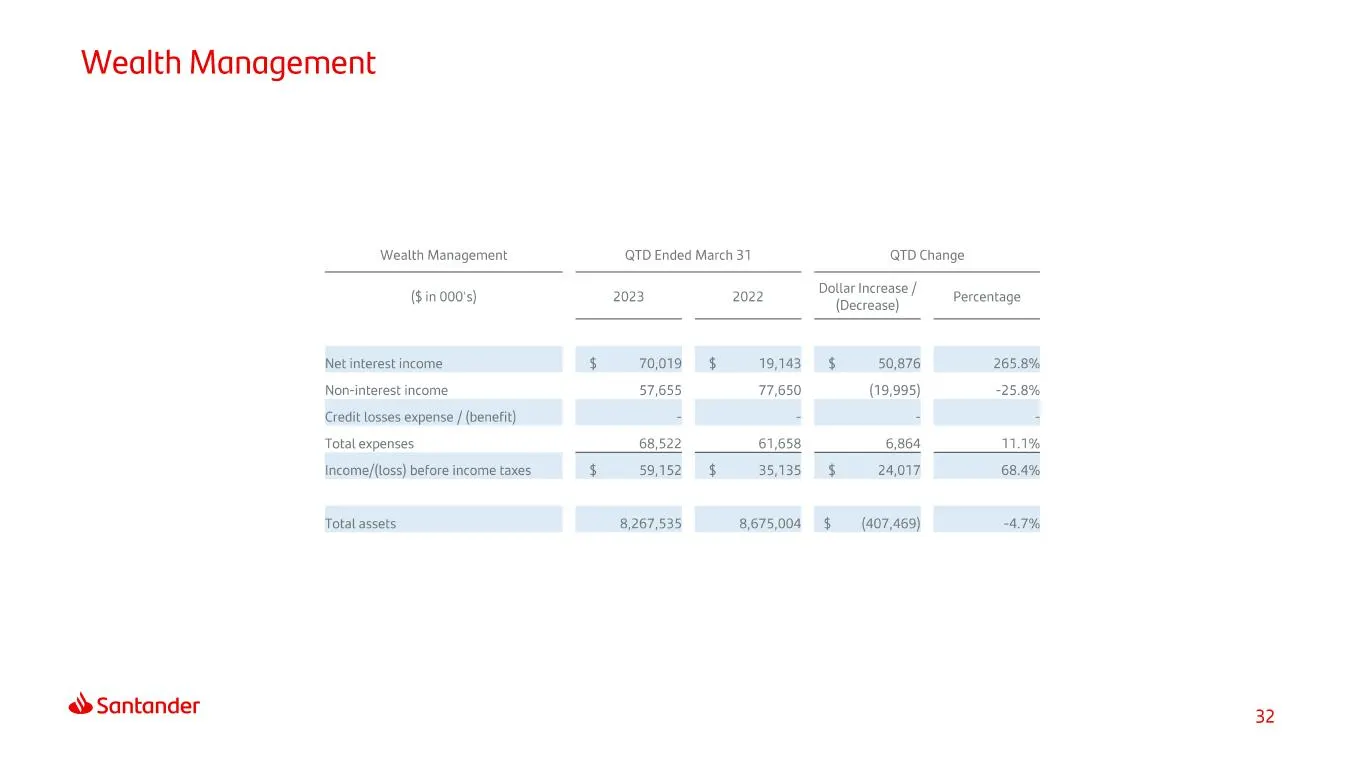
Slide 32: Wealth Management
Wealth Management «> Santander Wealth Management QTD Ended March 31 QTD Change Dollar increase / (Decrease) Non-interest income 57,655 77,650 (19,995) -25.8% 68,522 61,658 11.1% Total expenses 6,864 ($ in 00's) 2023 2022 Percentage 32
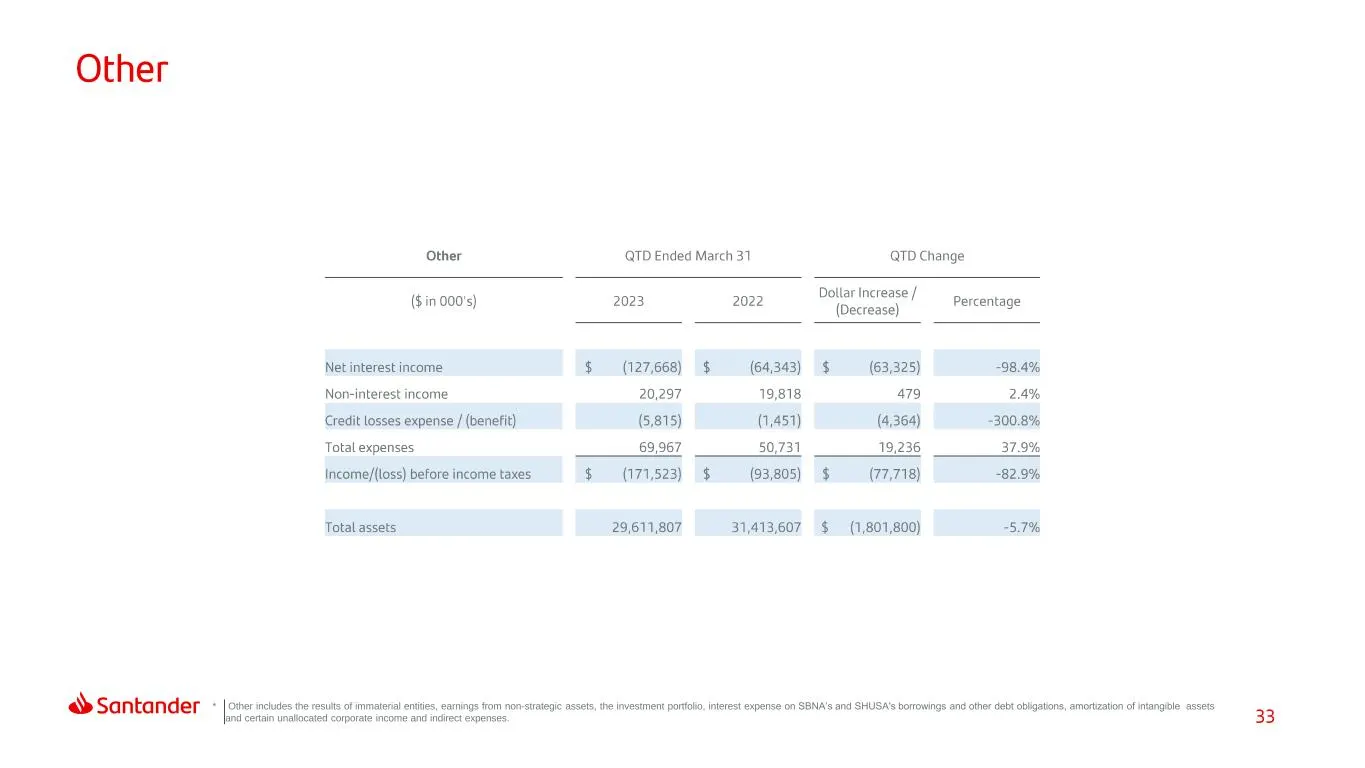
Slide 33: Other segment notes
* Other includes the results of immaterial entities, earnings from non-strategic assets, the investment portfolio, interest expense on SBNA’s and SHUSA's borrowings and other debt obligations, amortization of intangible .assets and certain unallocated corporate income and indirect expenses.
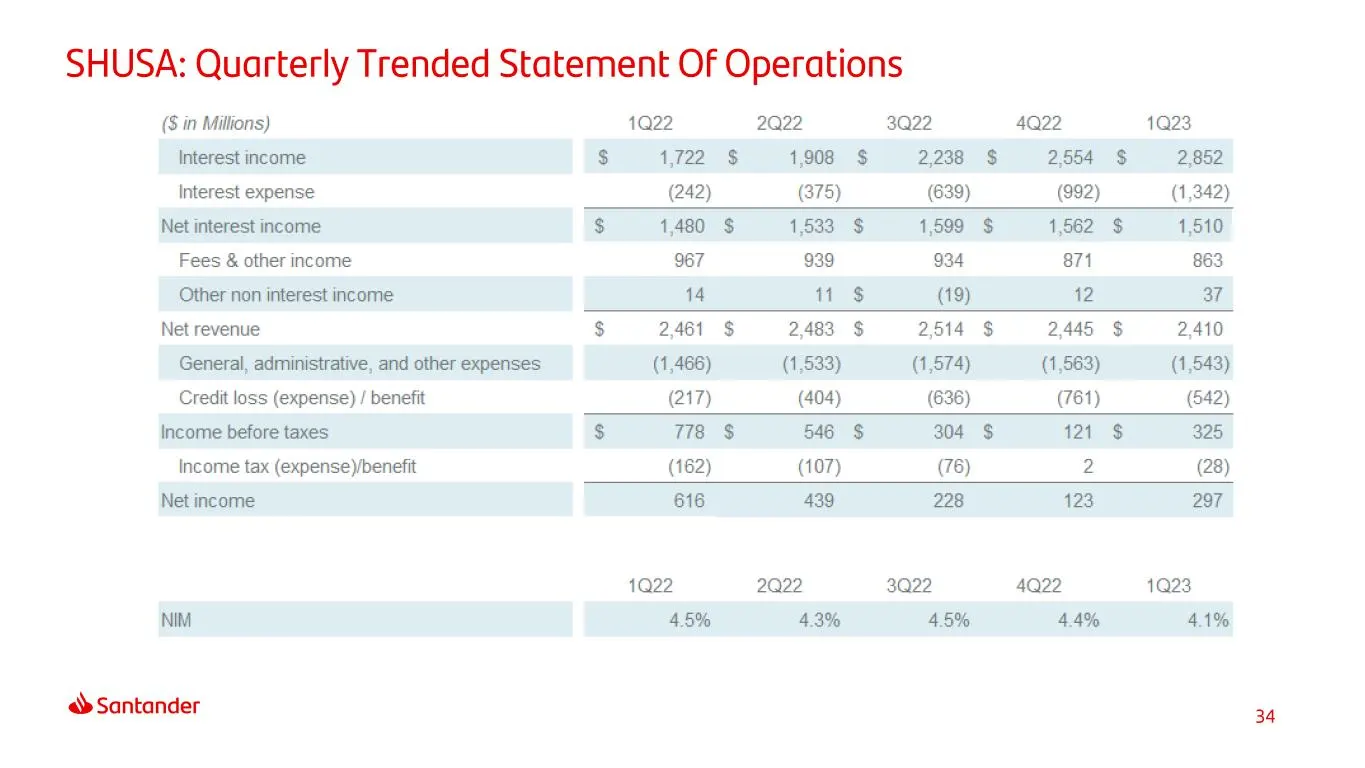
Slide 34: SHUSA: Quarterly Trended Statement Of Operations
SHUSA: Quarterly Trended Statement Of Operations ($ in Millions) 1Q22 2Q22 3Q22 4Q22 1Q23 Interest income $ 1,722 $ 1,908 $ 2,238 $ 2,554 $ 2,852 Interest expense (242) (375) (639) (992) (1,342) Net interest income $ 1,480 $ 1533'S 1,599 $ 1,562 $ 1,510 Fees & other income 967 939 934 871 863 Other
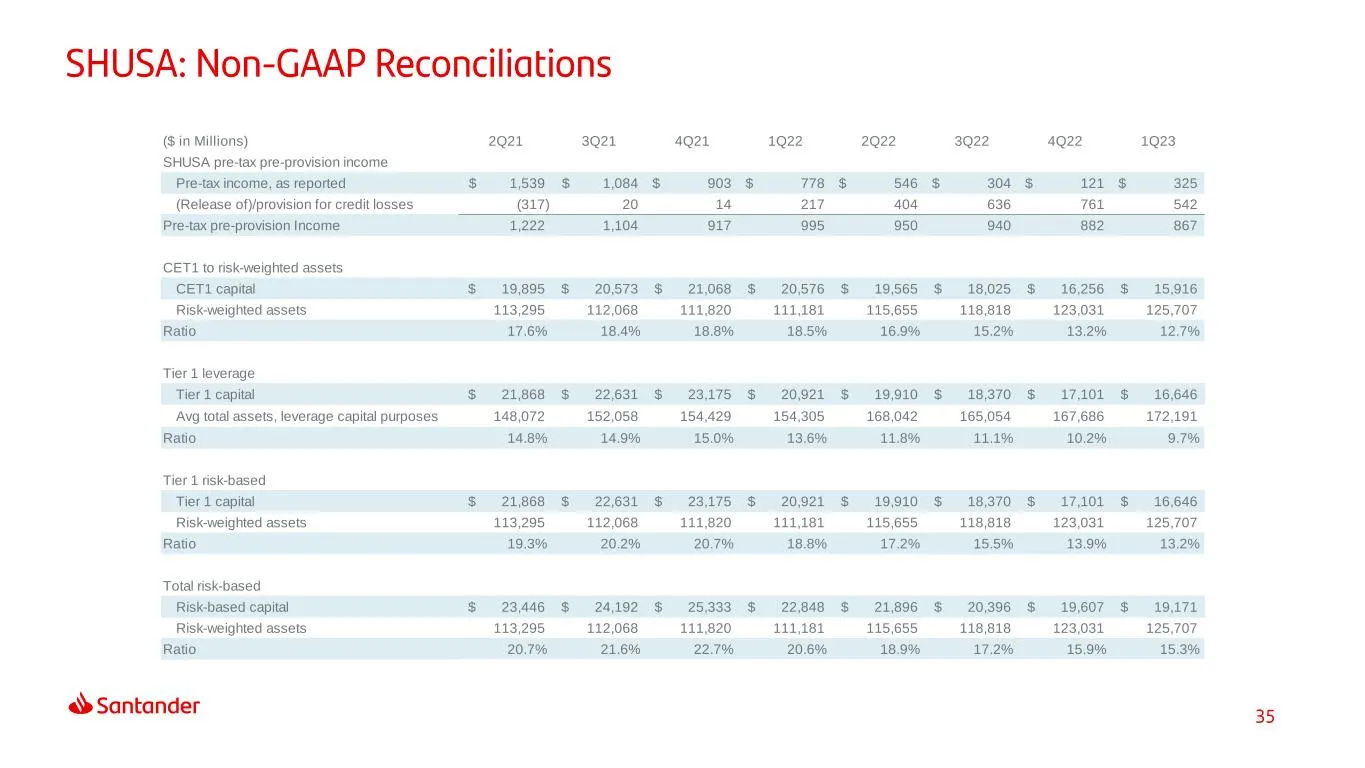
Slide 35: Non-GAAP reconciliations
($ in Millions) 2Q21 3Q21 4Q21 1Q22 2Q22 3Q22 4Q22 1Q23 SHUSA pre-tax pre-provision income Pre-tax income, as reported 1,539$ 1,084$ 903$ 778$ 546$ 304$ 121$ 325$ (Release of)/provision for credit losses (317) 20 14 217 404 636 761 542 Pre-tax pre-provision Income 1,222 1,104 917 995 950 940 882 867
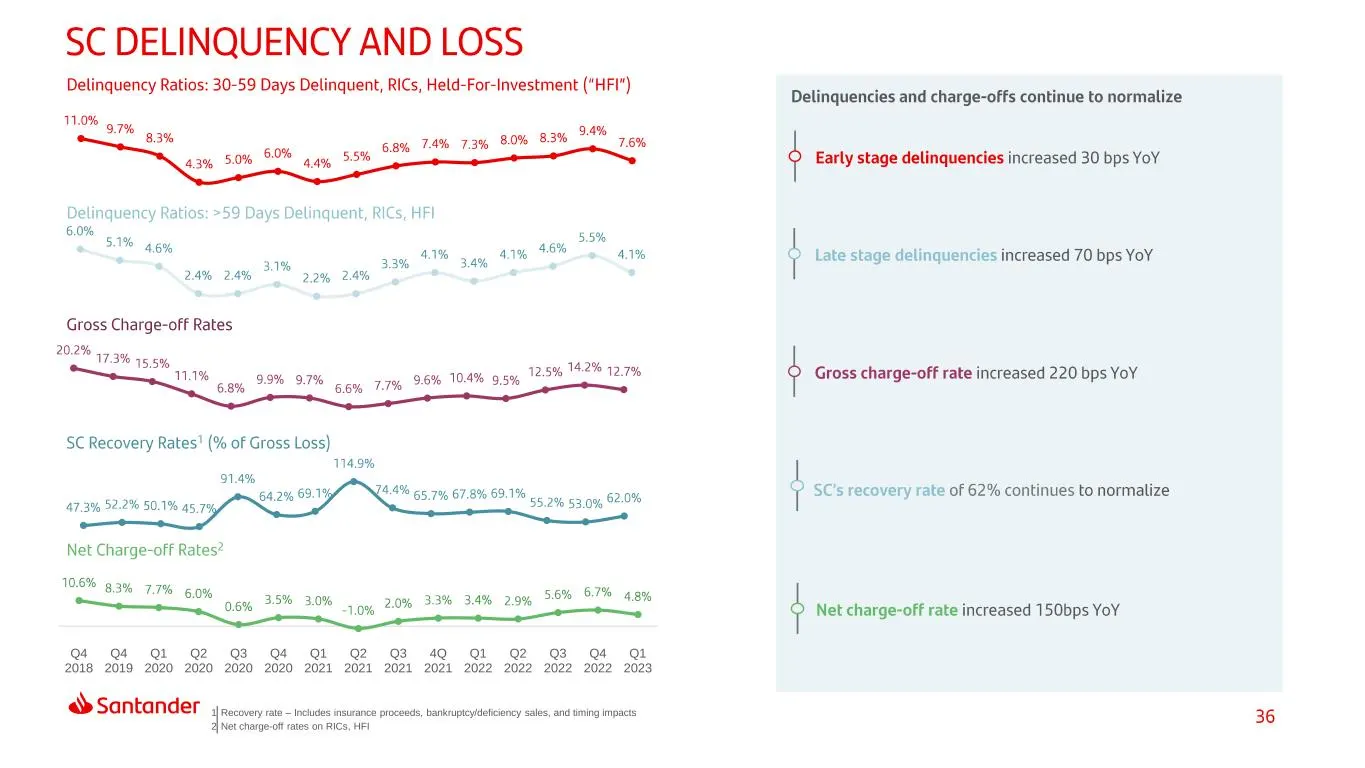
Slide 36: Recovery rate and net charge-off rates
1 Recovery rate – Includes insurance proceeds, bankruptcy/deficiency sales, and timing impacts 2 Net charge-off rates on RICs, HFI Q4 2018 Q4 2019 Q1 2020 Q2 2020 Q3 2020 Q4 2020 Q1 2021 Q2 2021 Q3 2021 4Q 2021 Q1 2022 Q2 2022 Q3 2022 Q4 2022 Q1 2023

Slide 37: Thank You.
Thank You. Our purpose is to help people and businesses prosper. Our culture is based on believing that everything we do should be: Simple Personal Fair, «> Santander Dow Jones Sustainability Indices Incotiaboration with RobecoSAM «> FTSE4Good
Source: SEC EDGAR · 8-K filed May 9, 2023
More decks from Santander Holdings USA Inc
 Debt Investor Presentation (August 2026)30 slides · Aug 12, 2026
 Debt Investor Presentation (August 2026)30 slides · Aug 12, 2026
 Debt Investor Presentation (June 2026)29 slides · Jun 12, 2026
 Debt Investor Presentation (June 2026)29 slides · Jun 12, 2026
 Debt Investor Presentation (March 2026)36 slides · Mar 6, 2026
 Debt Investor Presentation (March 2026)36 slides · Mar 6, 2026