Heartland Financial USA — Q2 2020 Earnings Presentation
10 slides from Heartland Financial USA's earnings presentation, Jul 27, 2020

Slide 1: COVID-19 Credit Overview: Commercial and Ag Portfolios, 2nd Quarter 2020
Heartland Financial USA, Inc. COVID-19 Credit Overview Commercial and Ag Portfolios 2nd Quarter 2020
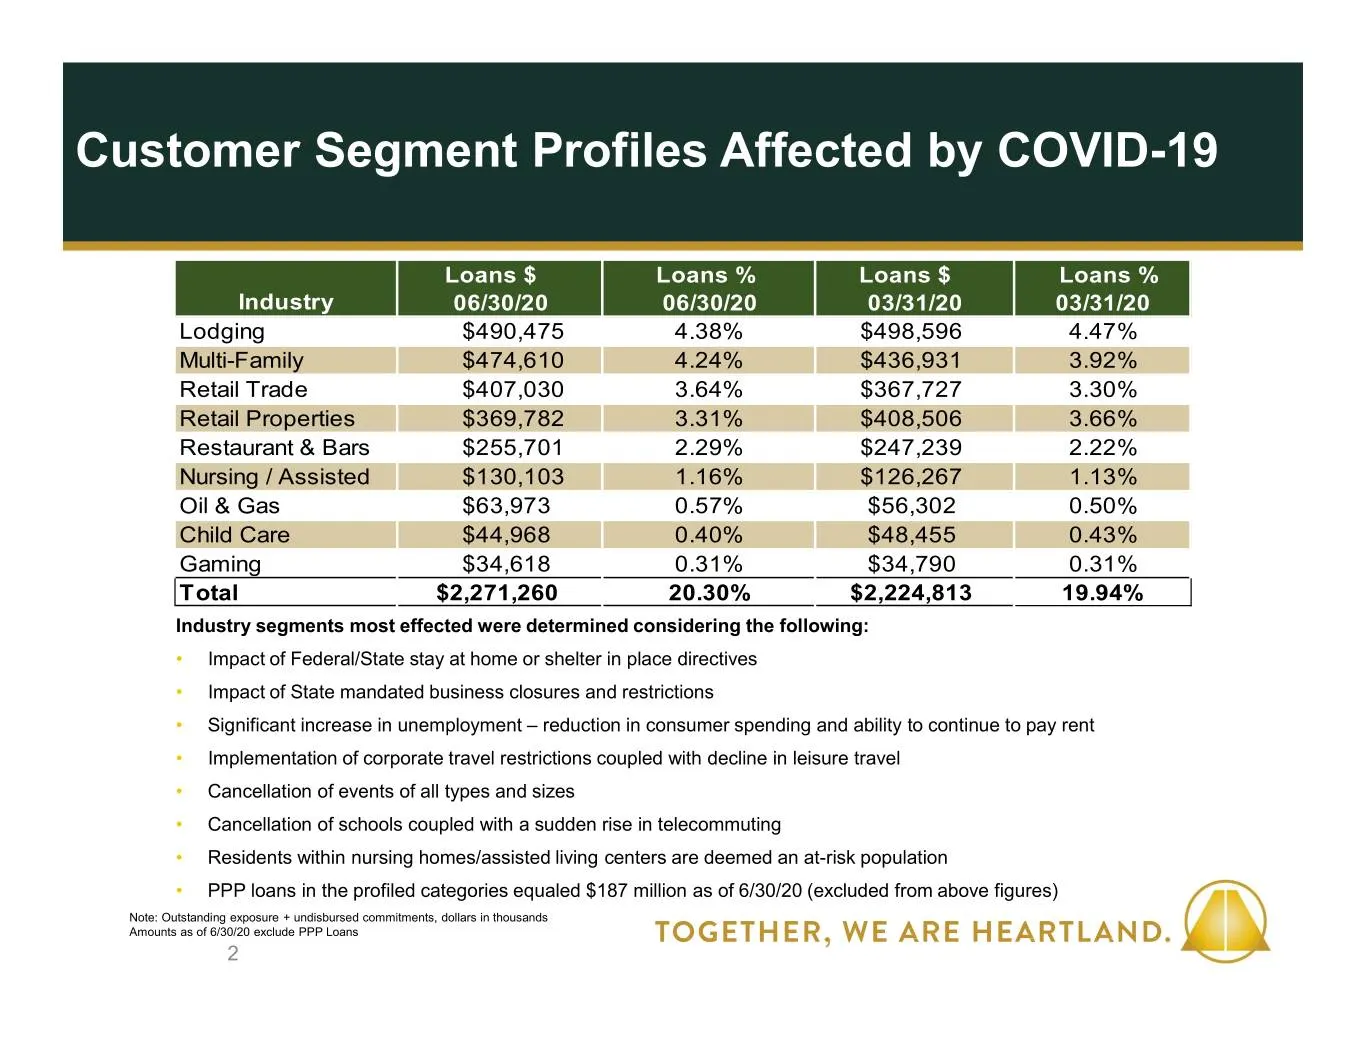
Slide 2: Customer Segment Profiles Affected by COVID-19
Customer Segment Profiles Affected by COVID-19 Loans $ Loans % Loans $ Loans % Industry 06/30/20 06/30/20 03/31/20 03/31/20 Lodging $490,475 4.38% $498,596 4.47% Multi-Family $474,610 4.24% $436,931 3.92% Retail Trade $407,030 3.64% $367,727 3.30% Retail Properties $369,782 3.31% $408,506 3.66% Rest
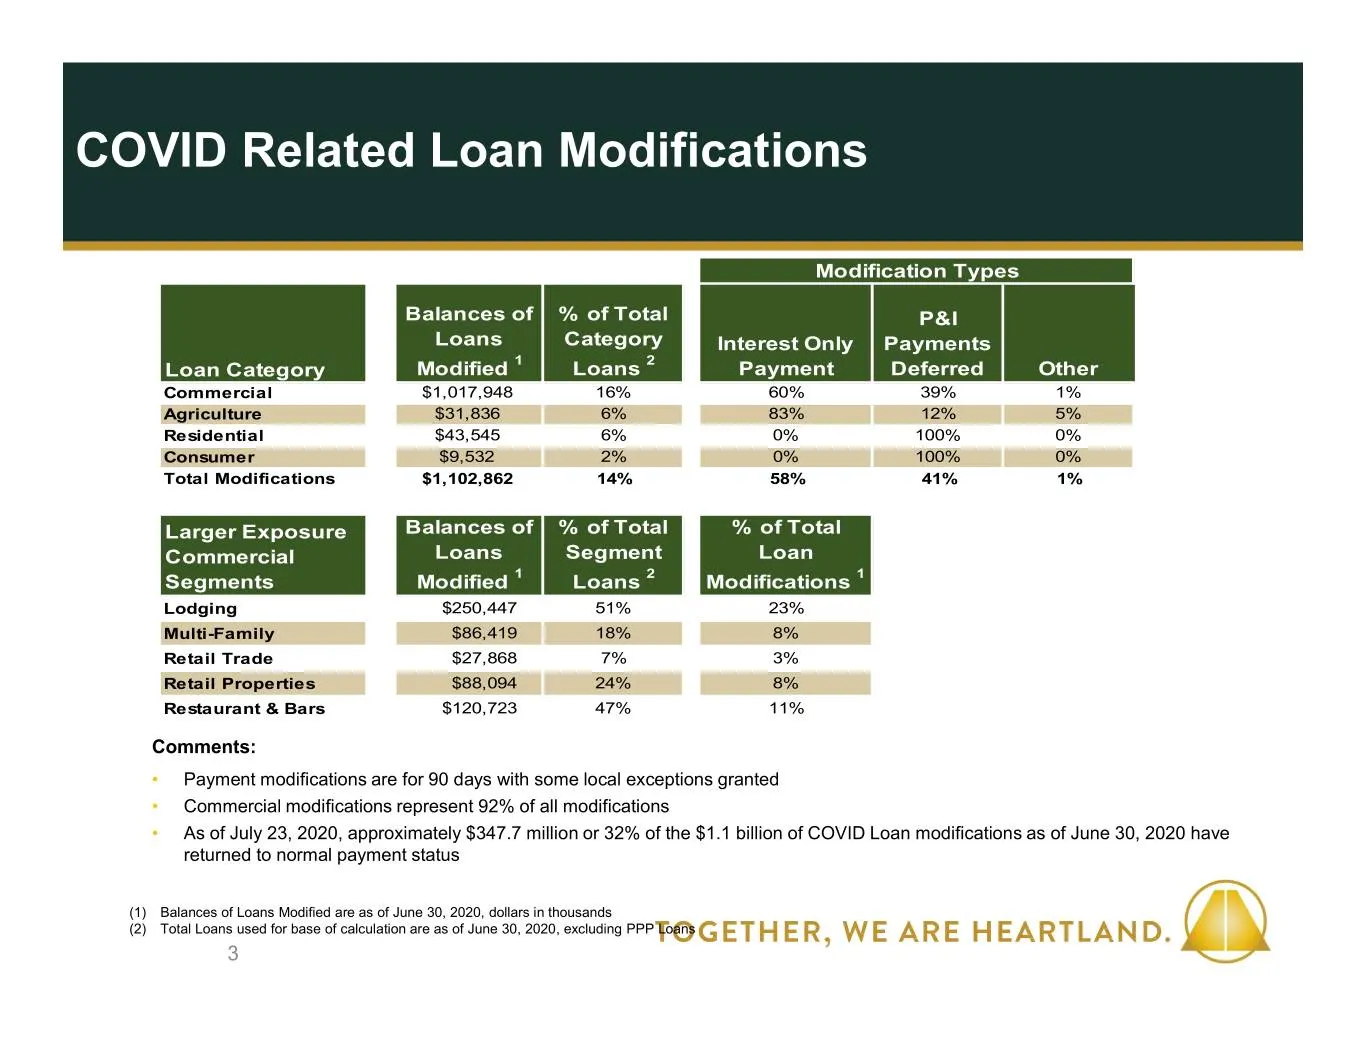
Slide 3: COVID Related Loan Modifications
COVID Related Loan Modifications Modification Types Balances of % of Total P&I Loans Category Interest Only Payments 1 2 Loan Category Modified Loans Payment Deferred Other Commercial $1,017,948 16% 60% 39% 1% Agriculture $31,836 6% 83% 12% 5% Residential $43,545 6% 0% 100% 0% Consumer $9,532 2% 0%
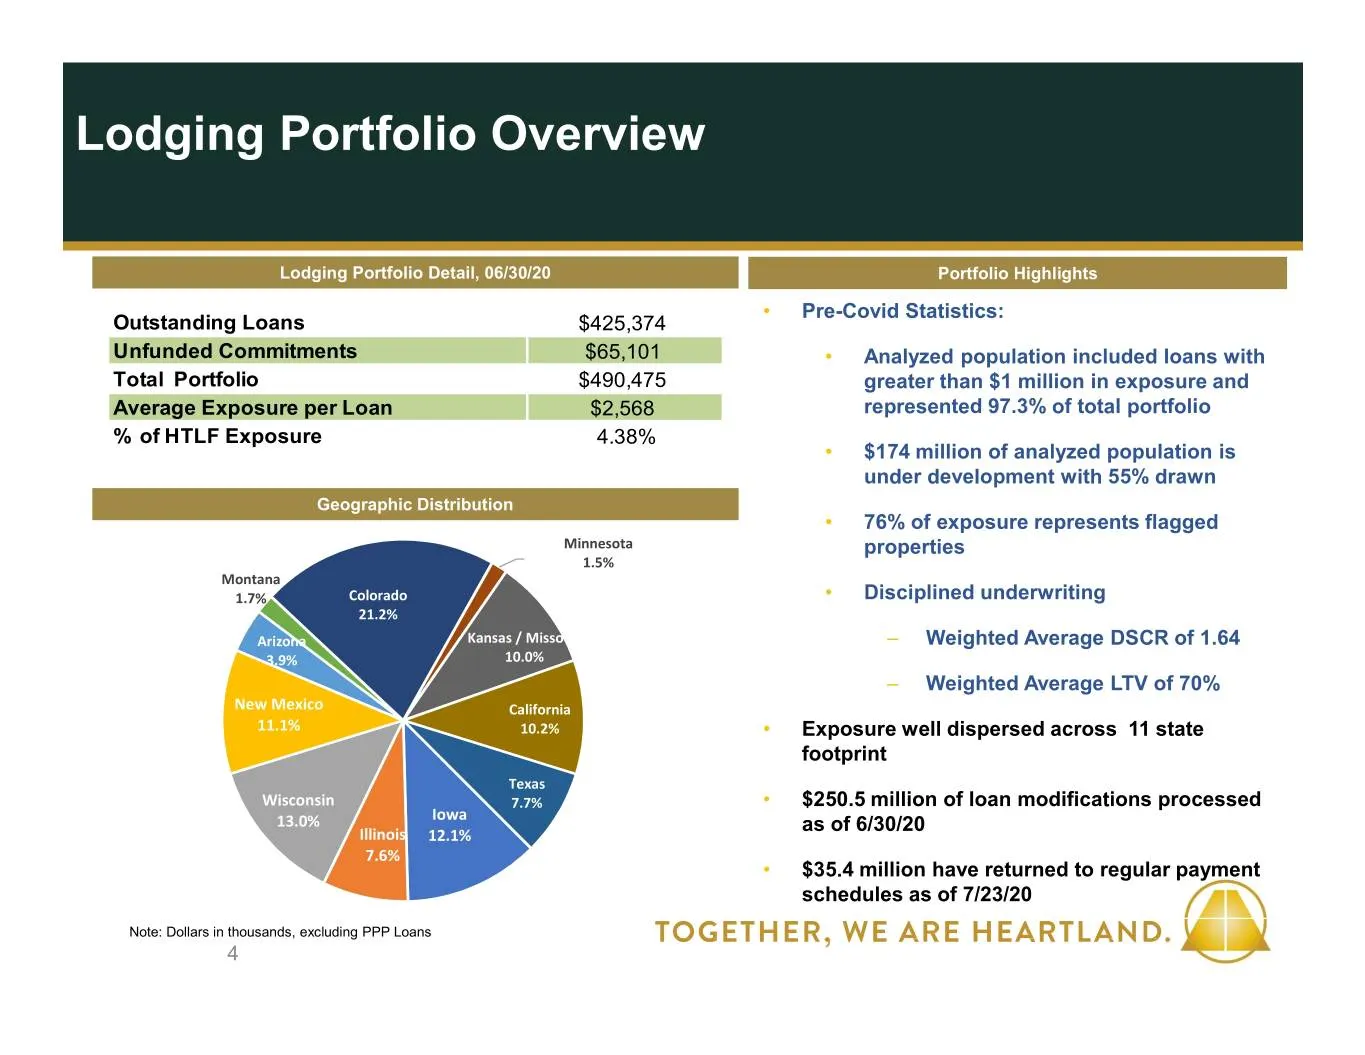
Slide 4: Lodging Portfolio Overview
Lodging Portfolio Overview Lodging Portfolio Detail, 06/30/20 Portfolio Highlights • Pre-Covid Statistics: Outstanding Loans $425,374 Unfunded Commitments $65,101 • Analyzed population included loans with Total Portfolio $490,475 greater than $1 million in exposure and Average Exposure per Loan $2,5
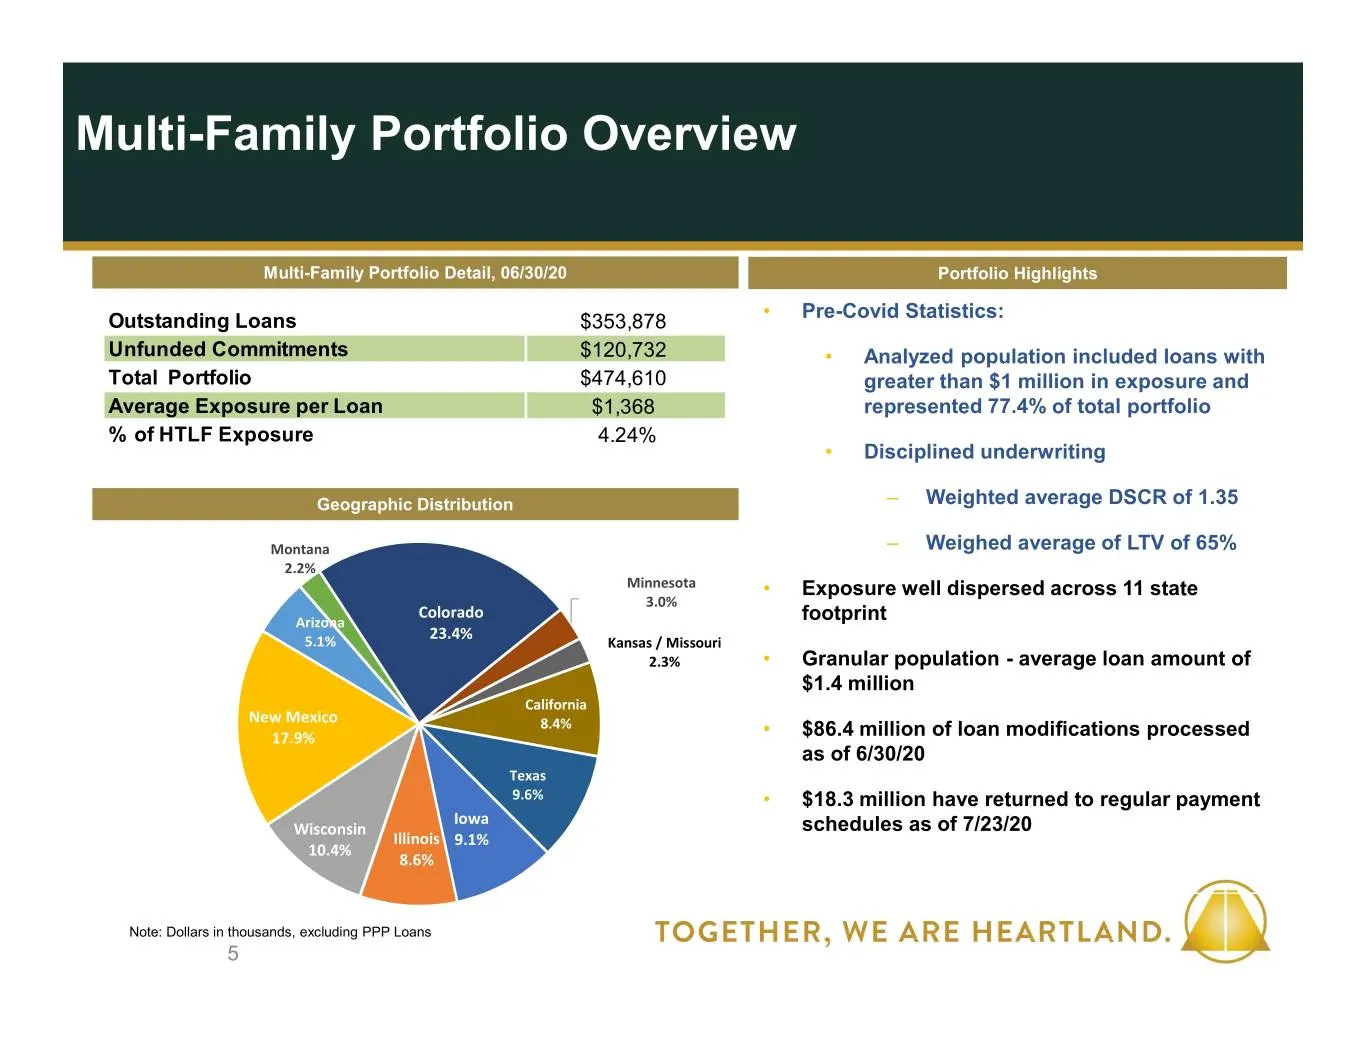
Slide 5: Multi-Family Portfolio Overview
Multi-Family Portfolio Overview Multi-Family Portfolio Detail, 06/30/20 Portfolio Highlights • Pre-Covid Statistics: Outstanding Loans $353,878 Unfunded Commitments $120,732 • Analyzed population included loans with Total Portfolio $474,610 greater than $1 million in exposure and Average Exposure pe
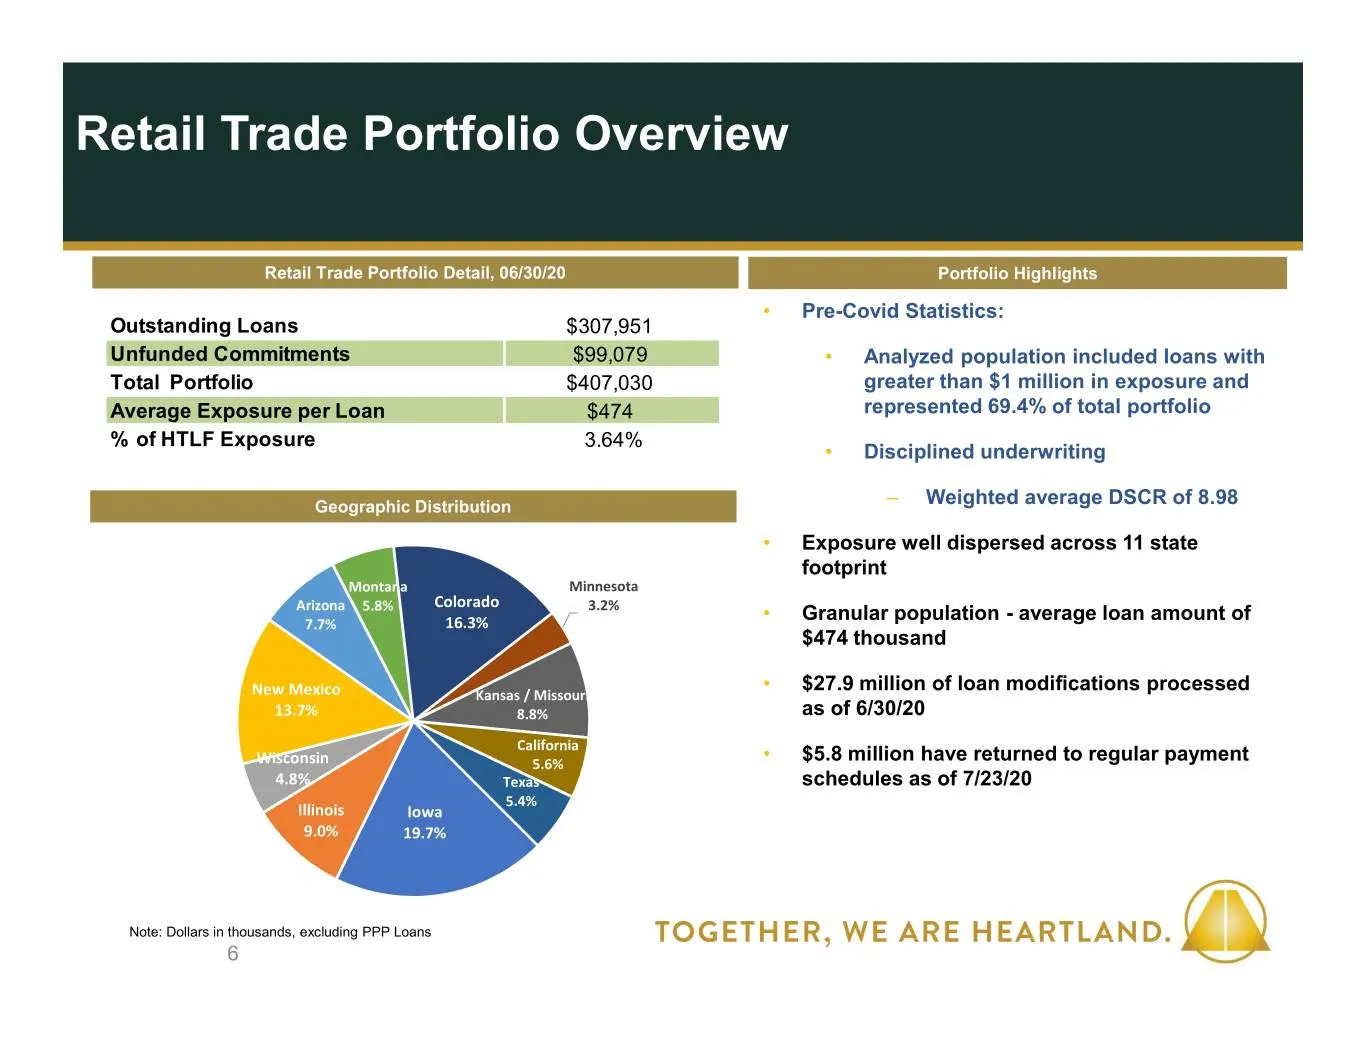
Slide 6: Retail Trade Portfolio Overview
Retail Trade Portfolio Overview Retail Trade Portfolio Detail, 06/30/20 Portfolio Highlights • Pre-Covid Statistics: Outstanding Loans $307,951 Unfunded Commitments $99,079 • Analyzed population included loans with Total Portfolio $407,030 greater than $1 million in exposure and Average Exposure per
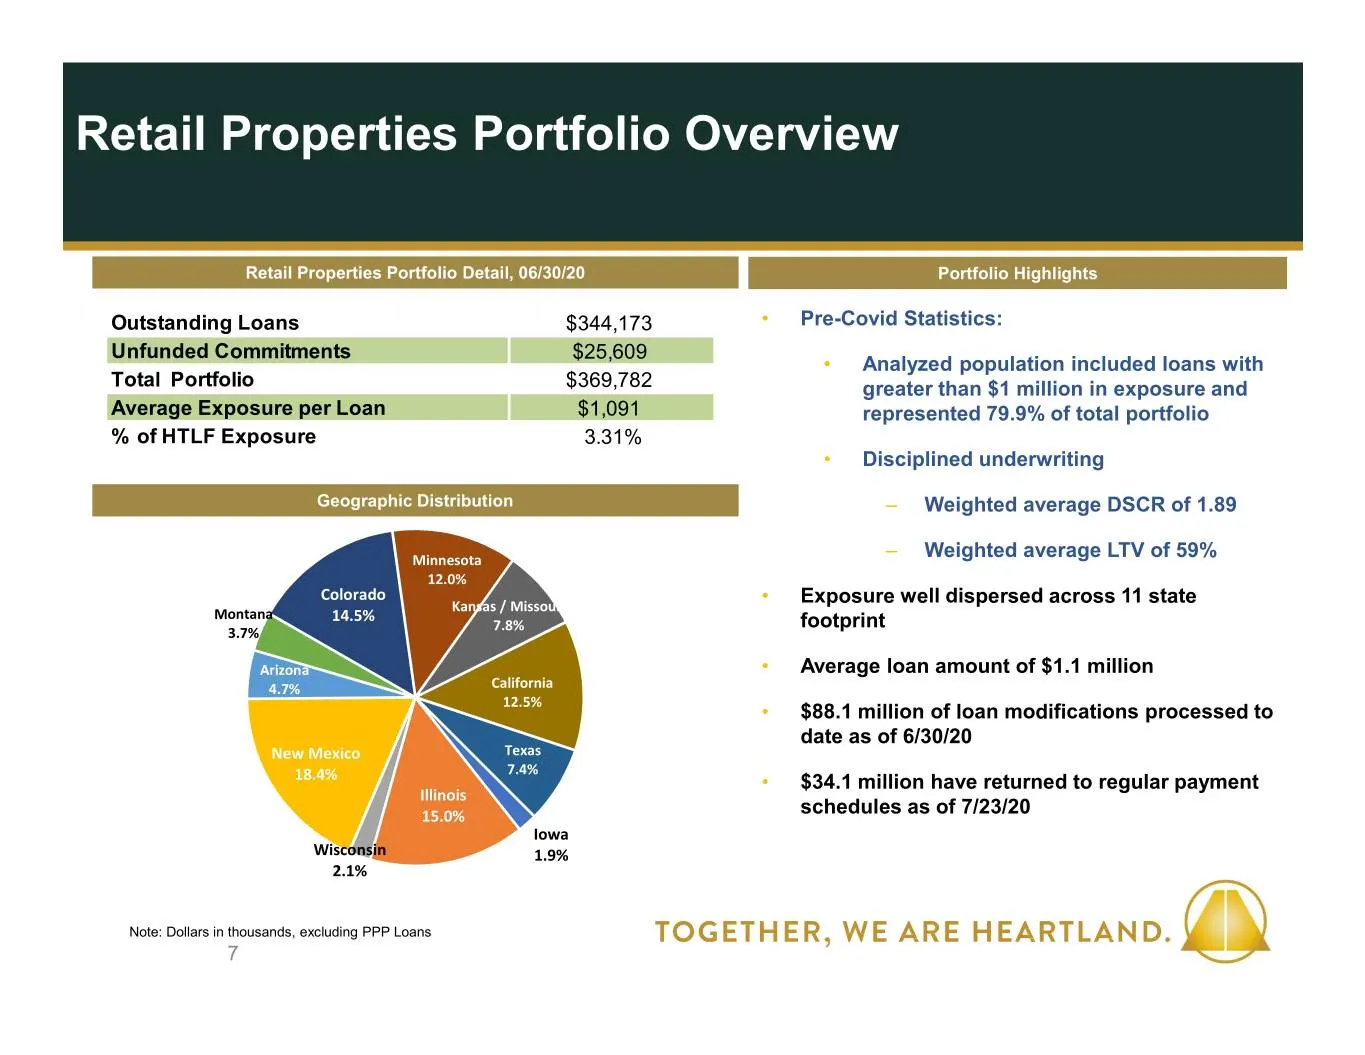
Slide 7: Retail Properties Portfolio Overview
Retail Properties Portfolio Overview Retail Properties Portfolio Detail, 06/30/20 Portfolio Highlights Outstanding Loans $344,173 • Pre-Covid Statistics: Unfunded Commitments $25,609 • Analyzed population included loans with Total Portfolio $369,782 greater than $1 million in exposure and Average Ex
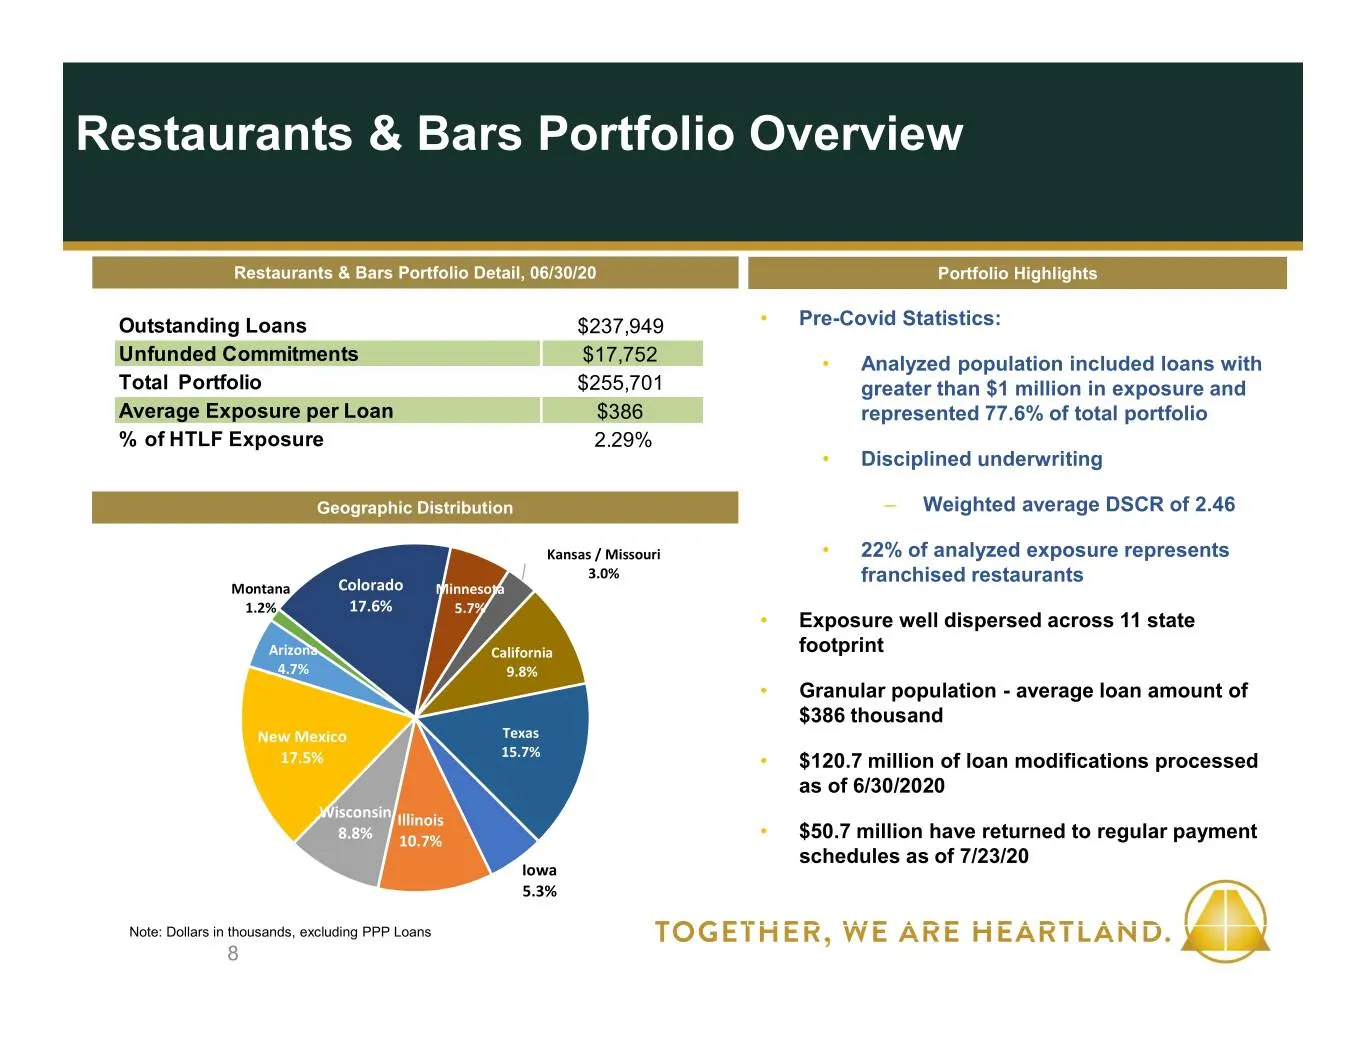
Slide 8: Restaurants & Bars Portfolio Overview
Restaurants & Bars Portfolio Overview Restaurants & Bars Portfolio Detail, 06/30/20 Portfolio Highlights Outstanding Loans $237,949 • Pre-Covid Statistics: Unfunded Commitments $17,752 • Analyzed population included loans with Total Portfolio $255,701 greater than $1 million in exposure and Average
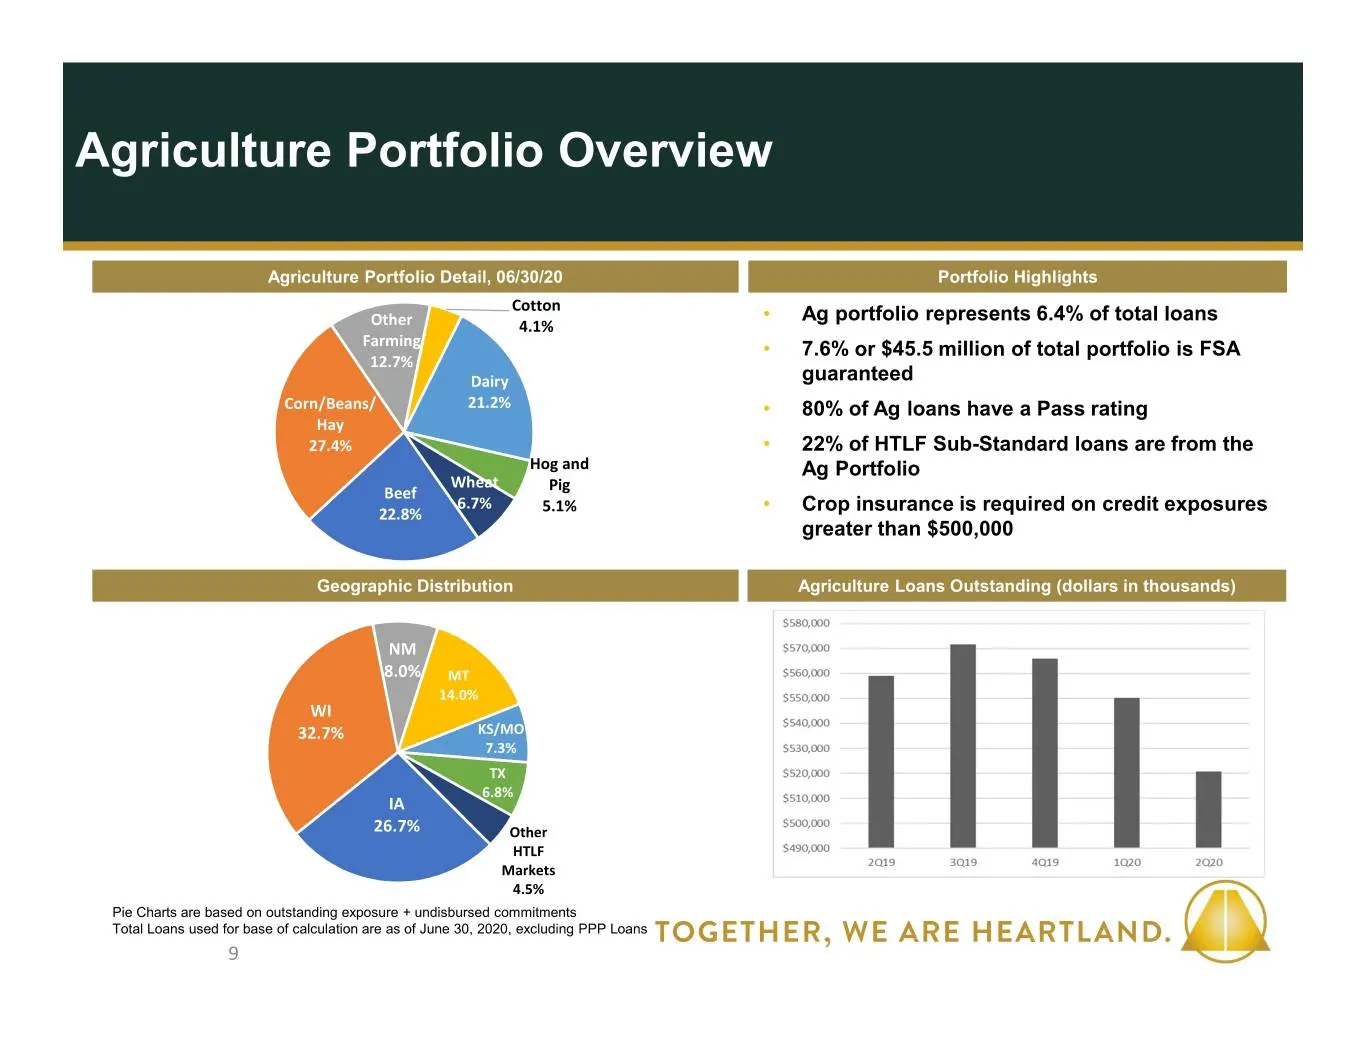
Slide 9: Agriculture Portfolio Overview
Agriculture Portfolio Overview Agriculture Portfolio Detail, 06/30/20 Portfolio Highlights Cotton • Ag portfolio represents 6.4% of total loans Other 4.1% Farming • 7.6% or $45.5 million of total portfolio is FSA 12.7% Dairy guaranteed Corn/Beans/ 21.2% • 80% of Ag loans have a Pass rating Hay 27.4%
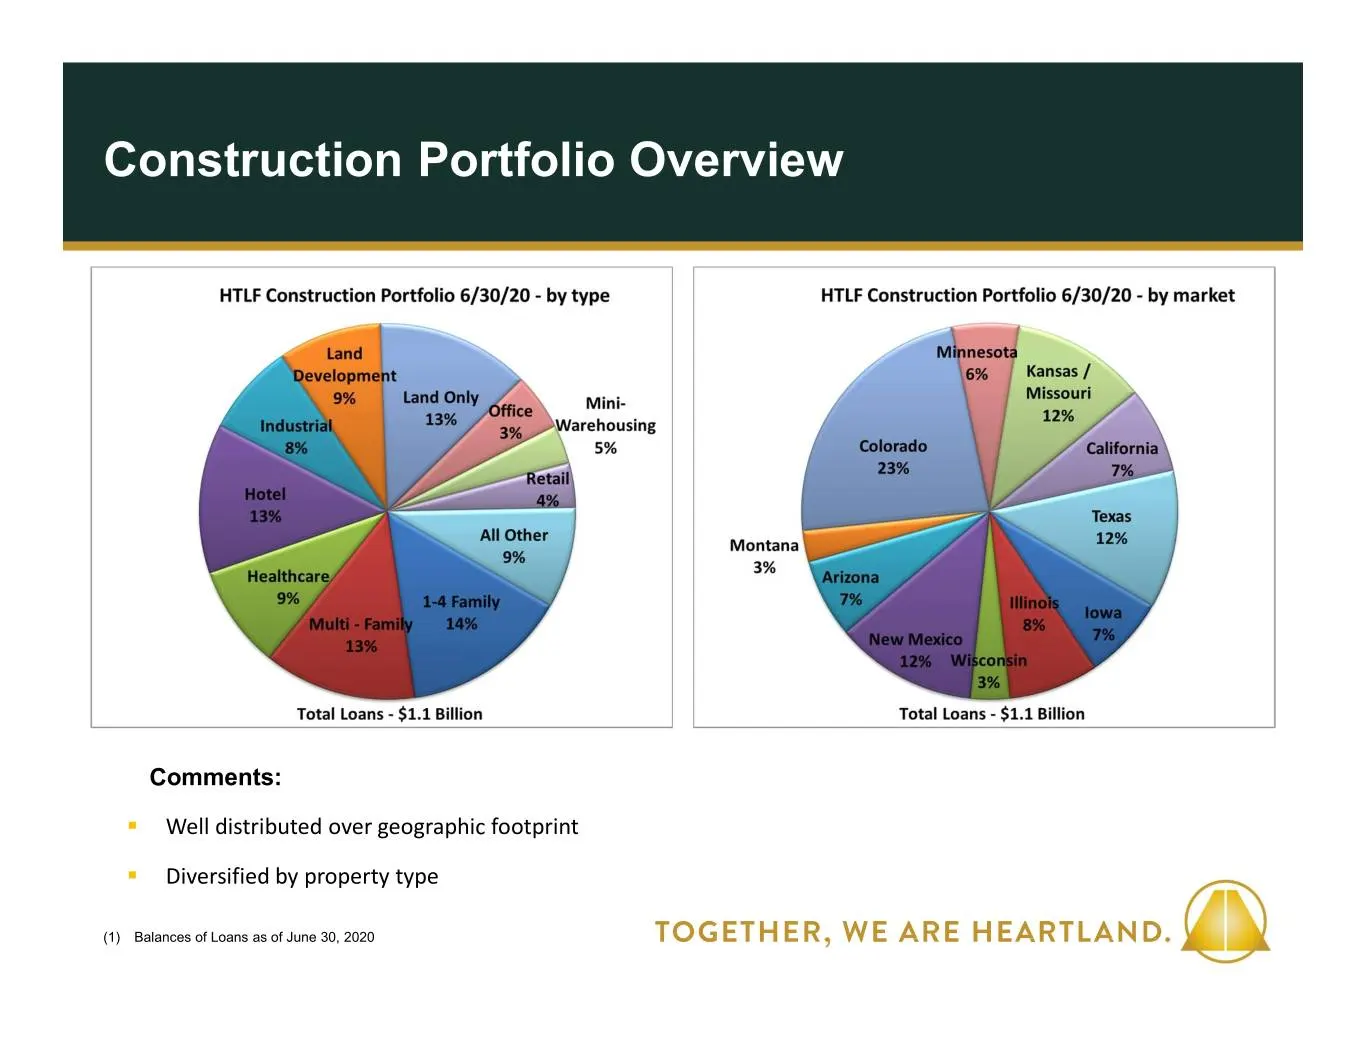
Slide 10: Construction Portfolio Overview
Construction Portfolio Overview Comments: . Well distributed over geographic footprint . Diversified by property type (1) Balances of Loans as of June 30, 2020
Source: SEC EDGAR · 8-K filed Jul 27, 2020
More decks from Heartland Financial USA Inc
 Merger or Acquisition (July 2024)6 slides · Jul 31, 2024
 Merger or Acquisition (May 2024)6 slides · May 2, 2024
 Merger or Acquisition (May 2024)27 slides · May 2, 2024
 Q4 2023 Earnings Presentation54 slides · Feb 13, 2024
 Q4 2023 Earnings Presentation35 slides · Jan 29, 2024
 Q3 2023 Earnings Presentation55 slides · Nov 15, 2023