People's United Financial — Q1 2020 Earnings Presentation
26 slides from People's United Financial's earnings presentation, Apr 24, 2020
Slide 1: First Quarter 2020 Results
First Quarter 2020 Results April 23, 2020 Exhibit 99.2
Slide 2: Forward-Looking Statement
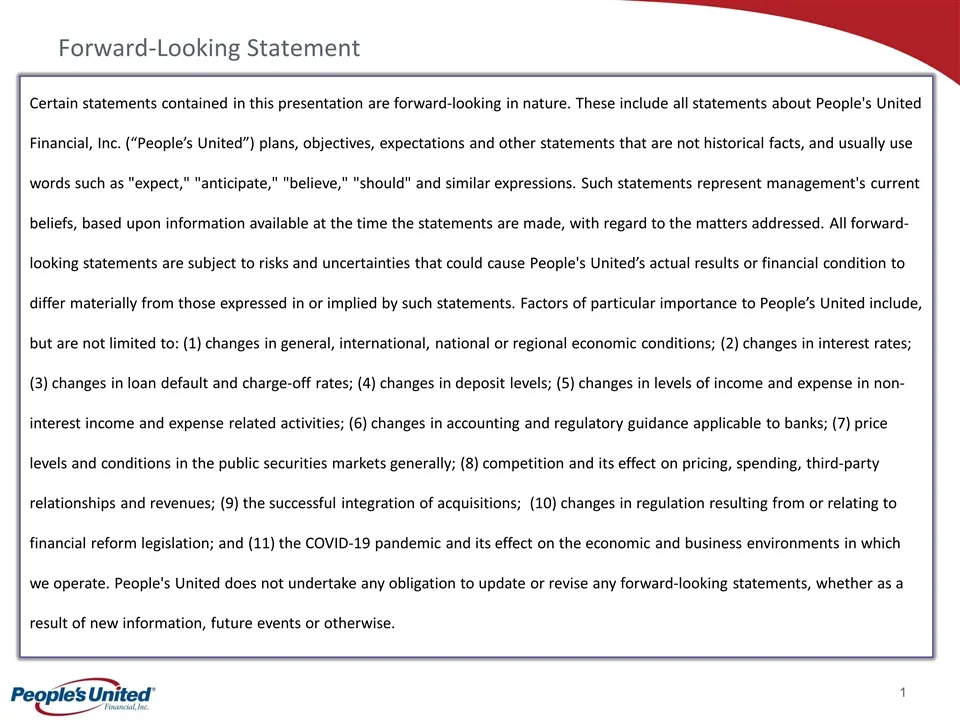
Forward-Looking Statement Certain statements contained in this presentation are forward-looking in nature. These include all statements about People's United Financial, Inc. (“People’s United”) plans, objectives, expectations and other statements that are not historical facts, and usually use words
Slide 3: Response to COVID-19
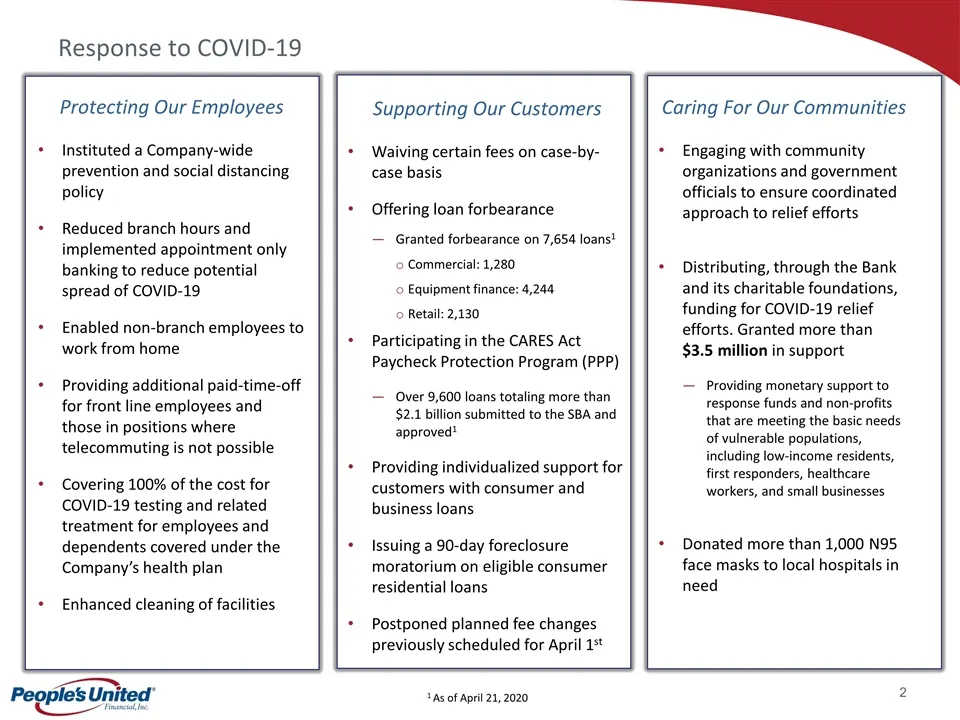
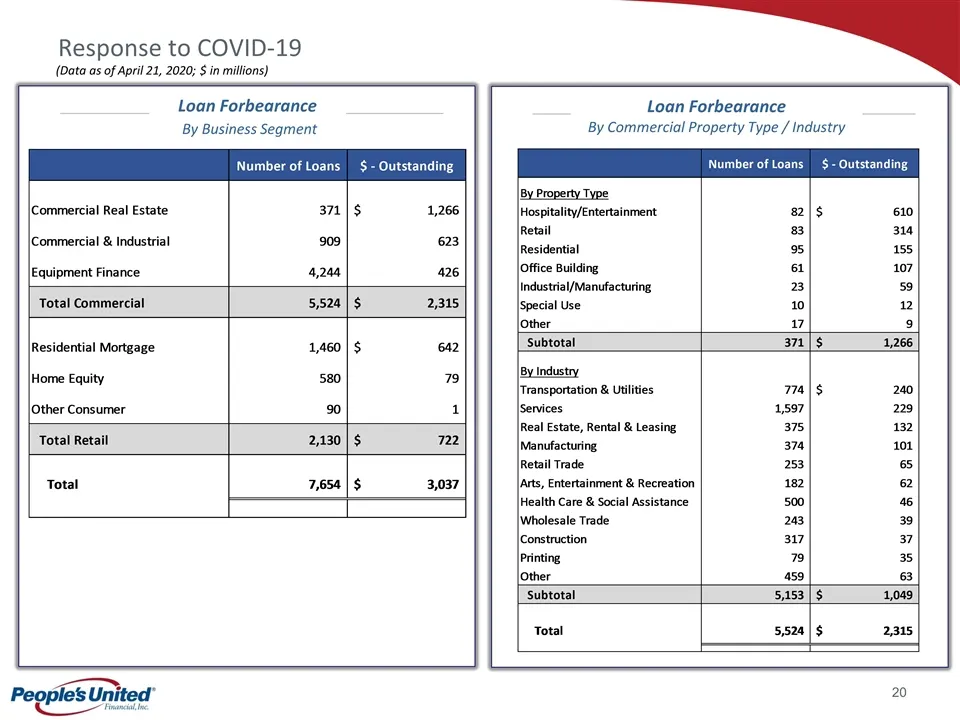
Response to COVID-19 Supporting Our Customers Waiving certain fees on case-by-case basis Offering loan forbearance Granted forbearance on 7,654 loans1 Commercial: 1,280 Equipment finance: 4,244 Retail: 2,130 Participating in the CARES Act Paycheck Protection Program (PPP) Over 9,600 loans totaling m
Slide 4: First Quarter 2020 Overview
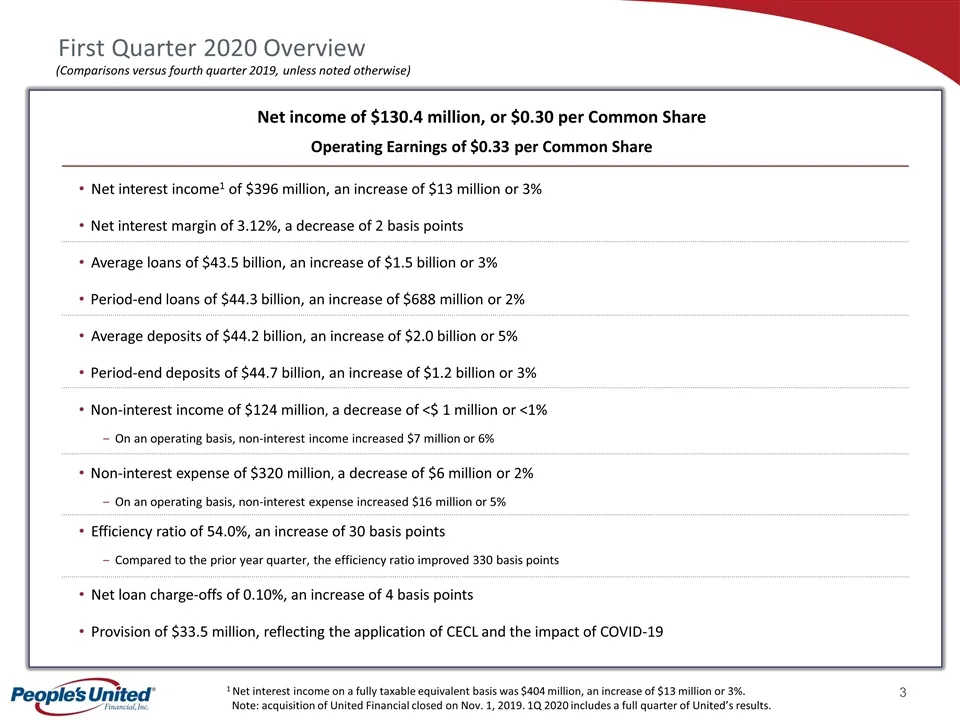
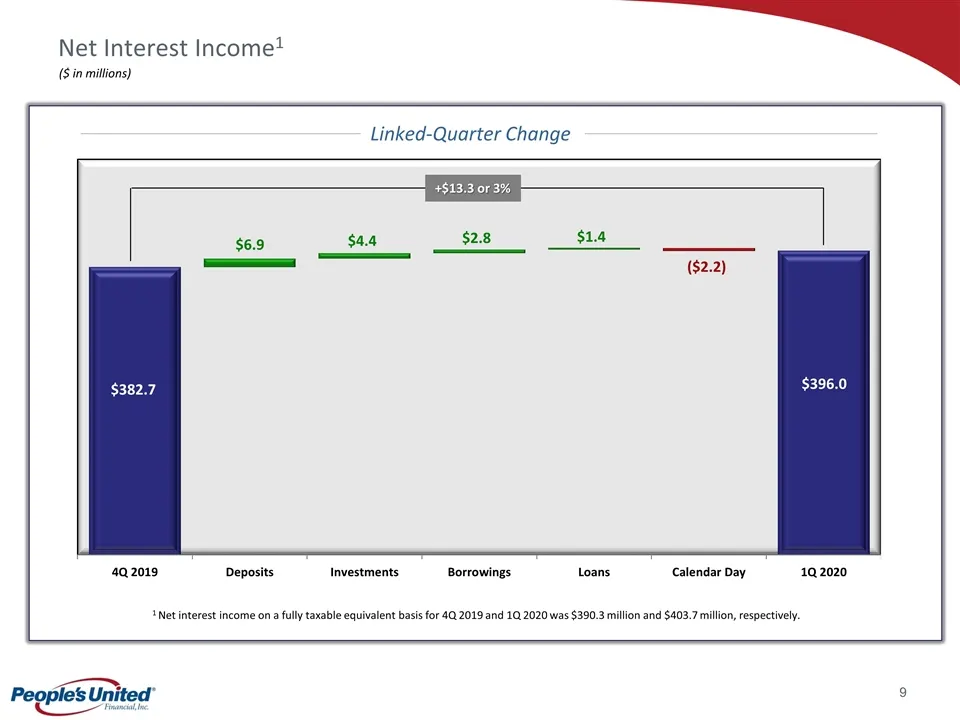
1 Net interest income on a fully taxable equivalent basis was $404 million, an increase of $13 million or 3%. Note: acquisition of United Financial closed on Nov. 1, 2019. 1Q 2020 includes a full quarter of United’s results. First Quarter 2020 Overview Net income of $130.4 million, or $0.30 per Comm
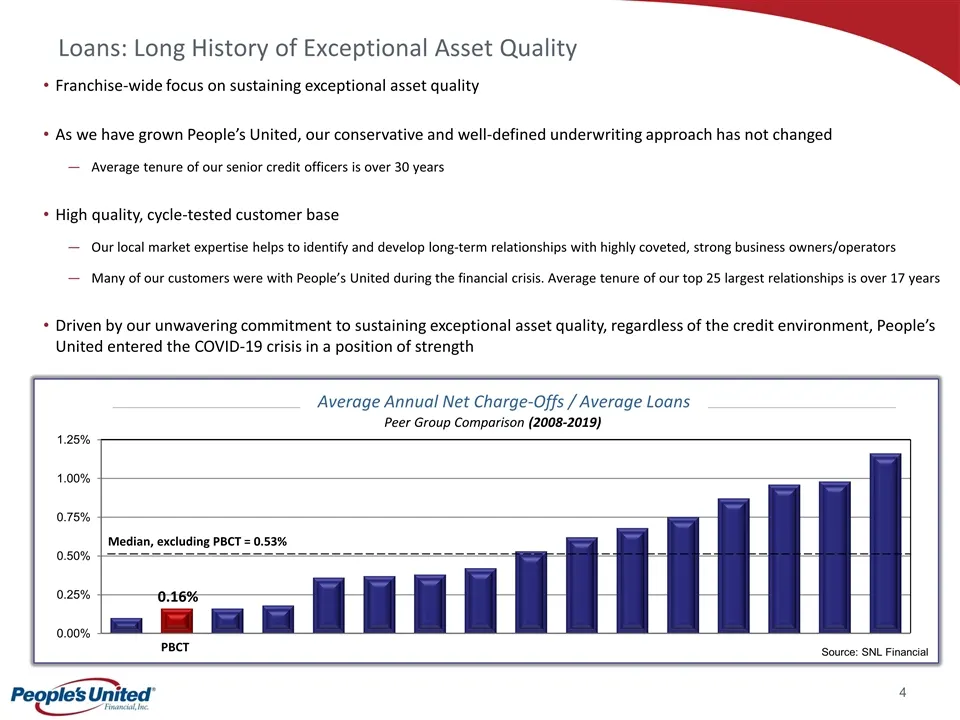
Slide 5: Loans: Long History of Exceptional Asset Quality
c 0.16% PBCT Median, excluding PBCT = 0.53% Source: SNL Financial Average Annual Net Charge-Offs / Average Loans Peer Group Comparison (2008-2019) Loans: Long History of Exceptional Asset Quality Franchise-wide focus on sustaining exceptional asset quality As we have grown People’s United, our conse
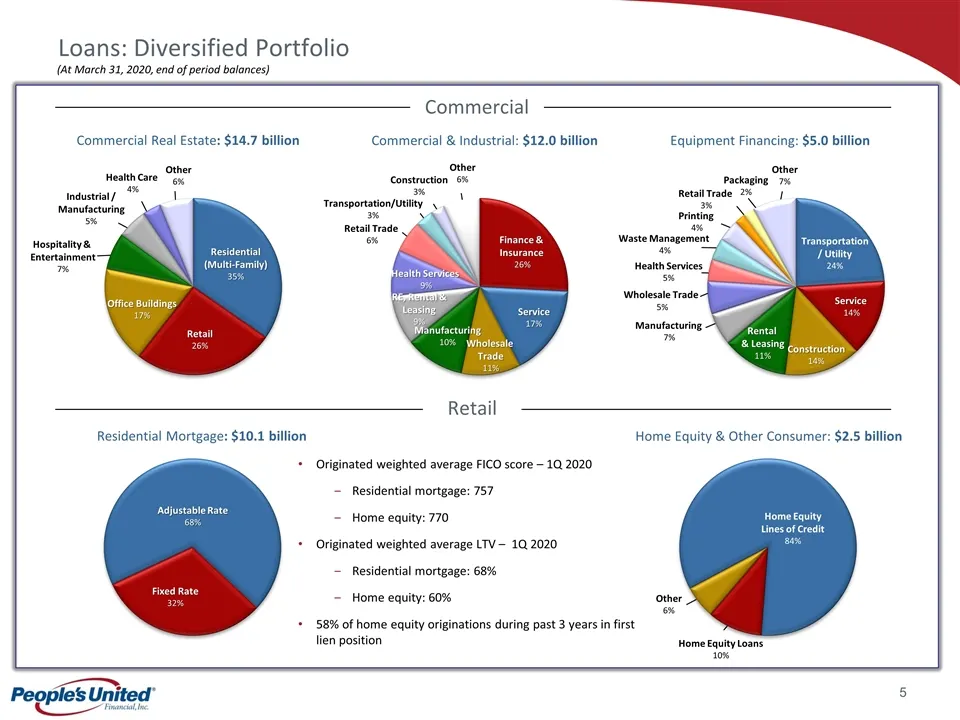
Slide 6: Loan portfolio composition
c Home Equity Loans 10% Other 6% Packaging 2% Manufacturing 7% Wholesale Trade 5% Hospitality & Entertainment 7% Health Services 5% Other 7% Transportation/Utility 3% (At March 31, 2020, end of period balances) Residential (Multi-Family) 35% Retail 26% Office Buildings 17% Other 6% Health Care 4% In
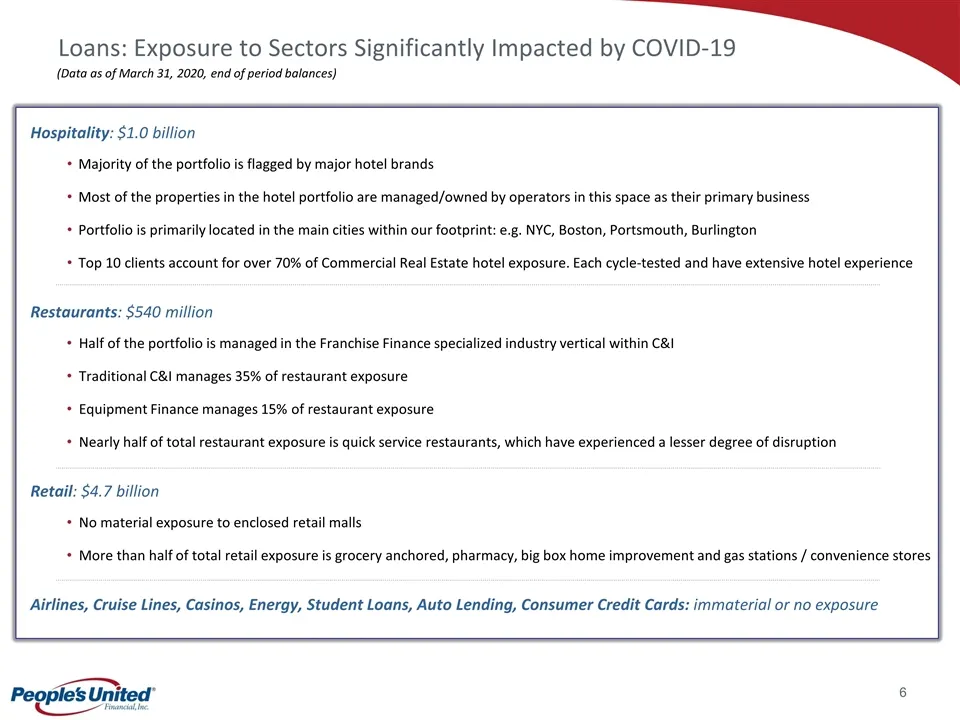
Slide 7: Loans: Exposure to Sectors Significantly Impacted by COVID-19
c Loans: Exposure to Sectors Significantly Impacted by COVID-19 (Data as of March 31, 2020, end of period balances) Hospitality: $1.0 billion Majority of the portfolio is flagged by major hotel brands Most of the properties in the hotel portfolio are managed/owned by operators in this space as their
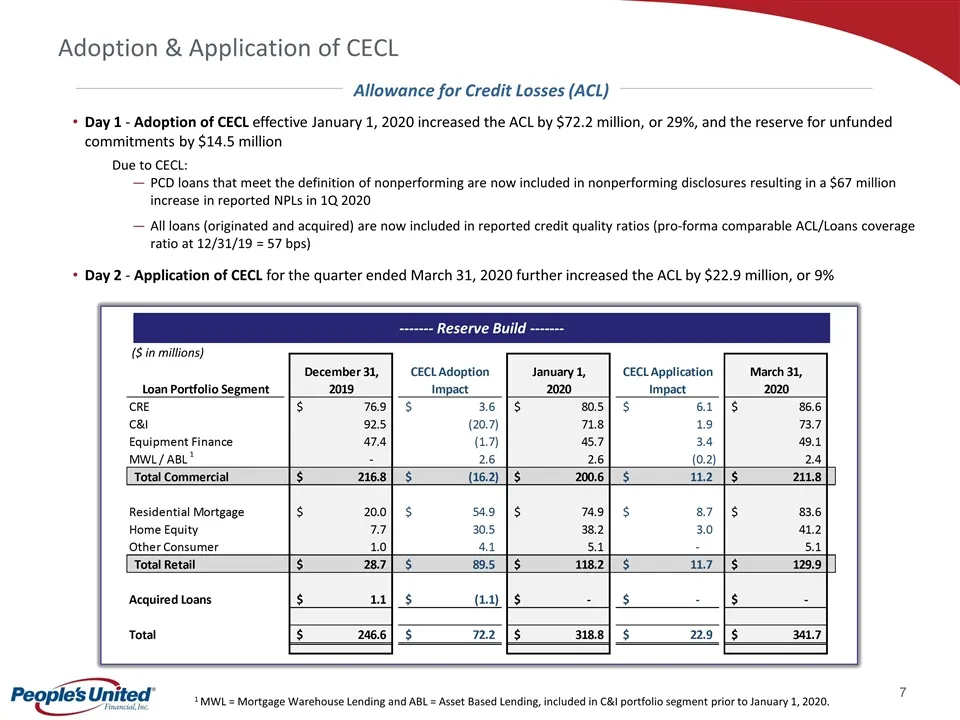
Slide 8: Adoption & Application of CECL
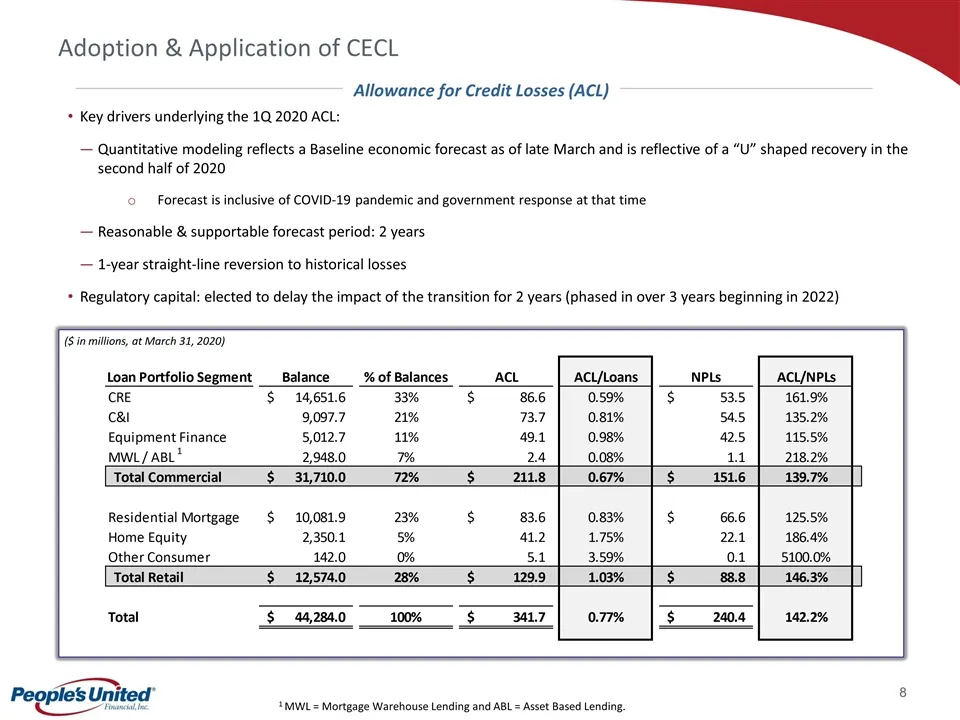
Adoption & Application of CECL Day 1 - Adoption of CECL effective January 1, 2020 increased the ACL by $72.2 million, or 29%, and the reserve for unfunded commitments by $14.5 million Due to CECL: PCD loans that meet the definition of nonperforming are now included in nonperforming disclosures resul
Slide 9: Adoption & Application of CECL
Adoption & Application of CECL Key drivers underlying the 1Q 2020 ACL: Quantitative modeling reflects a Baseline economic forecast as of late March and is reflective of a “U” shaped recovery in the second half of 2020 Forecast is inclusive of COVID-19 pandemic and government response at that time Re
Slide 10: Net Interest Income
Net Interest Income1 ($ in millions) $382.7 $396.0 1 Net interest income on a fully taxable equivalent basis for 4Q 2019 and 1Q 2020 was $390.3 million and $403.7 million, respectively. +$13.3 or 3% Linked-Quarter Change $6.9 $4.4 $2.8 $1.4 ($2.2)
Slide 11: Net Interest Margin
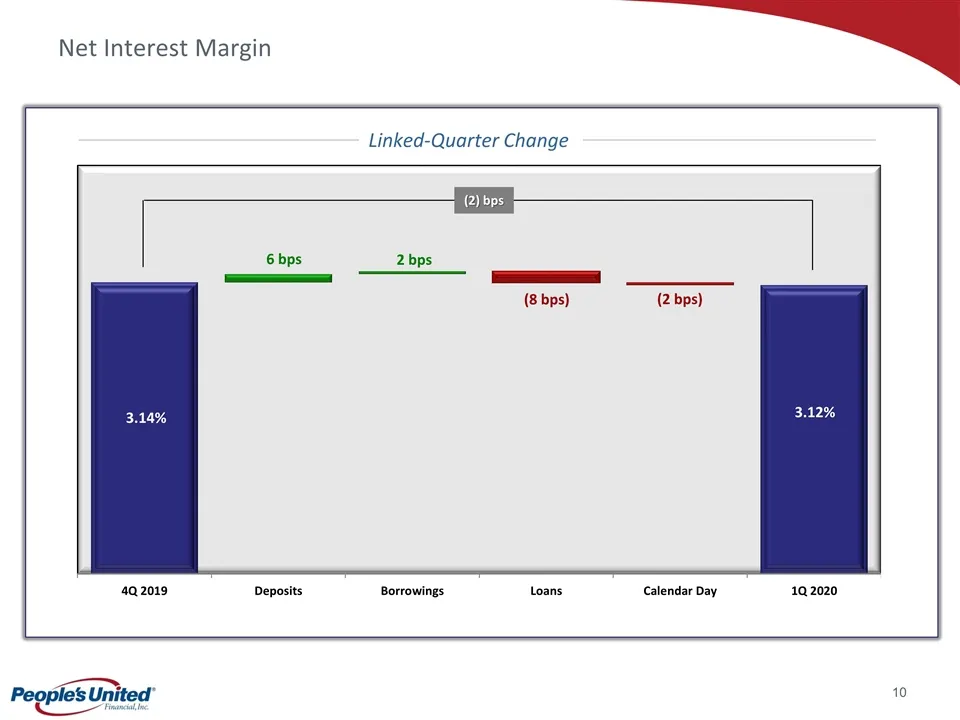
Net Interest Margin 3.14% 3.12% (2) bps Linked-Quarter Change 6 bps 2 bps (8 bps) (2 bps)
Slide 12: Loans: Average Balances
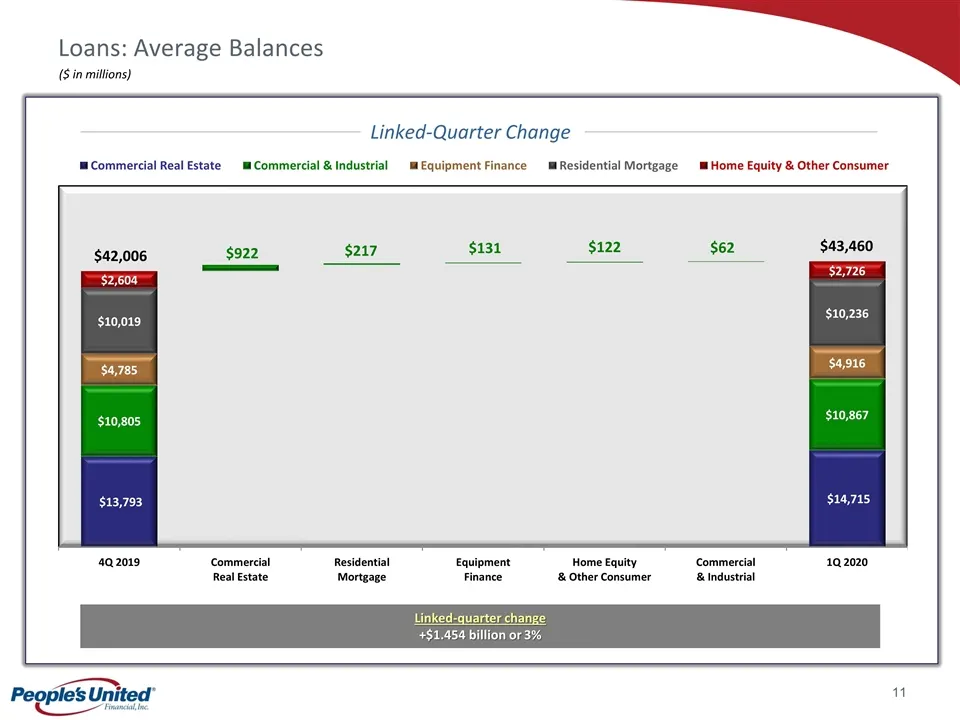
Loans: Average Balances $43,460 ($ in millions) $42,006 Linked-Quarter Change Linked-quarter change +$1.454 billion or 3% $922 $217 $131 $122 $62
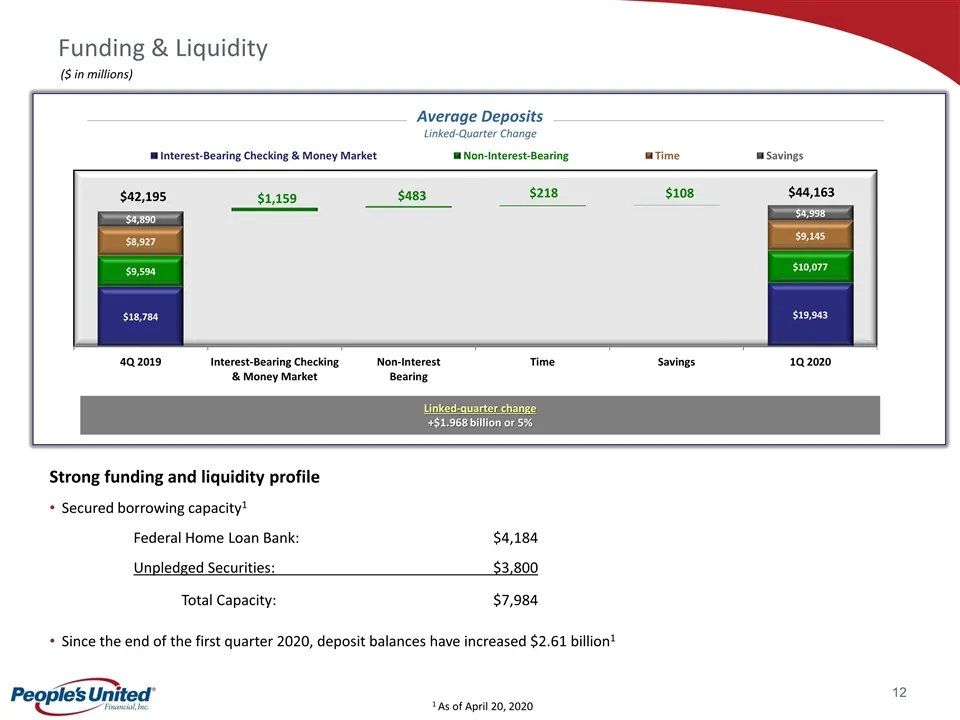
Slide 13: Funding & Liquidity
Funding & Liquidity ($ in millions) $44,163 $42,195 Linked-quarter change +$1.968 billion or 5% $1,159 $483 $218 $108 Average Deposits Linked-Quarter Change Strong funding and liquidity profile Secured borrowing capacity1 Federal Home Loan Bank:$4,184 Unpledged Securities:$3,800 Total Capacity: $7,9
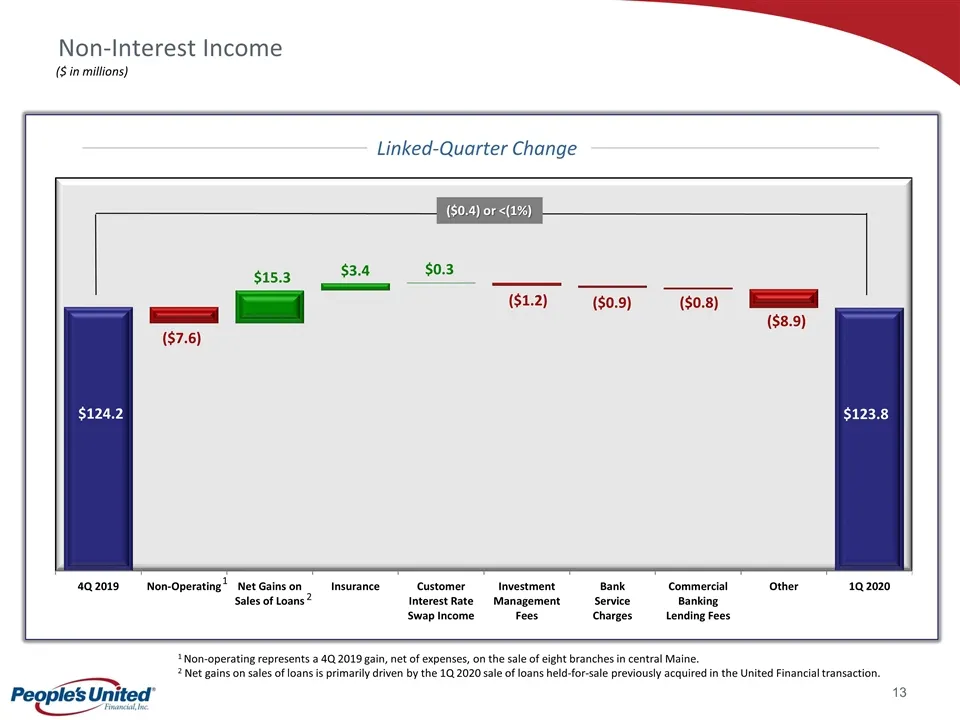
Slide 14: Non-Interest Income
Non-Interest Income ($ in millions) $124.2 $123.8 ($0.4) or <(1%) Linked-Quarter Change 1 Non-operating represents a 4Q 2019 gain, net of expenses, on the sale of eight branches in central Maine. 2 Net gains on sales of loans is primarily driven by the 1Q 2020 sale of loans held-for-sale previously
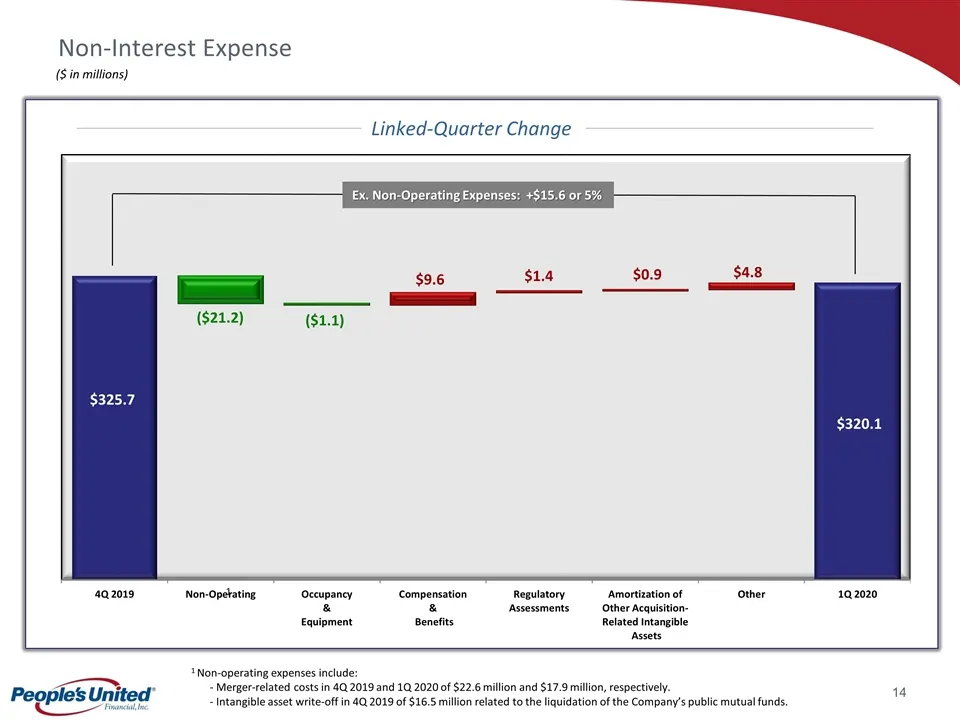
Slide 15: Non-Interest Expense
Non-Interest Expense ($ in millions) $320.1 $325.7 Ex. Non-Operating Expenses: +$15.6 or 5% Linked-Quarter Change 1 1 Non-operating expenses include: - Merger-related costs in 4Q 2019 and 1Q 2020 of $22.6 million and $17.9 million, respectively. - Intangible asset write-off in 4Q 2019 of $16.5 milli
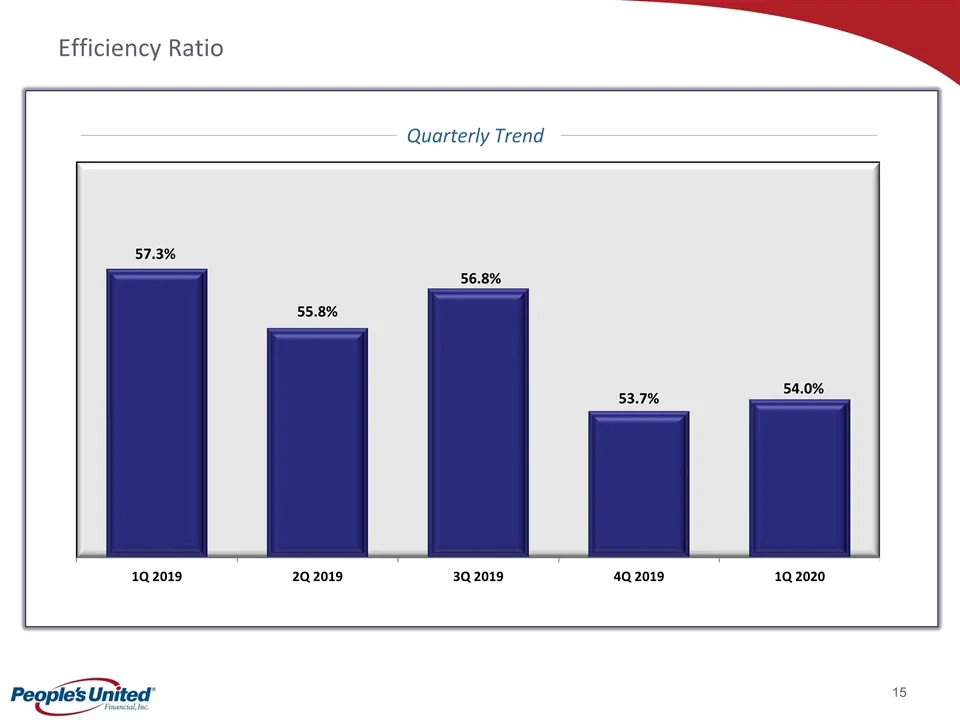
Slide 16: Efficiency Ratio Quarterly Trend
Efficiency Ratio Quarterly Trend
Slide 17: Asset Quality
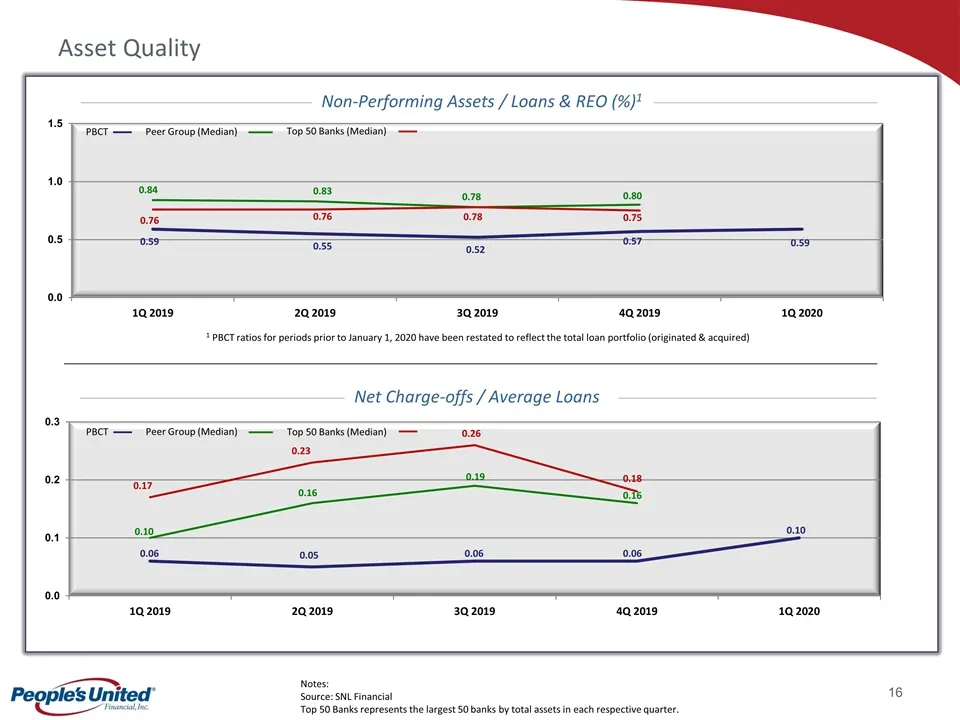
Asset Quality 1 PBCT ratios for periods prior to January 1, 2020 have been restated to reflect the total loan portfolio (originated & acquired) Notes: Source: SNL Financial Top 50 Banks represents the largest 50 banks by total assets in each respective quarter. PBCT Peer Group (Median) Top 50 Banks
Slide 18: Returns
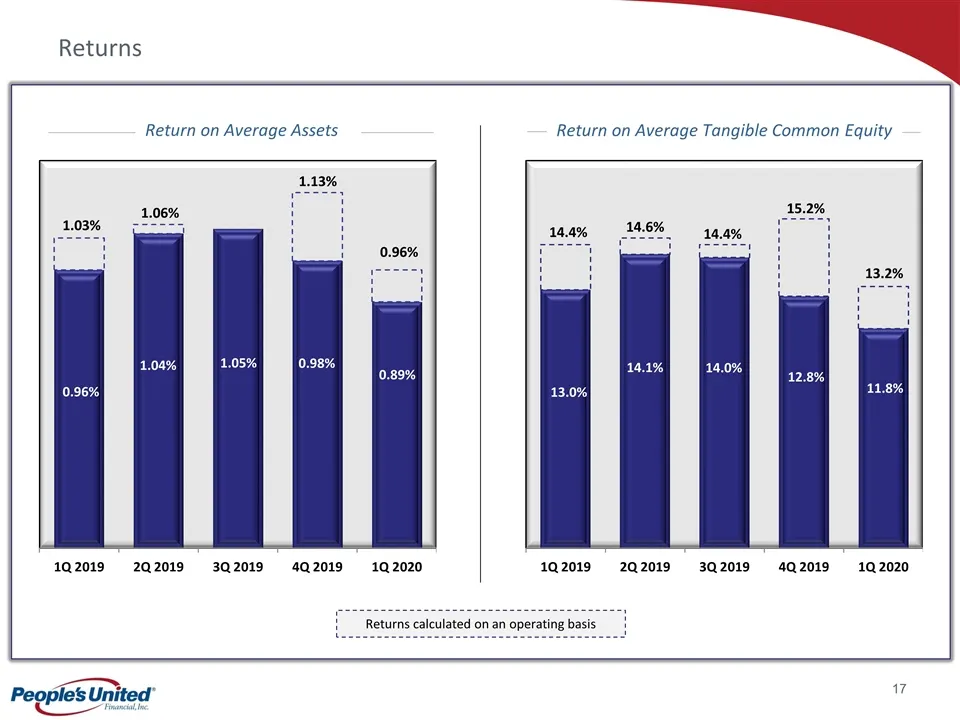
Returns Return on Average Assets Return on Average Tangible Common Equity Returns calculated on an operating basis 14.4% 1.03% 14.6% 1.06% 14.4% 1.13% 15.2% 13.2% 0.96%
Slide 19: Capital Ratios
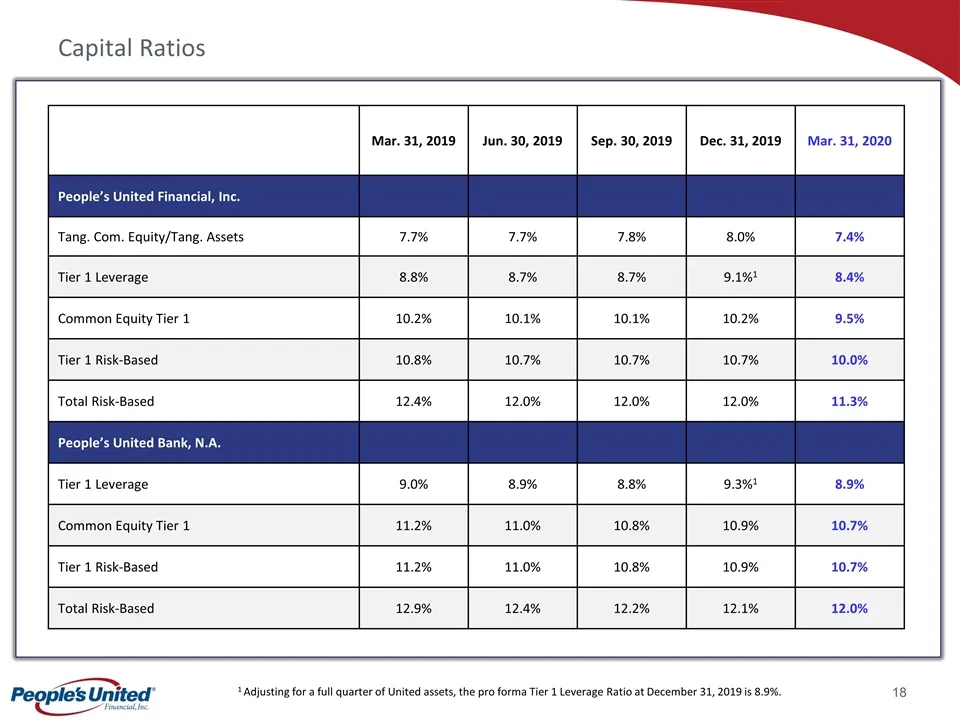
Capital Ratios Mar. 31, 2019 Jun. 30, 2019 Sep. 30, 2019 Dec. 31, 2019 Mar. 31, 2020 People’s United Financial, Inc. Tang. Com. Equity/Tang. Assets 7.7% 7.7% 7.8% 8.0% 7.4% Tier 1 Leverage 8.8% 8.7% 8.7% 9.1%1 8.4% Common Equity Tier 1 10.2% 10.1% 10.1% 10.2% 9.5% Tier 1 Risk-Based 10.8% 10.7% 10.7%
Slide 20: Appendix
Appendix
Slide 21: Response to COVID-19: Loan Forbearance
Response to COVID-19 (Data as of April 21, 2020; $ in millions) Loan Forbearance By Business Segment Loan Forbearance By Commercial Property Type / Industry
Slide 22: Interest Rate Risk Profile
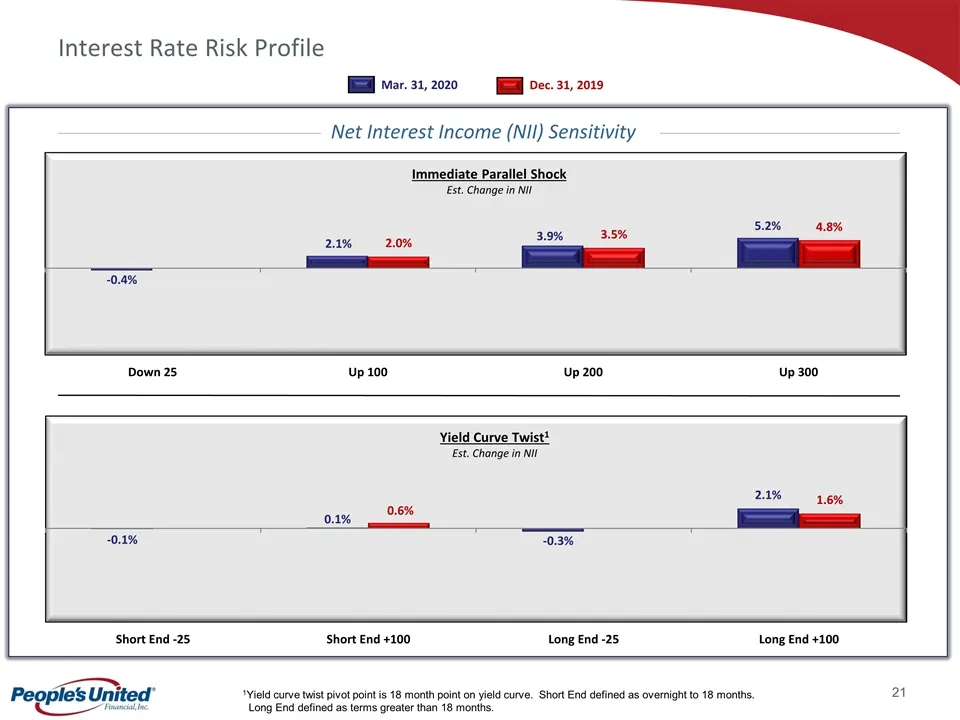
Interest Rate Risk Profile 1Yield curve twist pivot point is 18 month point on yield curve. Short End defined as overnight to 18 months. Long End defined as terms greater than 18 months. Immediate Parallel Shock Est. Change in NII Yield Curve Twist1 Est. Change in NII Mar. 31, 2020 Dec. 31, 2019 Net
Slide 23: Loans By State
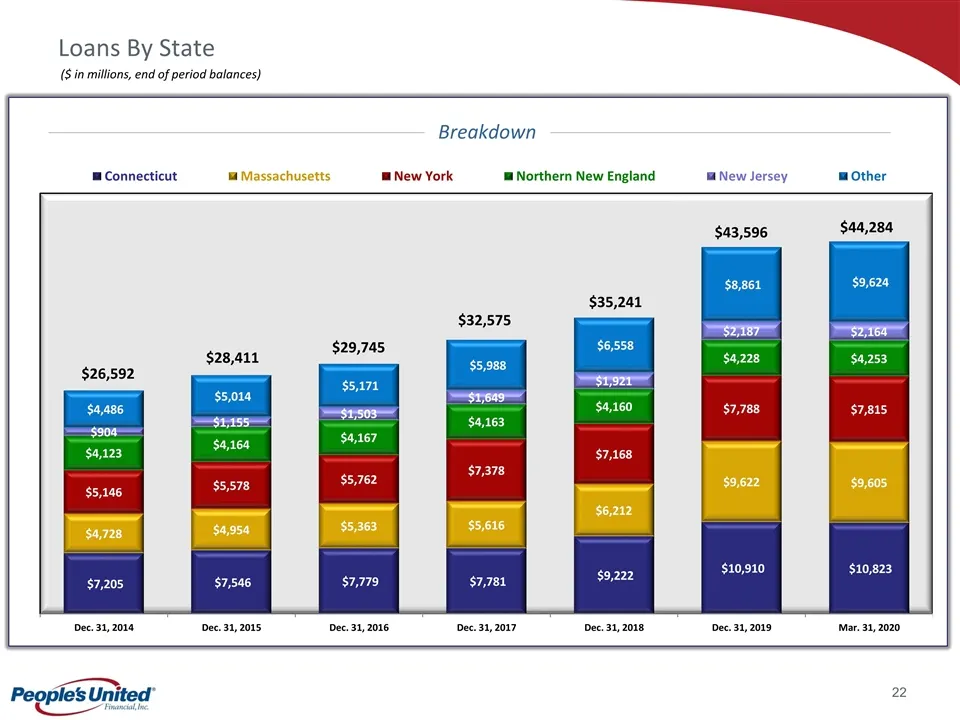
Loans By State $26,592 $29,745 $32,575 $28,411 ($ in millions, end of period balances) Breakdown $35,241 $43,596 $44,284
Slide 24: Deposits By State
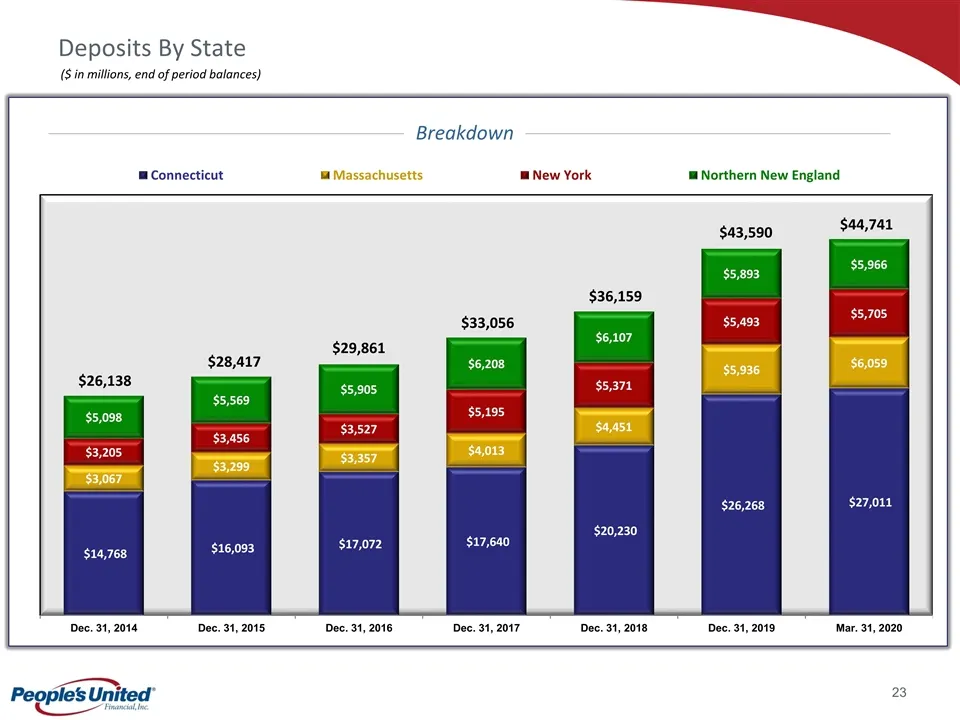
Deposits By State $26,138 $29,861 $33,056 $28,417 ($ in millions, end of period balances) Breakdown $36,159 $43,590 $44,741
Slide 25: Peer Group
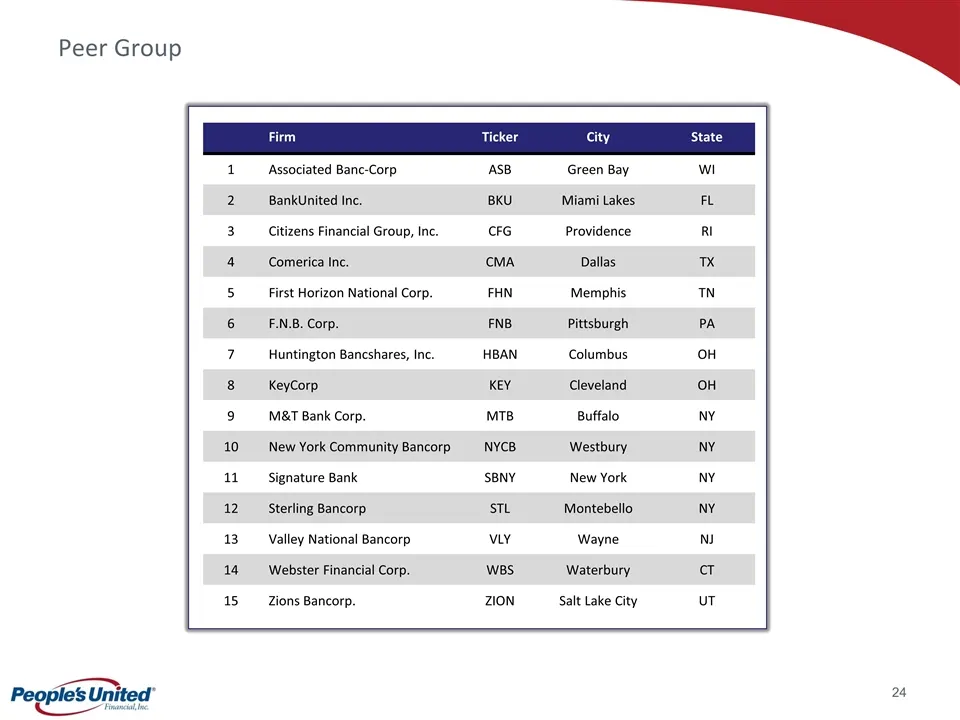
Peer Group Firm Ticker City State 1 Associated Banc-Corp ASB Green Bay WI 2 BankUnited Inc. BKU Miami Lakes FL 3 Citizens Financial Group, Inc. CFG Providence RI 4 Comerica Inc. CMA Dallas TX 5 First Horizon National Corp. FHN Memphis TN 6 F.N.B. Corp. FNB Pittsburgh PA 7 Huntington Bancshares, Inc.

Slide 26: Investor contact information
For more information, investors may contact: Andrew S. Hersom (203) 338-4581 [email protected]
Source: SEC EDGAR · 8-K filed Apr 24, 2020
More decks from People's United Financial Inc
 Merger or Acquisition (February 2021)23 slides · Feb 22, 2021
 Q4 2020 Earnings Presentation24 slides · Jan 22, 2021
 Investor Presentation (November 2020)44 slides · Nov 10, 2020
 Q3 2020 Earnings Presentation22 slides · Oct 23, 2020
 Q2 2020 Earnings Presentation23 slides · Jul 24, 2020
 Investor Presentation (February 2020)46 slides · Feb 13, 2020