People's United Financial — Investor Presentation (February 2020)
46 slides from People's United Financial's investor presentation, Feb 13, 2020
Slide 1: A Premium Brand
A Premium Brand Investor Presentation February 2020 Exhibit 99.1
Slide 2: Forward-Looking Statement
Forward-Looking Statement Certain statements contained in this presentation are forward-looking in nature. These include all statements about People's United Financial, Inc. (“People’s United”) plans, objectives, expectations and other statements that are not historical facts, and usually use words
Slide 3: A Premium Brand
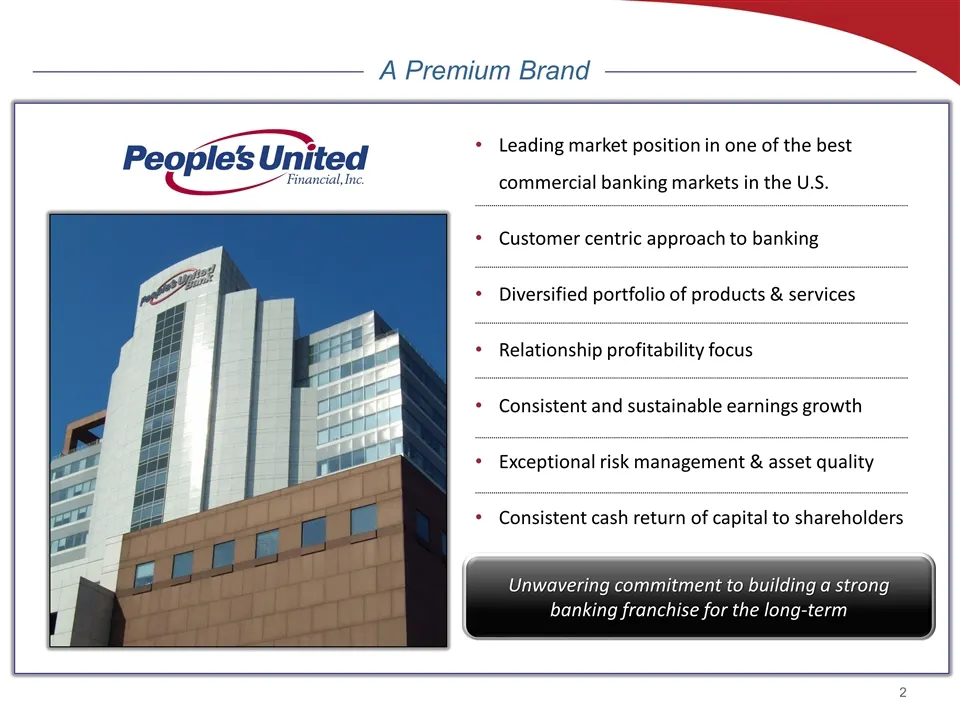
A Premium Brand Leading market position in one of the best commercial banking markets in the U.S. Customer centric approach to banking Diversified portfolio of products & services Relationship profitability focus Consistent and sustainable earnings growth Exceptional risk management & asset quality
Slide 4: Corporate Overview
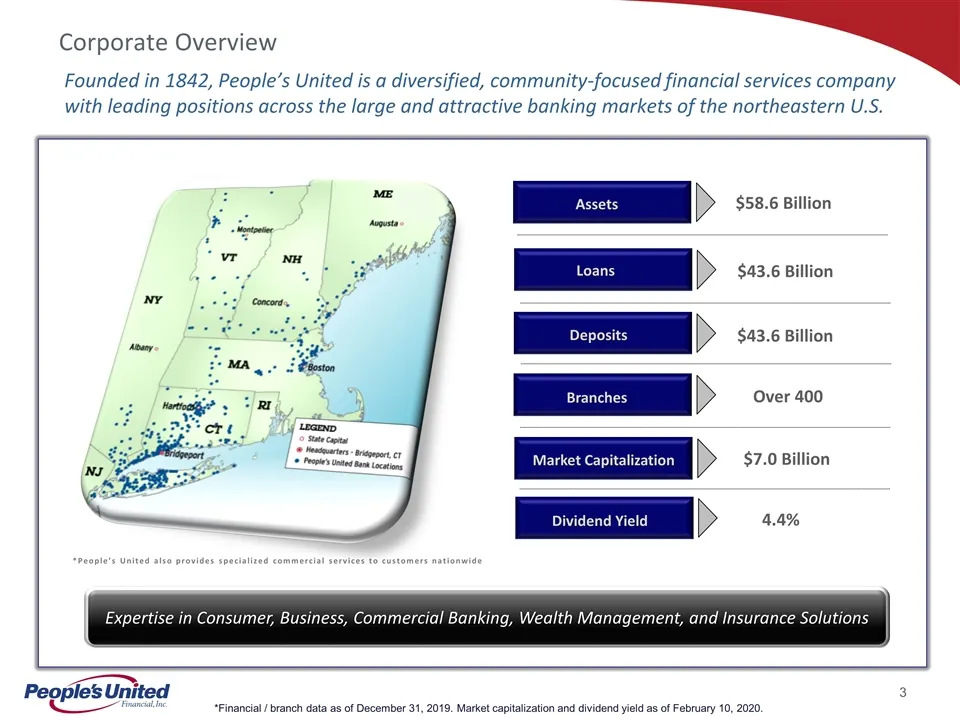
Founded in 1842, People’s United is a diversified, community-focused financial services company with leading positions across the large and attractive banking markets of the northeastern U.S. Expertise in Consumer, Business, Commercial Banking, Wealth Management, and Insurance Solutions Assets Loans
Slide 5: Seasoned Leadership Team
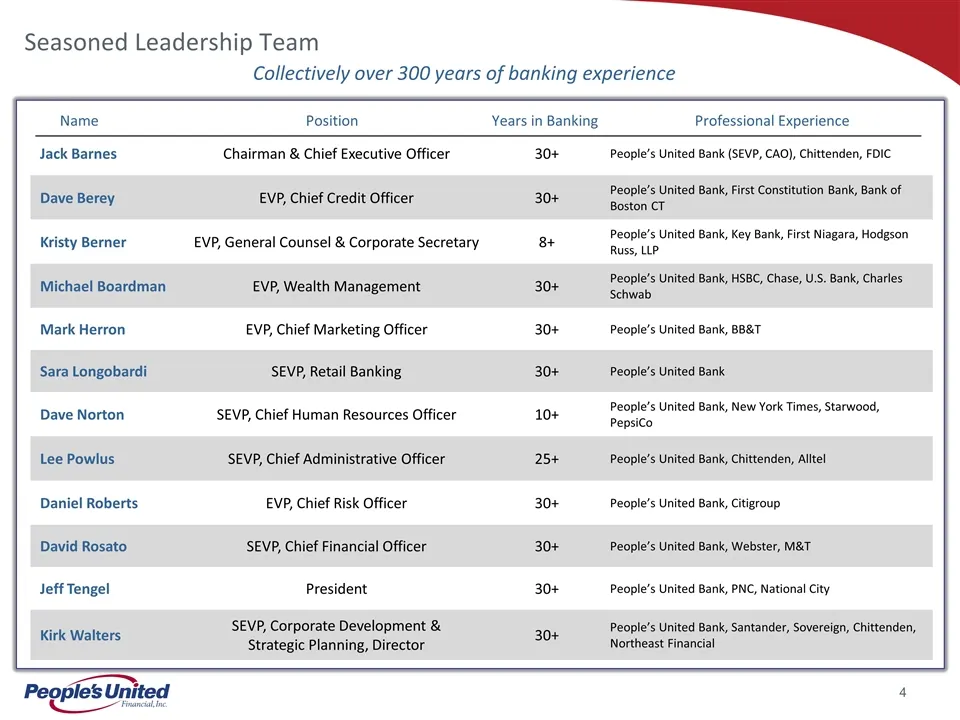
Seasoned Leadership Team Collectively over 300 years of banking experience Jack Barnes Chairman & Chief Executive Officer 30+ People’s United Bank (SEVP, CAO), Chittenden, FDIC Dave Berey EVP, Chief Credit Officer 30+ People’s United Bank, First Constitution Bank, Bank of Boston CT Kristy Berner EVP
Slide 6: People's United Expansion (Acquisitions: 2010 – Present)
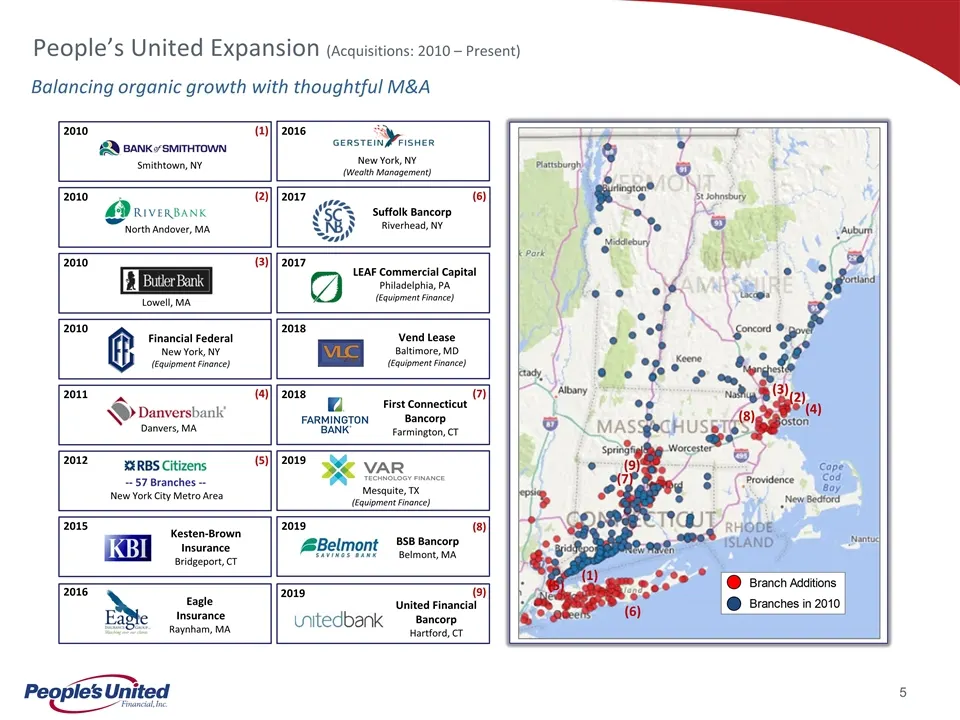
c People’s United Expansion (Acquisitions: 2010 – Present) Balancing organic growth with thoughtful M&A Financial Federal New York, NY (Equipment Finance) 2010 Smithtown, NY 2010 North Andover, MA 2010 2010 Lowell, MA 2011 Danvers, MA 2012 -- 57 Branches -- New York City Metro Area 2015 Kesten-Brown
Slide 7: Long History of Relationship Management
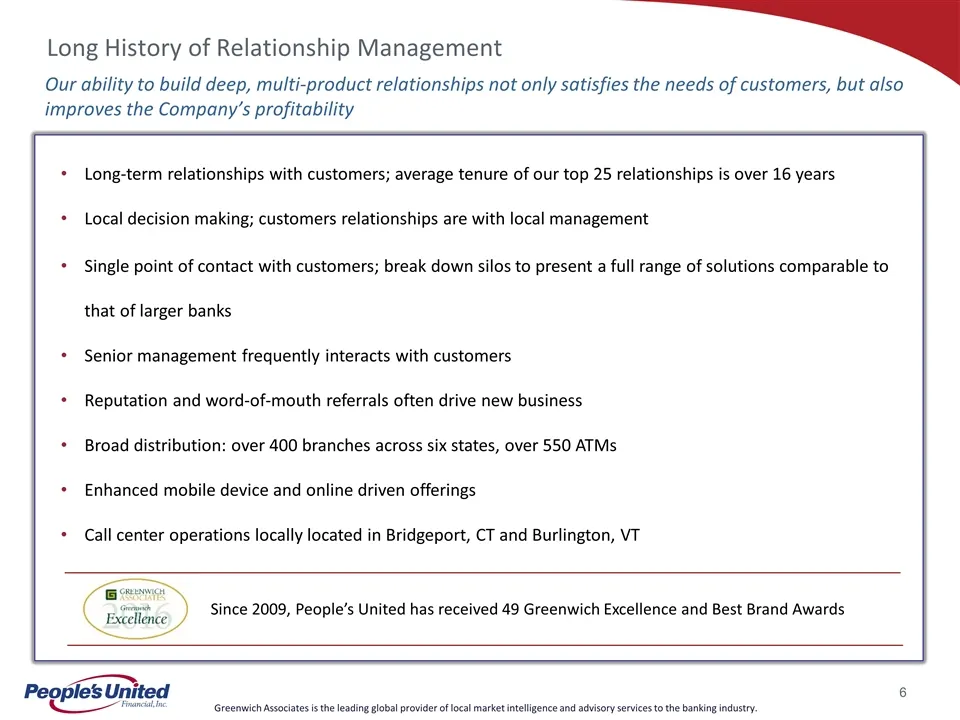
Long-term relationships with customers; average tenure of our top 25 relationships is over 16 years Local decision making; customers relationships are with local management Single point of contact with customers; break down silos to present a full range of solutions comparable to that of larger bank
Slide 8: Diversified Loan Portfolio by Product
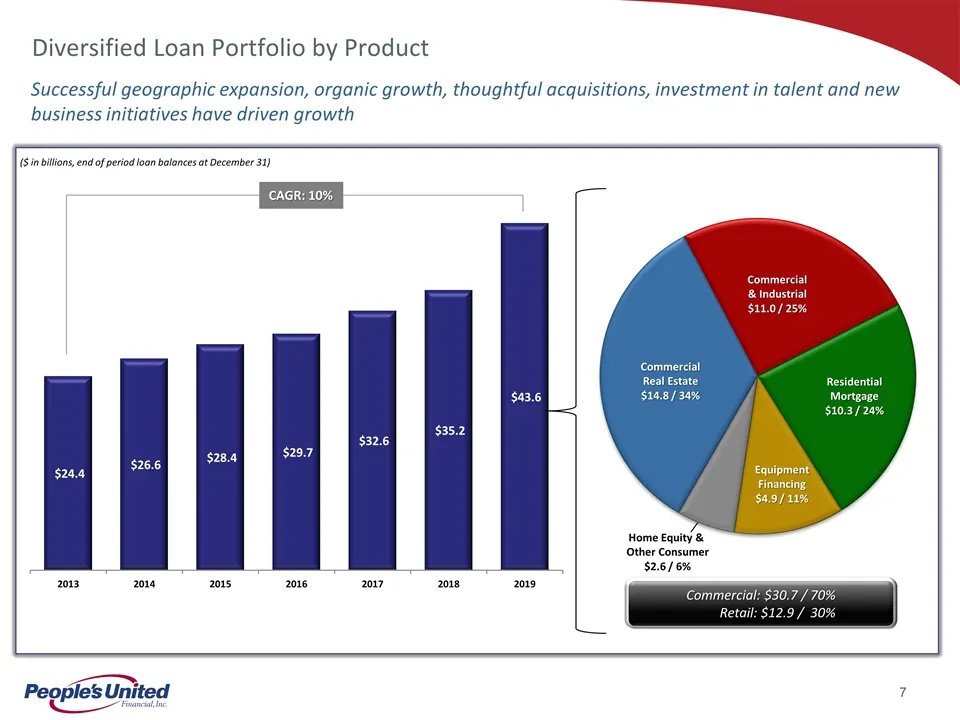
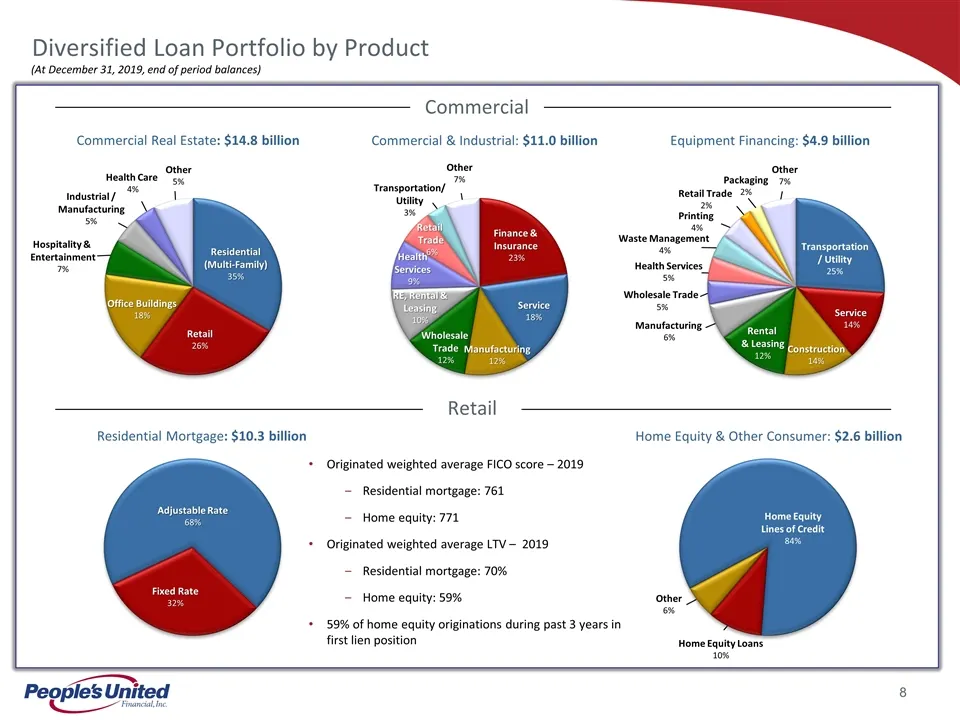
c Diversified Loan Portfolio by Product CAGR: 10% Commercial Real Estate $14.8 / 34% Equipment Financing $4.9 / 11% Residential Mortgage $10.3 / 24% Commercial & Industrial $11.0 / 25% Home Equity & Other Consumer $2.6 / 6% Successful geographic expansion, organic growth, thoughtful acquisitions, in
Slide 9: Diversified Loan Portfolio by Product and Sector
c Home Equity Loans 10% Other 6% Packaging 2% Manufacturing 6% Wholesale Trade 5% Hospitality & Entertainment 7% Health Services 5% Other 7% Transportation/ Utility 3% (At December 31, 2019, end of period balances) Residential (Multi-Family) 35% Retail 26% Office Buildings 18% Other 5% Health Care 4
Slide 10: Diversified Loan Portfolio by Geography
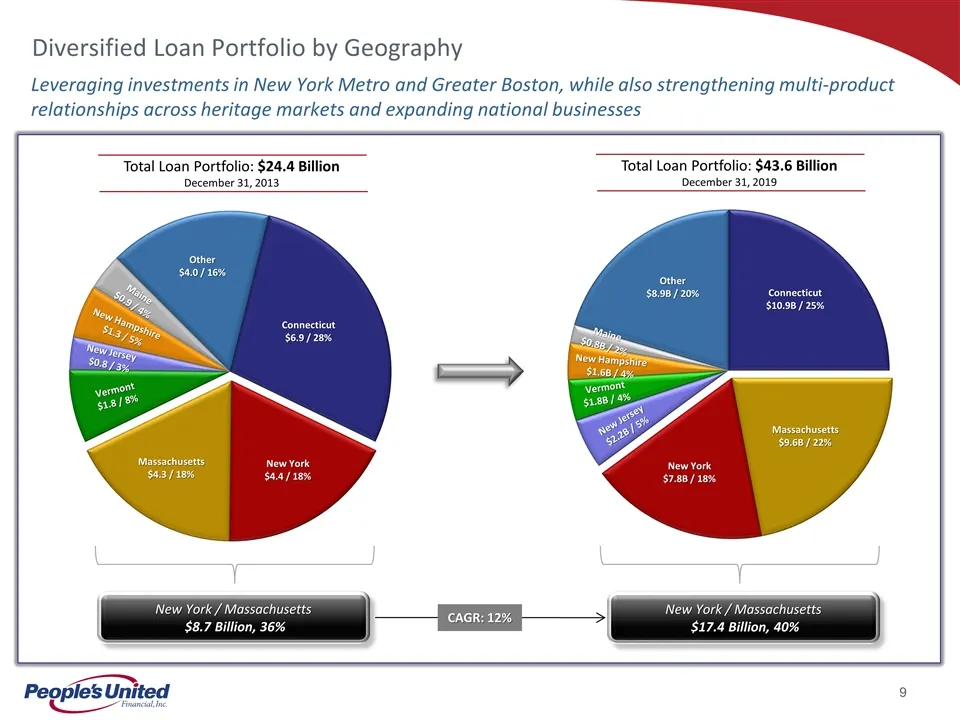
c Leveraging investments in New York Metro and Greater Boston, while also strengthening multi-product relationships across heritage markets and expanding national businesses Total Loan Portfolio: $24.4 Billion December 31, 2013 Total Loan Portfolio: $43.6 Billion December 31, 2019 New York / Massach
Slide 11: Sustained Exceptional Asset Quality
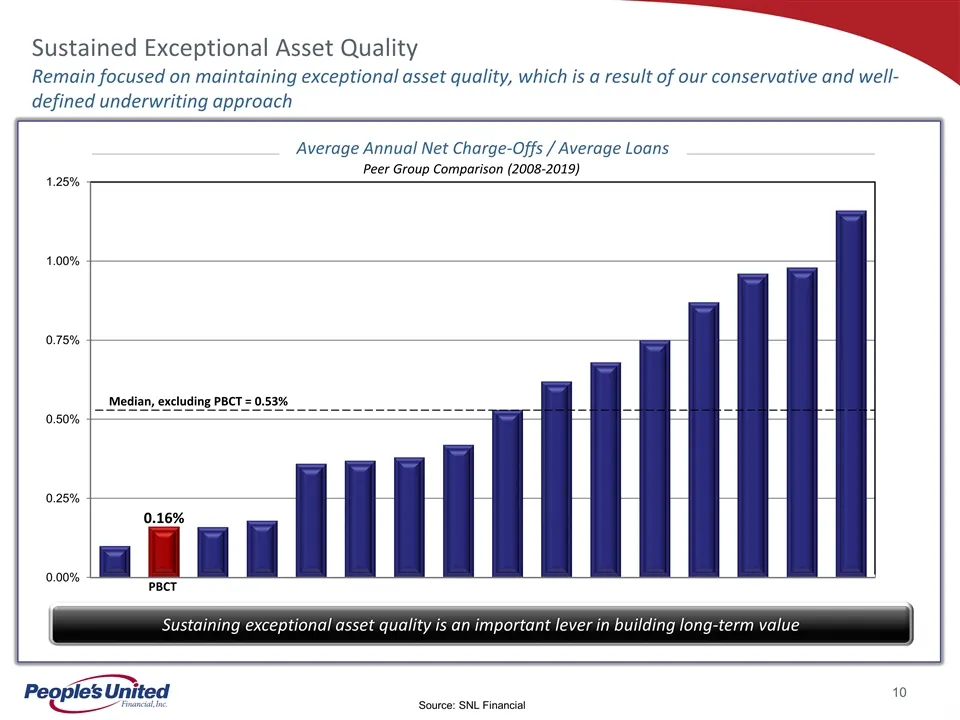
c 0.16% PBCT Median, excluding PBCT = 0.53% Source: SNL Financial Sustained Exceptional Asset Quality Remain focused on maintaining exceptional asset quality, which is a result of our conservative and well-defined underwriting approach Sustaining exceptional asset quality is an important lever in bu
Slide 12: High Quality Securities Portfolio
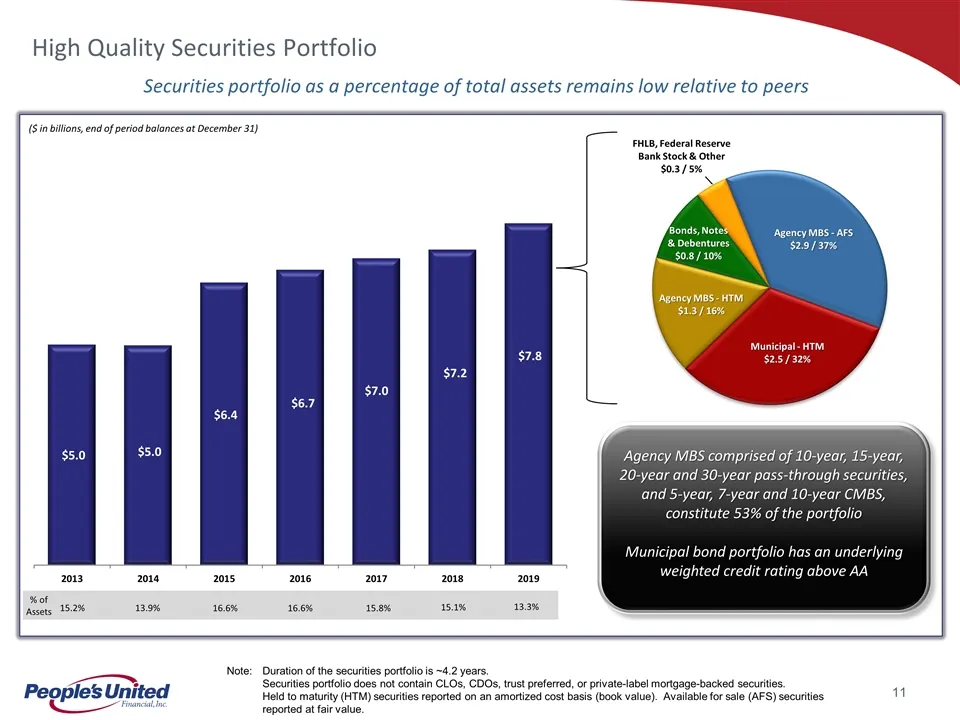
c FHLB, Federal Reserve Bank Stock & Other $0.3 / 5% High Quality Securities Portfolio ($ in billions, end of period balances at December 31) Agency MBS comprised of 10-year, 15-year, 20-year and 30-year pass-through securities, and 5-year, 7-year and 10-year CMBS, constitute 53% of the portfolio Mu
Slide 13: Emphasizing Deposit Gathering Across the Franchise
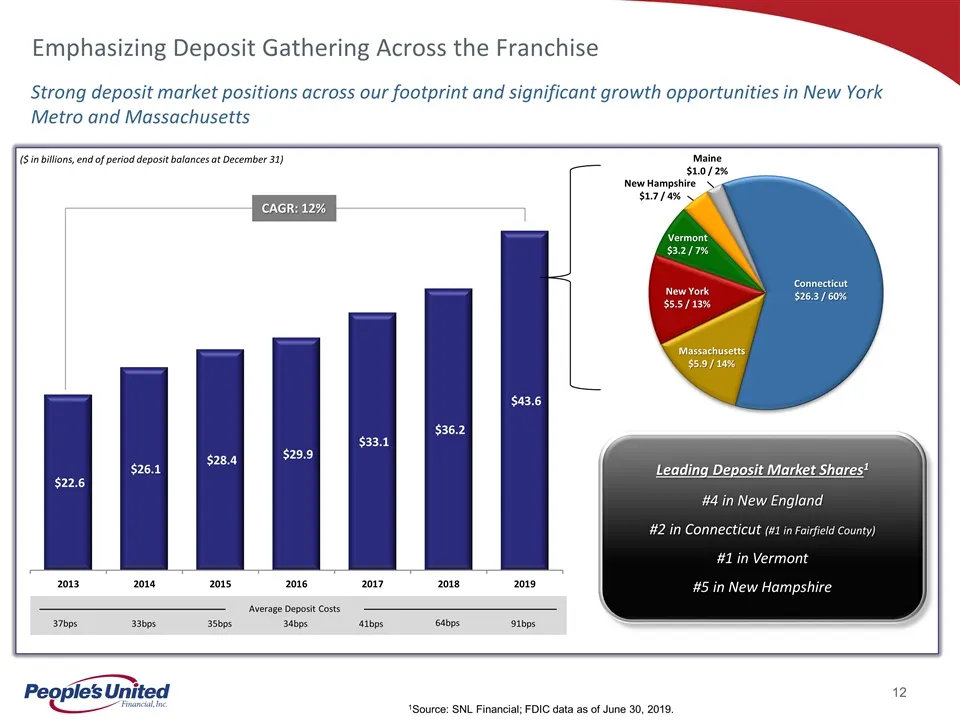
c Emphasizing Deposit Gathering Across the Franchise CAGR: 12% Strong deposit market positions across our footprint and significant growth opportunities in New York Metro and Massachusetts ($ in billions, end of period deposit balances at December 31) Leading Deposit Market Shares1 #4 in New England
Slide 14: Focusing on Revenue Growth: Net Interest Income
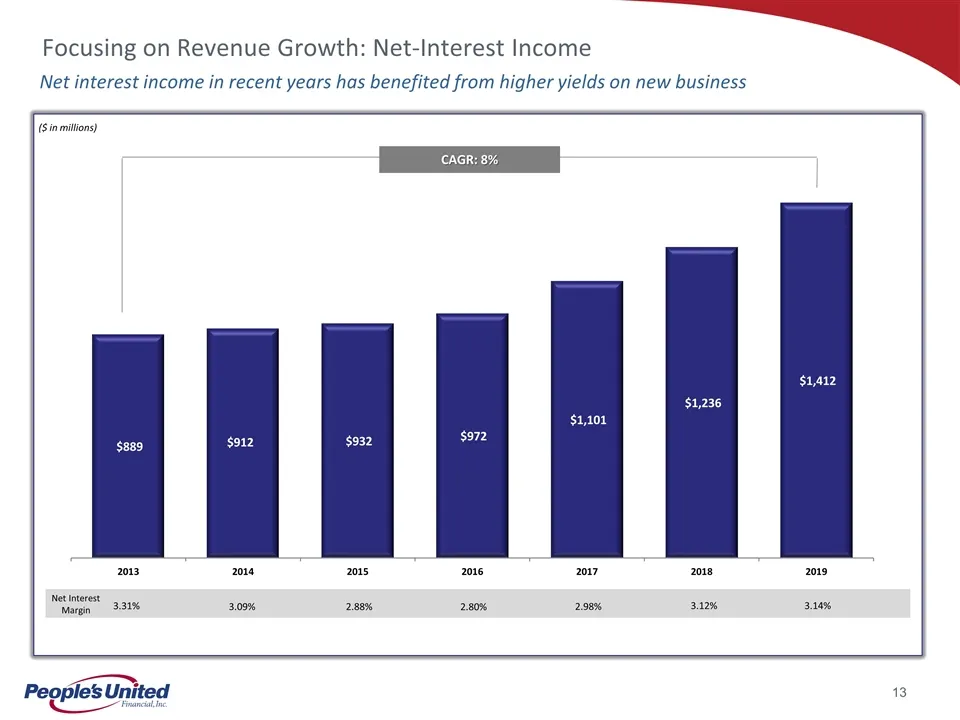
Net interest income in recent years has benefited from higher yields on new business Focusing on Revenue Growth: Net-Interest Income CAGR: 8% ($ in millions) 2.98% 2.88% 3.09% 3.31% Net Interest Margin 2.80% 3.12% 3.14%
Slide 15: Focusing on Revenue Growth: Non-Interest Income
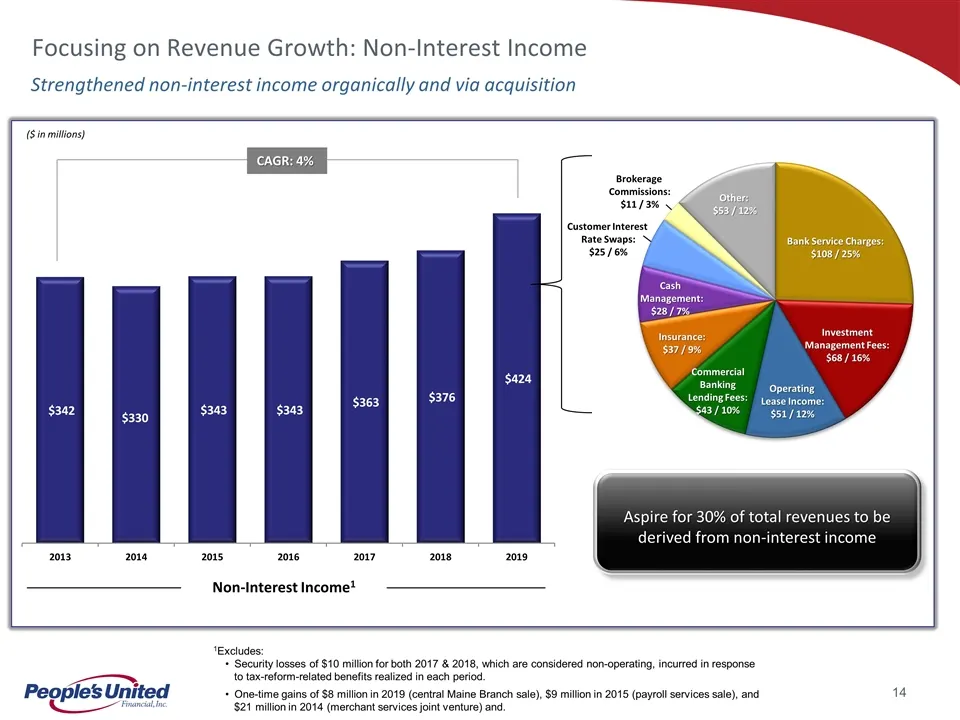
c Strengthened non-interest income organically and via acquisition Focusing on Revenue Growth: Non-Interest Income CAGR: 4% ($ in millions) Aspire for 30% of total revenues to be derived from non-interest income Bank Service Charges: $108 / 25% Operating Lease Income: $51 / 12% Other: $53 / 12% Non-
Slide 16: Enhancing Wealth Management Business
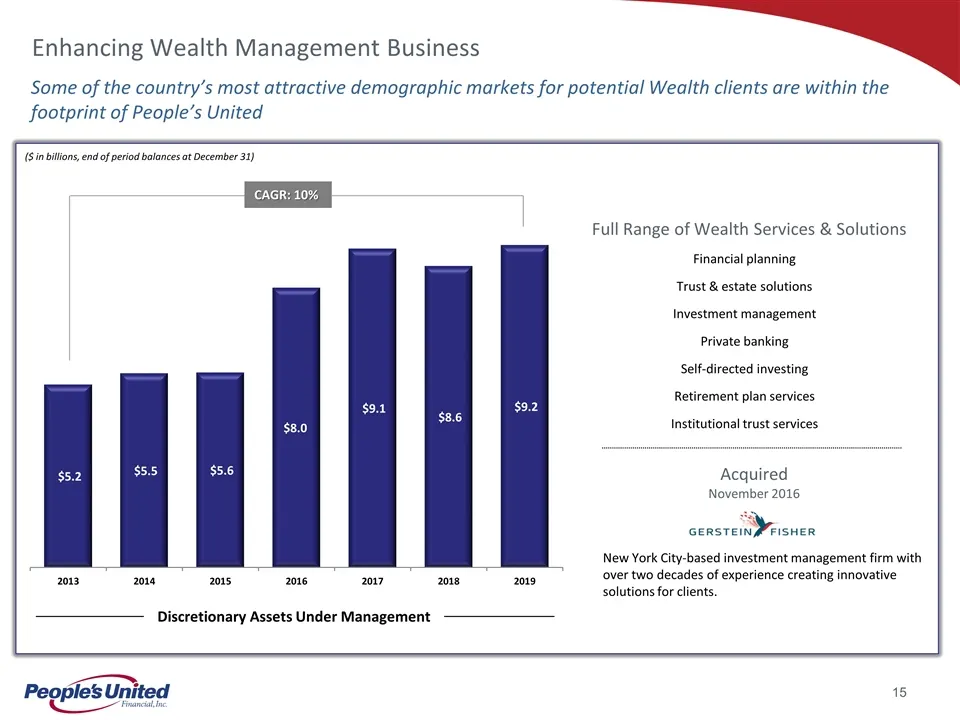
c Enhancing Wealth Management Business CAGR: 10% Discretionary Assets Under Management ($ in billions, end of period balances at December 31) Some of the country’s most attractive demographic markets for potential Wealth clients are within the footprint of People’s United Acquired November 2016 New
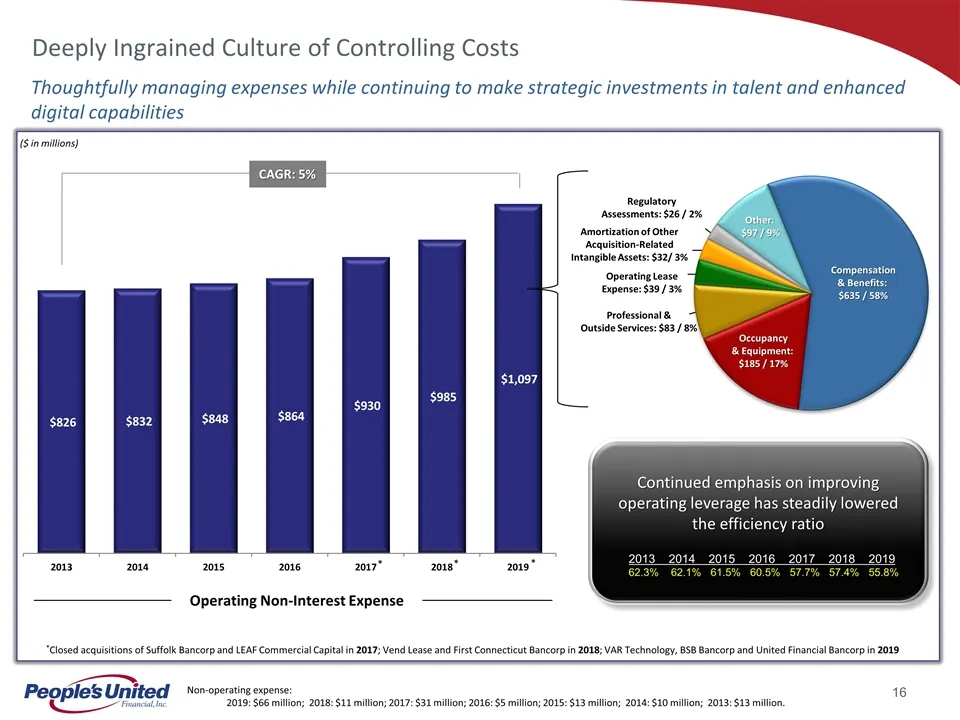
Slide 17: Deeply Ingrained Culture of Controlling Costs
c ($ in millions) Deeply Ingrained Culture of Controlling Costs Thoughtfully managing expenses while continuing to make strategic investments in talent and enhanced digital capabilities *Closed acquisitions of Suffolk Bancorp and LEAF Commercial Capital in 2017; Vend Lease and First Connecticut Banc
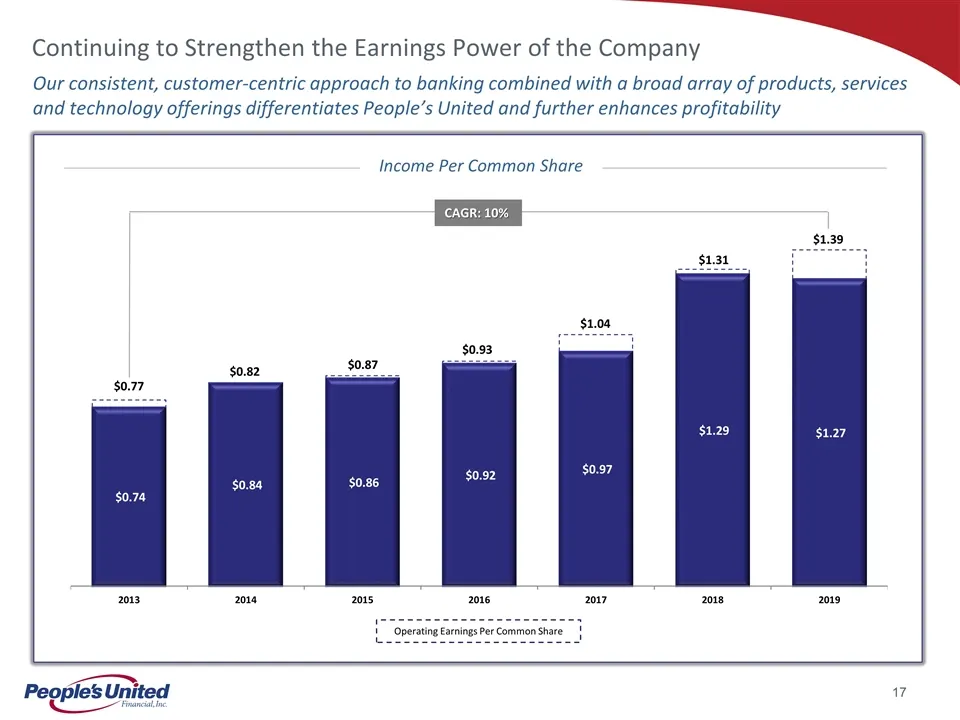
Slide 18: Continuing to Strengthen the Earnings Power of the Company
Continuing to Strengthen the Earnings Power of the Company CAGR: 10% Our consistent, customer-centric approach to banking combined with a broad array of products, services and technology offerings differentiates People’s United and further enhances profitability $1.04 Income Per Common Share Operati
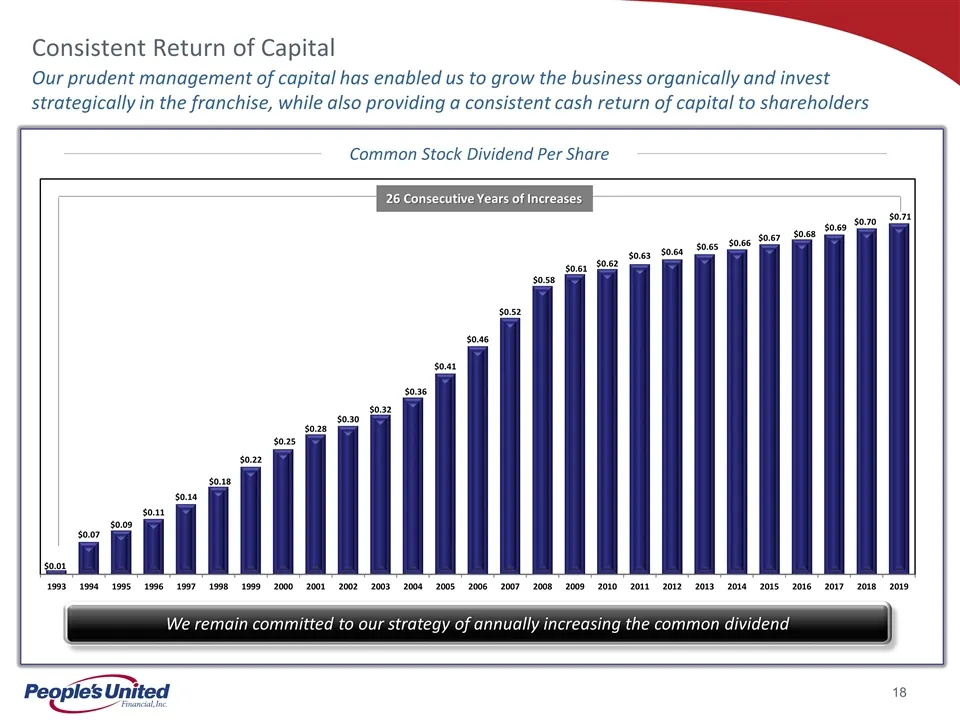
Slide 19: Consistent Return of Capital
c We remain committed to our strategy of annually increasing the common dividend Consistent Return of Capital Our prudent management of capital has enabled us to grow the business organically and invest strategically in the franchise, while also providing a consistent cash return of capital to share
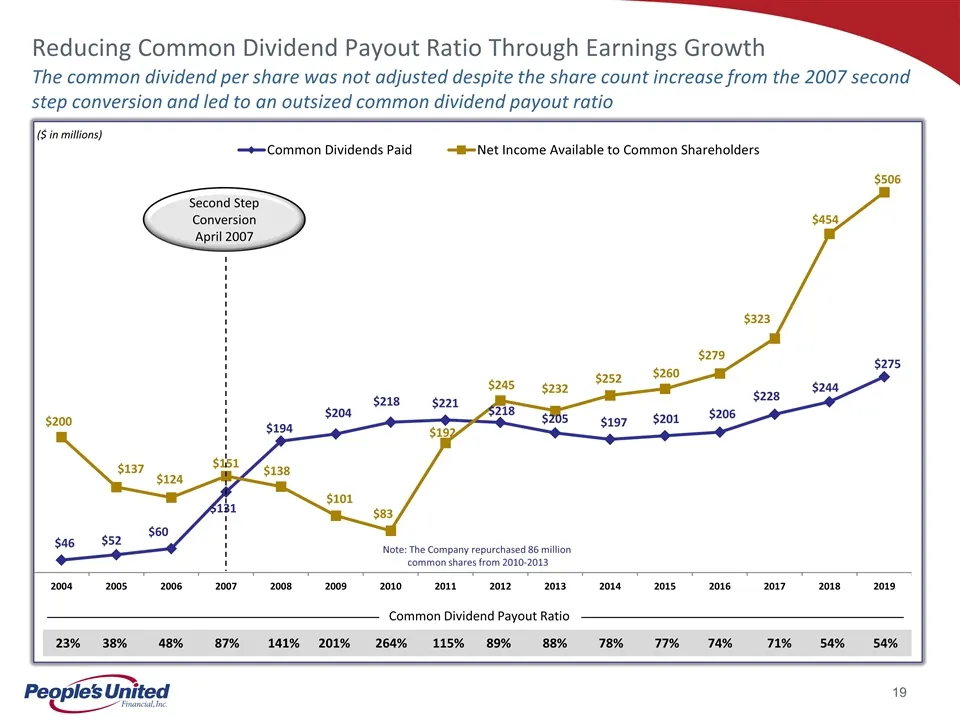
Slide 20: Reducing Common Dividend Payout Ratio Through Earnings Growth
Second Step Conversion April 2007 ($ in millions) The common dividend per share was not adjusted despite the share count increase from the 2007 second step conversion and led to an outsized common dividend payout ratio Reducing Common Dividend Payout Ratio Through Earnings Growth 23% 38% 48% 87% 141
Slide 21: Moving Forward
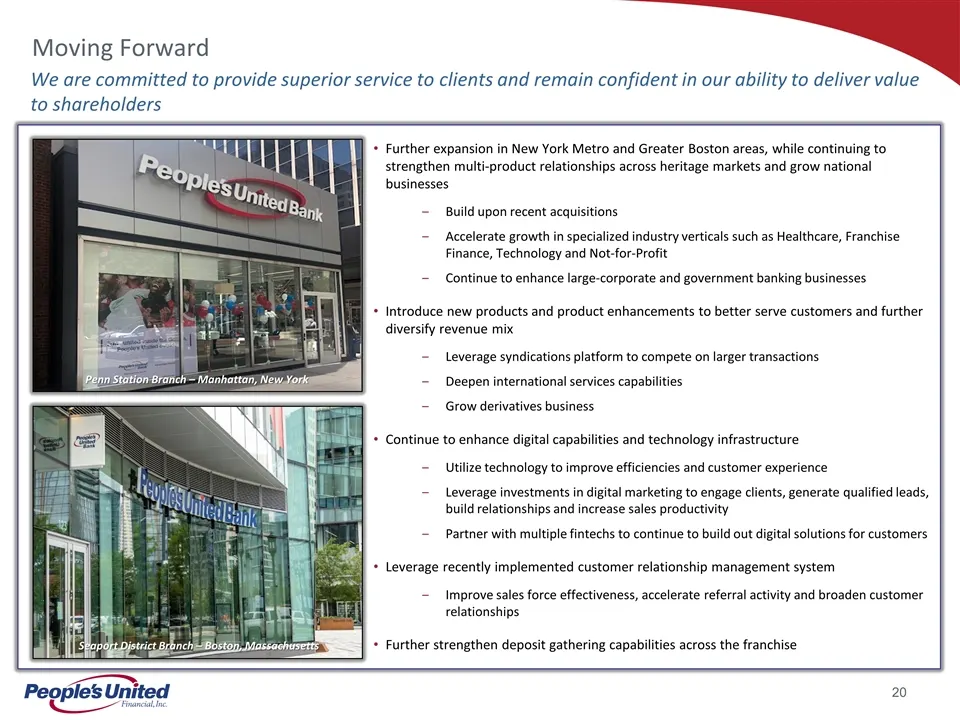
c Moving Forward Seaport District Branch – Boston, Massachusetts Penn Station Branch – Manhattan, New York Further expansion in New York Metro and Greater Boston areas, while continuing to strengthen multi-product relationships across heritage markets and grow national businesses Build upon recent a
Slide 22: Shareholder Focused Corporate Governance Structure
c Shareholder Focused Corporate Governance Structure Diverse Board of Directors with broad experience, expertise and qualifications Ten of the Company’s twelve directors are independent Independent members of Board meet regularly in executive session Each member of Compensation, Nominating and Gover
Slide 23: Community Partnership Matters
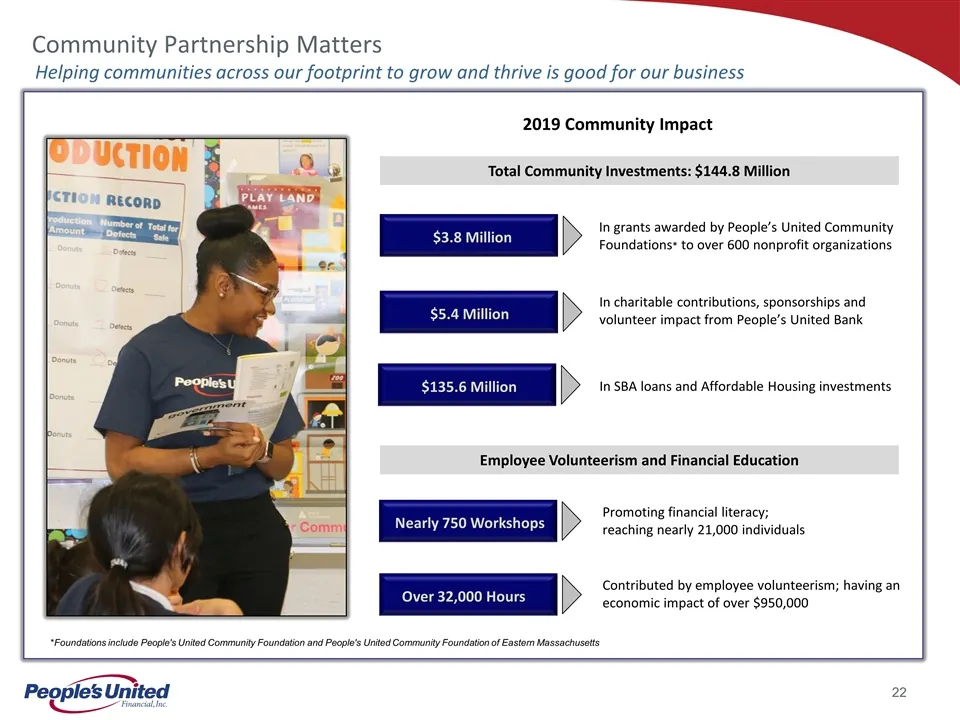
c Helping communities across our footprint to grow and thrive is good for our business Community Partnership Matters $3.8 Million $5.4 Million Nearly 750 Workshops $135.6 Million Over 32,000 Hours In grants awarded by People’s United Community Foundations* to over 600 nonprofit organizations In char
Slide 24: Fourth Quarter and Full Year 2019 Results
Fourth Quarter and Full Year 2019 Results
Slide 25: Full Year 2019 Overview
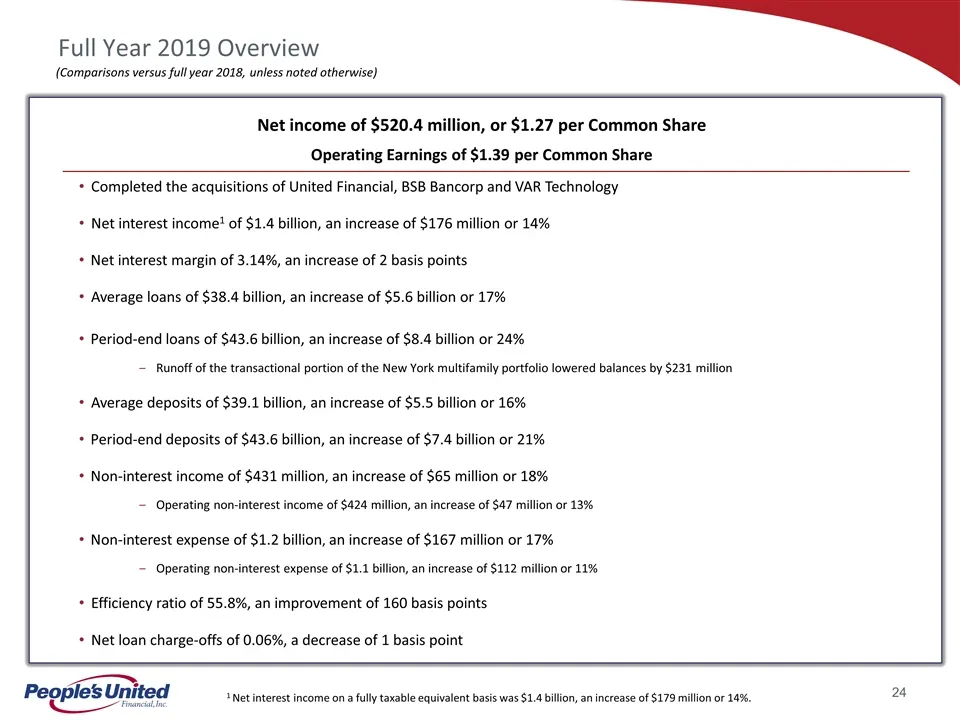
1 Net interest income on a fully taxable equivalent basis was $1.4 billion, an increase of $179 million or 14%. Full Year 2019 Overview Net income of $520.4 million, or $1.27 per Common Share Operating Earnings of $1.39 per Common Share Completed the acquisitions of United Financial, BSB Bancorp and
Slide 26: Full Year 2020 Goals
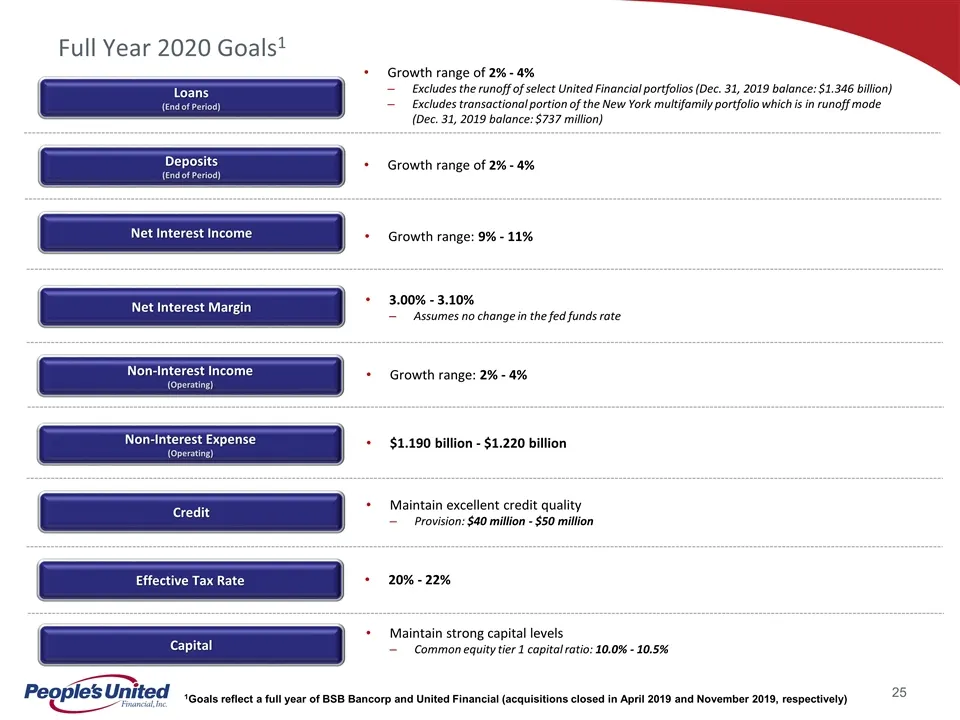
Full Year 2020 Goals1 Net Interest Income Net Interest Margin Non-Interest Expense (Operating) Credit Capital Growth range: 9% - 11% 3.00% - 3.10% Assumes no change in the fed funds rate Growth range: 2% - 4% $1.190 billion - $1.220 billion Maintain excellent credit quality Provision: $40 million -
Slide 27: Fourth Quarter 2019 Overview
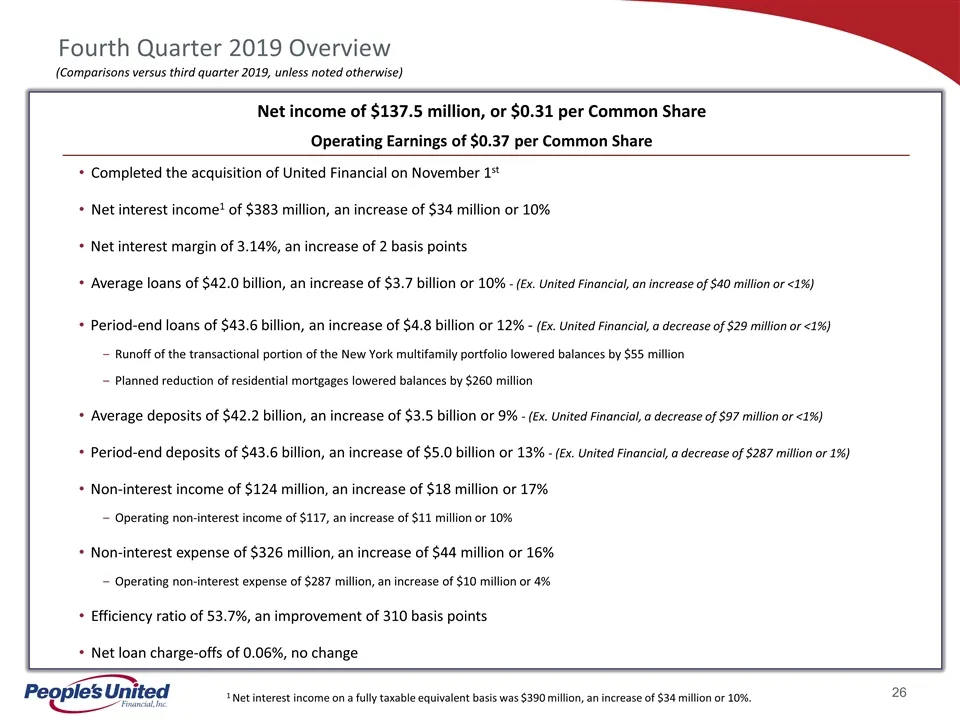
1 Net interest income on a fully taxable equivalent basis was $390 million, an increase of $34 million or 10%. Fourth Quarter 2019 Overview Net income of $137.5 million, or $0.31 per Common Share Operating Earnings of $0.37 per Common Share Completed the acquisition of United Financial on November 1
Slide 28: Net Interest Income
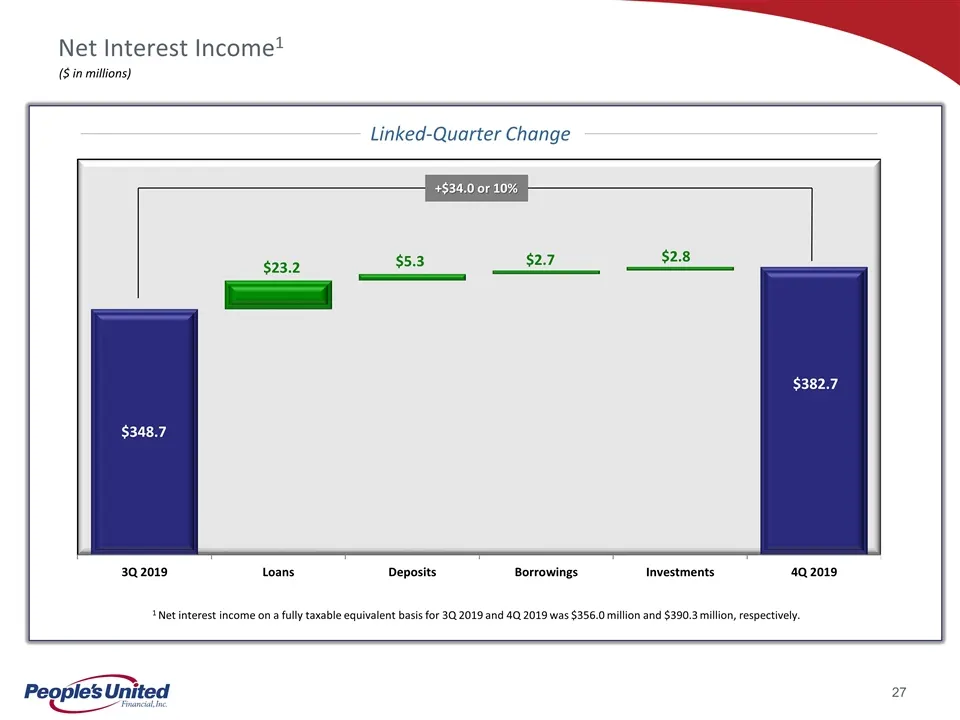
Net Interest Income1 ($ in millions) $348.7 $382.7 1 Net interest income on a fully taxable equivalent basis for 3Q 2019 and 4Q 2019 was $356.0 million and $390.3 million, respectively. +$34.0 or 10% Linked-Quarter Change $23.2 $5.3 $2.7 $2.8
Slide 29: Net Interest Margin
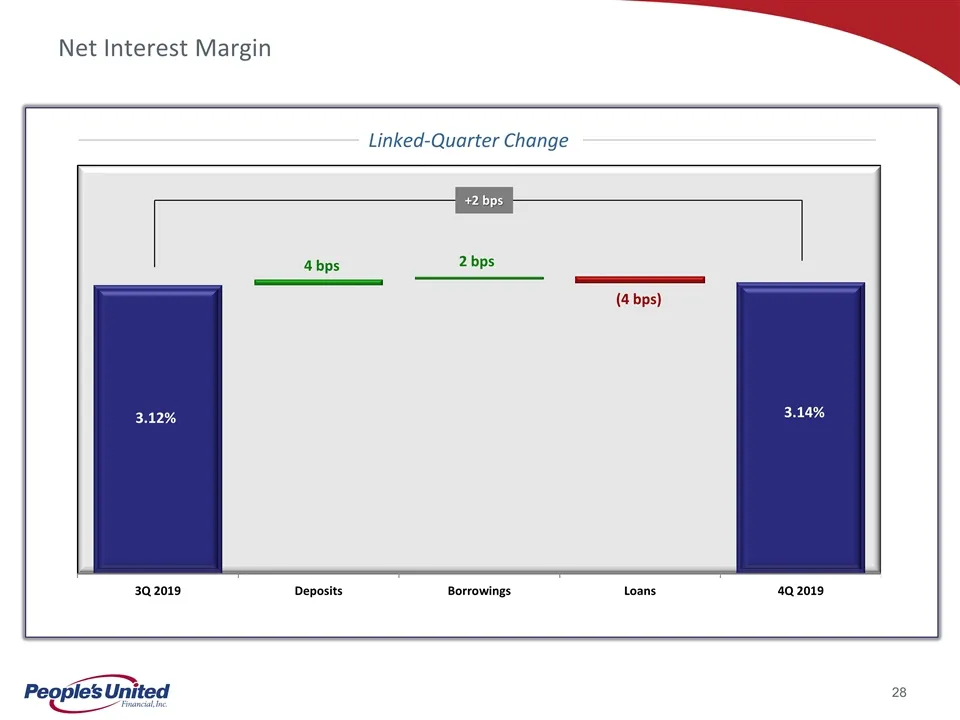
Net Interest Margin 3.12% 3.14% +2 bps Linked-Quarter Change 4 bps 2 bps (4 bps)
Slide 30: Loans: Average Balances
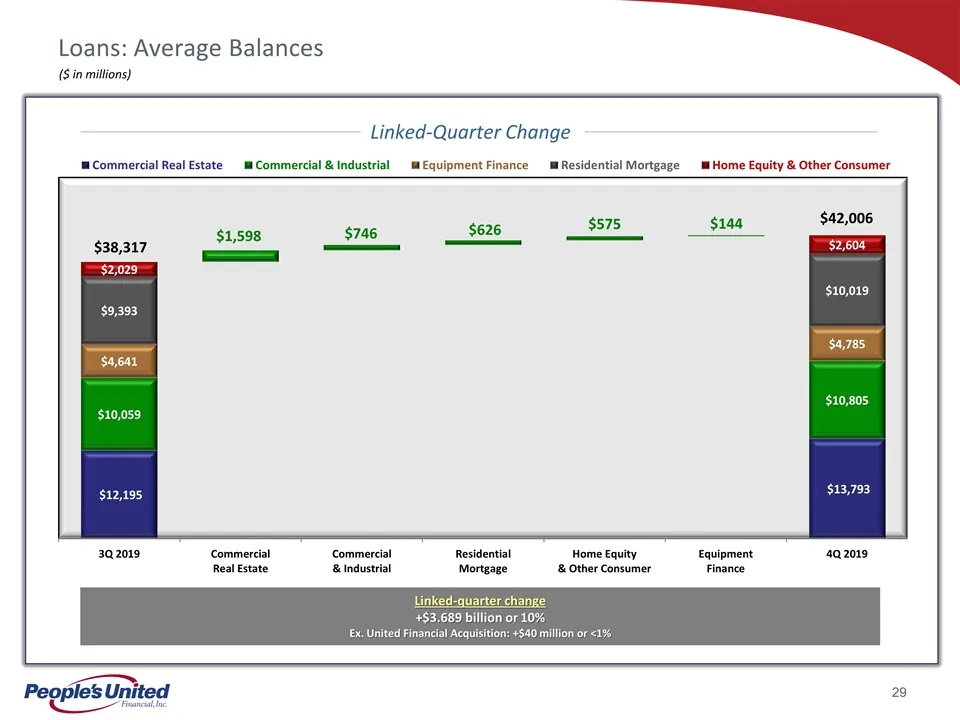
Loans: Average Balances $42,006 ($ in millions) $38,317 Linked-Quarter Change Linked-quarter change +$3.689 billion or 10% Ex. United Financial Acquisition: +$40 million or <1% $1,598 $746 $626 $575 $144
Slide 31: Deposits: Average Balances
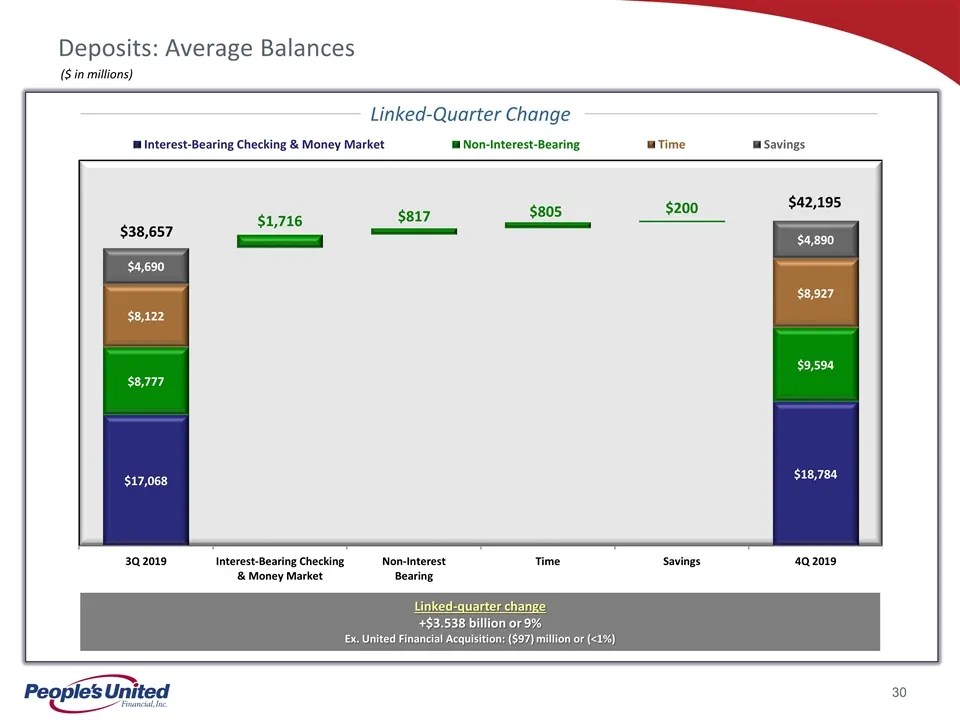
Deposits: Average Balances ($ in millions) $42,195 $38,657 Linked-Quarter Change Linked-quarter change +$3.538 billion or 9% Ex. United Financial Acquisition: ($97) million or (<1%) $1,716 $817 $805 $200
Slide 32: Non-Interest Income
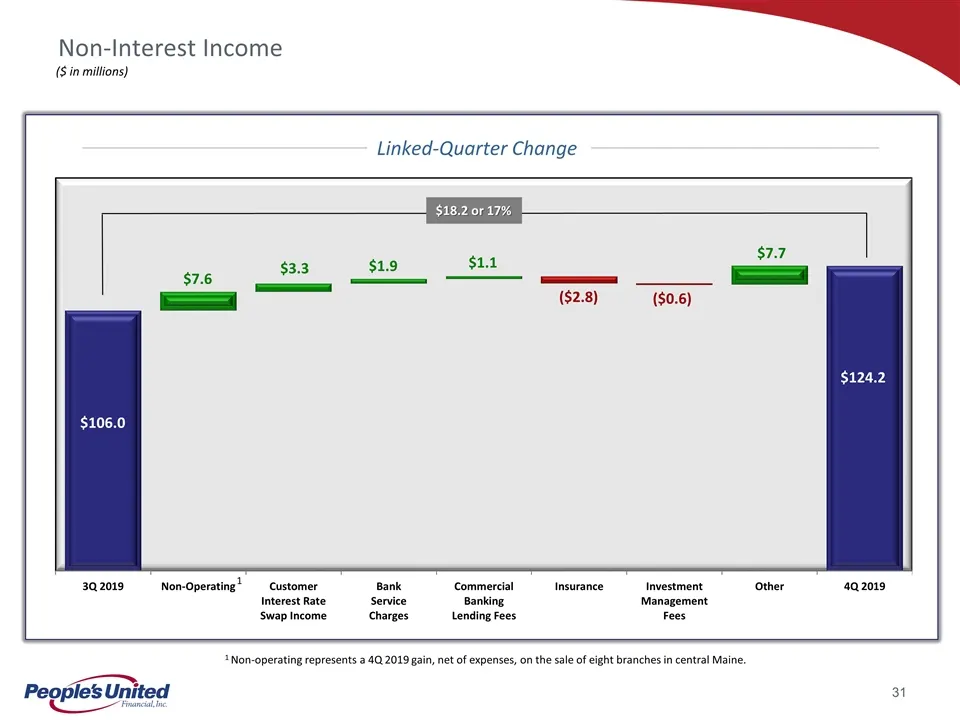
Non-Interest Income ($ in millions) $106.0 $124.2 $18.2 or 17% Linked-Quarter Change 1 Non-operating represents a 4Q 2019 gain, net of expenses, on the sale of eight branches in central Maine. $7.6 1 $3.3 $1.9 $1.1 $7.7 ($2.8) ($0.6)
Slide 33: Non-Interest Expense
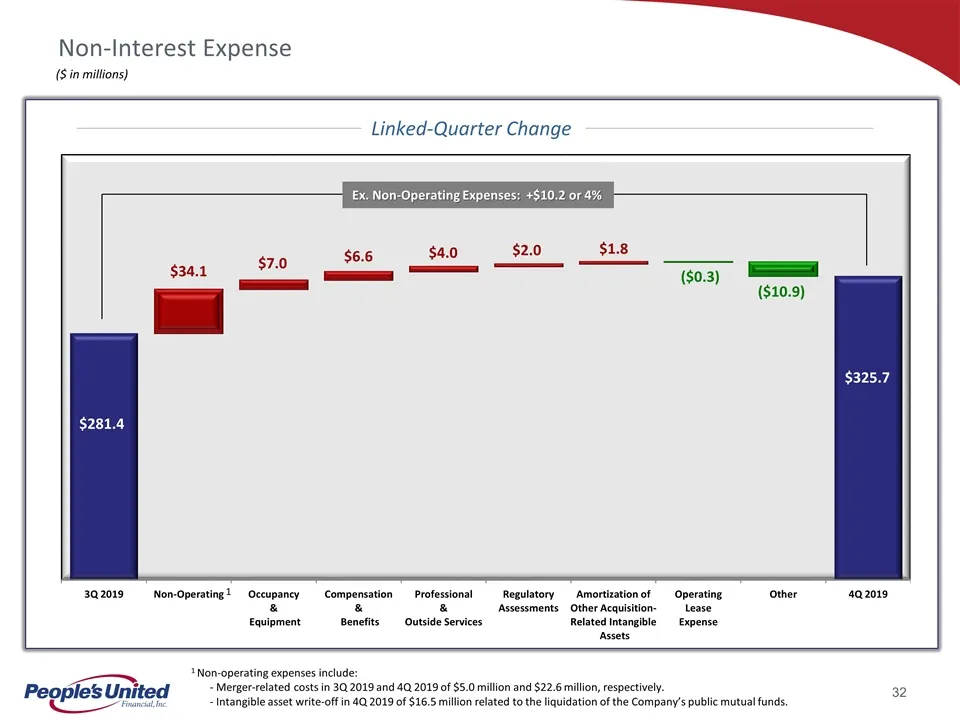
Non-Interest Expense ($ in millions) $325.7 $281.4 Ex. Non-Operating Expenses: +$10.2 or 4% Linked-Quarter Change $34.1 1 1 Non-operating expenses include: - Merger-related costs in 3Q 2019 and 4Q 2019 of $5.0 million and $22.6 million, respectively. - Intangible asset write-off in 4Q 2019 of $16.5
Slide 34: Efficiency Ratio Quarterly Trend
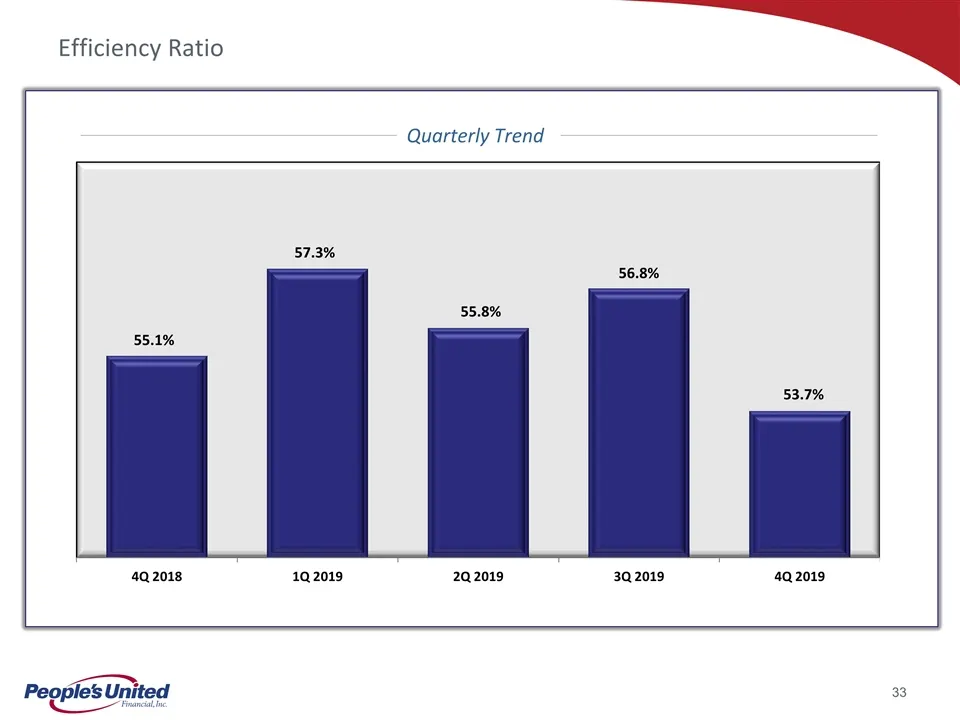
Efficiency Ratio Quarterly Trend
Slide 35: Asset Quality
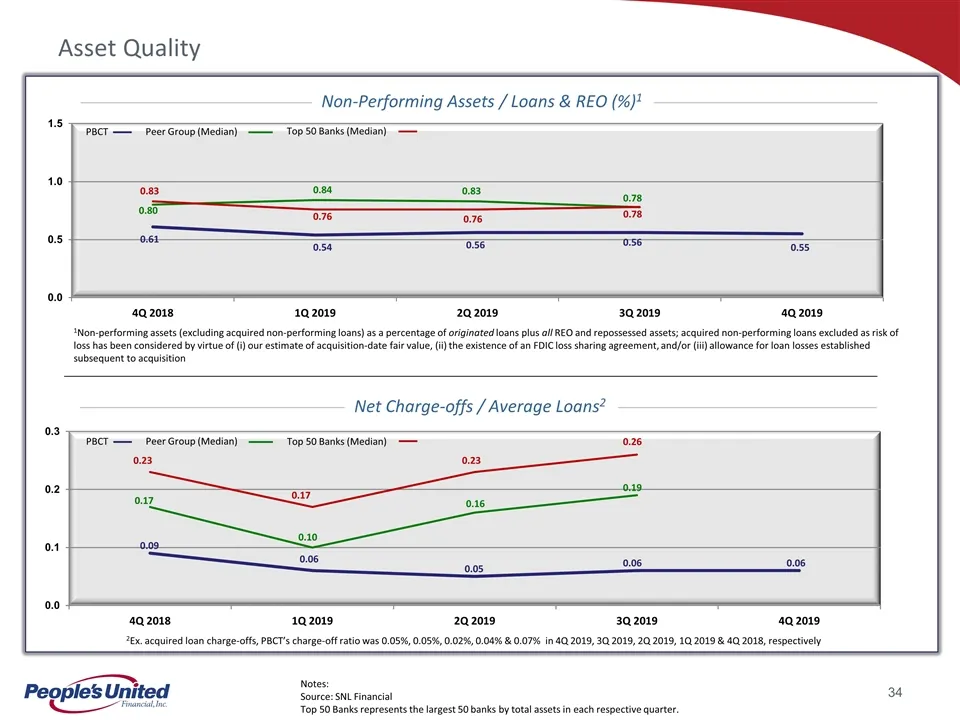
Asset Quality 1Non-performing assets (excluding acquired non-performing loans) as a percentage of originated loans plus all REO and repossessed assets; acquired non-performing loans excluded as risk of loss has been considered by virtue of (i) our estimate of acquisition-date fair value, (ii) the ex
Slide 36: Returns
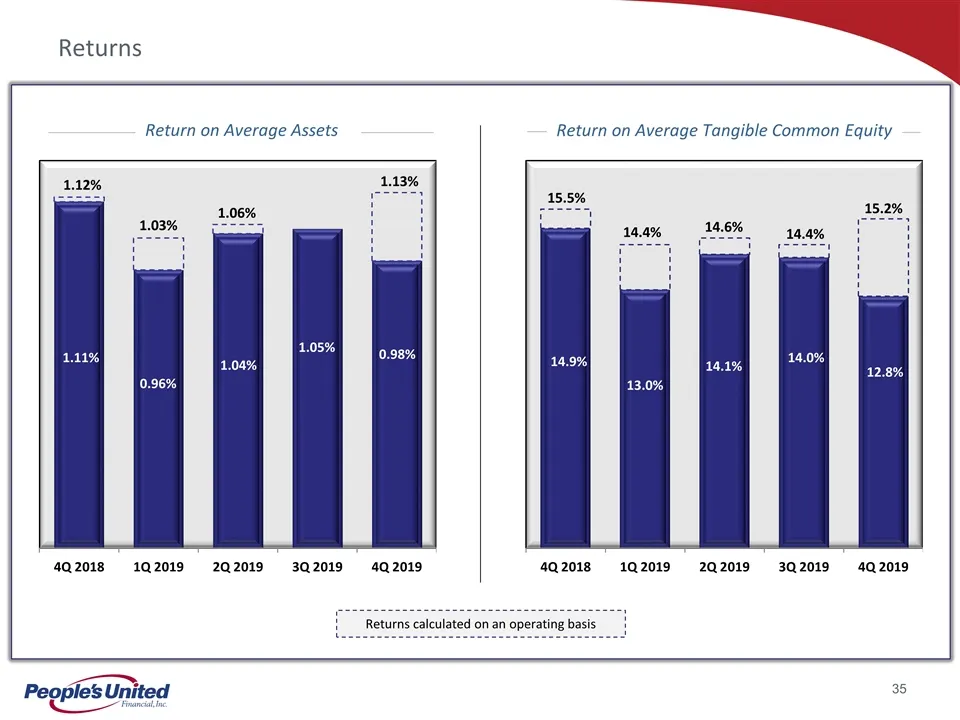
Returns Return on Average Assets Return on Average Tangible Common Equity Returns calculated on an operating basis 14.4% 1.03% 14.6% 1.06% 14.4% 1.12% 15.5% 1.13% 15.2%
Slide 37: Capital Ratios
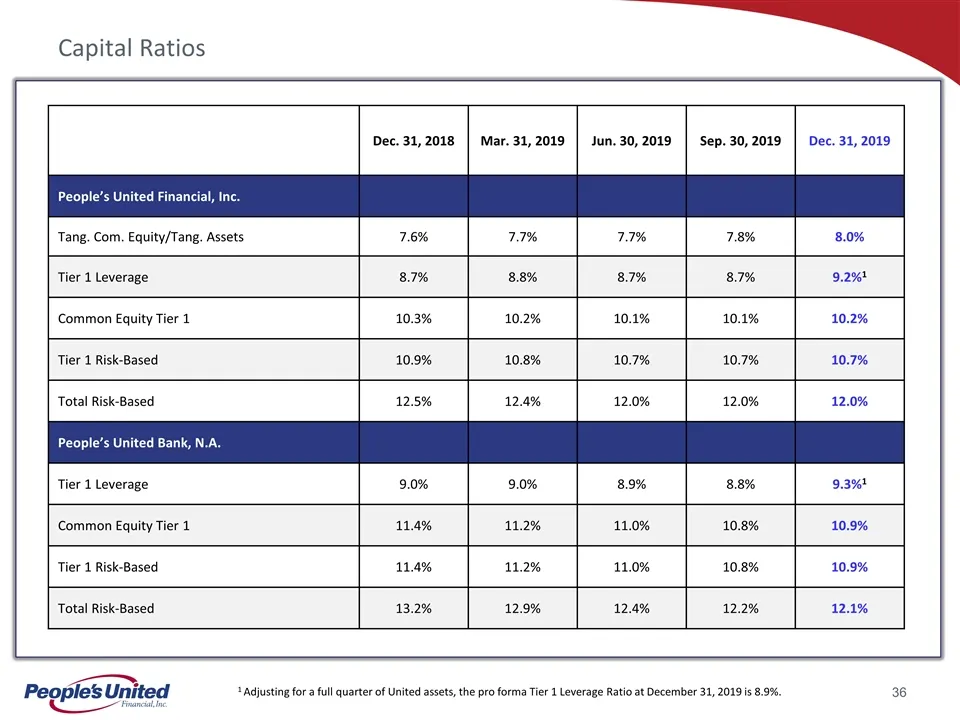
Capital Ratios Dec. 31, 2018 Mar. 31, 2019 Jun. 30, 2019 Sep. 30, 2019 Dec. 31, 2019 People’s United Financial, Inc. Tang. Com. Equity/Tang. Assets 7.6% 7.7% 7.7% 7.8% 8.0% Tier 1 Leverage 8.7% 8.8% 8.7% 8.7% 9.2%1 Common Equity Tier 1 10.3% 10.2% 10.1% 10.1% 10.2% Tier 1 Risk-Based 10.9% 10.8% 10.7
Slide 38: Appendix
Appendix
Slide 39: Interest Rate Risk Profile
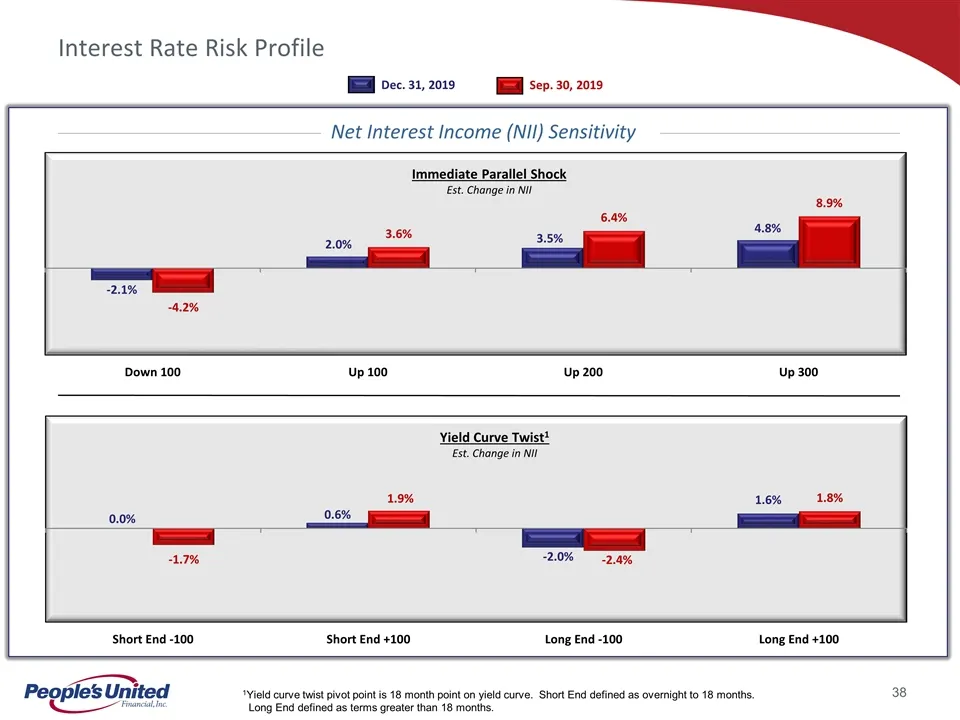
Interest Rate Risk Profile 1Yield curve twist pivot point is 18 month point on yield curve. Short End defined as overnight to 18 months. Long End defined as terms greater than 18 months. Immediate Parallel Shock Est. Change in NII Yield Curve Twist1 Est. Change in NII Dec. 31, 2019 Sep. 30, 2019 Net
Slide 40: Loans By State
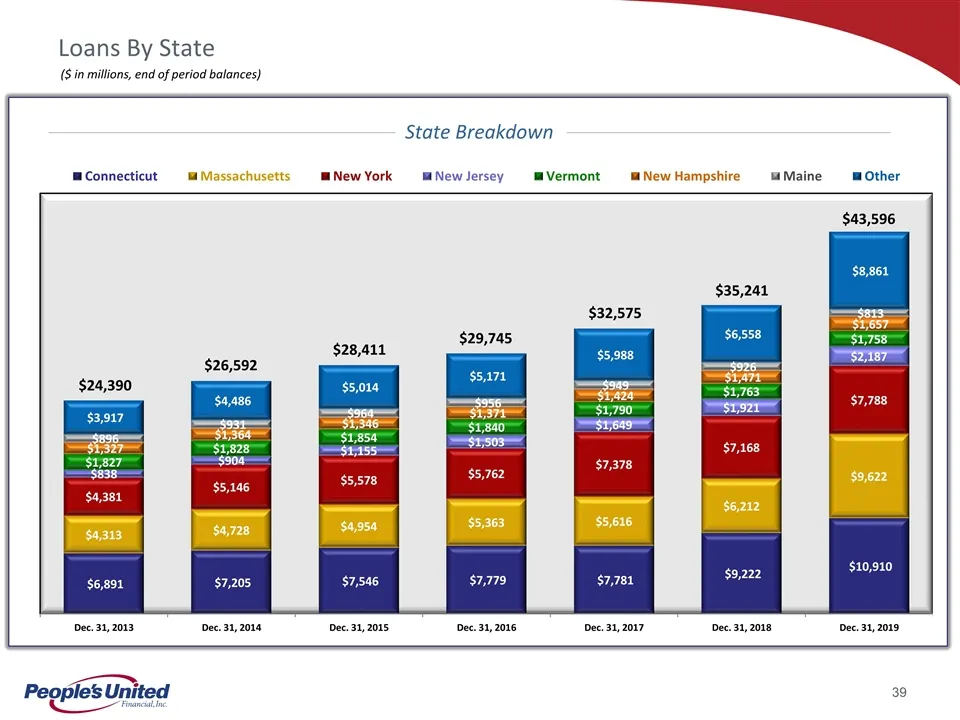
Loans By State $24,390 $26,592 $29,745 $32,575 $28,411 ($ in millions, end of period balances) State Breakdown $35,241 $43,596
Slide 41: Deposits By State
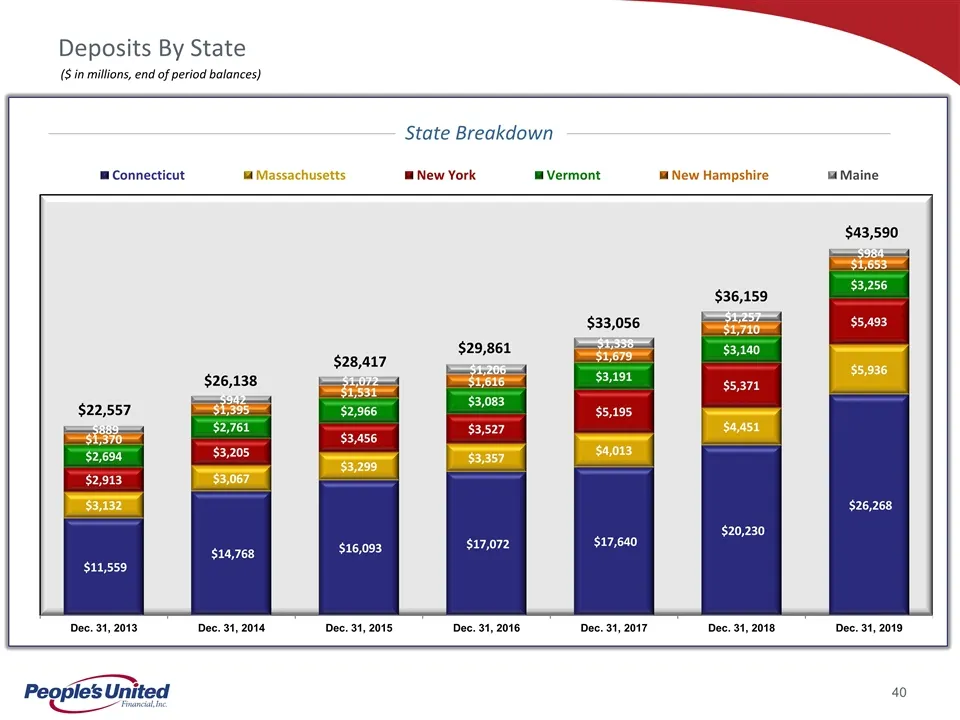
Deposits By State $22,557 $26,138 $29,861 $33,056 $28,417 ($ in millions, end of period balances) State Breakdown $36,159 $43,590
Slide 42: Asset Quality
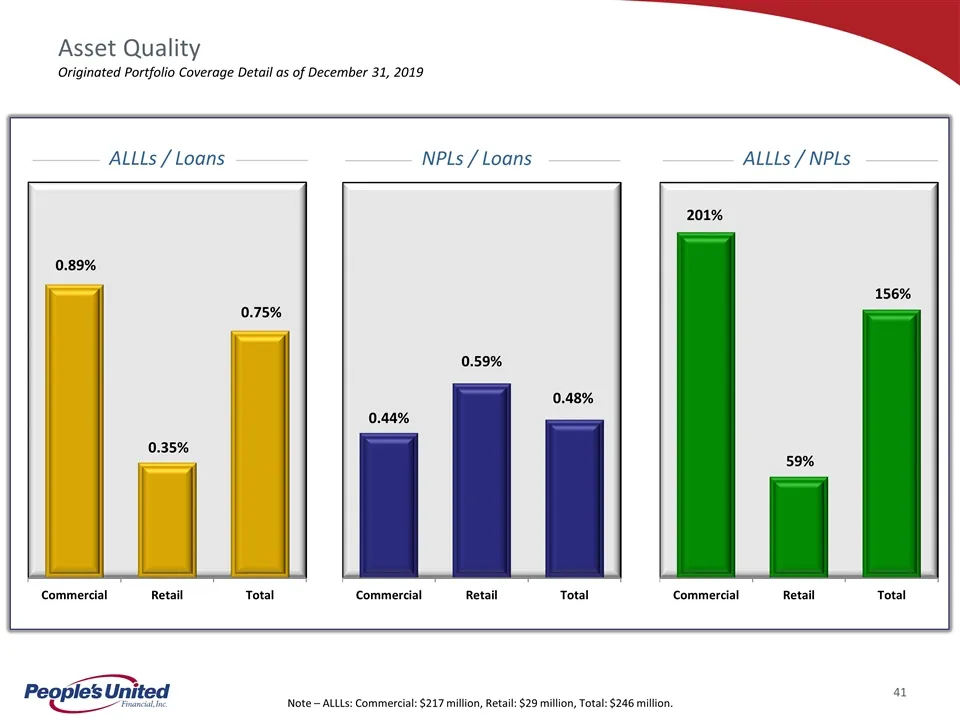
Asset Quality Originated Portfolio Coverage Detail as of December 31, 2019 Note – ALLLs: Commercial: $217 million, Retail: $29 million, Total: $246 million. ALLLs / Loans NPLs / Loans ALLLs / NPLs
Slide 43: Peer Group
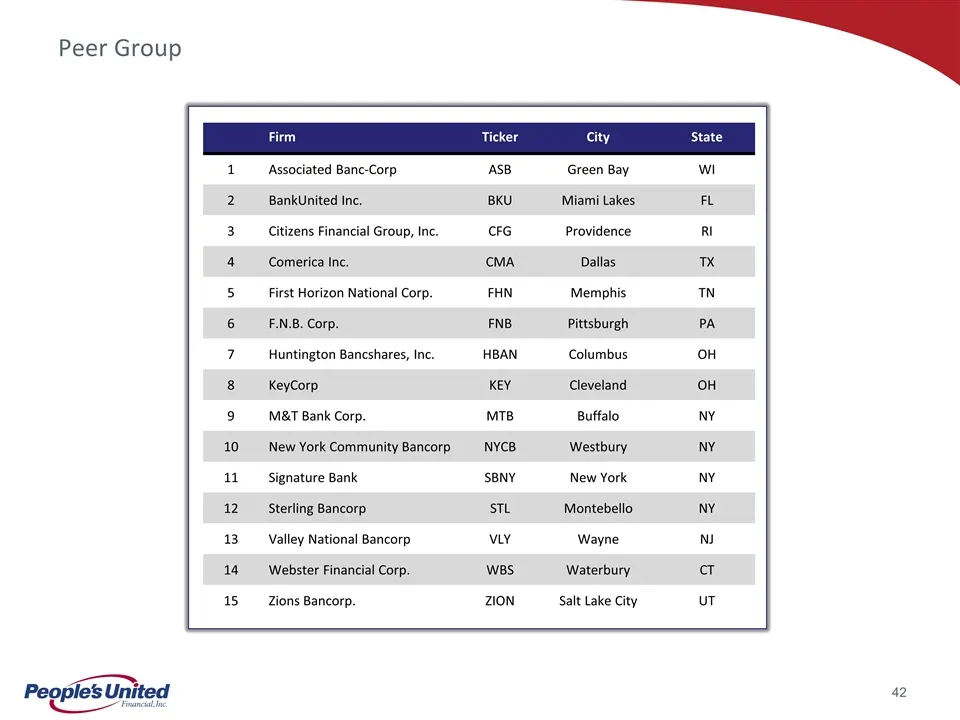
Peer Group Firm Ticker City State 1 Associated Banc-Corp ASB Green Bay WI 2 BankUnited Inc. BKU Miami Lakes FL 3 Citizens Financial Group, Inc. CFG Providence RI 4 Comerica Inc. CMA Dallas TX 5 First Horizon National Corp. FHN Memphis TN 6 F.N.B. Corp. FNB Pittsburgh PA 7 Huntington Bancshares, Inc.
Slide 44: Non-GAAP Financial Measures and Reconciliation to GAAP
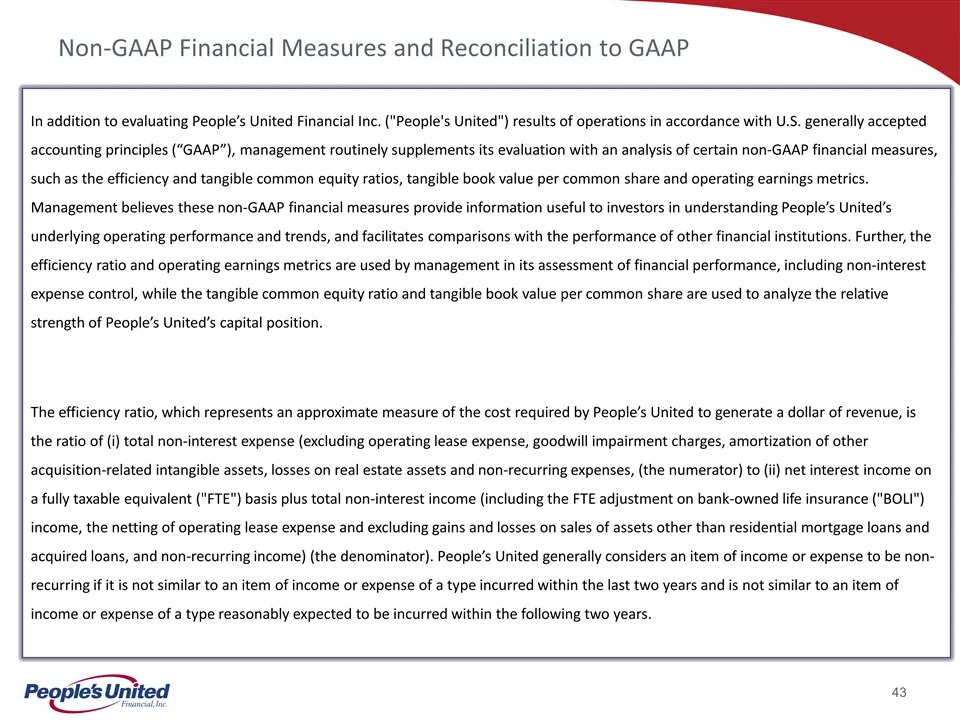
Non-GAAP Financial Measures and Reconciliation to GAAP In addition to evaluating People’s United Financial Inc. ("People's United") results of operations in accordance with U.S. generally accepted accounting principles (“GAAP”), management routinely supplements its evaluation with an analysis of cer
Slide 45: Non-GAAP Financial Measures and Reconciliation to GAAP
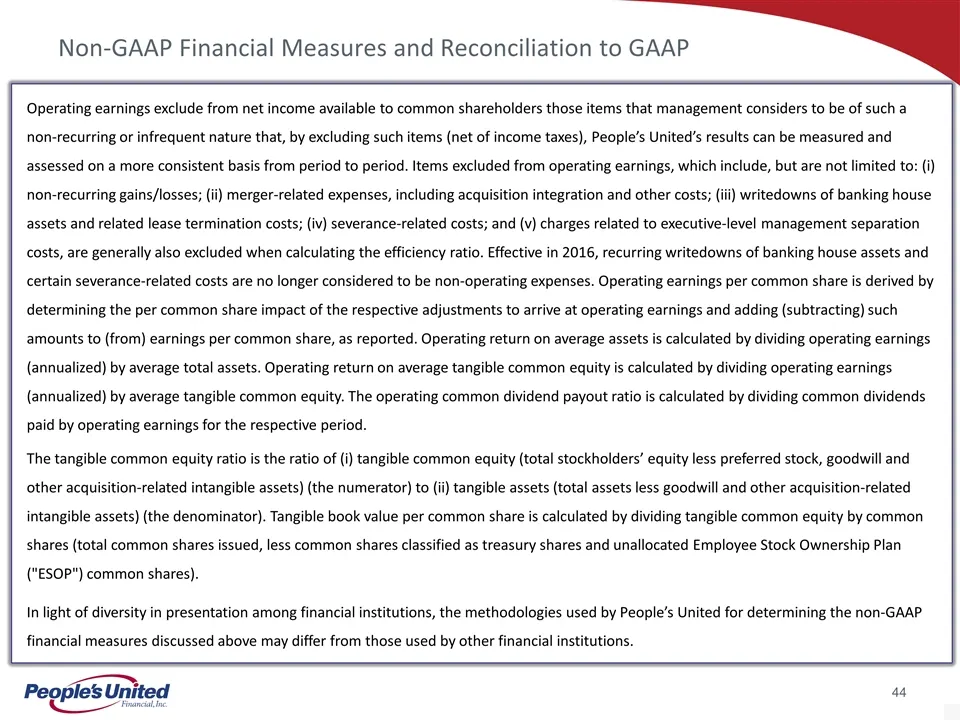
Non-GAAP Financial Measures and Reconciliation to GAAP Operating earnings exclude from net income available to common shareholders those items that management considers to be of such a non-recurring or infrequent nature that, by excluding such items (net of income taxes), People’s United’s results c
Slide 46: Investor Contact
For more information, investors may contact: Andrew S. Hersom (203) 338-4581 andrew.hersom@ peoples.com
Source: SEC EDGAR · 8-K filed Feb 13, 2020
More decks from People's United Financial Inc
 Merger or Acquisition (February 2021)23 slides · Feb 22, 2021
 Q4 2020 Earnings Presentation24 slides · Jan 22, 2021
 Investor Presentation (November 2020)44 slides · Nov 10, 2020
 Q3 2020 Earnings Presentation22 slides · Oct 23, 2020
 Q2 2020 Earnings Presentation23 slides · Jul 24, 2020
 Q1 2020 Earnings Presentation26 slides · Apr 24, 2020