Santander Holdings USA Inc · NYSE:SNUS/PH
Santander Holdings USA — Debt Investor Presentation (March 2024)
35 slides from Santander Holdings USA's debt investor presentation, Mar 4, 2024
Slide 1: Fourth Quarter 2023 Fixed Income Investor Presentation
March 4, 2024 Fourth Quarter 2023 Fixed Income Investor Presentation
Slide 2: Important Information
Important Information This presentation of Santander Holdings USA, Inc. ("SHUSA") contains “forward-looking statements" within the meaning of the Private Securities Litigation Reform Act of 1995 regarding the Financial condition, results of operations, business plans and future performance of SHUSA.
Slide 3: Index
Index At a Glance Result Capital & ix Ss i= vas ~]
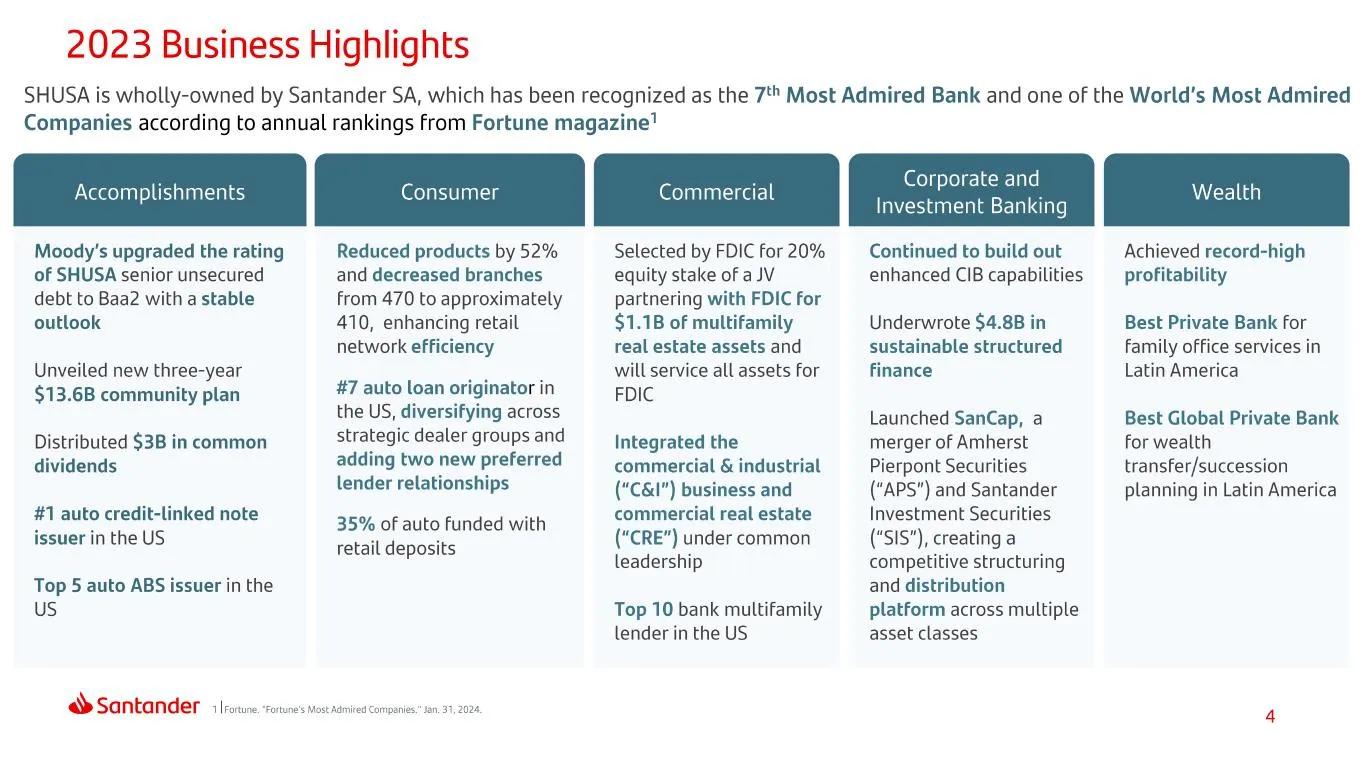
Slide 4: 2023 Business Highlights
2023 Business Highlights SHUSA is wholly-owned by Santander SA, which has been recognized as the 7" Most Admired Bank and one of the World's Most Admired Companies according to annual rankings from Fortune magazine’ Accomplishments Consumer Commercial Slip elle ened Wealth Investment Banking Moody's
Slide 5: SHUSA 2023 Results at a Glance
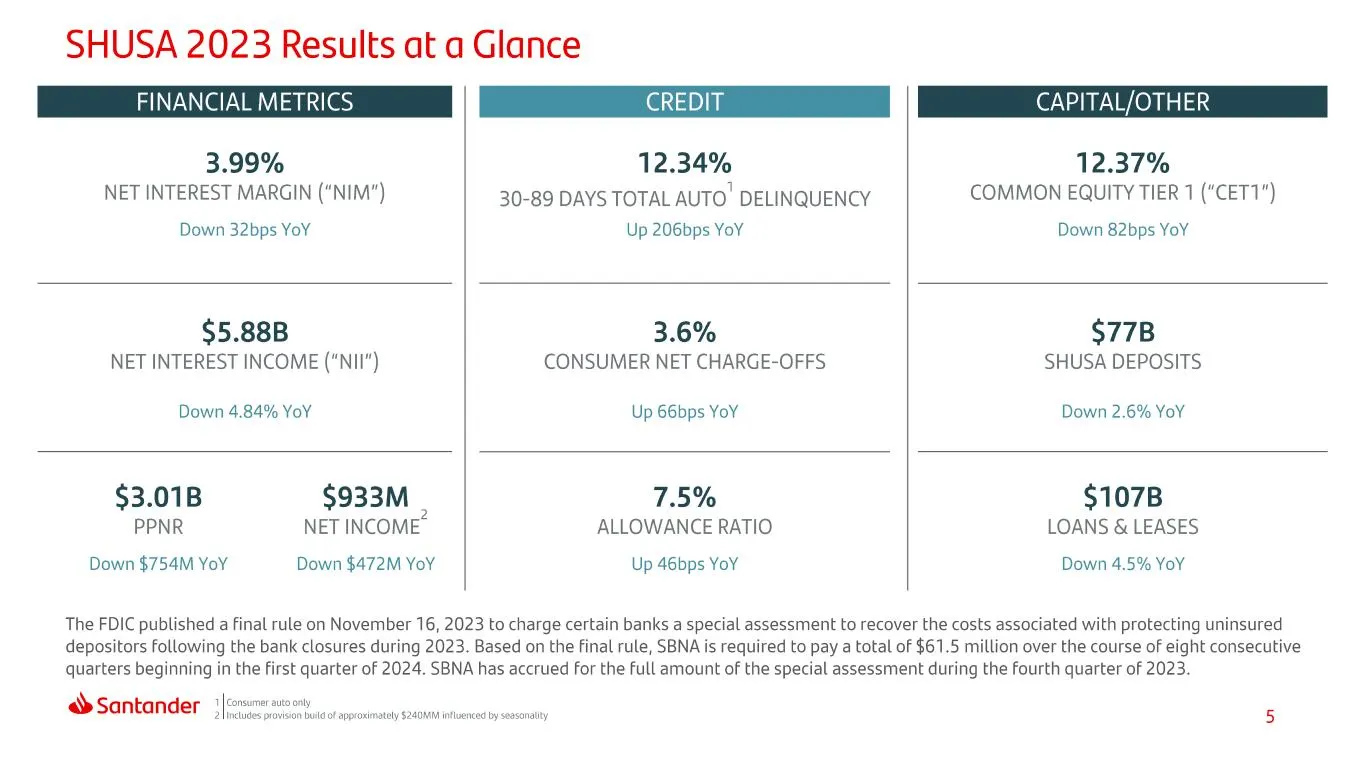
SHUSA 2023 Results at a Glance FINANCIAL METRICS CREDIT CAPI OTHER 3.99% 12.34% 12.37% NET INTEREST MARGIN ("NIM") 30-89 DAYS TOTAL AUTO' DELINQUENCY COMMON EQUITY TIER 1 ("CET1") Down 32bps YoY Up 206bps YoY Down 82bps YoY $5.88B 3.6% $77B NET INTEREST INCOME ("NII") CONSUMER NET CHARGE-OFFS SHUSA
Slide 6: Business Activity Overview
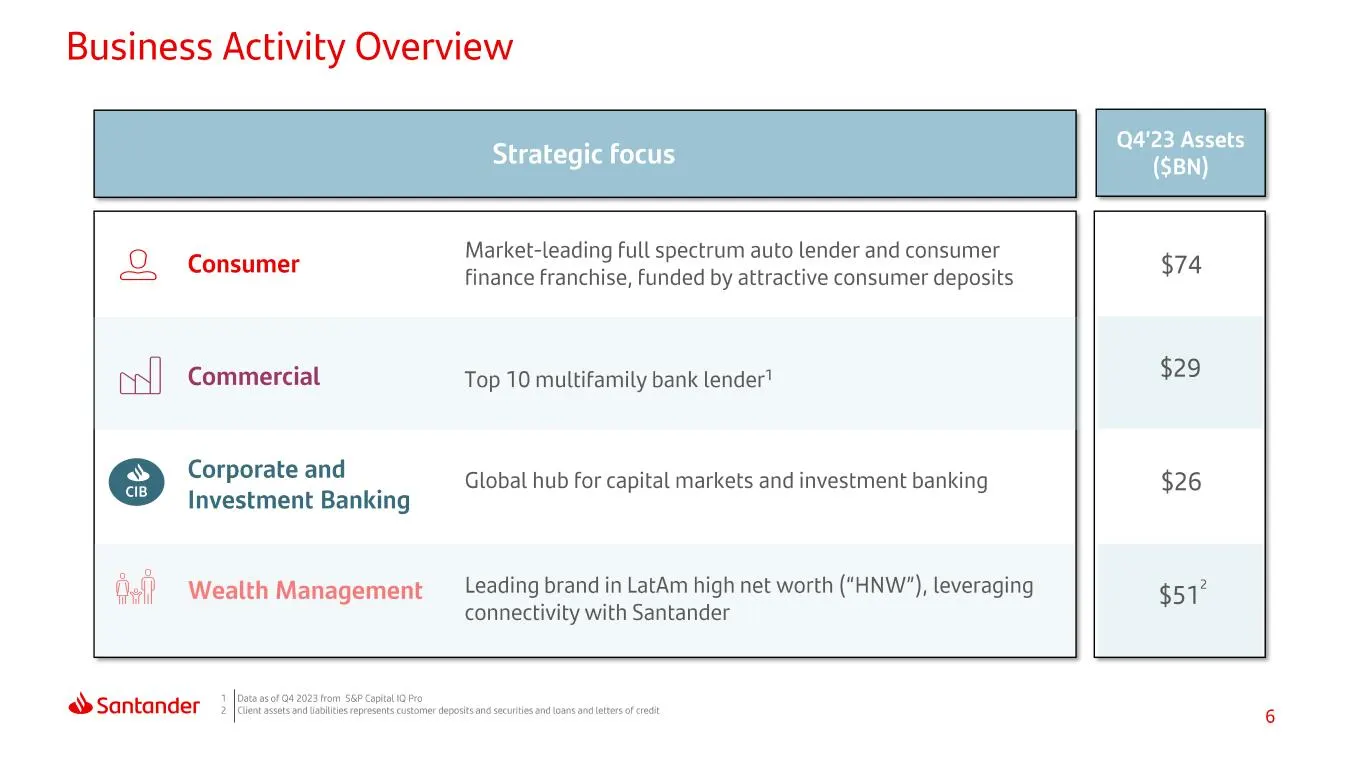
Business Activity Overview Q4'23 Assets Strategic focus (SBN) Market-leading Full spectrum auto lender and consumer is} : ; i # Consumer finance Franchise, Funded by attractive consumer deposits wn] Commercial Top 10 multifamily bank lender’ e Corporate and . Global hub for capital markets and inves
Slide 7: Results
Ss i= vas ~]
Slide 8: NII, Pre-Tax Income, Net Income and PPNR trends
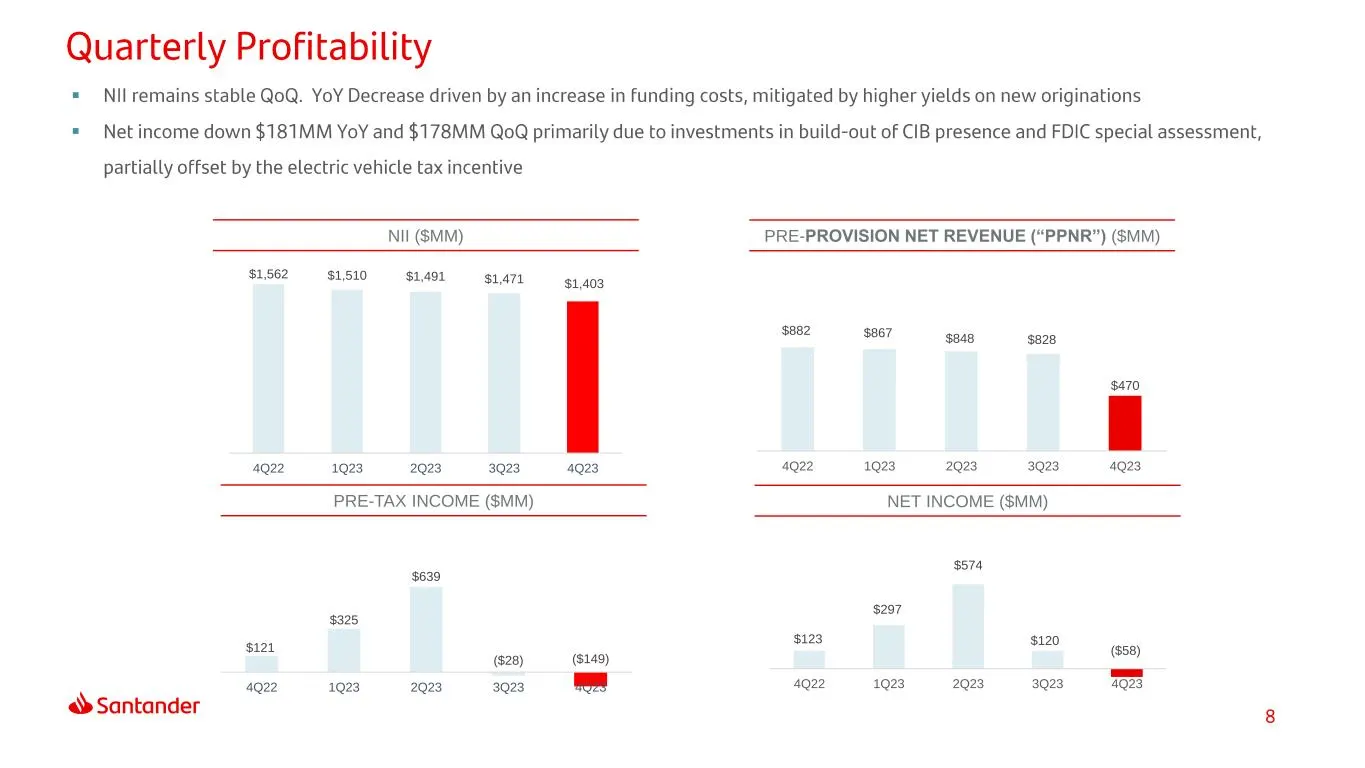
$882 $867 $848 $828 $470 4Q22 1Q23 2Q23 3Q23 4Q23 NII ($MM) PRE-TAX INCOME ($MM) NET INCOME ($MM) PRE-PROVISION NET REVENUE (“PPNR”) ($MM) ▪ ▪ $1,562 $1,510 $1,491 $1,471 $1,403 4Q22 1Q23 2Q23 3Q23 4Q23 $121 $325 $639 ($28) ($149) 4Q22 1Q23 2Q23 3Q23 4Q23 $123 $297 $574 $120 ($58) 4Q22 1Q23 2Q23 3Q2
Slide 9: Q4 Balance Sheet Overview
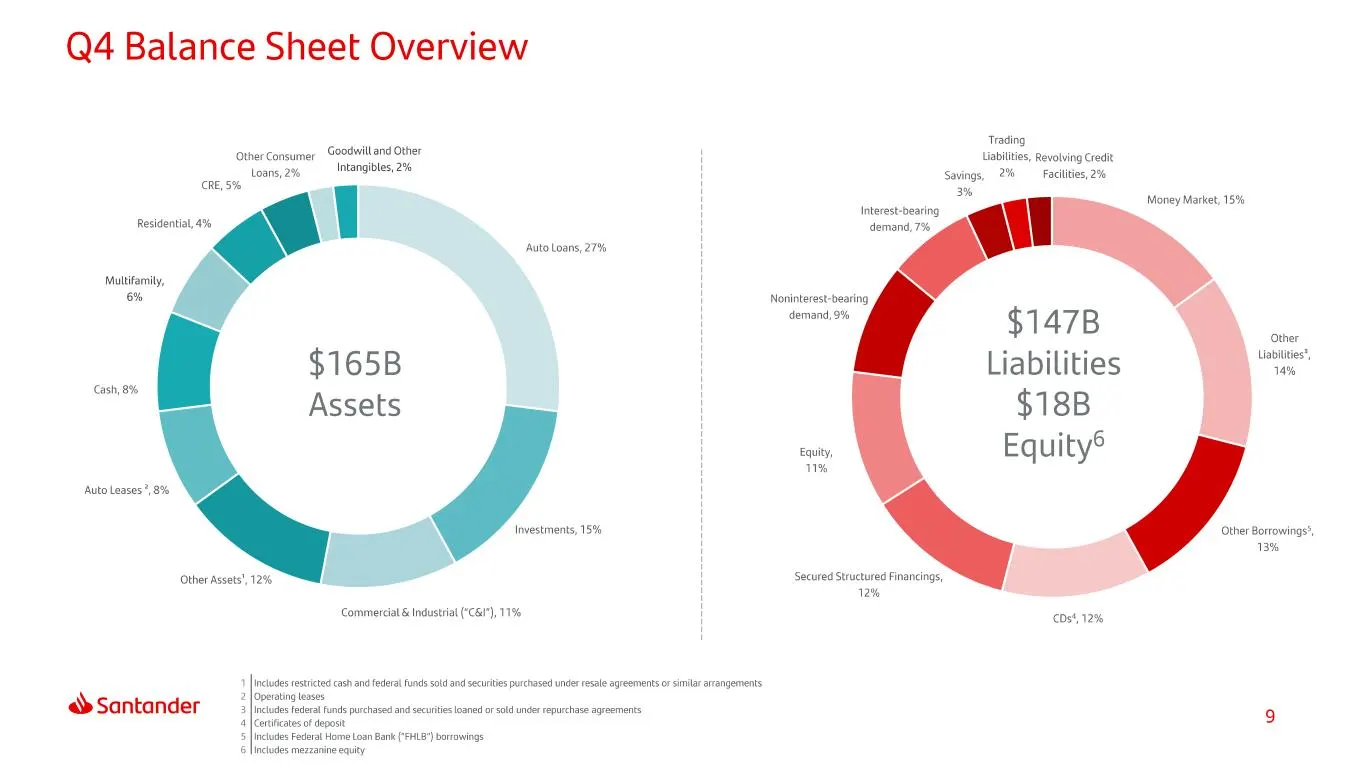
Q4 Balance Sheet Overview Goodwilland Other Intangibles, 2% ‘Other Consumer Loans, 2% Muttifamity, 6% ‘Auto Loans, 27% Cash, 8% Auto Leases 8% Investments, 15% Other Assets’, 12% os = Commercial & Industral ("C&A"), 11% yaniv @ Santander 5 |iiee tetera res pucrased adsense std ander repurchase eons
Slide 10: Loans and leases trends
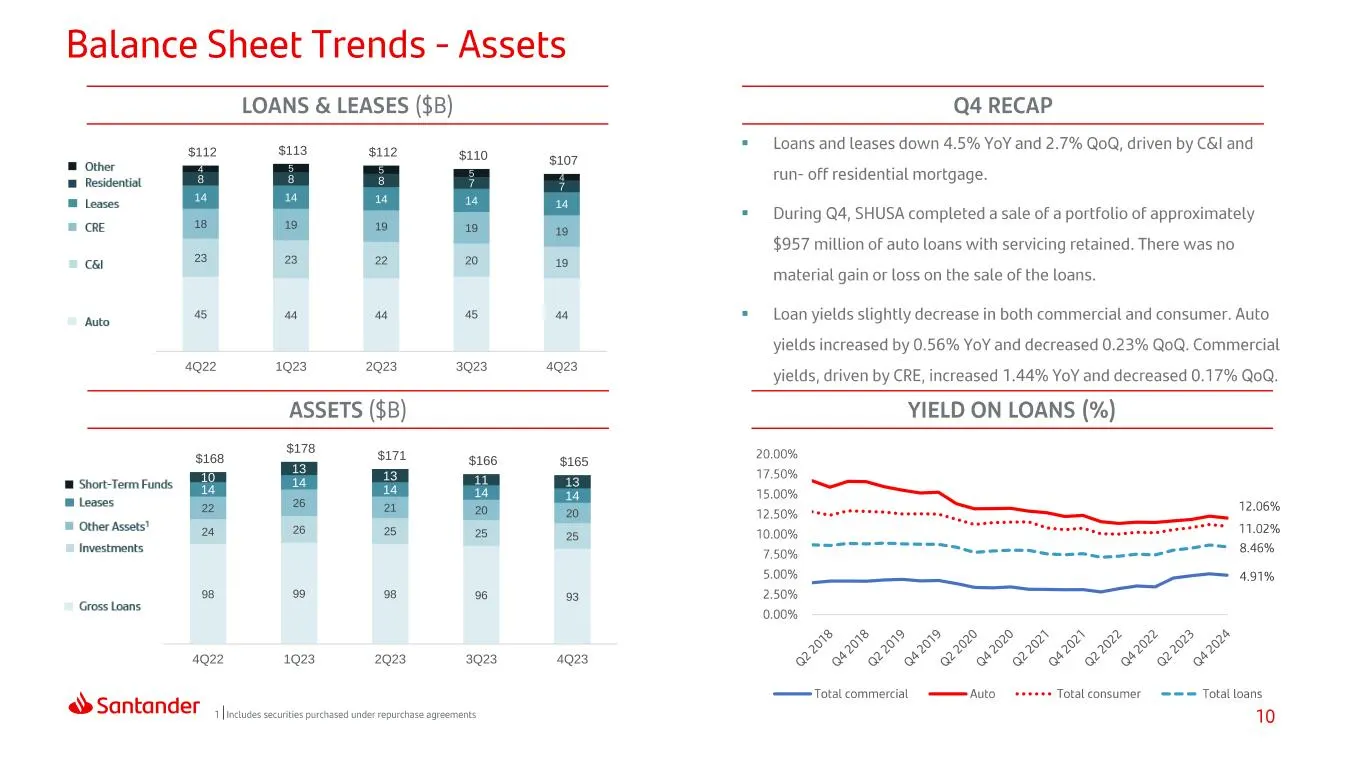
▪ ▪ ▪45 44 44 45 44 23 23 22 20 19 18 19 19 19 19 14 14 14 14 14 8 8 8 7 7 4 5 5 5 4 $112 $113 $112 $110 $107 4Q22 1Q23 2Q23 3Q23 4Q23 98 99 98 96 93 24 26 25 25 25 22 26 21 20 20 14 14 14 14 14 10 13 13 11 13 $168 $178 $171 $166 $165 4Q22 1Q23 2Q23 3Q23 4Q23
Slide 11: Deposits trends
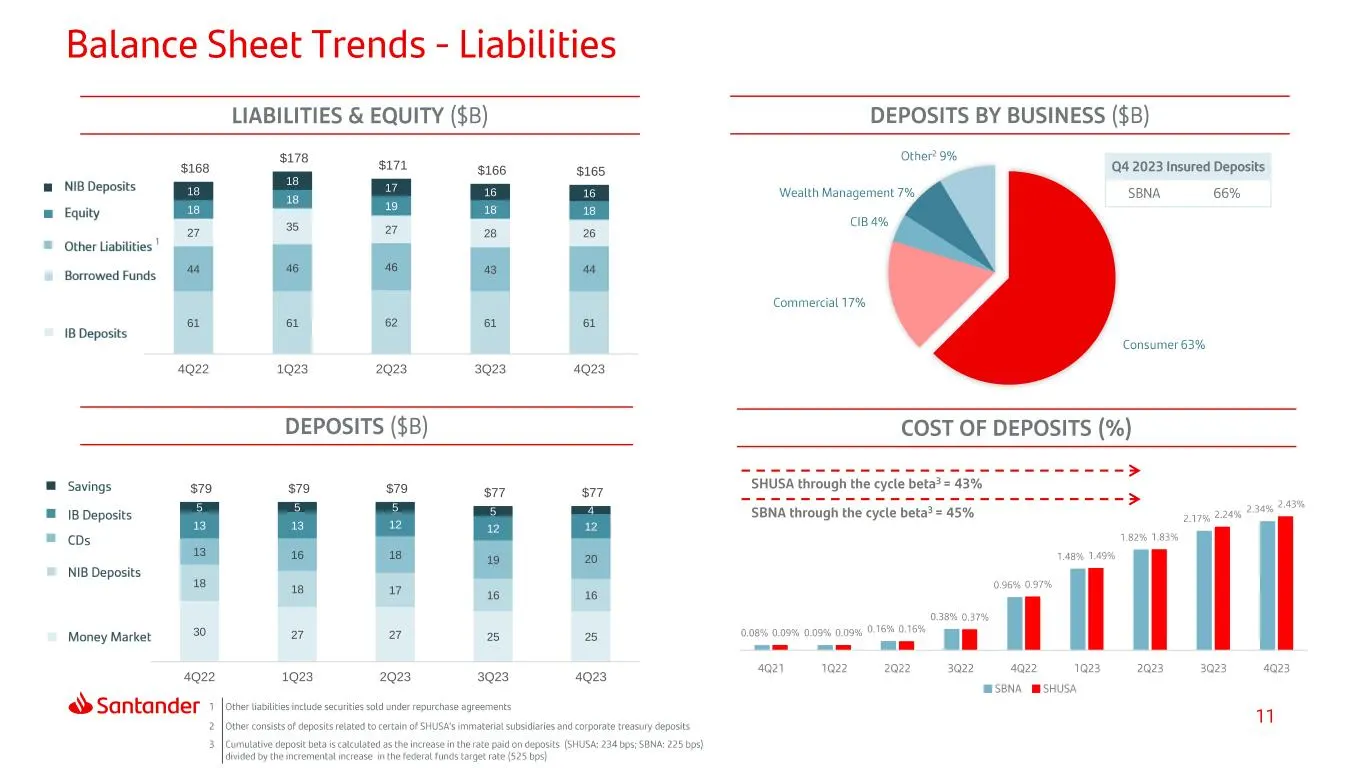
61 61 62 61 61 44 46 46 43 44 27 35 27 28 26 18 18 19 18 18 18 18 17 16 16 $168 $178 $171 $166 $165 4Q22 1Q23 2Q23 3Q23 4Q23 30 27 27 25 25 18 18 17 16 16 13 16 18 19 20 13 13 12 12 12 5 5 5 5 4 $79 $79 $79 $77 $77 4Q22 1Q23 2Q23 3Q23 4Q23
Slide 12: Net Interest Margin & Interest Rate Risk Sensitivity
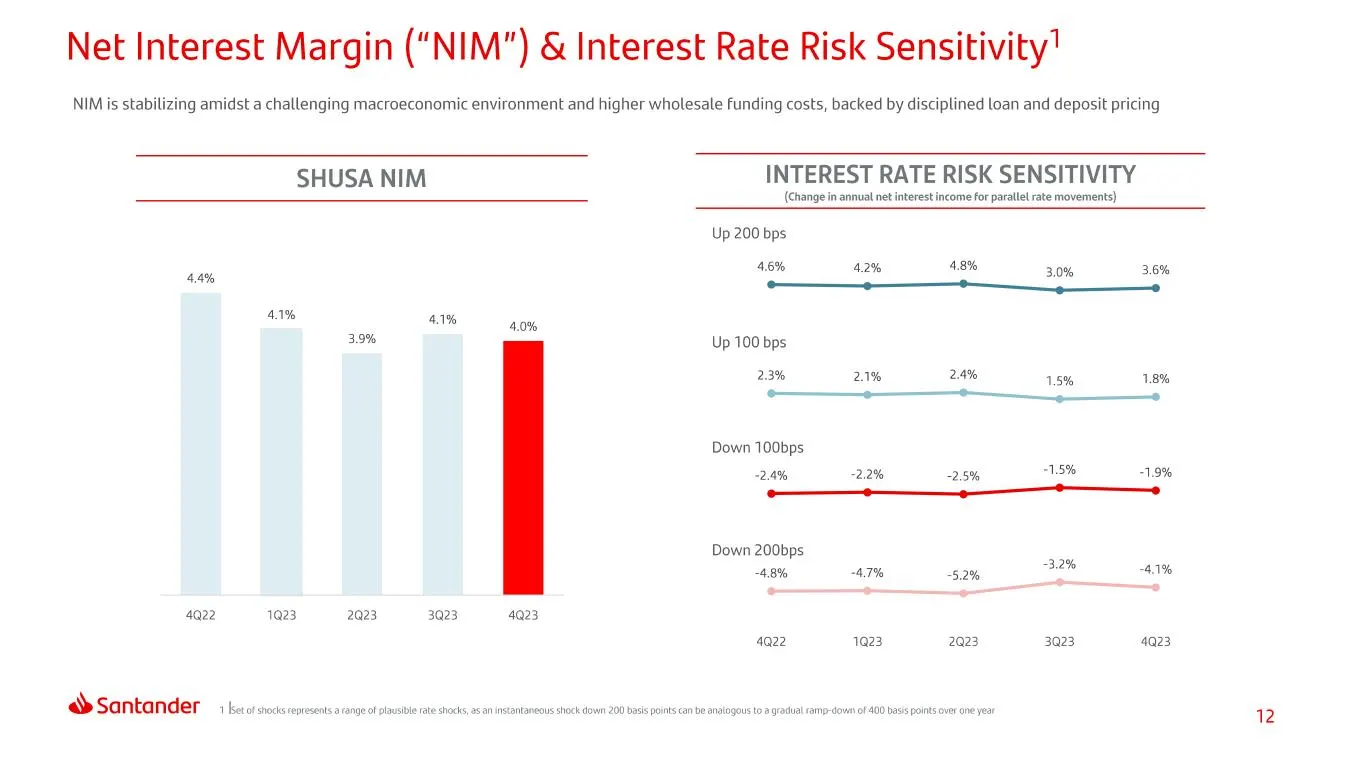
Net Interest Margin (“NIM") & Interest Rate Risk Sensitivity’ NIM is stabilizing amidst a challenging macroeconomic environment and higher wholesale funding costs, backed by disciplined loan and deposit pricing SHUSA NIM INTEREST RATE RISK SENSITIVITY (Change in annuat net interest income for parall
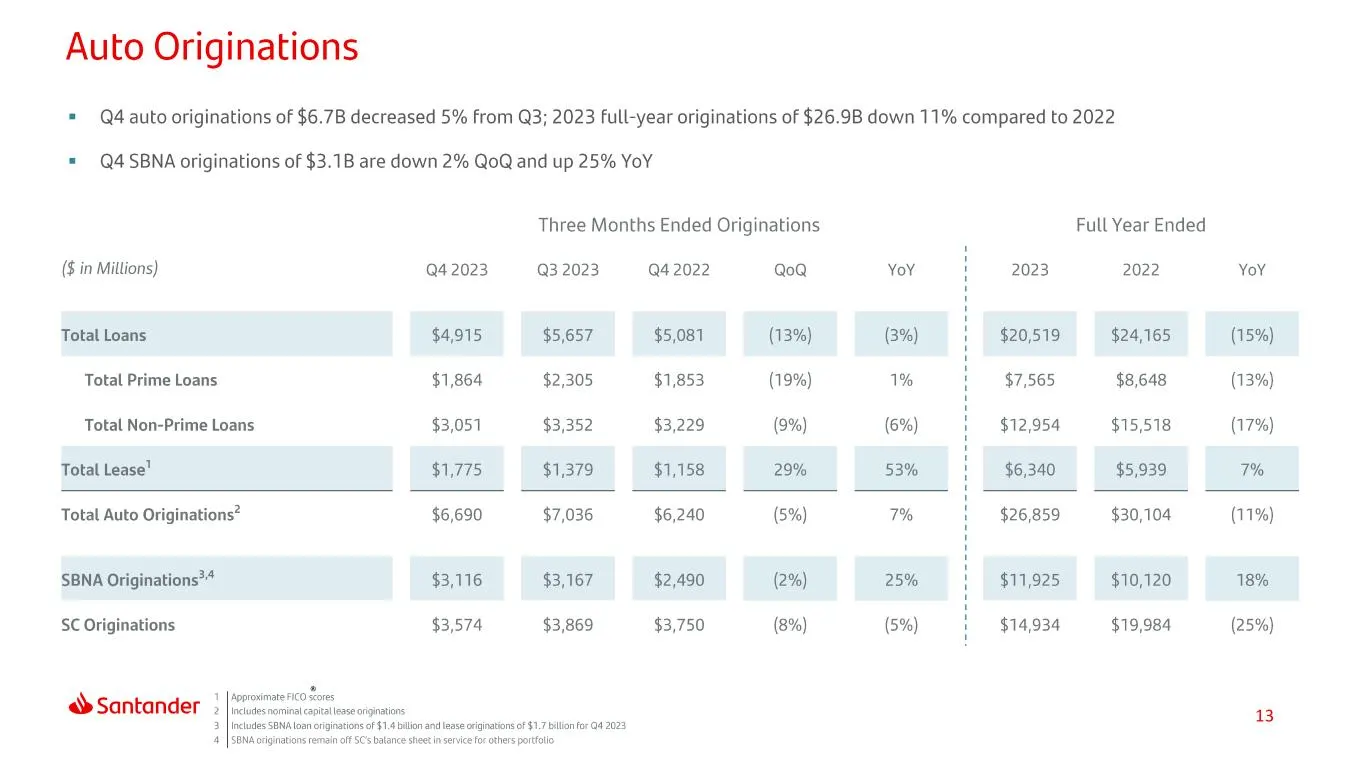
Slide 13: Auto Originations
Auto Originations = Q4 auto originations of $6.7B decreased 5% from Q3; 2023 full-year originations of $26.9B down 11% compared to 2022 = Q4SBNA originations of $3.1B are down 2% QoQ and up 25% YoY Three Months Ended Originations Full Year Ended ($ in Millions) Q4.2023 Q3 2023 Q4.2022 QoQ YoY 2023 2
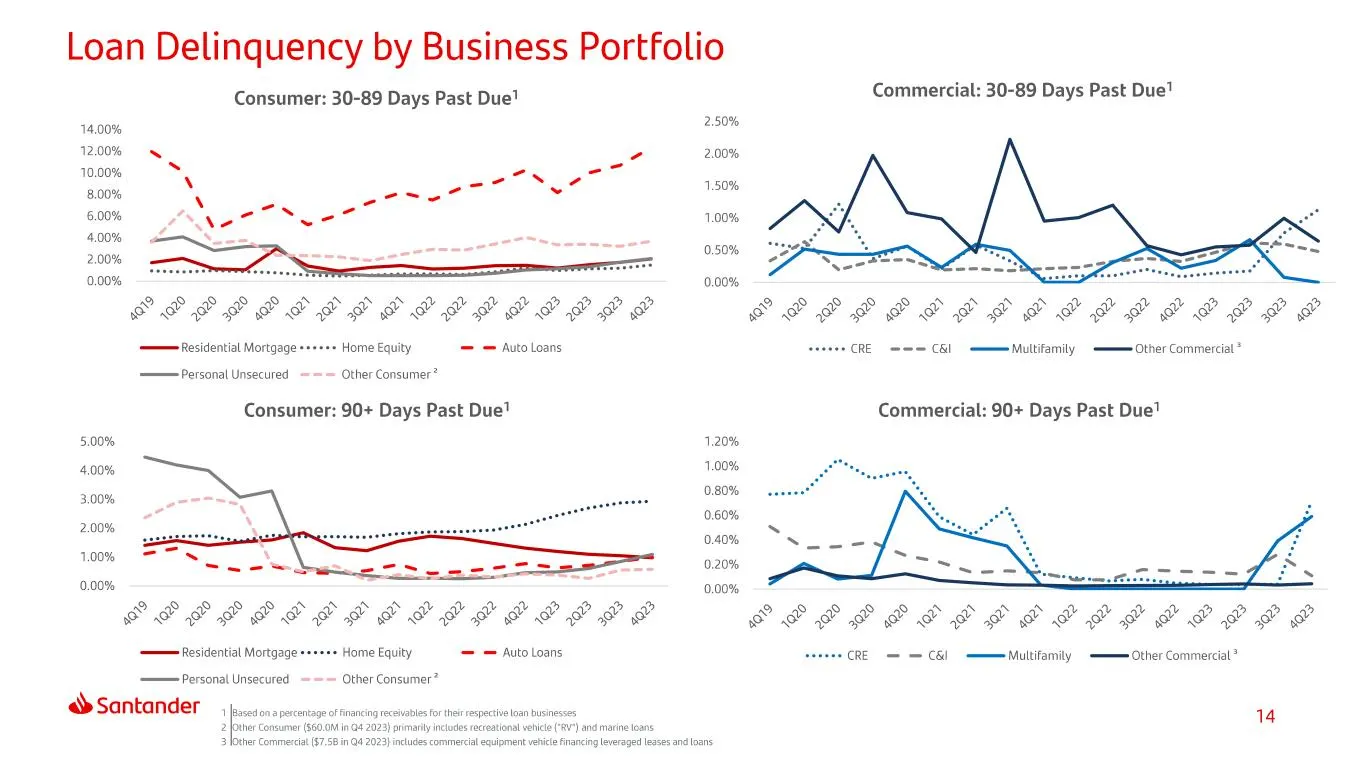
Slide 14: Loan Delinquency by Business Portfolio
Loan Delinquency by Business Portfolio Consumer: 30-89 Days Past Due’ Commercial: 30-89 Days Past Due’ 2.50% 2.00% 1.50% 1.00% 0.50% 0.00% Residential Mortgage Home Equity = = Auto Loans sees CRE = CE Multifamily Other Commercial ® Personal Unsecured Other Consumer? Consumer: 90+ Days Past Due’ Comm
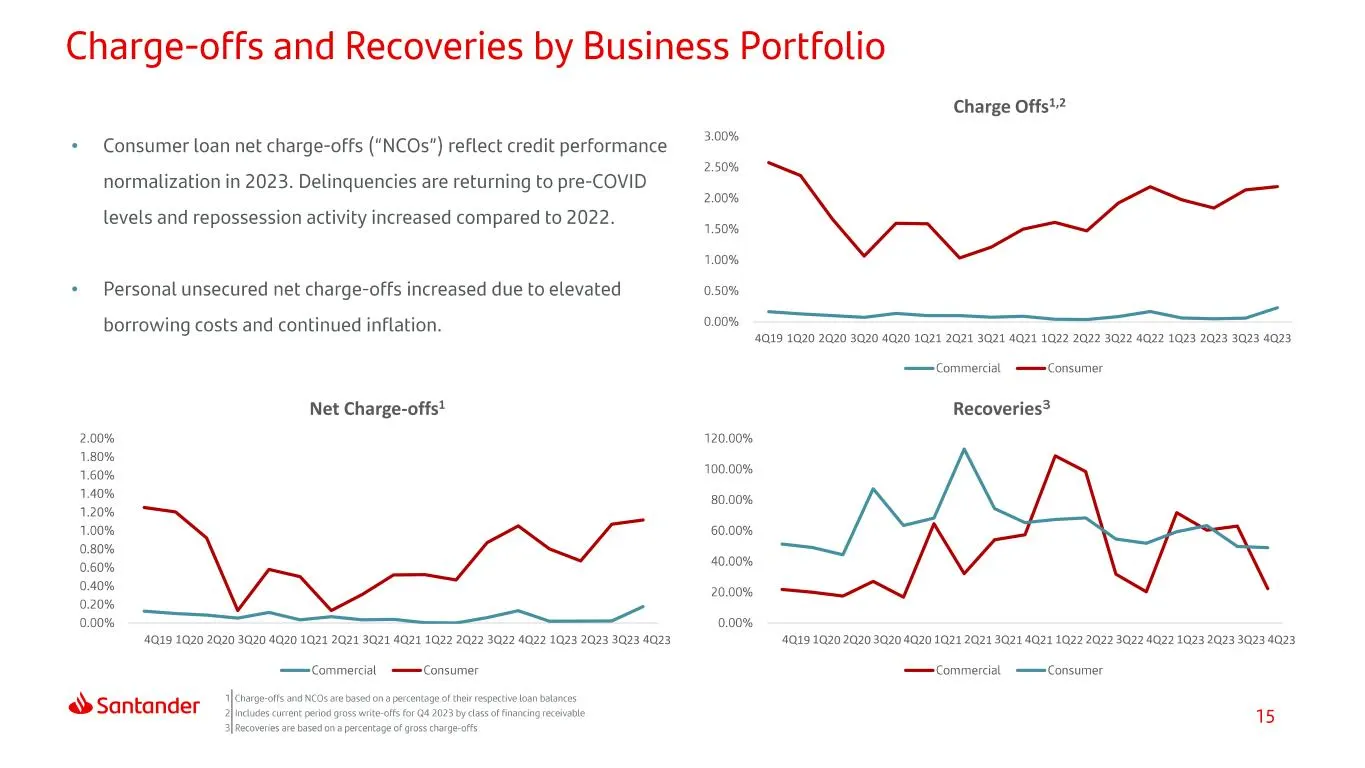
Slide 15: Net Charge-offs and Recoveries
• • Recoveries3Net Charge-offs1 4Q19 1Q20 2Q20 3Q20 4Q20 1Q21 2Q21 3Q21 4Q21 1Q22 2Q22 3Q22 4Q22 1Q23 2Q23 3Q23 4Q23 Charge Offs1,2
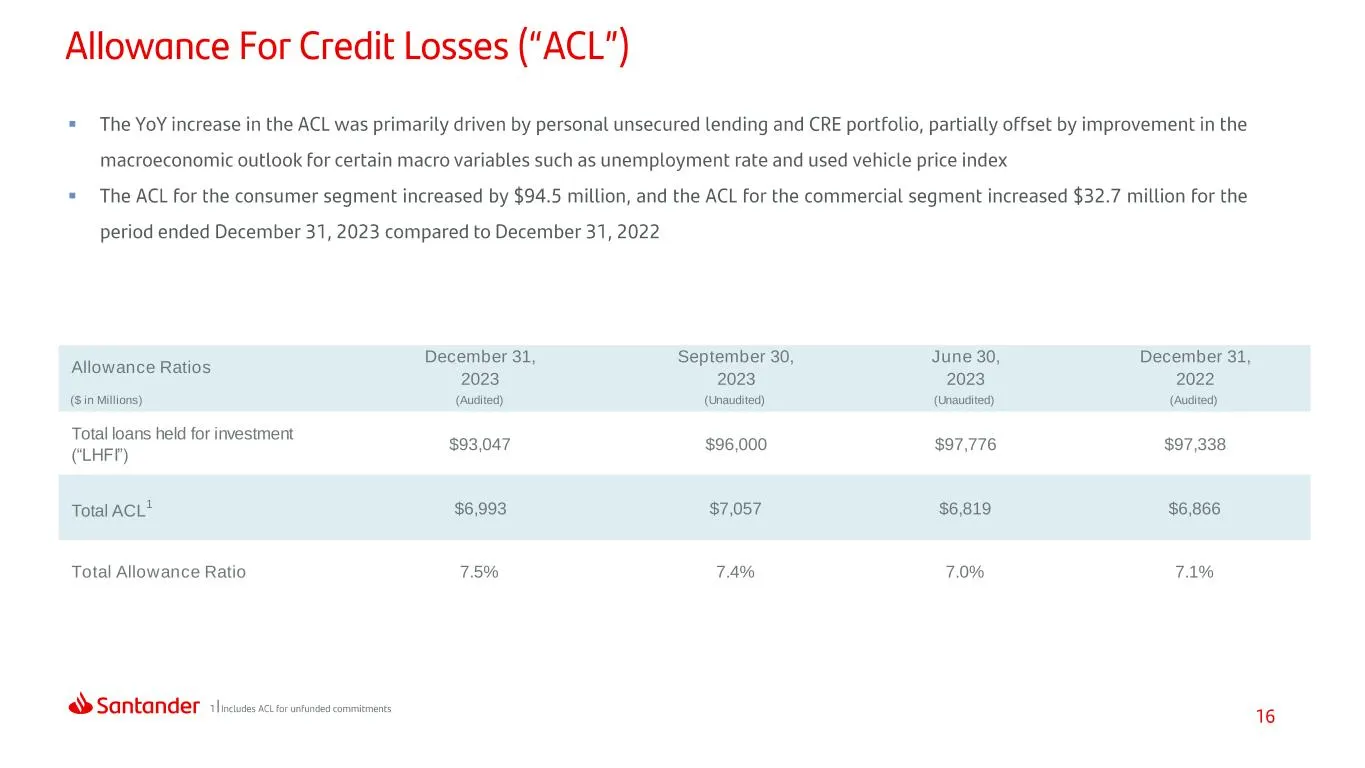
Slide 16: Allowance Ratios
▪ ▪ Allowance Ratios December 31, 2023 September 30, 2023 June 30, 2023 December 31, 2022 ($ in Millions) (Audited) (Unaudited) (Unaudited) (Audited) Total loans held for investment (“LHFI”) $93,047 $96,000 $97,776 $97,338 Total ACL 1 $6,993 $7,057 $6,819 $6,866 Total Allowance Ratio 7.5% 7.4% 7.0%
Slide 17: Index
Index At a Glance Results Capital & ix Liquidity
Slide 18: Overall borrowings stable QoQ, contingent liquidity increases
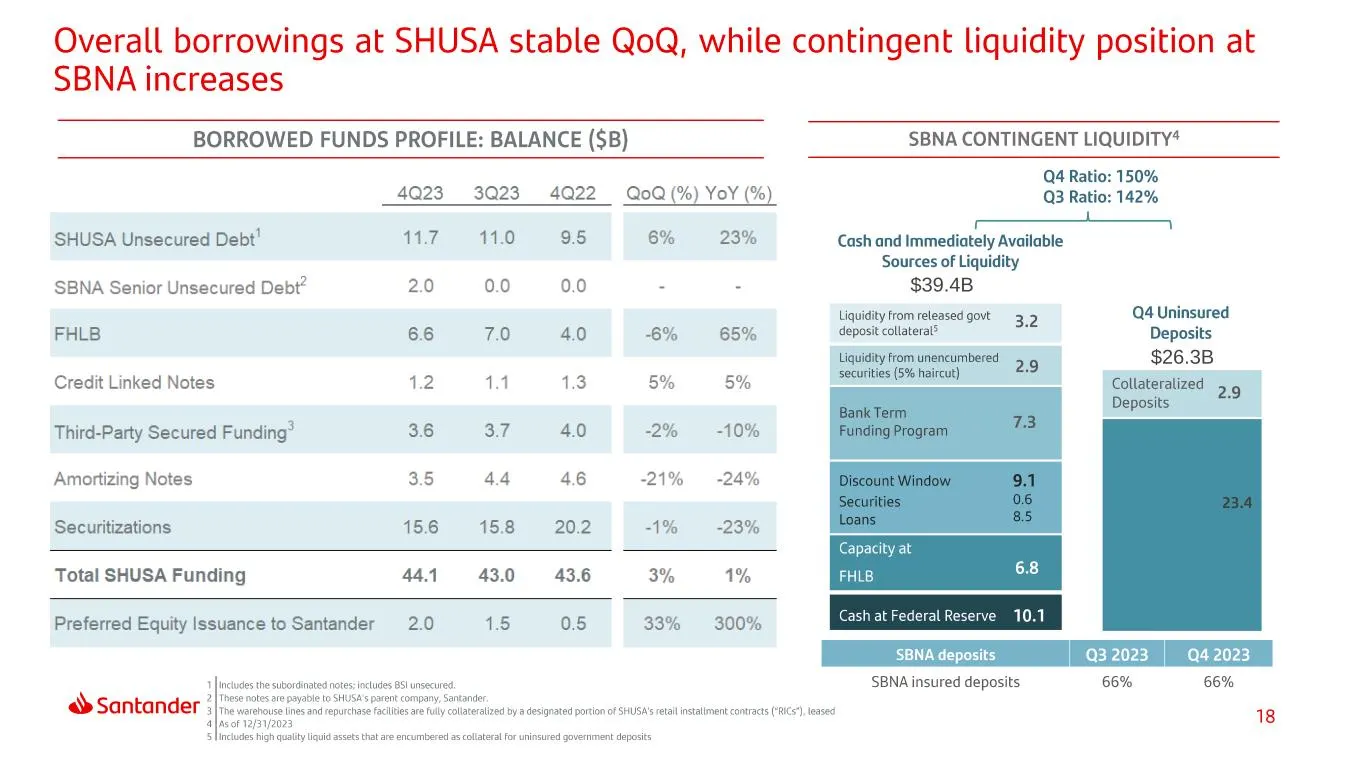
Overall borrowings at SHUSA stable QoQ, while contingent liquidity position at SBNA increases BORROWED FUNDS PROFILE: BALANCE ($B) SBNA CONTINGENT LIQUIDITY* Q4 Ratio: 150% 4Q23_ 3Q23_-4Q22,) QoQ (%) YoY (%) Q3 Ratio: 142% 7 SHUSA Unsecured Debt’ 407, 11.0 9.5 6% 23% Cash and immediately Available S
Slide 19: Debt & Total Loss-Absorbing Capacity (TLAC)
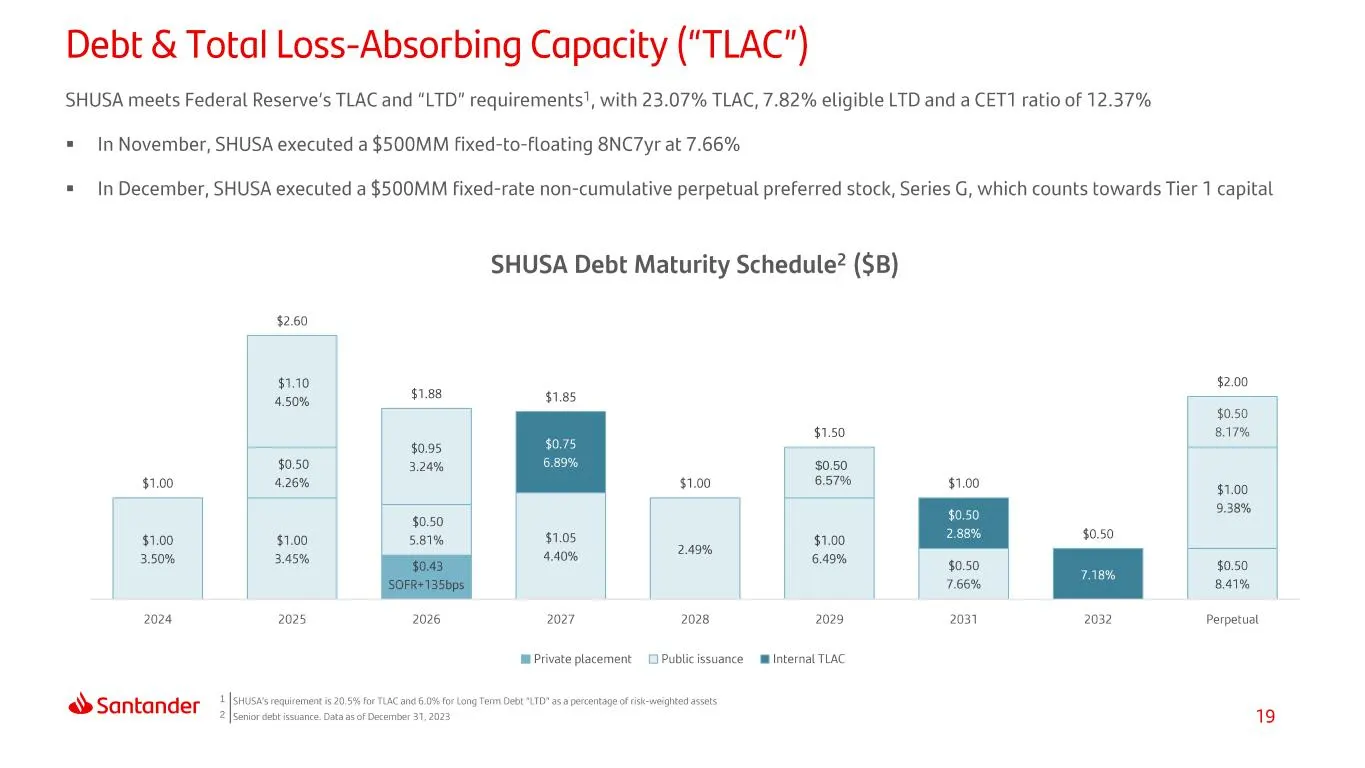
Debt & Total Loss-Absorbing Capacity (“TLAC") SHUSA meets Federal Reserve's TLAC and “LTD" requirements!, with 23.07% TLAC, 7.82% eligible LTD and a CET1 ratio of 12.37% = In November, SHUSA executed a $500MM fixed-to-floating 8NC7yr at 7.66% = In December, SHUSA executed a $500MM fixed-rate non-cum
Slide 20: Capital ratios
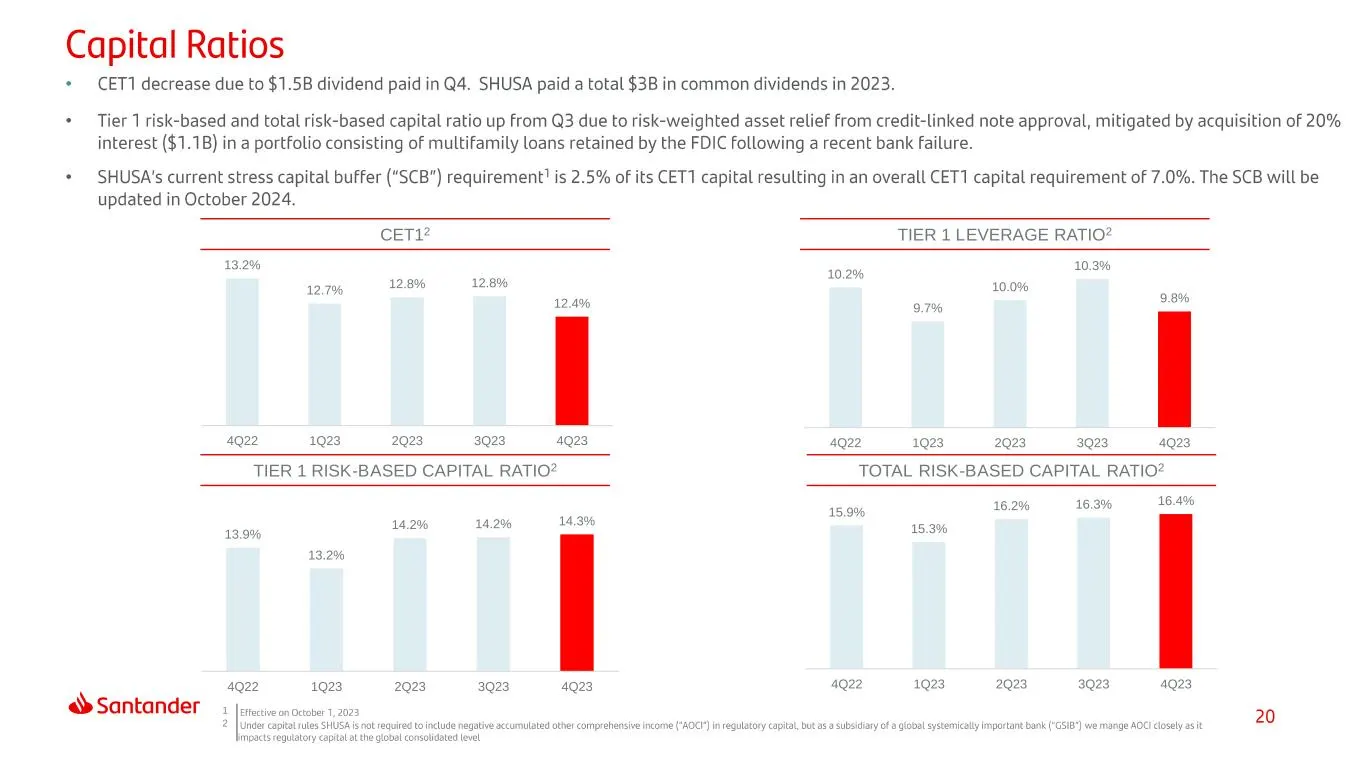
• • • CET12 TIER 1 RISK-BASED CAPITAL RATIO2 TOTAL RISK-BASED CAPITAL RATIO2 TIER 1 LEVERAGE RATIO2 1 2 13.2% 12.7% 12.8% 12.8% 12.4% 4Q22 1Q23 2Q23 3Q23 4Q23 10.2% 9.7% 10.0% 10.3% 9.8% 4Q22 1Q23 2Q23 3Q23 4Q23 13.9% 13.2% 14.2% 14.2% 14.3% 4Q22 1Q23 2Q23 3Q23 4Q23 15.9% 15.3% 16.2% 16.3% 16.4% 4Q2
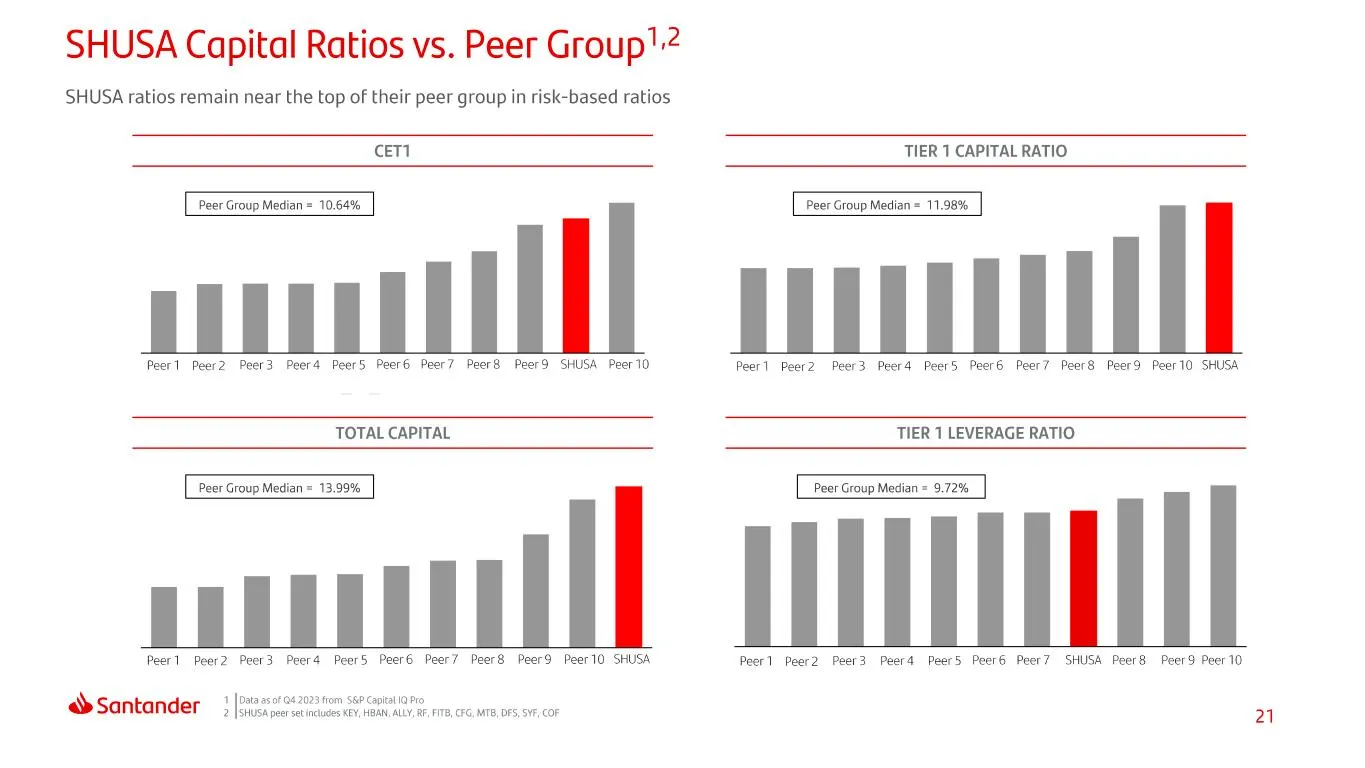
Slide 21: SHUSA Capital Ratios vs. Peer Group
SHUSA Capital Ratios vs. Peer Group! SHUSA ratios remain near the top of their peer group in risk-based ratios CET TIER 1 CAPITAL RATIO Peer Group Median = 10.64% | Pert Peer2 Peer3 Peer4 Peer Peer6 Peer? Peer8 Peer9 SHUSA Peer 10 Peer Group Median = 11.98% Peer] Peer2 Peer3 Peer4 PeerS Peer6 Peer?
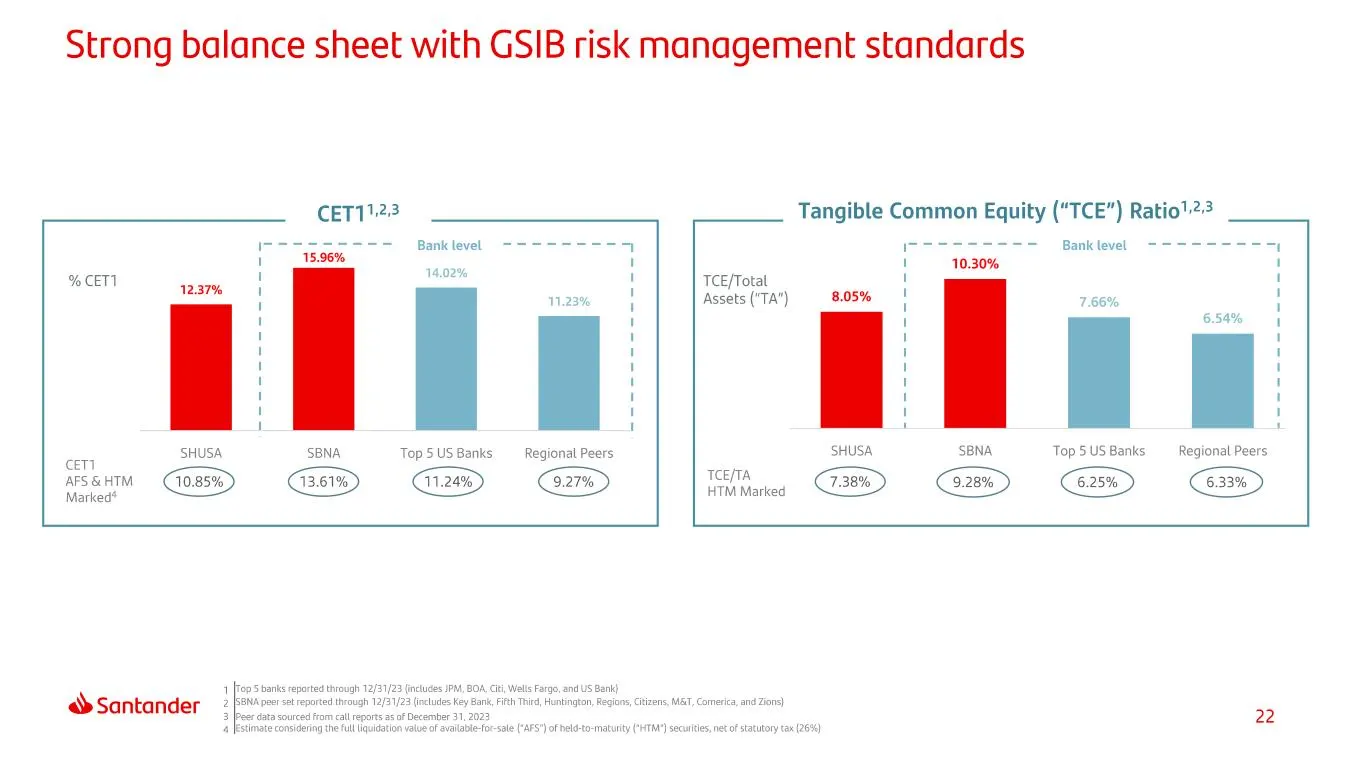
Slide 22: Strong balance sheet with GSIB risk management standards
Strong balance sheet with GSIB risk management standards Tangible Common Equity (“TCE”) Ratio!?3 ' (prsstiercierim encenste Bank level --------~ 1 . ' | 10.30% % CETI ian | tae ' TCE/Total t i N23% | Assets ("TA') 8.05% | 7.66% 1 ' I 6.54% f f f \ \ ' \ f ' \ ' \ 1 \ \ i f 1 1 f 1 tei SHUSA SBNA Top
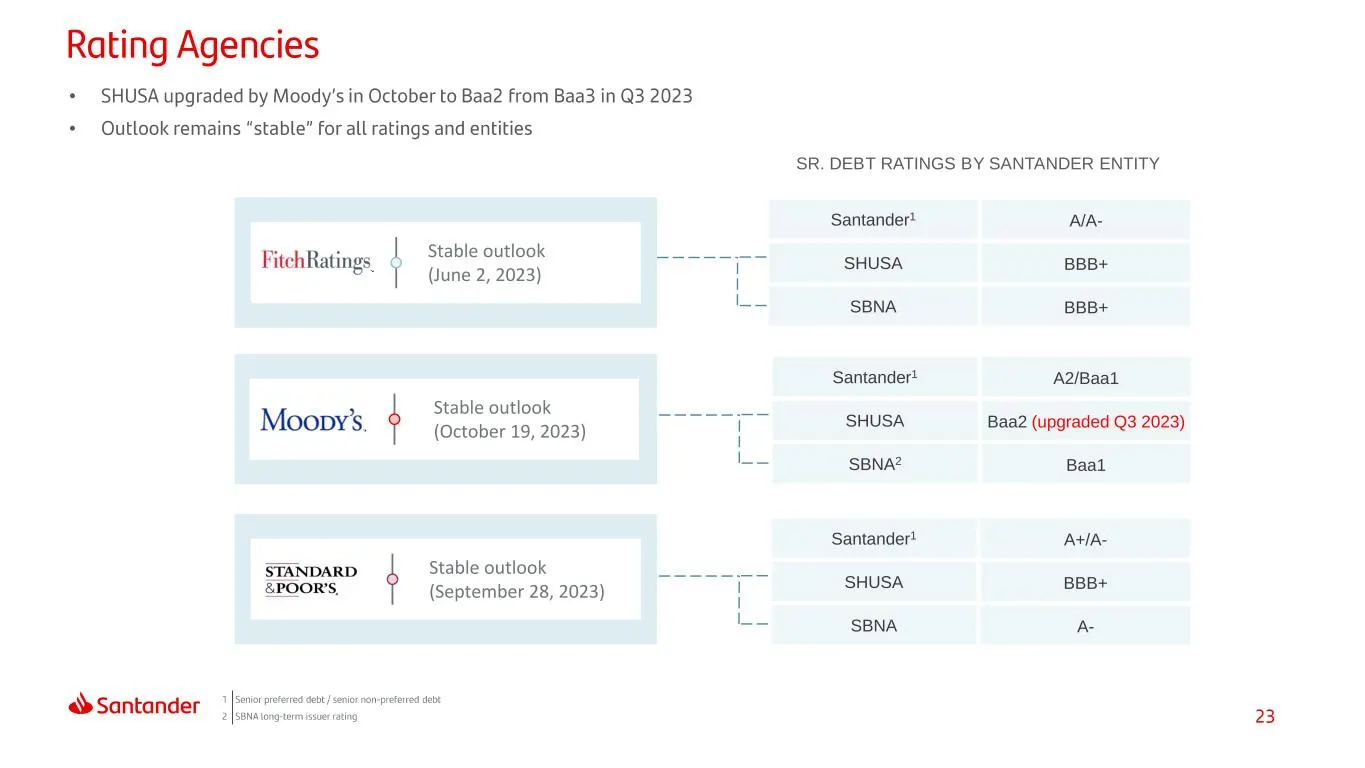
Slide 23: Senior Debt Ratings by Santander Entity
Santander1 A2/Baa1 SHUSA Baa2 (upgraded Q3 2023) SBNA2 Baa1 Santander1 A+/A- SHUSA BBB+ SBNA A- Stable outlook (June 2, 2023) • • SR. DEBT RATINGS BY SANTANDER ENTITY Santander1 A/A- SHUSA BBB+ SBNA BBB+ Stable outlook (October 19, 2023) Stable outlook (September 28, 2023)
Slide 24: Index
Index At a Glance Results Capital & Appendix Liquidity
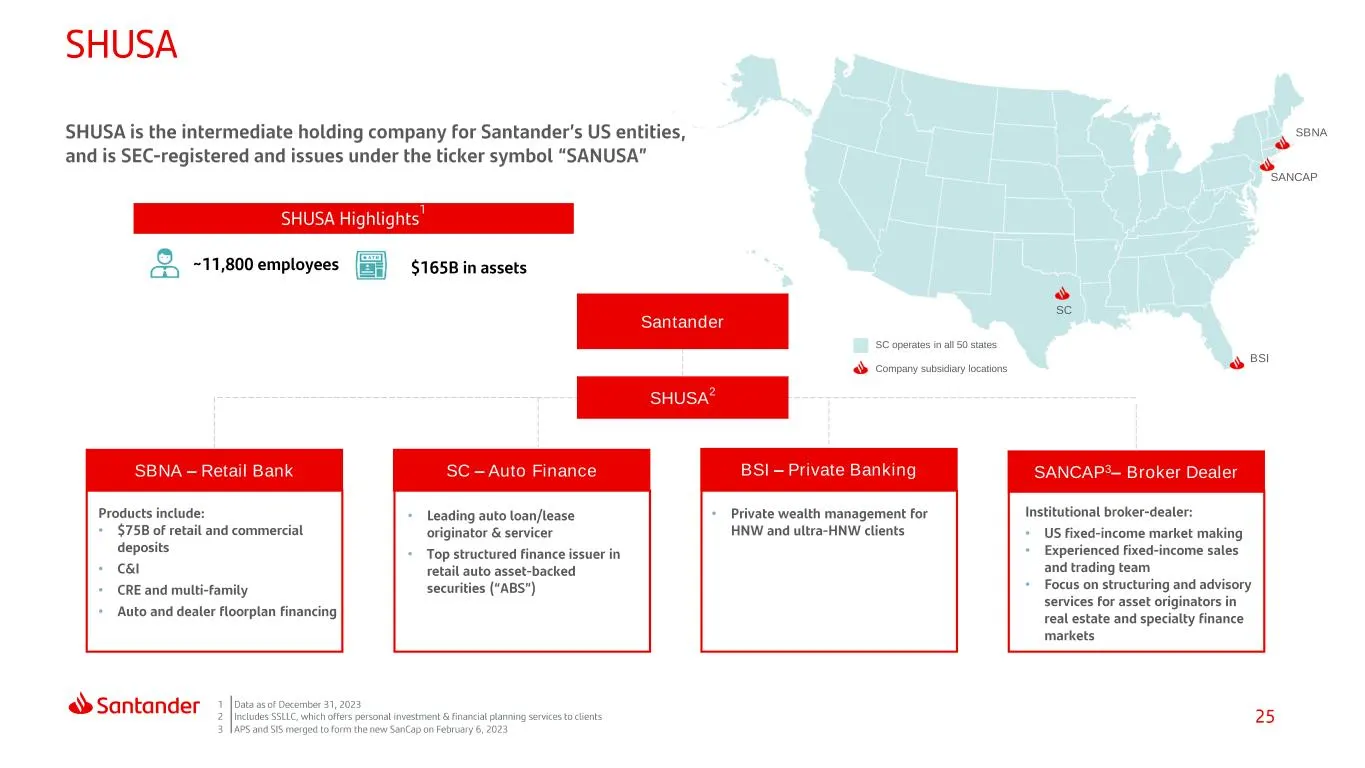
Slide 25: SHUSA subsidiaries
SBNA – Retail Bank SC – Auto Finance BSI – Private Banking SANCAP3– Broker Dealer • • • • • • • • • • SHUSA 2 Santander SC operates in all 50 states Company subsidiary locations SC BSI SBNA SANCAP
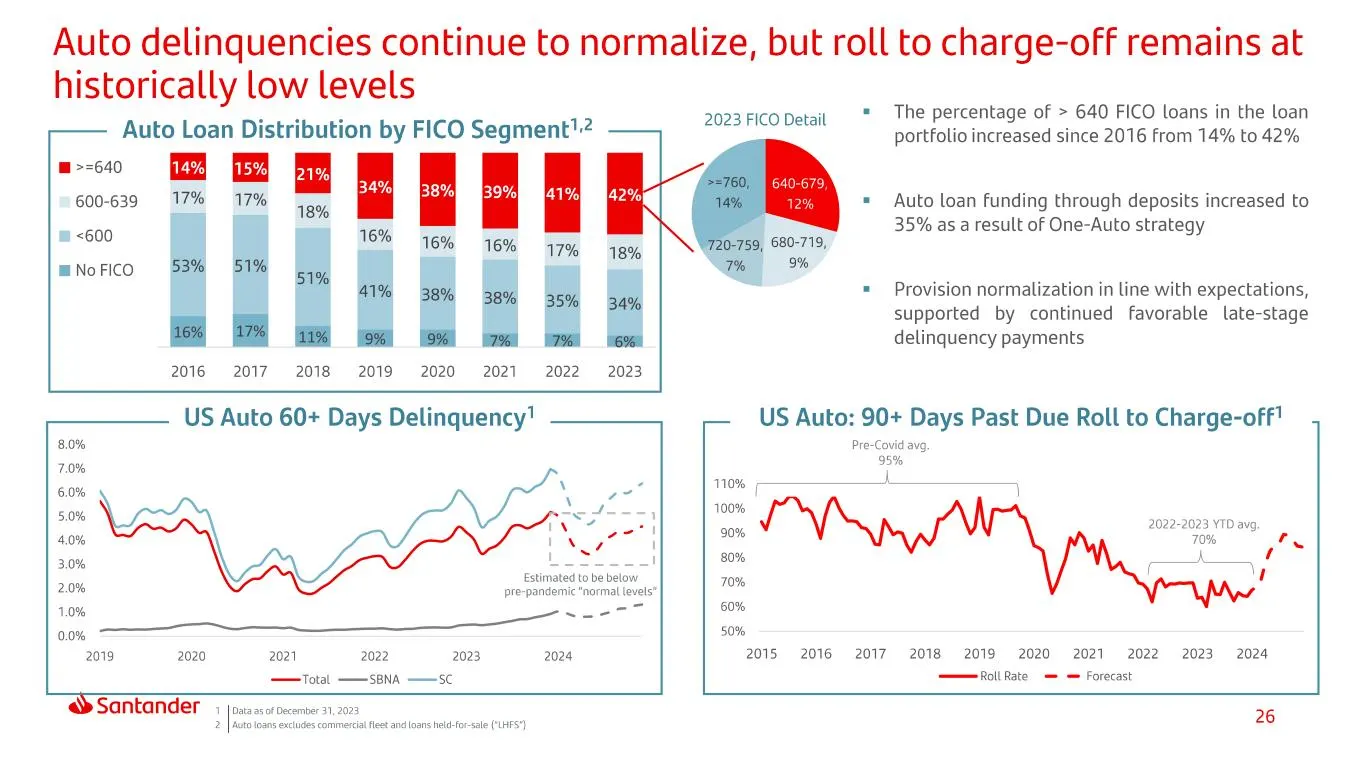
Slide 26: Auto delinquencies continue to normalize
Auto delinquencies continue to normalize, but roll to charge-off remains at historically low levels Auto Loan Distribution by FICO Segment" = ag 34% fo 39% I 419% - 17% 600-639 ie fag ies a m <600 18% 16% 16% 175% 1a -_ E a B B 2016 ©2017. «2018 «2019-2020 2021-2022 2023 FICO Detail +" «The percenta
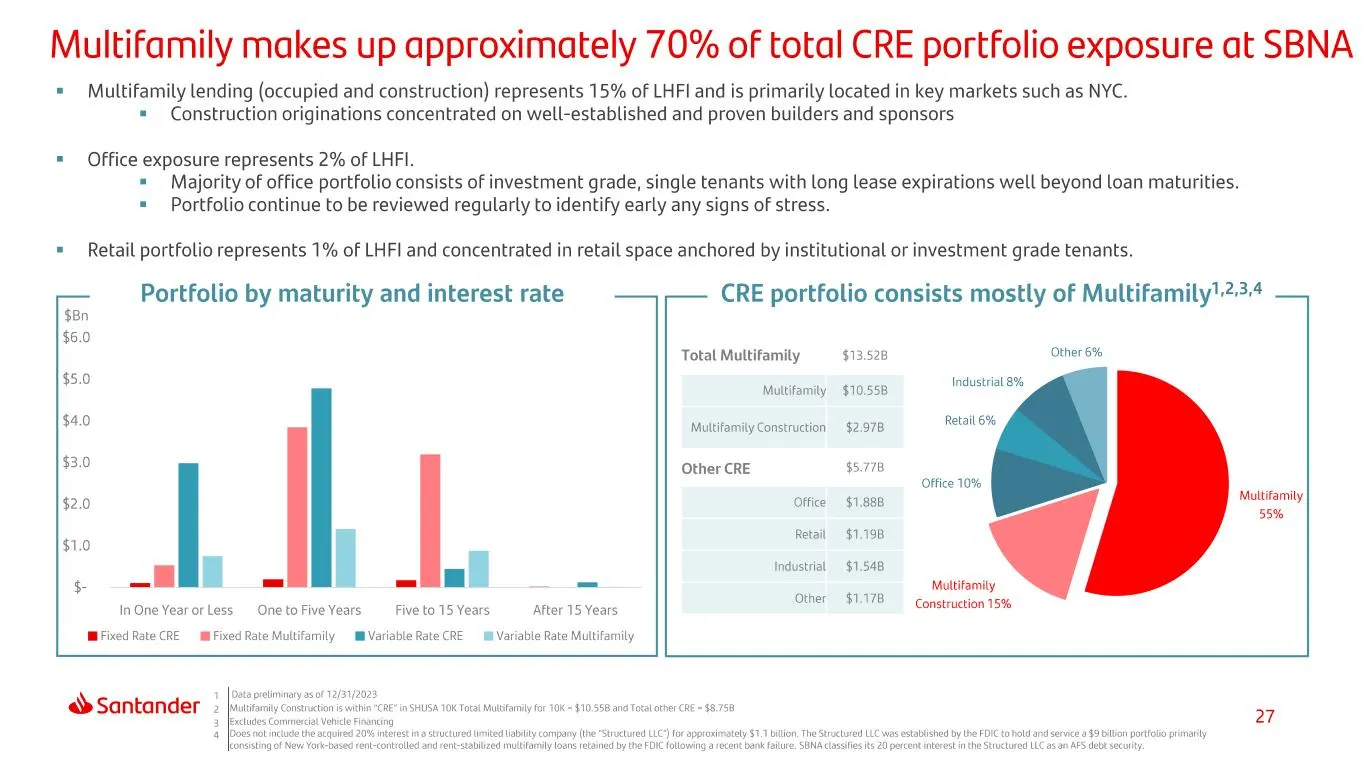
Slide 27: Multifamily makes up approximately 70% of CRE exposure
Multifamily makes up approximately 70% of total CRE portfolio exposure at SBNA = Multifamily lending (occupied and construction) represents 15% of LHFI and is primarily located in key markets such as NYC. = Construction originations concentrated on well-established and proven builders and sponsors =
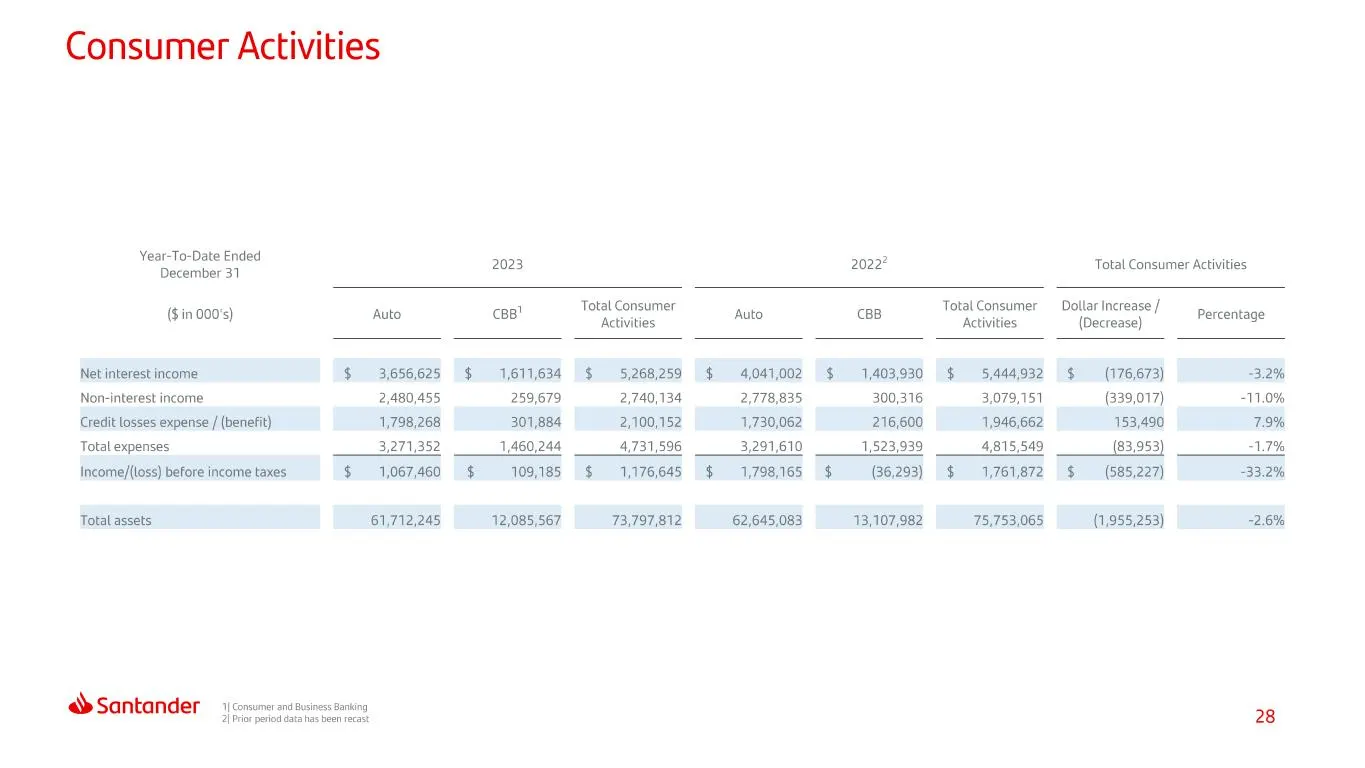
Slide 28: Consumer Activities
Consumer Activities Year-To-Date Ended December 31 (Sin 000's) Net interest income Non-interest income Credit tosses expense / (benefit) Total expenses Income/{toss) before income taxes Total assets 2023 20227 Total Consumer Activities . Total Consumer Total Consumer Dollar Increase / Auto 8B Activi
Slide 29: Commercial Activities
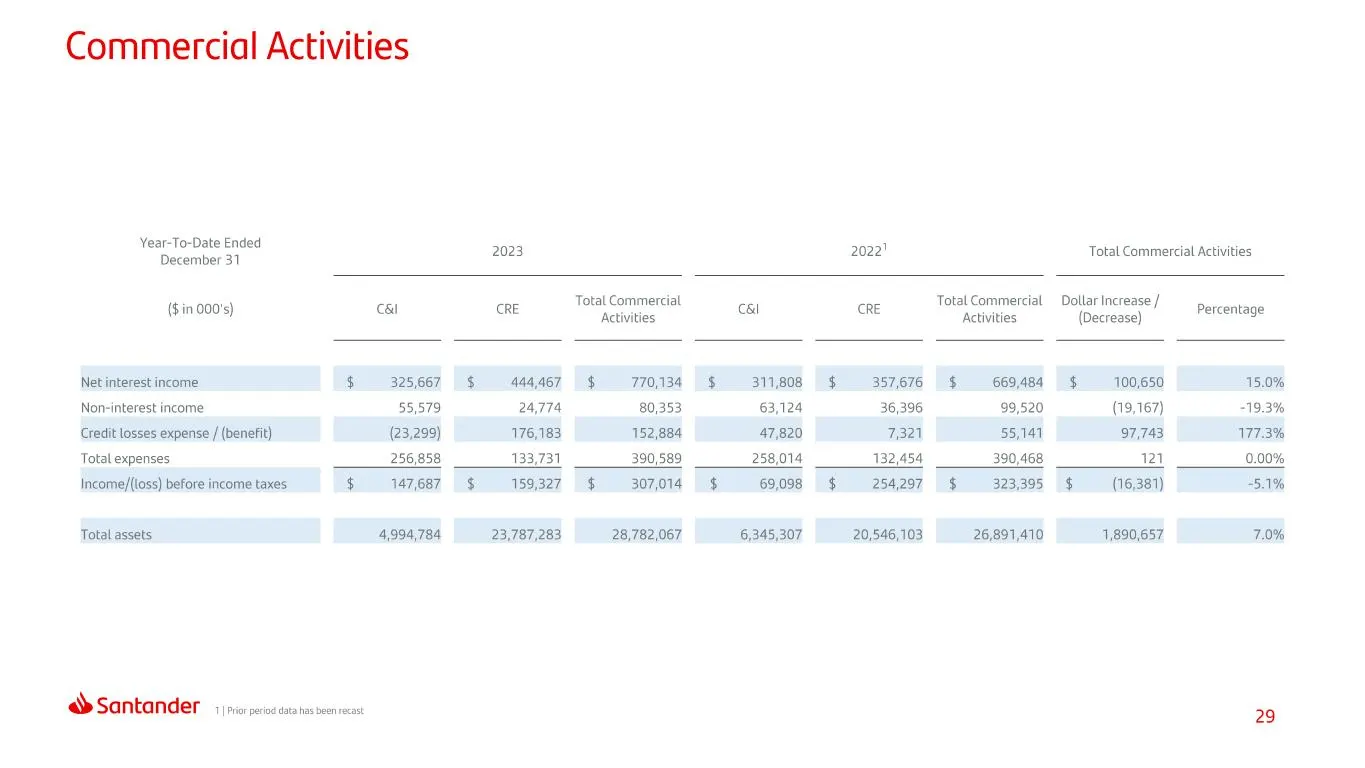
Commercial Activities Meap-TocDate Ended: 2023 2022 Total Commercial Activities December 31 ar Total Commercial Total Commercial Dollar Increase / {$in 00's) C&l CRE perl ils C&l CRE paces (Geressel Percentage Non-interest income 55,579, 24,774 80,353 63,124 36,396 99,520 (19,167) 19.3% ae 256,858 1
Slide 30: CIB
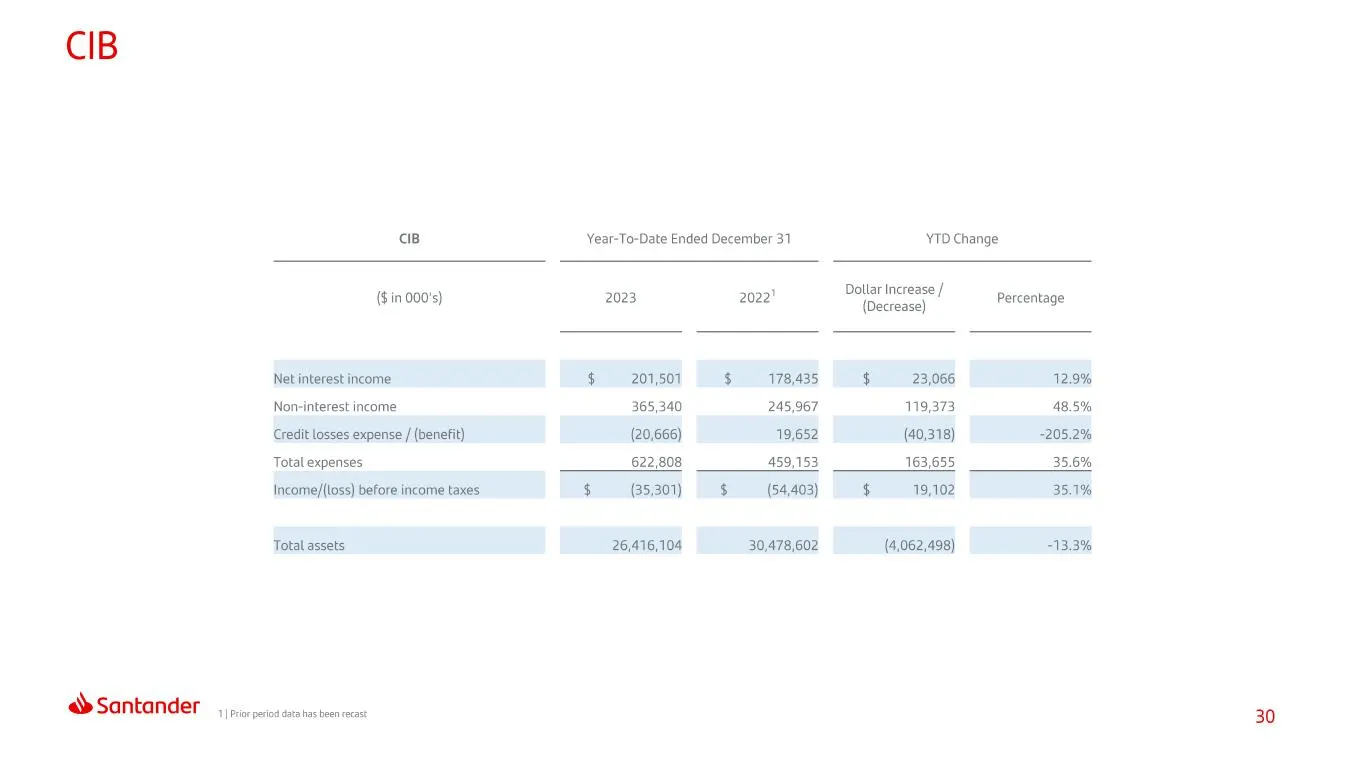
CIB cB Year-To-Date Ended December 31 YTD Change ($in 00's) 2023 2022" wee Percentage Non-interest income 365,340 245,967 119,373 48.5% Total expenses 622,808 459,153 163,655, 35.6% @DSaNtANMEL ho pecsunonoreoneen 30
Slide 31: Wealth Management
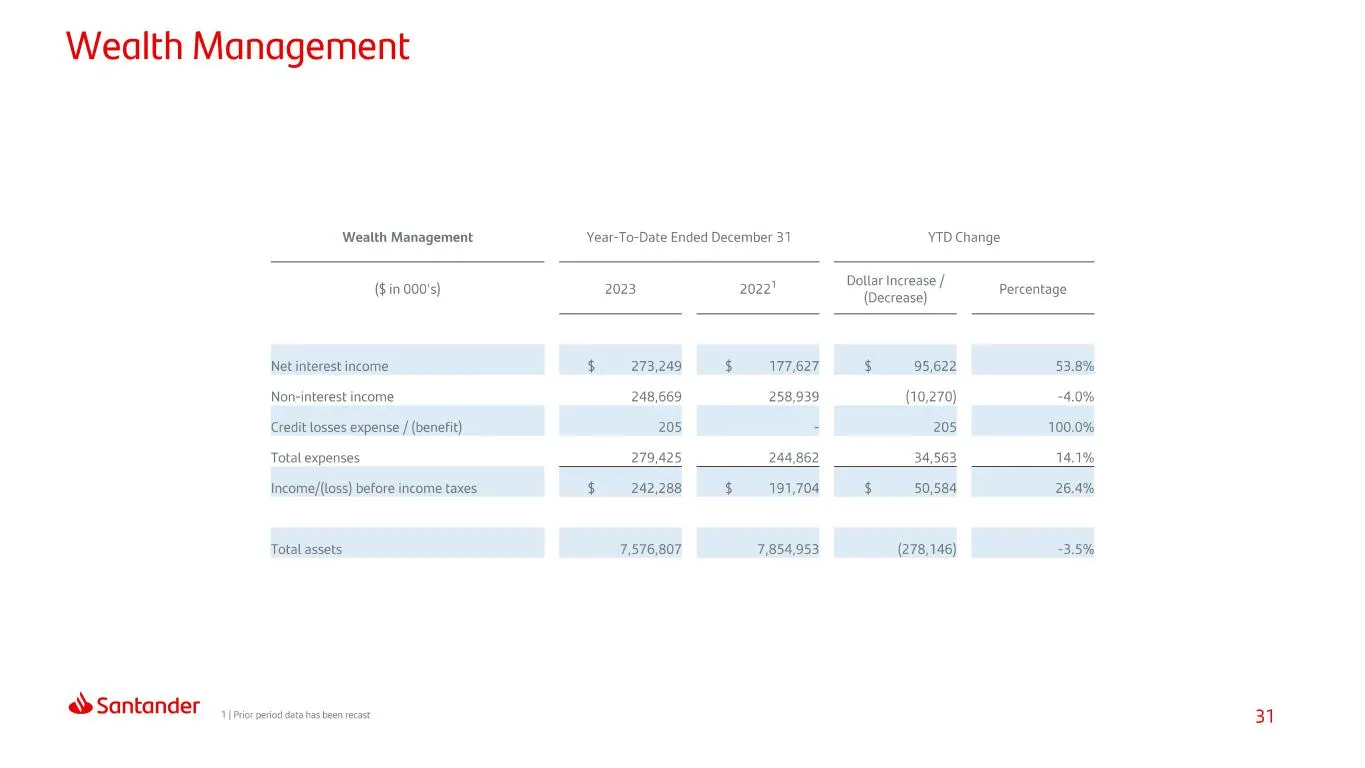
Wealth Management Wealth Management Year-To-Date Ended December 31 YTD Change Dollar Increase / (Decrease) Non-interest income 248,669 258,939 (10,270) 4.0% Total ~ 279,425 244,862 34,563 14.1% ($in 000's) 2023 2022" Percentage PSantander io. pscssmeinnre 31
Slide 32: Other segment note
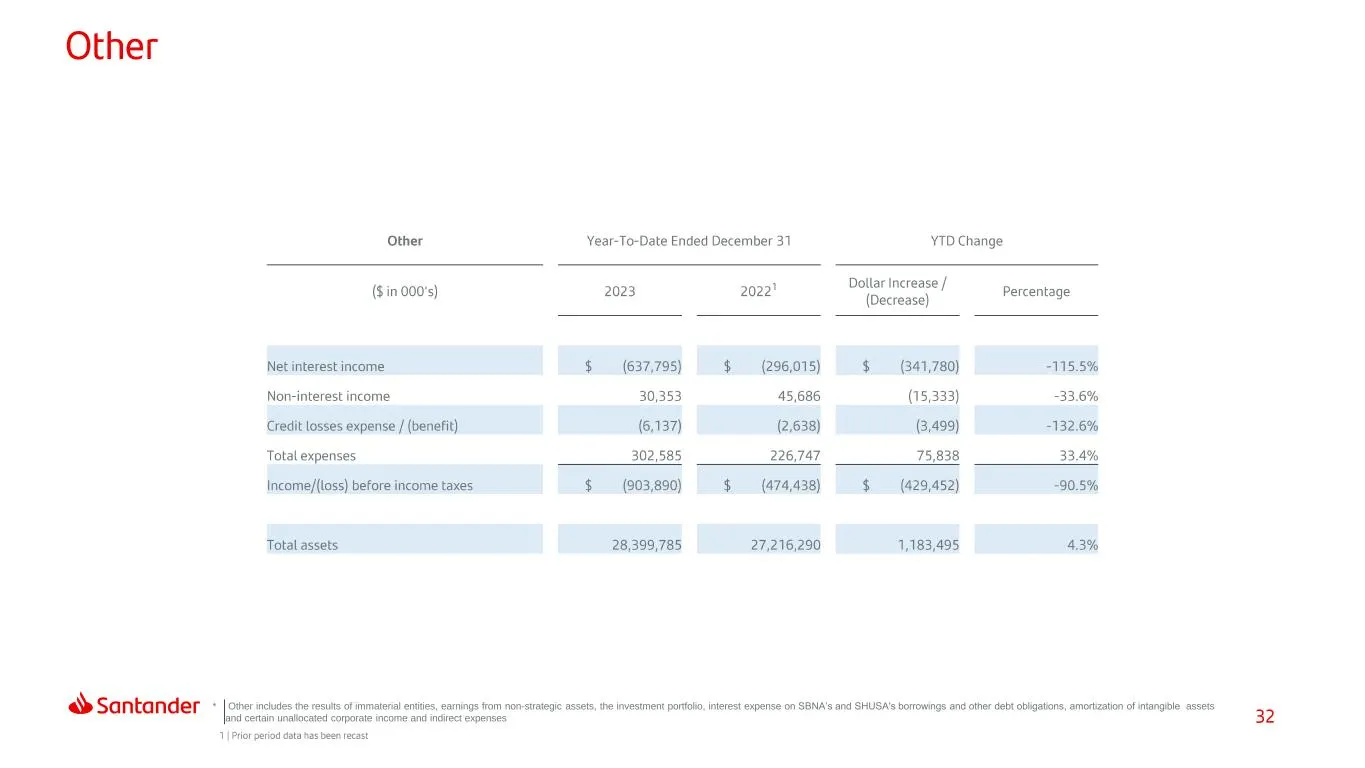
* Other includes the results of immaterial entities, earnings from non-strategic assets, the investment portfolio, interest expense on SBNA’s and SHUSA's borrowings and other debt obligations, amortization of intangible .assets and certain unallocated corporate income and indirect expenses
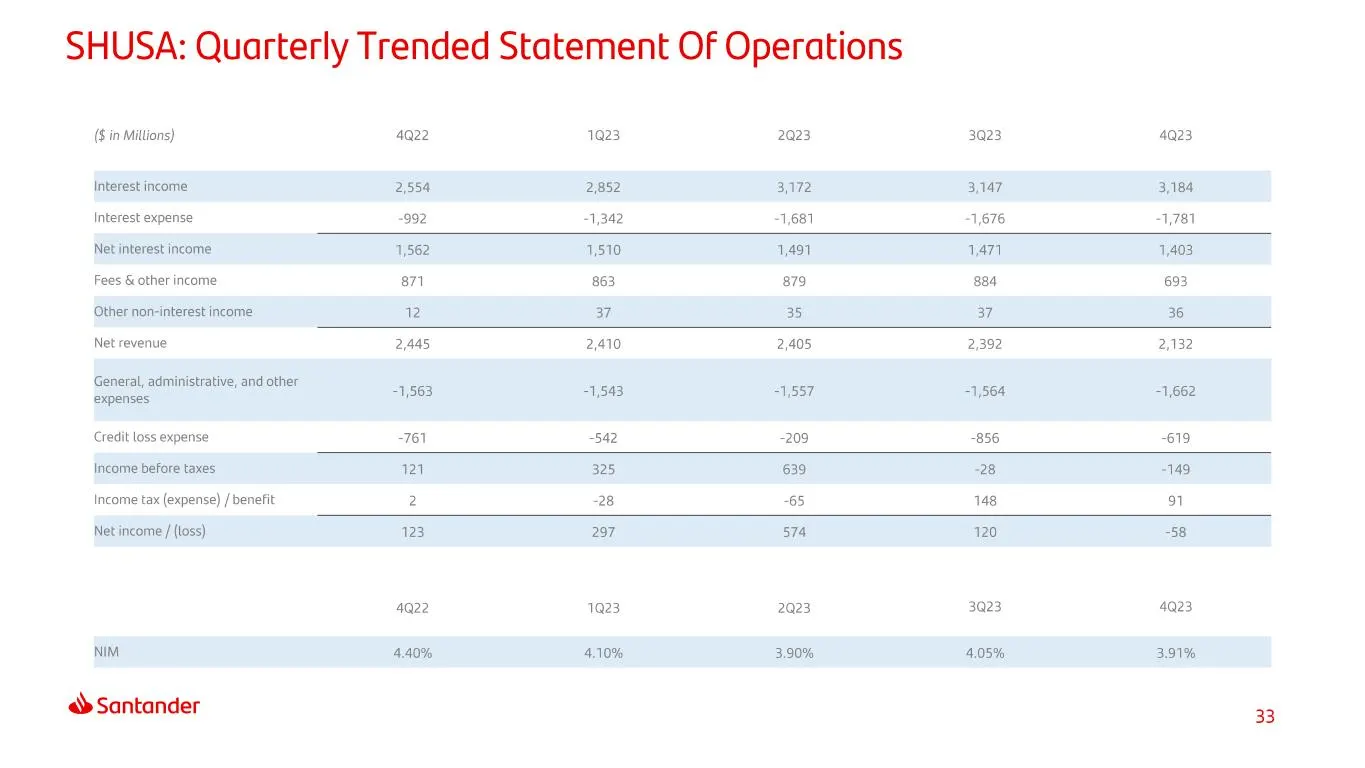
Slide 33: SHUSA: Quarterly Trended Statement Of Operations
SHUSA: Quarterly Trended Statement Of Operations ($ in Mitions) Interest income Interest expense Net interest income Fees & other income Other non-interest income Net revenue General, administrative, and other expenses Credit loss expense Income before taxes Income tax (expense) / benefit Net income
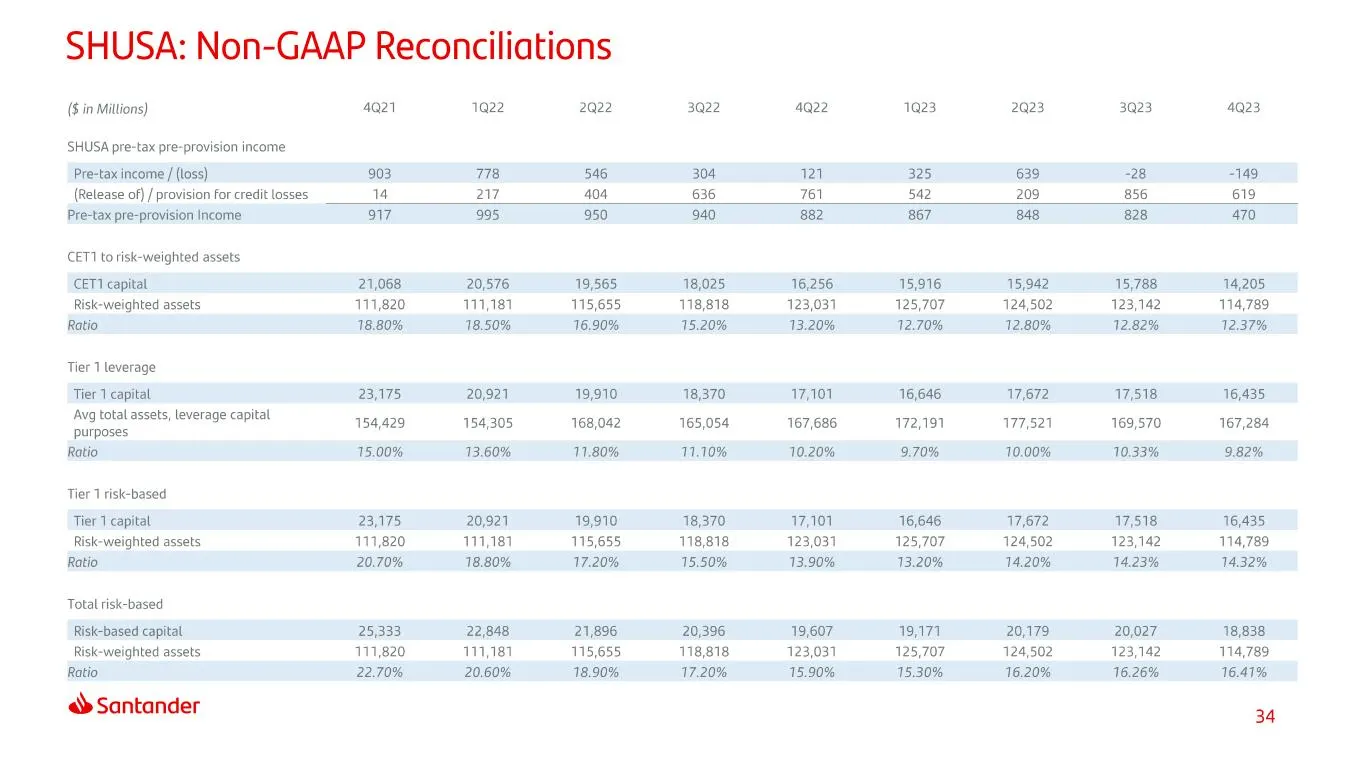
Slide 34: SHUSA: Non-GAAP Reconciliations
SHUSA: Non-GAAP Reconciliations (6 in Mitions) 4Q21 122 2022 3022 422 1923 2023 3023 4023 SHUSA pre-tax pre-provision income Pre-taxincome / (loss) 903 78 546 304 721 325 639 28 “149 (Release of) / provision for credit losses 4 217 404 636 761 542 209 856 619 Pre-tax pre-provision Income 917 995 950

Slide 35: Thank You.
Thank You. Our purpose is to help people and businesses prosper. Our culture is based on believing that everything we do should be: Simple Personal Fair, «> Santander Dow Jones Sustainability Indices Incotiaboration with RobecoSAM «> FTSE4Good
Source: SEC EDGAR · 8-K filed Mar 4, 2024
More decks from Santander Holdings USA Inc
 Debt Investor Presentation (August 2026)30 slides · Aug 12, 2026
 Debt Investor Presentation (August 2026)30 slides · Aug 12, 2026
 Debt Investor Presentation (June 2026)29 slides · Jun 12, 2026
 Debt Investor Presentation (June 2026)29 slides · Jun 12, 2026
 Debt Investor Presentation (March 2026)36 slides · Mar 6, 2026
 Debt Investor Presentation (March 2026)36 slides · Mar 6, 2026