North Valley Bancorp — West Coast Financial Services Conference (March 2012)
13 slides from North Valley Bancorp's conference presentation, Mar 2, 2012
Slide 1: West Coast Financial Services Conference – North Valley Bancorp
NASDAQ: NOVB WEST COAST FINANCIAL SERVICES CONFERENCE NORTH VALLEY BANCORP MICHAEL CUSHMAN, CEO & PRESIDENT
Slide 2: Disclaimer Disclosure
This presentation contains certain forward - looking statements that are subject to risks and uncertainties that could cause actual results to differ materially from those stated herein . For a discussion of factors that could cause actual results to differ, please refer to the Company’s periodic re
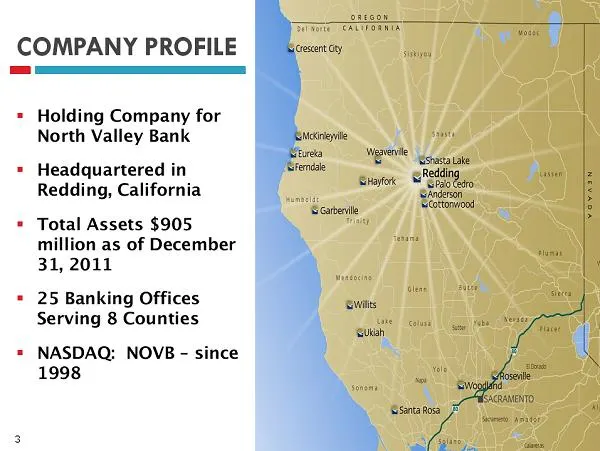
Slide 3: Company Profile
▪ Holding Company for North Valley Bank ▪ Headquartered in Redding, California ▪ Total Assets $905 million as of December 31, 2011 ▪ 25 Banking Offices Serving 8 Counties ▪ NASDAQ: NOVB – since 1998 COMPANY PROFILE 3
Slide 4: 2011 Overview
▪ Net Income of $3,047,000 ▪ Diluted EPS of $0.45 ▪ Profitable Each Q uarter T hroughout 2011 ▪ Raised $40 million in Capital in 2010 ▪ No TARP/SBLF ▪ $4.3 Valuation Allowance on DTA ▪ Grew Capital Ratios – Total RBC 20.3% at Bank 2011 OVERVIEW 4
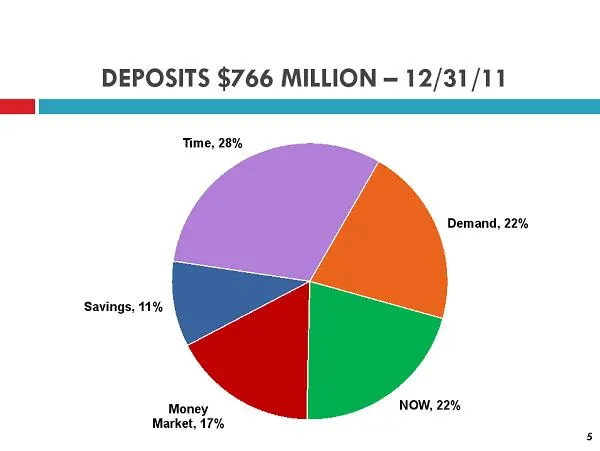
Slide 5: Deposits $766 Million – 12/31/11
DEPOSITS $766 MILLION – 12/31/11 Demand, 22% NOW, 22% Money Market, 17% Savings, 11% Time, 28% 5
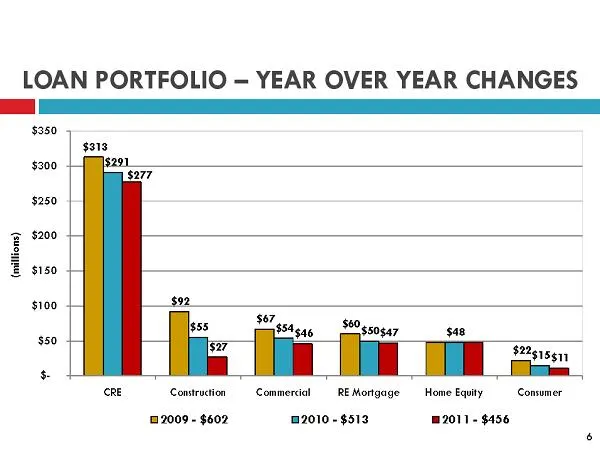
Slide 6: Loan Portfolio – Year Over Year Changes
LOAN PORTFOLIO – YEAR OVER YEAR CHANGES $313 $92 $67 $60 $22 $291 $55 $54 $50 $48 $15 $277 $27 $46 $47 $11 $ - $50 $100 $150 $200 $250 $300 $350 CRE Construction Commercial RE Mortgage Home Equity Consumer (millions) 2009 - $602 2010 - $513 2011 - $456 6
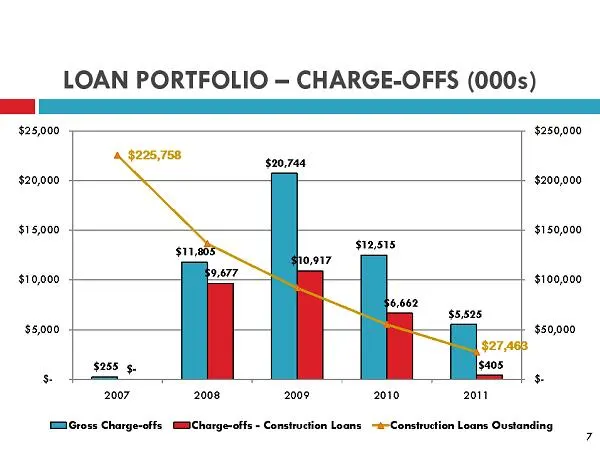
Slide 7: Loan Portfolio – Charge-Offs
LOAN PORTFOLIO – CHARGE - OFFS (000s) $255 $11,805 $20,744 $12,515 $5,525 $ - $9,677 $10,917 $6,662 $405 $225,758 $27,463 $ - $50,000 $100,000 $150,000 $200,000 $250,000 $ - $5,000 $10,000 $15,000 $20,000 $25,000 2007 2008 2009 2010 2011 Gross Charge - offs Charge - offs - Construction Loans Constru
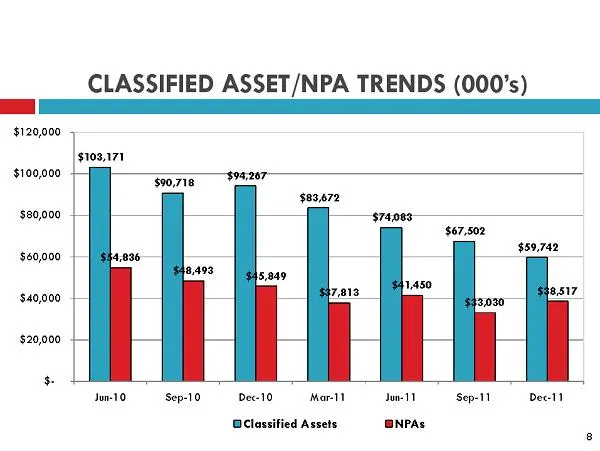
Slide 8: Classified Asset/NPA Trends
CLASSIFIED ASSET/NPA TRENDS (000’s) $103,171 $90,718 $94,267 $83,672 $74,083 $67,502 $59,742 $54,836 $48,493 $45,849 $37,813 $41,450 $33,030 $38,517 $ - $20,000 $40,000 $60,000 $80,000 $100,000 $120,000 Jun - 10 Sep - 10 Dec - 10 Mar - 11 Jun - 11 Sep - 11 Dec - 11 Classified Assets NPAs 8
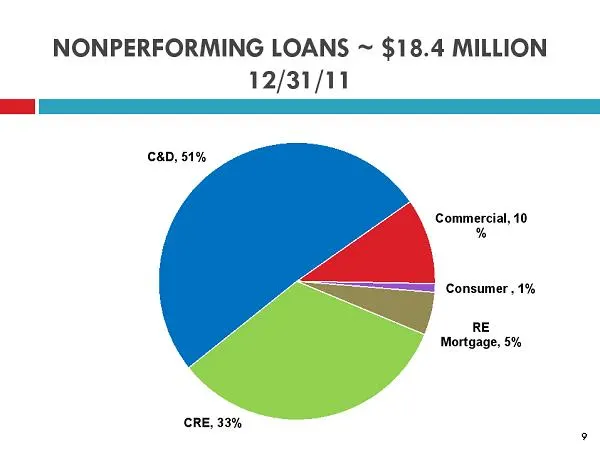
Slide 9: Nonperforming Loans ~ $18.4 Million 12/31/11
NONPERFORMING LOANS ~ $18.4 MILLION 12/31/11 Commercial, 10 % Consumer , 1% RE Mortgage, 5% CRE, 33% C&D, 51% 9
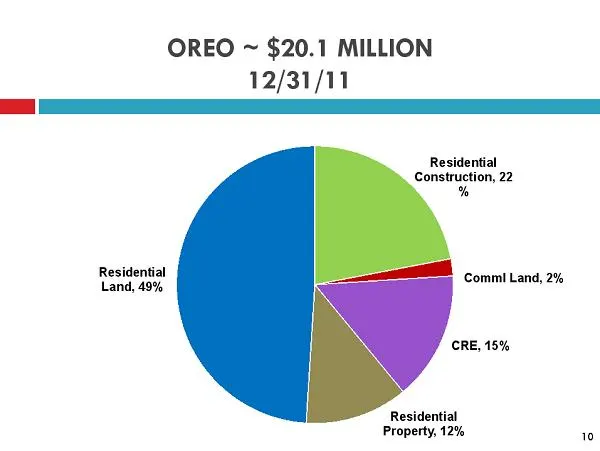
Slide 10: OREO ~ $20.1 Million 12/31/11
OREO ~ $20.1 MILLION 12/31/11 Residential Construction, 22 % Comml Land, 2% CRE, 15% Residential Property, 12% Residential Land, 49% 10
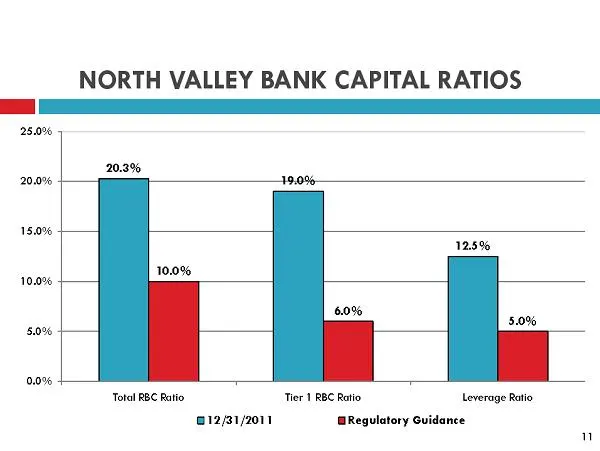
Slide 11: North Valley Bank Capital Ratios
NORTH VALLEY BANK CAPITAL RATIOS 20.3% 19.0% 12.5% 10.0% 6.0% 5.0% 0.0% 5.0% 10.0% 15.0% 20.0% 25.0% Total RBC Ratio Tier 1 RBC Ratio Leverage Ratio 12/31/2011 Regulatory Guidance 11
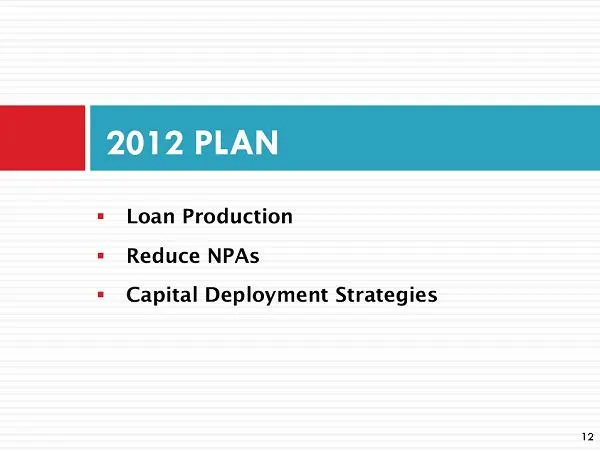
Slide 12: 2012 Plan
▪ Loan Production ▪ Reduce NPAs ▪ Capital Deployment Strategies 2012 PLAN 12
Slide 13: Thank You…
NORT H VALLEY BANCORP Thank You…
Source: SEC EDGAR · 8-K filed Mar 2, 2012
More decks from North Valley Bancorp
 Keefe Bruyette and Woods Banking Conference 201443 slides · Jul 29, 2014
 Merger or Acquisition (January 2014)14 slides · Jan 22, 2014
 Sandler O'Neill & Partners West Coast Financial Services Conference 201114 slides · Mar 7, 2011
 D. A. Davidson & Co. Annual Financial Services Investor Conference 200925 slides · May 5, 2009
 Sandler O'Neill & Partners West Coast Financial Services Conference 200917 slides · Feb 27, 2009
 D.A. Davidson & Co. Annual Financial Services Investor Conference 200827 slides · May 5, 2008