North Valley Bancorp — Sandler O'Neill & Partners West Coast Financial Services Conference 2011
14 slides from North Valley Bancorp's conference presentation, Mar 7, 2011
Slide 1: North Valley Bancorp – West Coast Financial Services Conference
North Valley Bancorp NASDAQ: NOVB SANDLER O’NEILL & PARTNERS West Coast Financial Services Conference March 8, 2011 Michael Cushman President & CEO
Slide 2: Disclaimer
Disclaimer Disclosure This presentation contains certain forward-looking statements that are subject to risks and uncertainties that could cause actual results to differ materially from those stated herein. For a discussion of factors that could cause actual results to differ, please refer to the Co
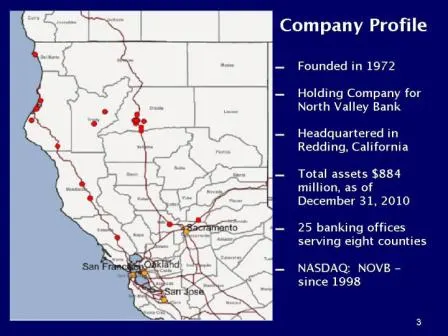
Slide 3: Company Profile
Company Profile ▬ Founded in 1972 ▬ Holding Company for North Valley Bank ▬ Headquartered in Redding, California ▬ Total assets $884 million, as of December 31, 2010 ▬ 25 banking offices serving eight counties ▬ NASDAQ: NOVB - since 1998
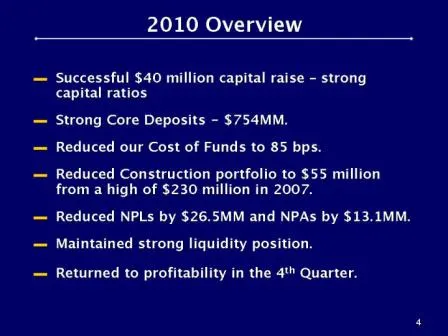
Slide 4: 2010 Overview
2010 Overview ▬ Successful $40 million capital raise – strong capital ratios ▬ Strong Core Deposits - $754MM. ▬ Reduced our Cost of Funds to 85 bps. ▬ Reduced Construction portfolio to $55 million from a high of $230 million in 2007. ▬ Reduced NPLs by $26.5MM and NPAs by $13.1MM. ▬ Maintained strong
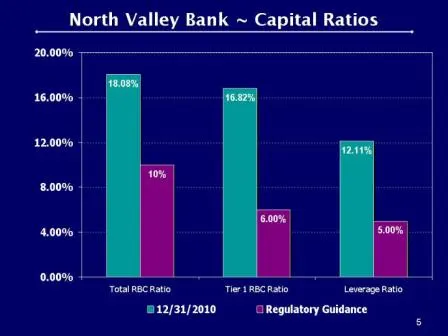
Slide 5: North Valley Bank Capital Ratios 12/31/2010
North Valley Bank ~ Capital Ratios 12/31/2010 Regulatory Guidance
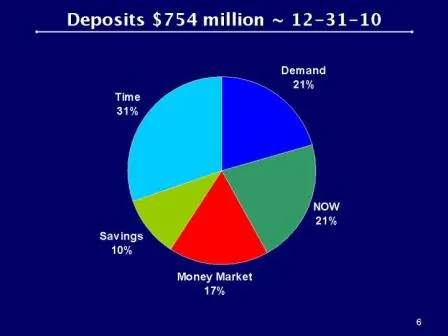
Slide 6: Deposits $754 million
Deposits $754 million ~ 12-31-10
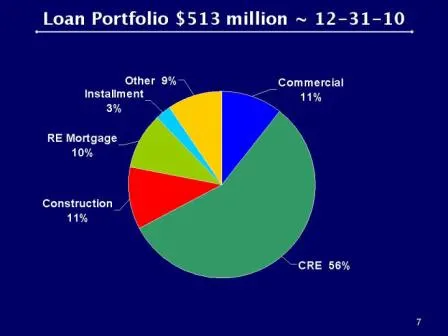
Slide 7: Loan Portfolio $513 million
Loan Portfolio $513 million ~ 12-31-10
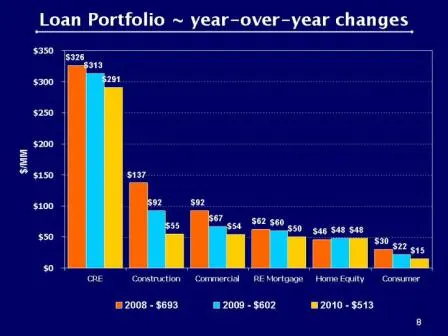
Slide 8: Loan Portfolio year-over-year changes
Loan Portfolio ~ year-over-year changes 2008 - $693 2009 - $602 2010 - $513
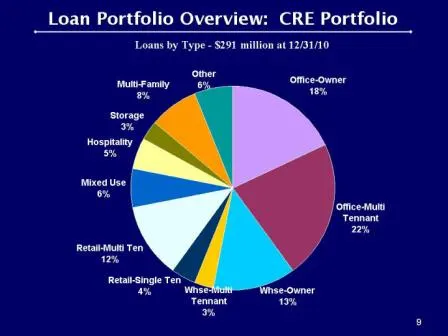
Slide 9: Loan Portfolio Overview: CRE Portfolio
Loan Portfolio Overview: CRE Portfolio Loans by Type - $291 million at 12/31/10
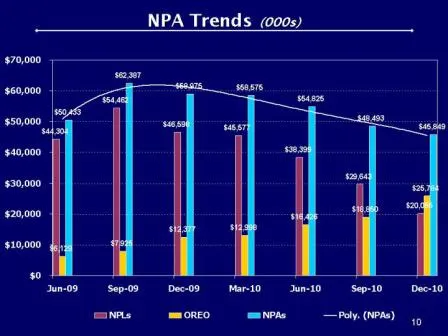
Slide 10: NPA Trends
NPA Trends (000s) $70,000 $60,000 $50,000, $40,000 $30,000 $20,000 $10,000 so Jun-09 —Sep-09Dec-09 — Mar-10—Dum-10—Sep-10—Dec-10. mmOREO — mNPAe Poly (NPR)
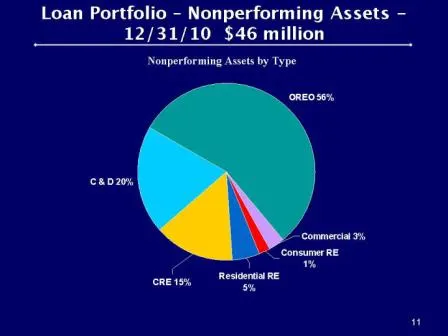
Slide 11: Loan Portfolio – Nonperforming Assets
Loan Portfolio – Nonperforming Assets -12/31/10 $46 million Nonperforming Assets by Type
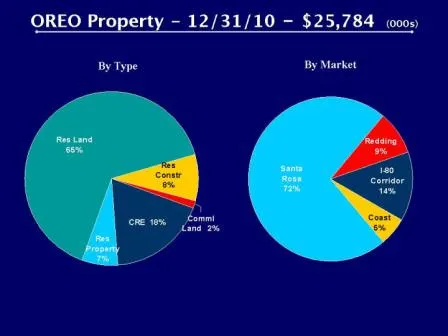
Slide 12: OREO Property
OREO Property - 12/31/10 - $25,784 (000s) By Type By Market
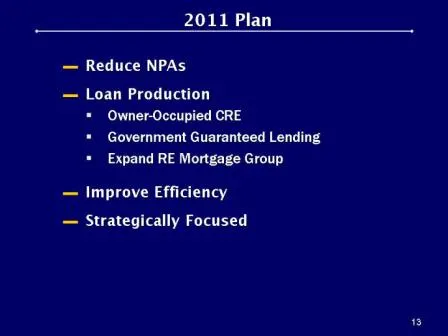
Slide 13: 2011 Plan
2011 Plan ▬ Reduce NPAs ▬ Loan Production Owner-Occupied CRE Government Guaranteed Lending Expand RE Mortgage Group ▬ Improve Efficiency ▬ Strategically Focused

Slide 14: Thank You...
Thank You...
Source: SEC EDGAR · 8-K filed Mar 7, 2011
More decks from North Valley Bancorp
 Keefe Bruyette and Woods Banking Conference 201443 slides · Jul 29, 2014
 Merger or Acquisition (January 2014)14 slides · Jan 22, 2014
 West Coast Financial Services Conference (March 2012)13 slides · Mar 2, 2012
 D. A. Davidson & Co. Annual Financial Services Investor Conference 200925 slides · May 5, 2009
 Sandler O'Neill & Partners West Coast Financial Services Conference 200917 slides · Feb 27, 2009
 D.A. Davidson & Co. Annual Financial Services Investor Conference 200827 slides · May 5, 2008