Vectren — American Gas Association Financial Forum May 2017
54 slides from Vectren's conference presentation, May 19, 2017

Slide 1: American Gas Association Financial Forum
ican Gas Association Financia ey — VECTREN Live Smart *
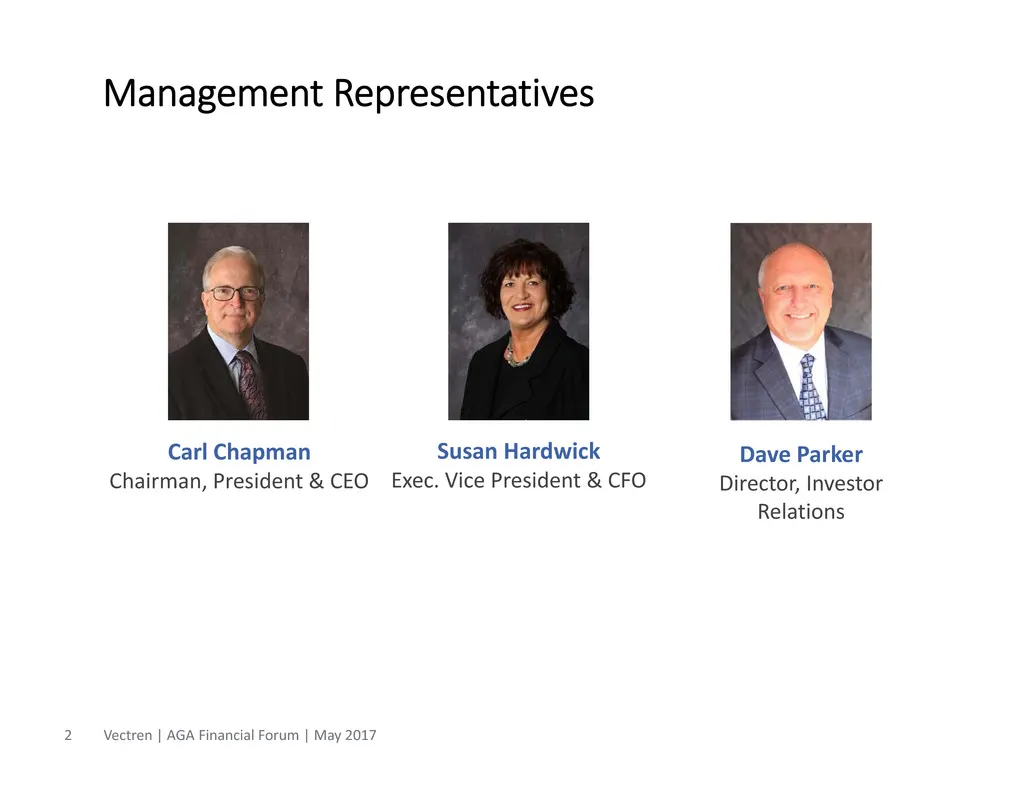
Slide 2: Management Representatives
Management Representatives Dave Parker Director, Investor Relations Carl Chapman Chairman, President & CEO Susan Hardwick Exec. Vice President & CFO Vectren | AGA Financial Forum | May 20172
Slide 3: Forward-Looking Statements
Forward‐Looking Statements All statements other than statements of historical fact are forward‐looking statements made in good faith by the company and are intended to qualify for the safe harbor from liability established by the Private Securities Litigation Reform Act of 1995. Such statements are
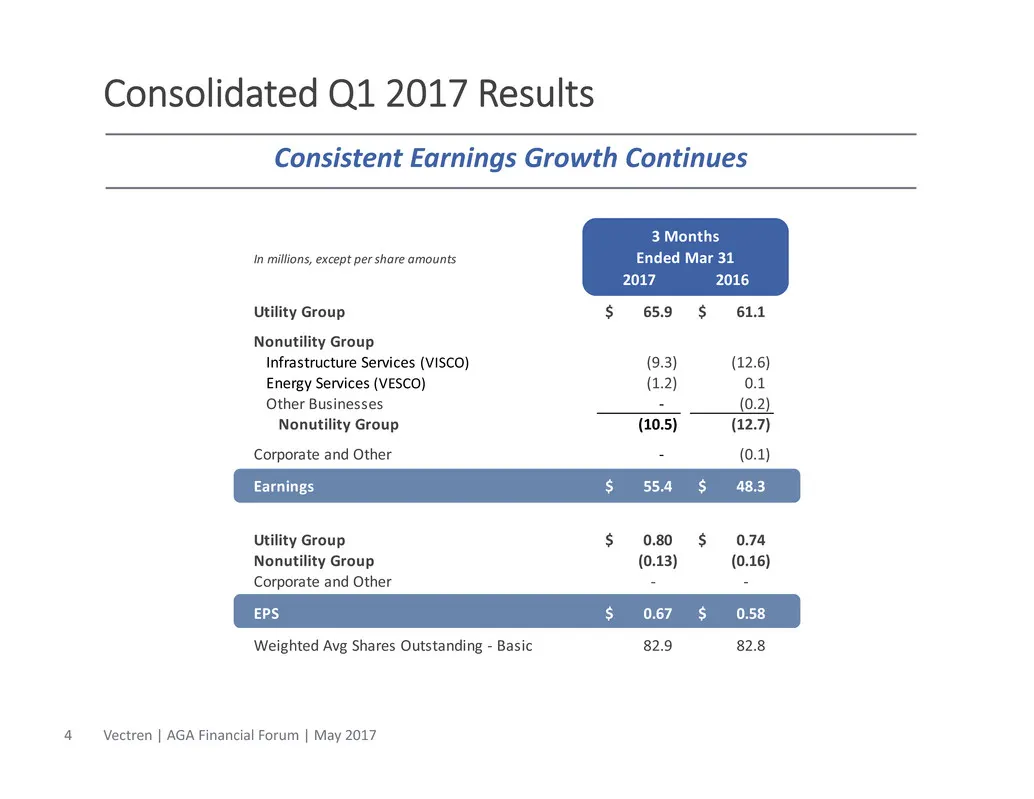
Slide 4: Consolidated Q1 2017 Results
Consolidated Q1 2017 Results Consistent Earnings Growth Continues In millions, except per share amounts 2017 2016 Utility Group 65.9$ 61.1$ Nonutility Group Infrastructure Services (VISCO) (9.3) (12.6) Energy Services (VESCO) (1.2) 0.1 Other Businesses ‐ (0.2) Nonutility Group (10.5) (12.7) Corporat
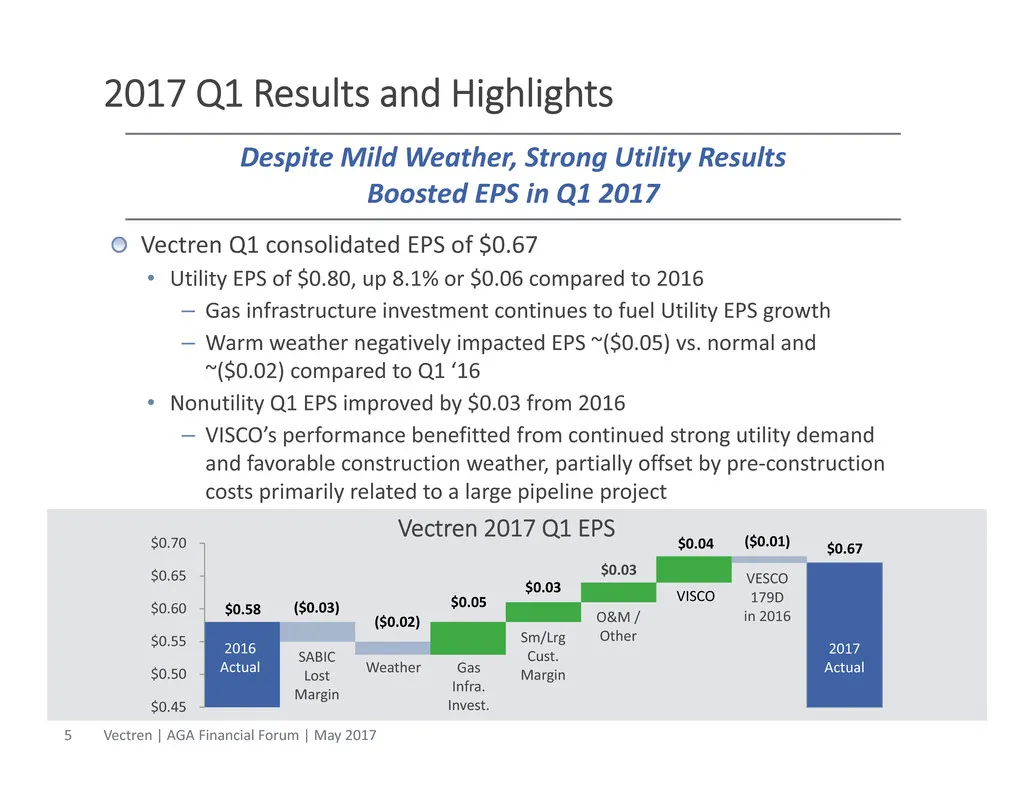
Slide 5: 2017 Q1 Results and Highlights
2017 Q1 Results and Highlights Vectren Q1 consolidated EPS of $0.67 • Utility EPS of $0.80, up 8.1% or $0.06 compared to 2016 – Gas infrastructure investment continues to fuel Utility EPS growth – Warm weather negatively impacted EPS ~($0.05) vs. normal and ~($0.02) compared to Q1 ‘16 • Nonutility Q
Slide 6: 2017 Guidance Affirmed
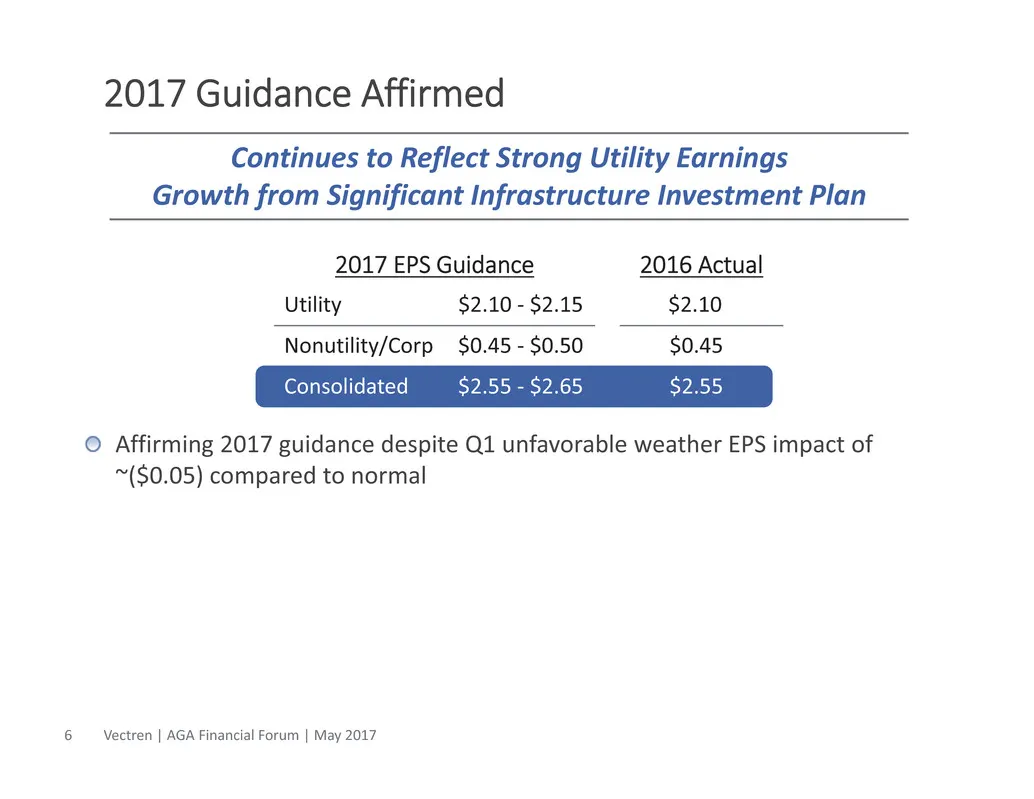
2017 Guidance Affirmed Continues to Reflect Strong Utility Earnings Growth from Significant Infrastructure Investment Plan 2017 EPS Guidance 2016 Actual Utility $2.10 ‐ $2.15 $2.10 Nonutility/Corp $0.45 ‐ $0.50 $0.45 Consolidated $2.55 ‐ $2.65 $2.55 Affirming 2017 guidance despite Q1 unfavorable wea
Slide 7: Vectren Long-Term Outlook
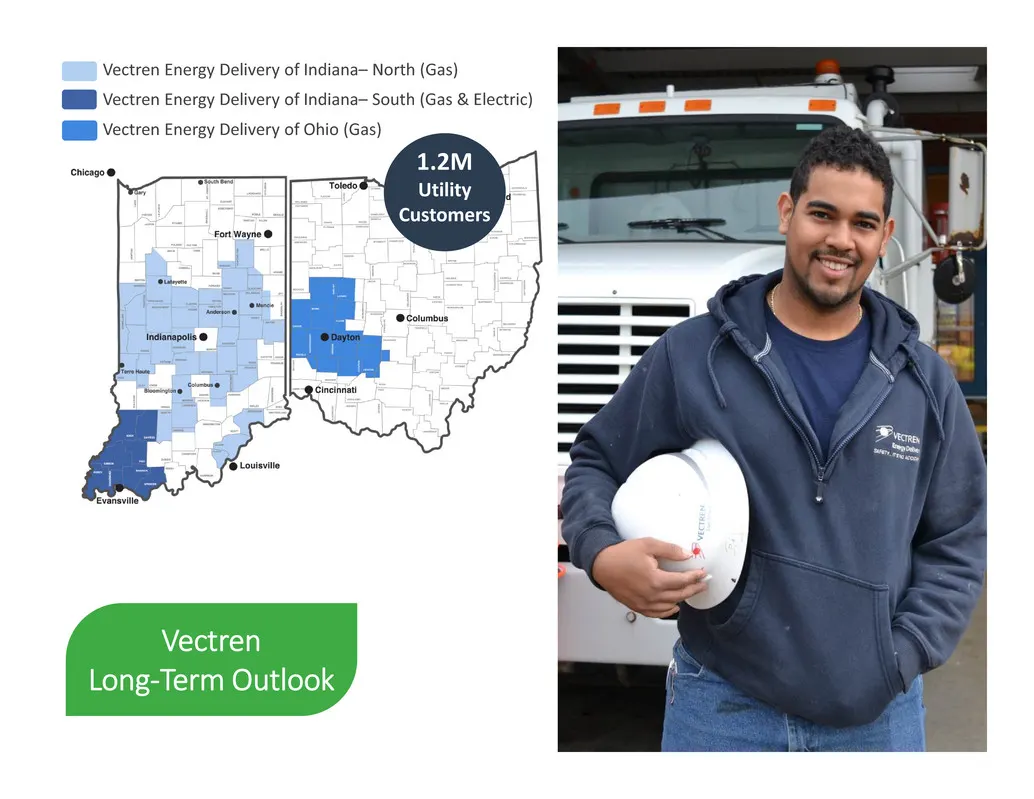
Vectren Long‐Term Outlook 1.2M Utility Customers Vectren Energy Delivery of Indiana– North (Gas) Vectren Energy Delivery of Indiana– South (Gas & Electric) Vectren Energy Delivery of Ohio (Gas)
Slide 8: Delivering Strong Results by Executing on our Strategies
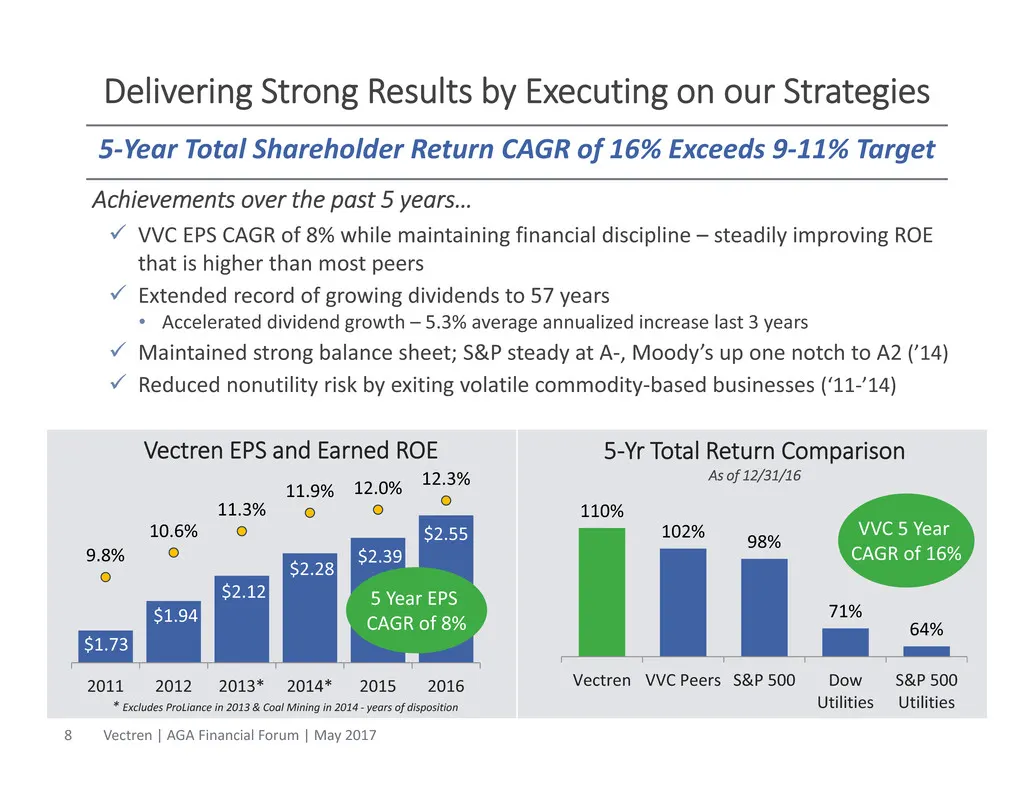
Delivering Strong Results by Executing on our Strategies Achievements over the past 5 years… VVC EPS CAGR of 8% while maintaining financial discipline – steadily improving ROE that is higher than most peers Extended record of growing dividends to 57 years • Accelerated dividend growth – 5.3% ave
Slide 9: Disciplined Utility Growth Key To Vectren's Success
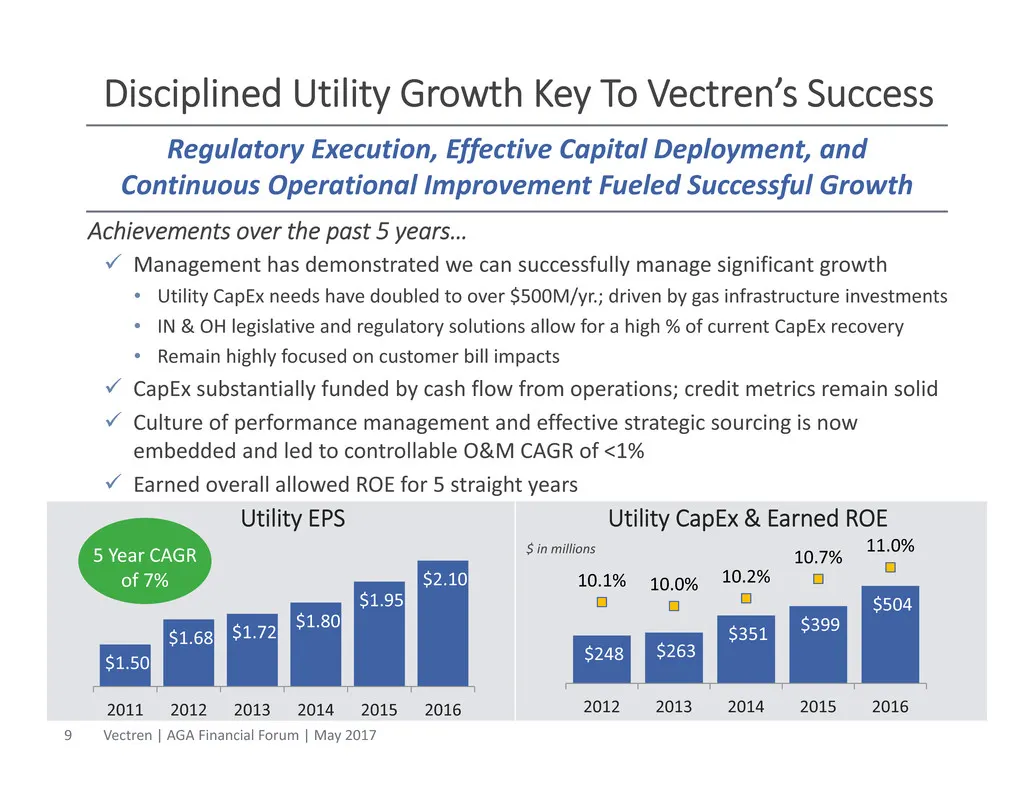
Disciplined Utility Growth Key To Vectren’s Success Management has demonstrated we can successfully manage significant growth • Utility CapEx needs have doubled to over $500M/yr.; driven by gas infrastructure investments • IN & OH legislative and regulatory solutions allow for a high % of current
Slide 10: Long-Term Targets
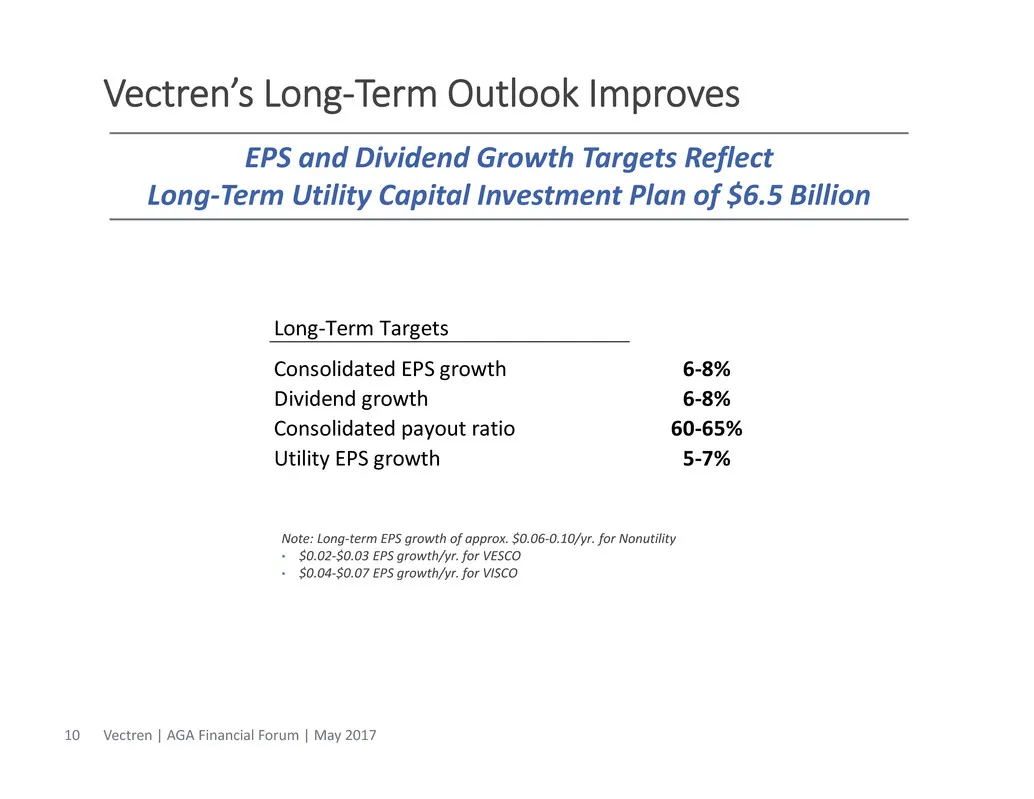
Long‐Term Targets Consolidated EPS growth 6‐8% Dividend growth 6‐8% Consolidated payout ratio 60‐65% Utility EPS growth 5‐7% Vectren’s Long‐Term Outlook Improves Note: Long‐term EPS growth of approx. $0.06‐0.10/yr. for Nonutility • $0.02‐$0.03 EPS growth/yr. for VESCO • $0.04‐$0.07 EPS growth/yr. fo
Slide 11: Vectren's Long-Term Outlook Improves (cont.)
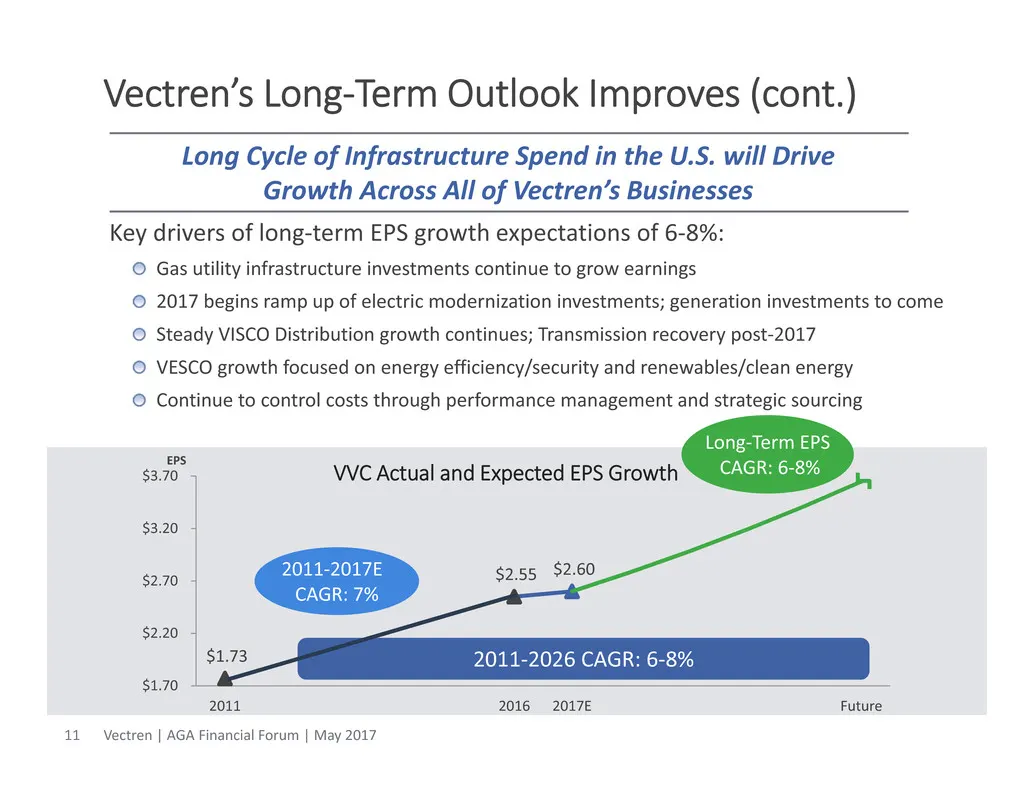
$1.73 $2.55 $2.60 $1.70 $2.20 $2.70 $3.20 $3.70 2011 2016 2017E Future EPS Key drivers of long‐term EPS growth expectations of 6‐8%: Gas utility infrastructure investments continue to grow earnings 2017 begins ramp up of electric modernization investments; generation investments to come Steady VISCO
Slide 12: Increased Utility CapEx Drives Earnings
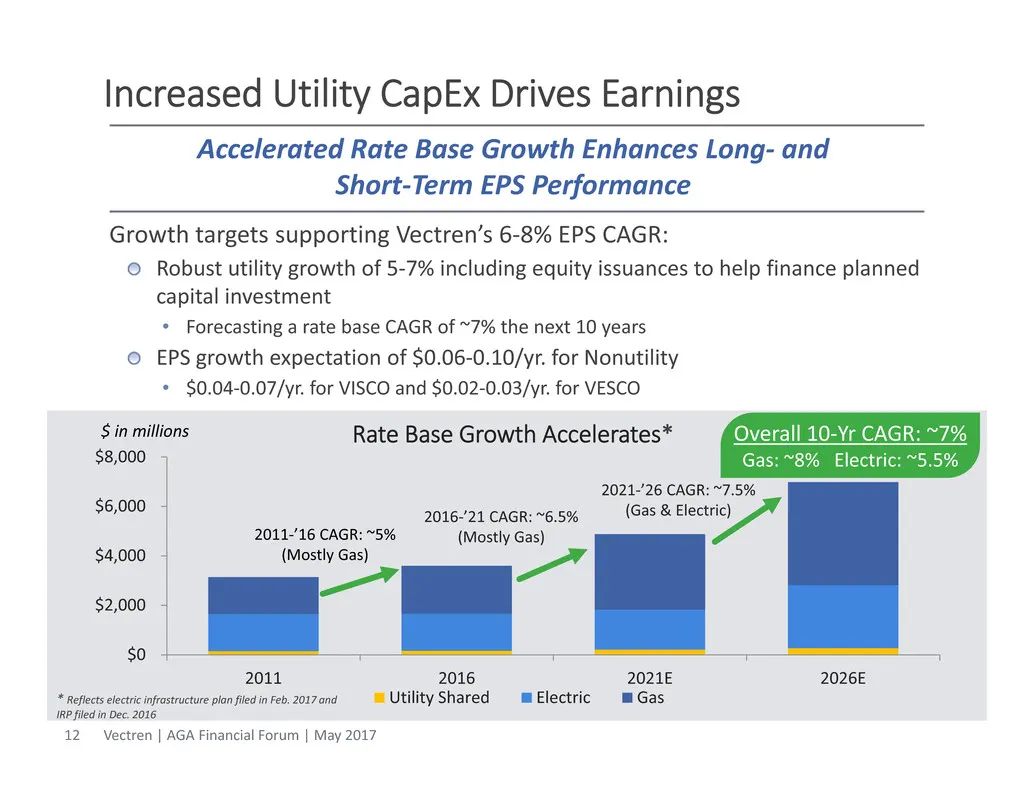
Increased Utility CapEx Drives Earnings Accelerated Rate Base Growth Enhances Long‐ and Short‐Term EPS Performance $0 $2,000 $4,000 $6,000 $8,000 2011 2016 2021E 2026E Utility Shared Electric Gas 2021‐’26 CAGR: ~7.5% (Gas & Electric) $ in millions 2016‐’21 CAGR: ~6.5% (Mostly Gas)2011‐’16 CAGR: ~5%
Slide 13: Utility Outlook
Utility Outlook
Slide 14: Transforming Our Utility
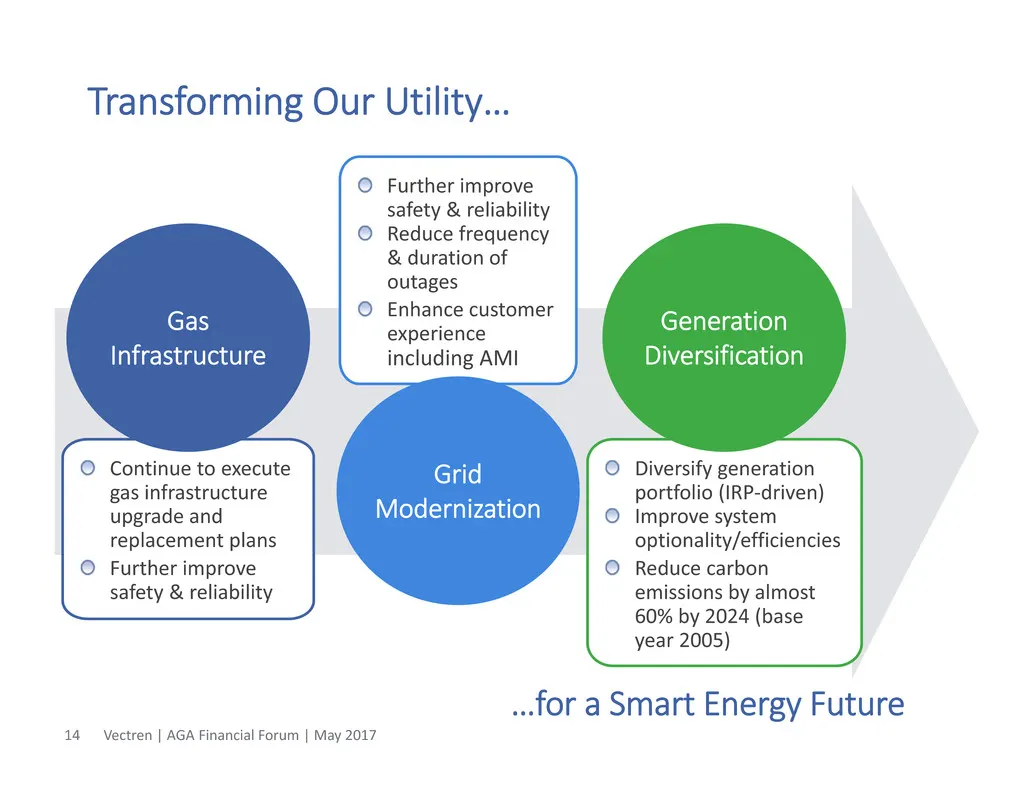
Transforming Our Utility… Diversify generation portfolio (IRP‐driven) Improve system optionality/efficiencies Reduce carbon emissions by almost 60% by 2024 (base year 2005) Generation Diversification Further improve safety & reliability Reduce frequency & duration of outages Enhance customer experie
Slide 15: Higher Expected Utility EPS CAGR of 5-7%
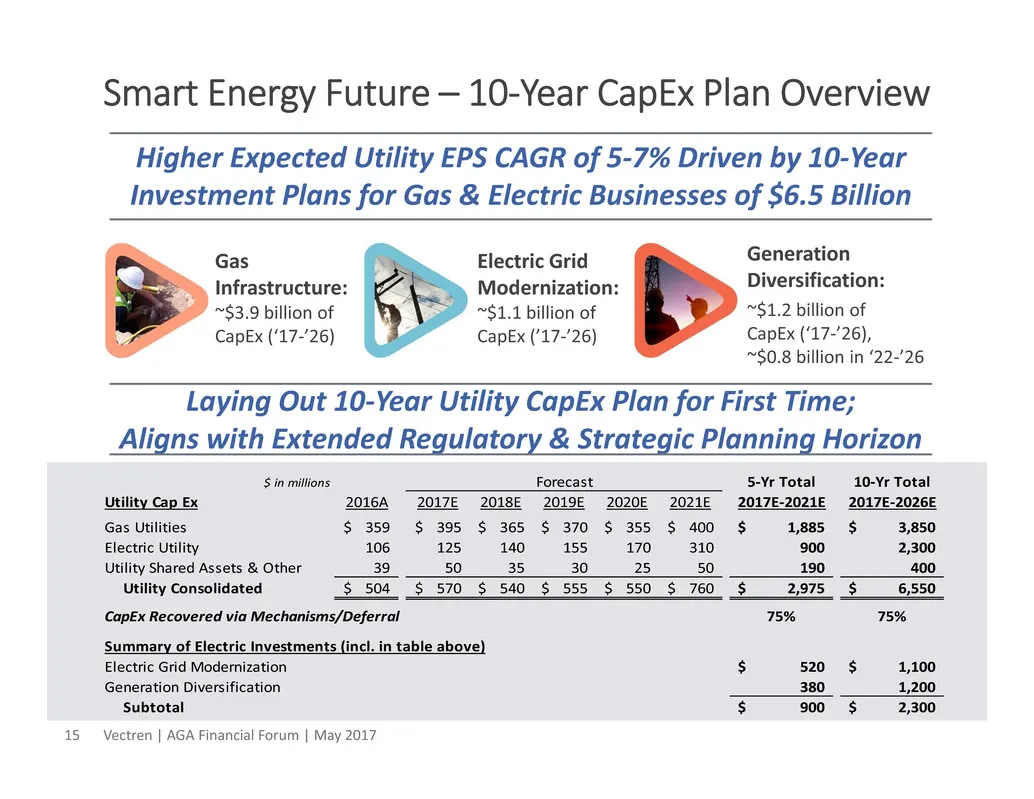
Higher Expected Utility EPS CAGR of 5‐7% Driven by 10‐Year Investment Plans for Gas & Electric Businesses of $6.5 Billion Generation Diversification: ~$1.2 billion of CapEx (‘17‐’26), ~$0.8 billion in ‘22‐’26 Gas Infrastructure: ~$3.9 billion of CapEx (‘17‐’26) Electric Grid Modernization: ~$1.1 bil
Slide 16: Gas Infrastructure
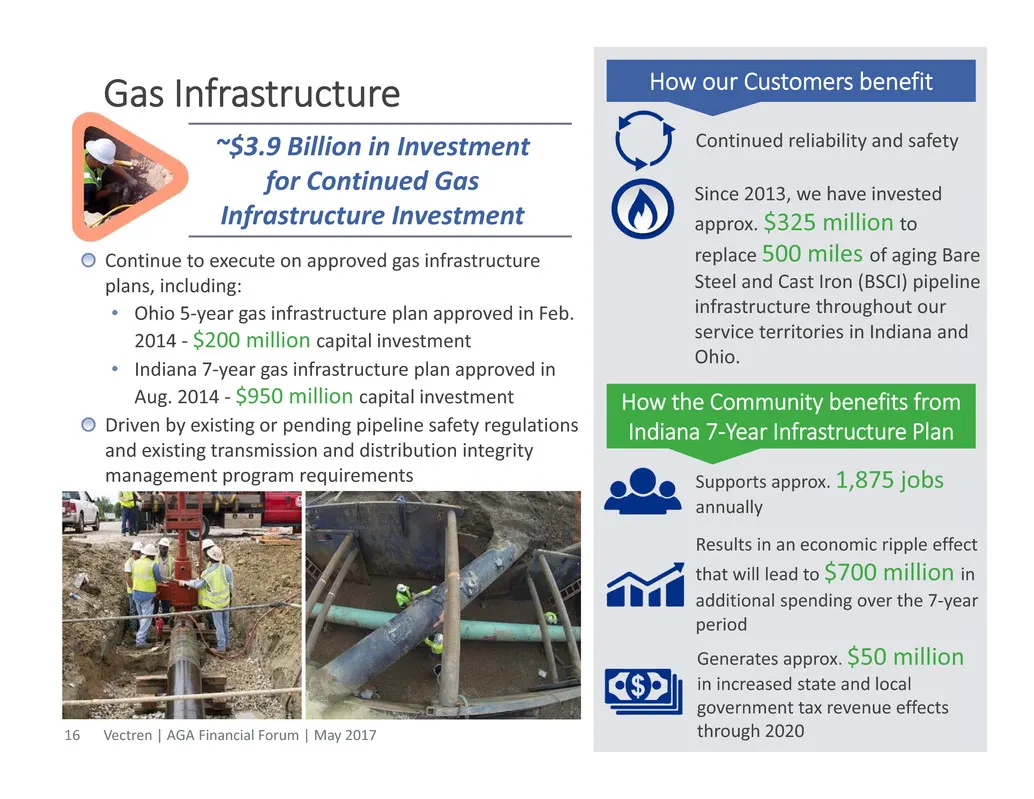
Gas Infrastructure Continue to execute on approved gas infrastructure plans, including: • Ohio 5‐year gas infrastructure plan approved in Feb. 2014 ‐ $200 million capital investment • Indiana 7‐year gas infrastructure plan approved in Aug. 2014 ‐ $950 million capital investment Driven by existing or
Slide 17: Electric Grid Modernization
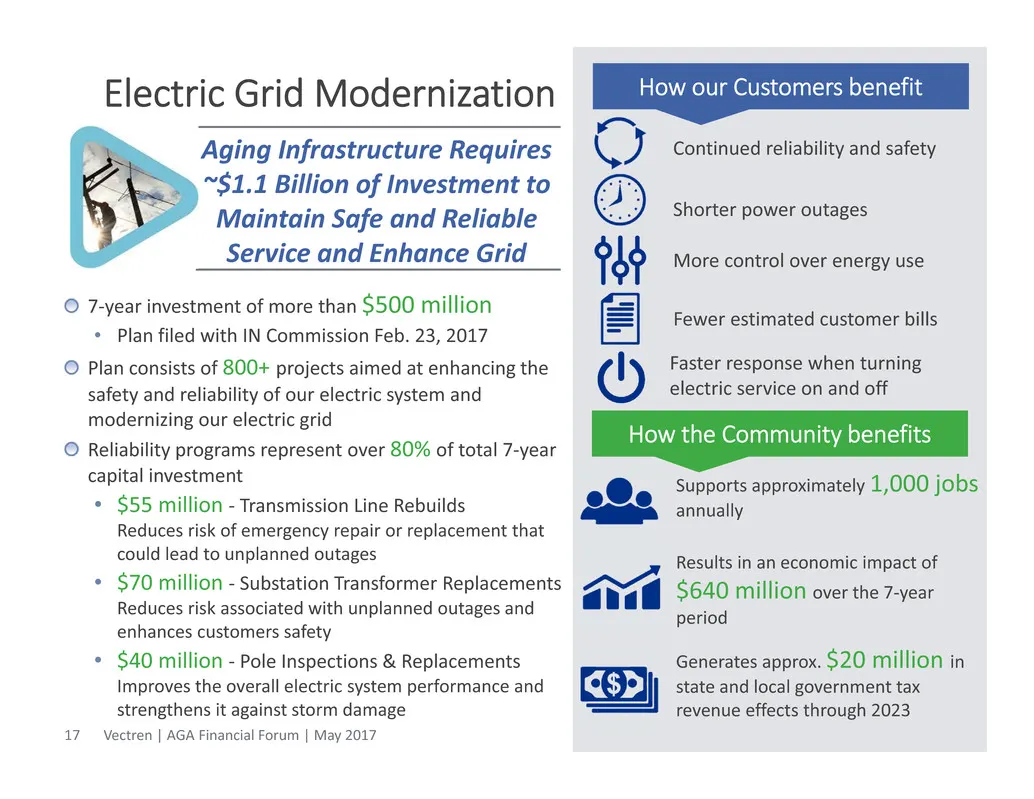
Electric Grid Modernization 7‐year investment of more than $500 million • Plan filed with IN Commission Feb. 23, 2017 Plan consists of 800+ projects aimed at enhancing the safety and reliability of our electric system and modernizing our electric grid Reliability programs represent over 80% of total
Slide 18: Generation Diversification
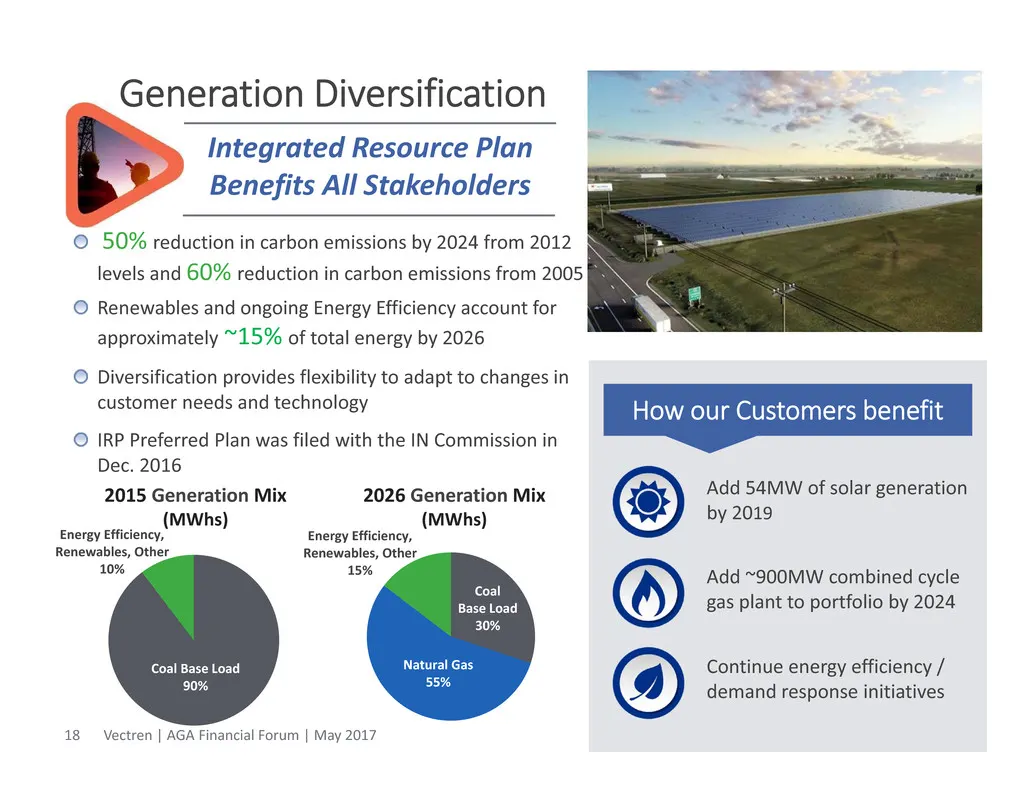
2015 Generation Mix (MWhs) Energy Efficiency, Renewables, Other 10% Coal Base Load 90% 50% reduction in carbon emissions by 2024 from 2012 levels and 60% reduction in carbon emissions from 2005 Renewables and ongoing Energy Efficiency account for approximately ~15% of total energy by 2026 Diversific
Slide 19: Financing Utility Investment
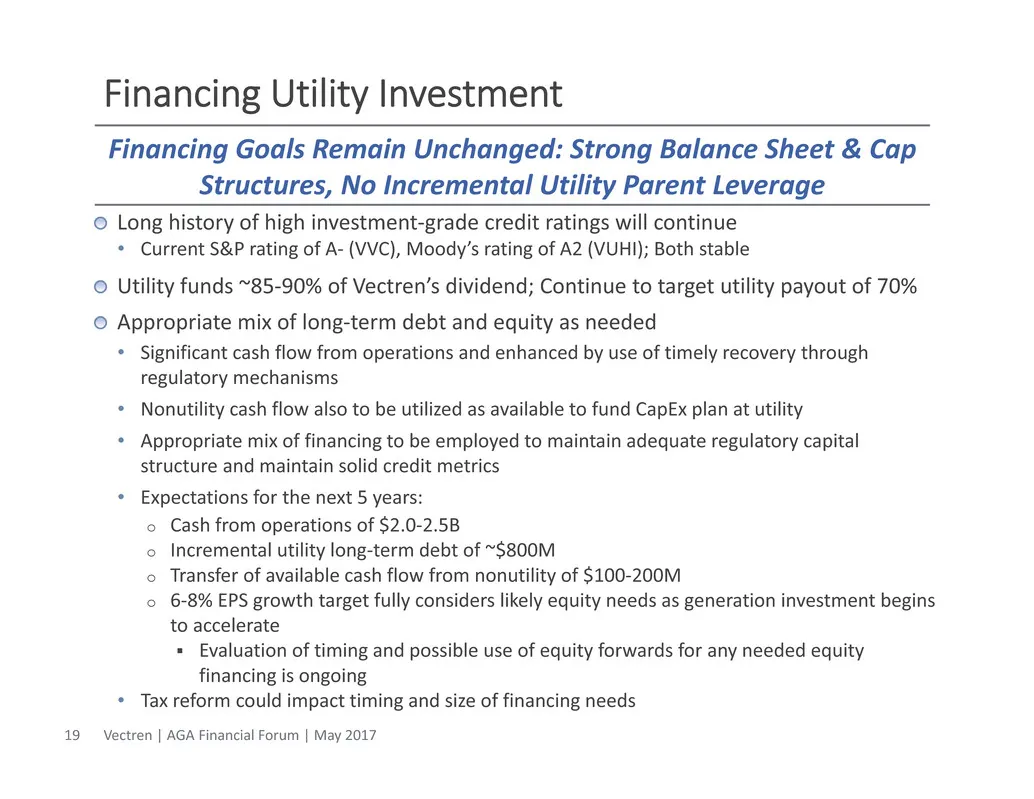
Financing Utility Investment Long history of high investment‐grade credit ratings will continue • Current S&P rating of A‐ (VVC), Moody’s rating of A2 (VUHI); Both stable Utility funds ~85‐90% of Vectren’s dividend; Continue to target utility payout of 70% Appropriate mix of long‐term debt and equit
Slide 20: Corporate Tax Reform
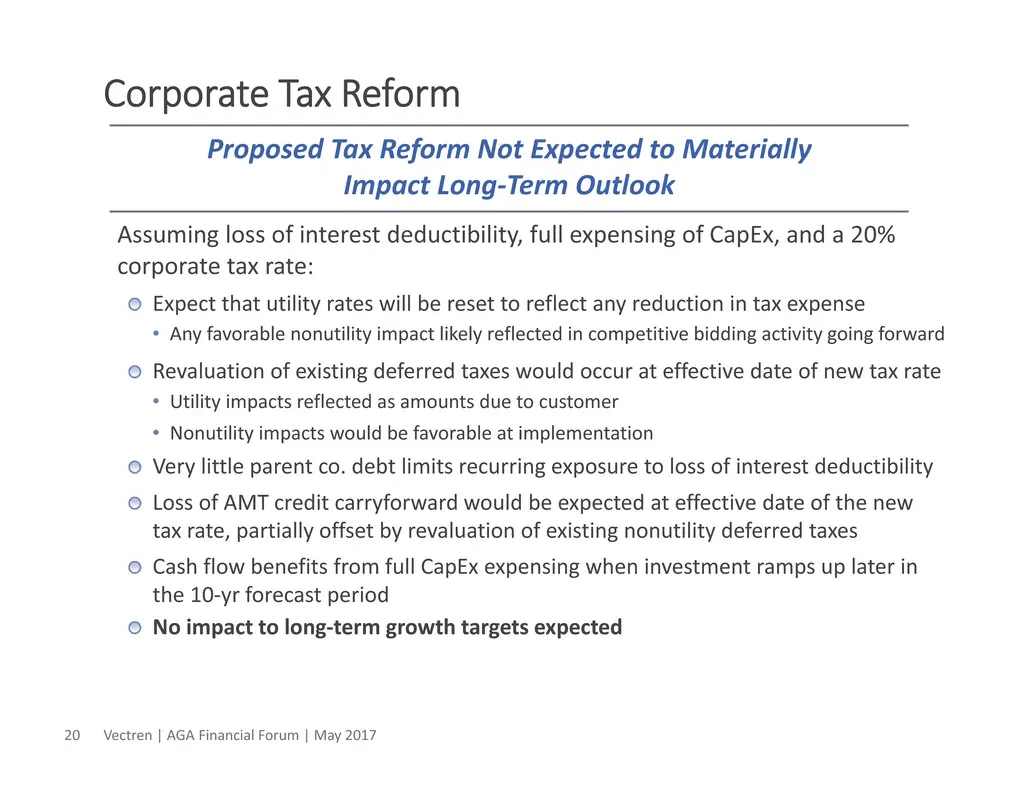
Corporate Tax Reform Assuming loss of interest deductibility, full expensing of CapEx, and a 20% corporate tax rate: Expect that utility rates will be reset to reflect any reduction in tax expense • Any favorable nonutility impact likely reflected in competitive bidding activity going forward Revalu
Slide 21: Utility Regulatory Update
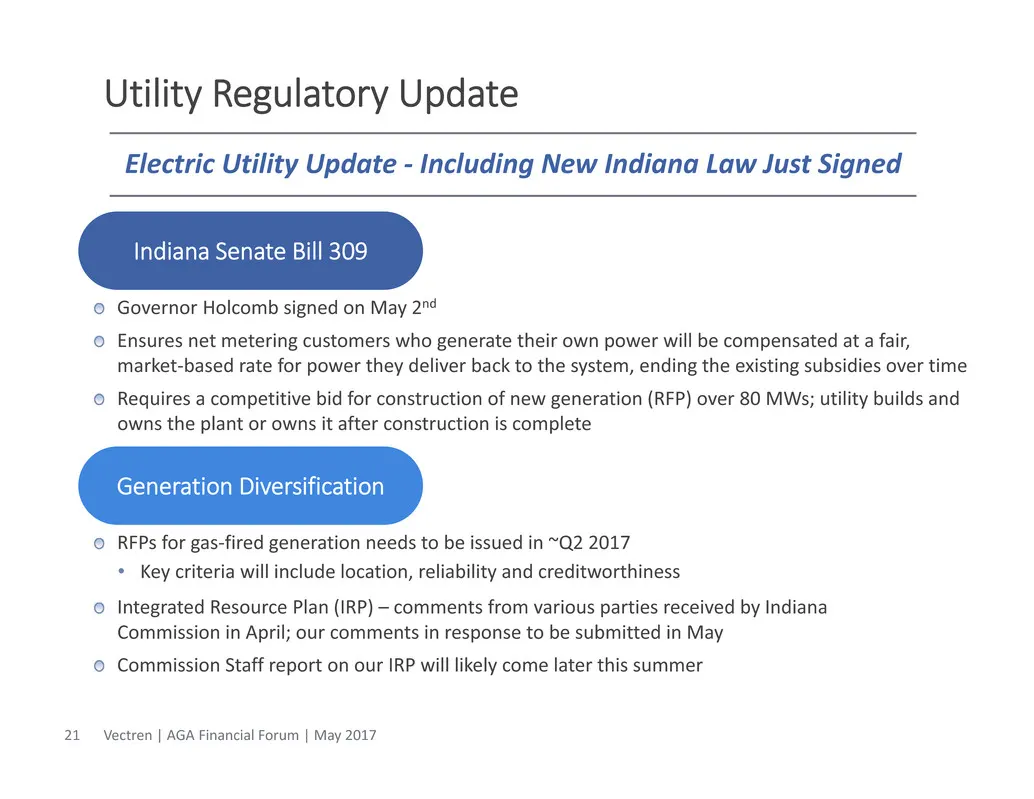
Utility Regulatory Update 21 RFPs for gas‐fired generation needs to be issued in ~Q2 2017 • Key criteria will include location, reliability and creditworthiness Integrated Resource Plan (IRP) – comments from various parties received by Indiana Commission in April; our comments in response to be subm
Slide 22: Utility Regulatory Update (continued)
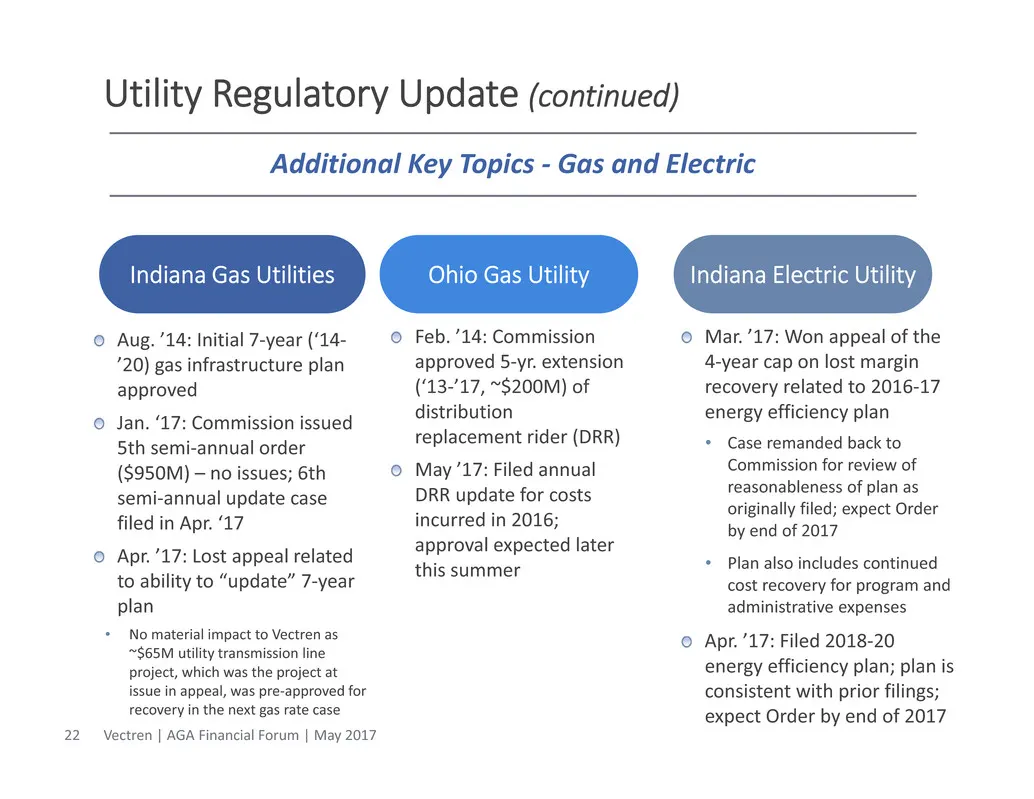
Utility Regulatory Update (continued) 22 Feb. ’14: Commission approved 5‐yr. extension (‘13‐’17, ~$200M) of distribution replacement rider (DRR) May ’17: Filed annual DRR update for costs incurred in 2016; approval expected later this summer Aug. ’14: Initial 7‐year (‘14‐ ’20) gas infrastructure pla
Slide 23: Anticipated Timeline for Near-Term Regulatory Activity
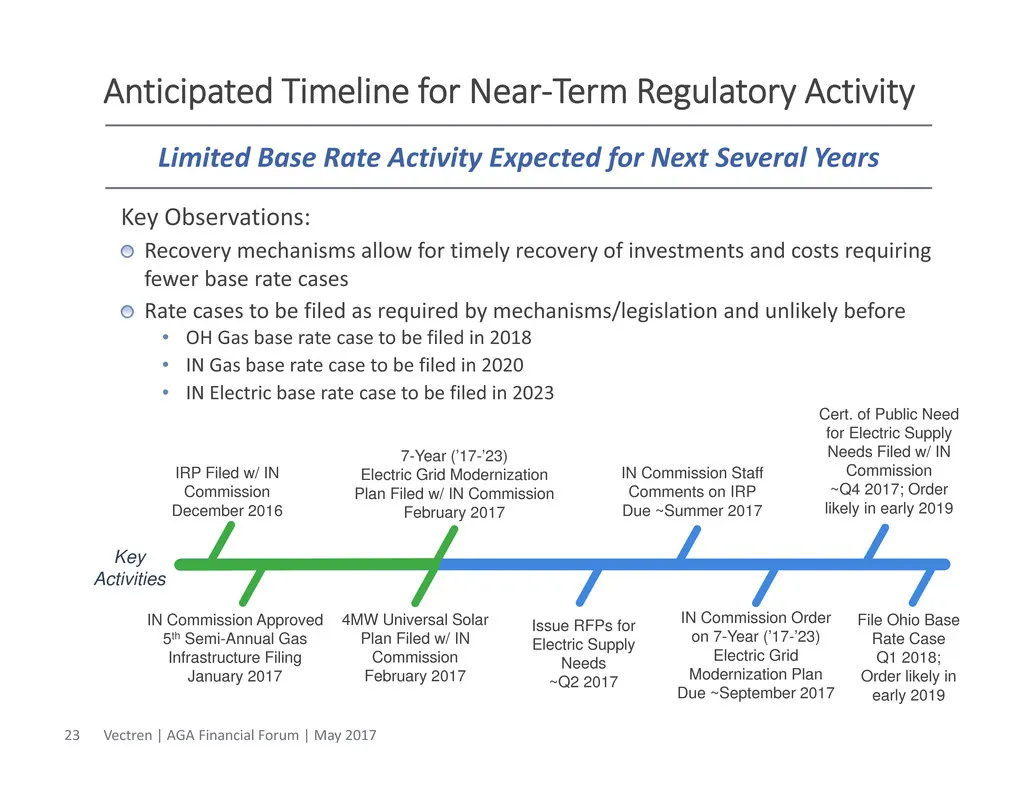
Anticipated Timeline for Near‐Term Regulatory Activity 23 Limited Base Rate Activity Expected for Next Several Years 7-Year (’17-’23) Electric Grid Modernization Plan Filed w/ IN Commission February 2017 Key Activities IN Commission Approved 5th Semi-Annual Gas Infrastructure Filing January 2017 Fil
Slide 24: Favorable Utility Environments
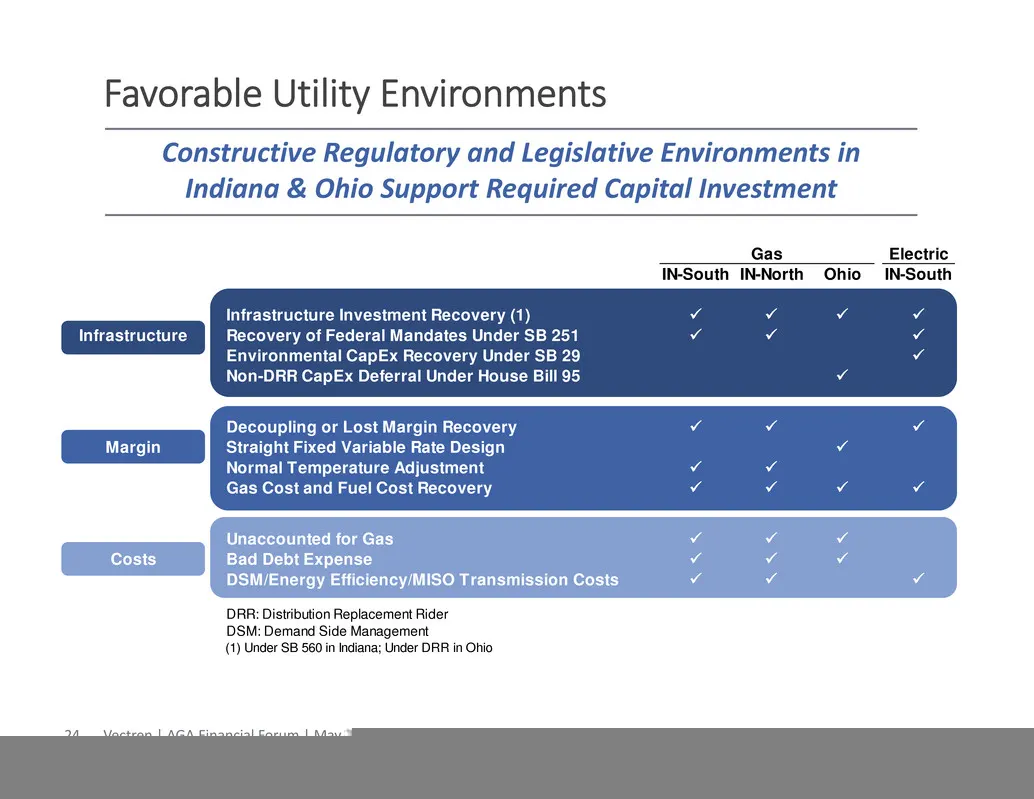
Favorable Utility Environments Constructive Regulatory and Legislative Environments in Indiana & Ohio Support Required Capital Investment Electric IN-South IN-North Ohio IN-South Infrastructure Investment Recovery (1) Infrastructure Recovery of Federal Mandates Under SB 251 Environment
Slide 25: Nonutility Outlook
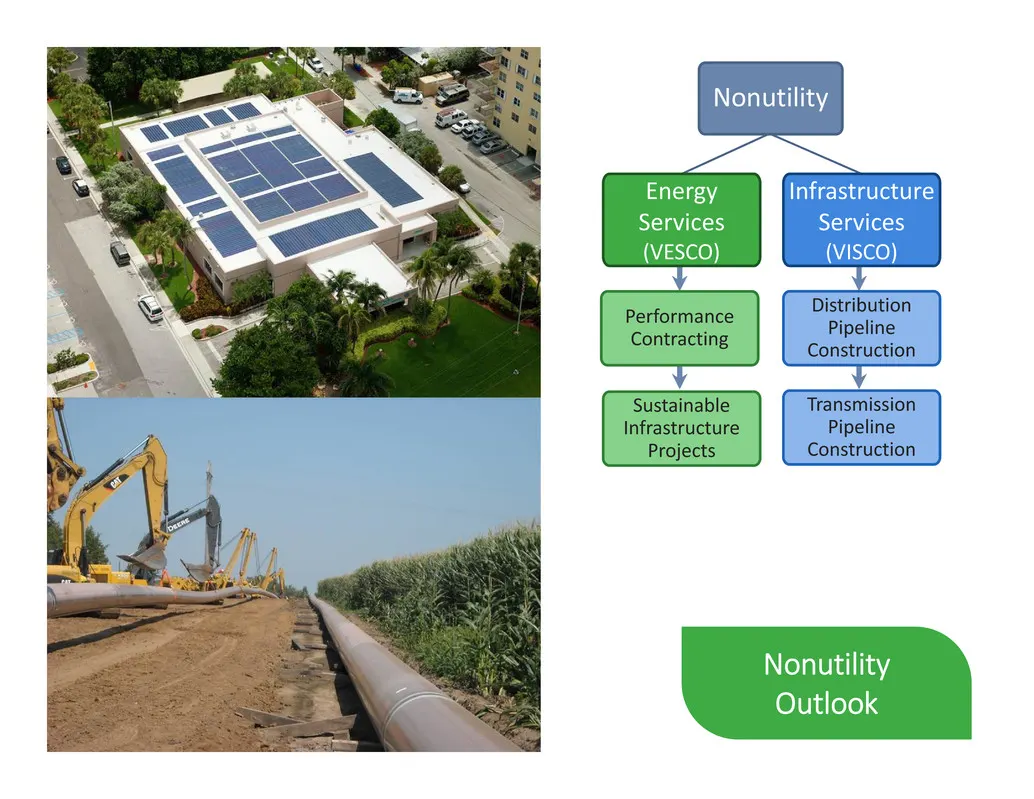
Nonutility Infrastructure Services (VISCO) Performance Contracting Sustainable Infrastructure Projects Energy Services (VESCO) Distribution Pipeline Construction Transmission Pipeline Construction Nonutility Outlook
Slide 26: 2017 Q1 Nonutility Results
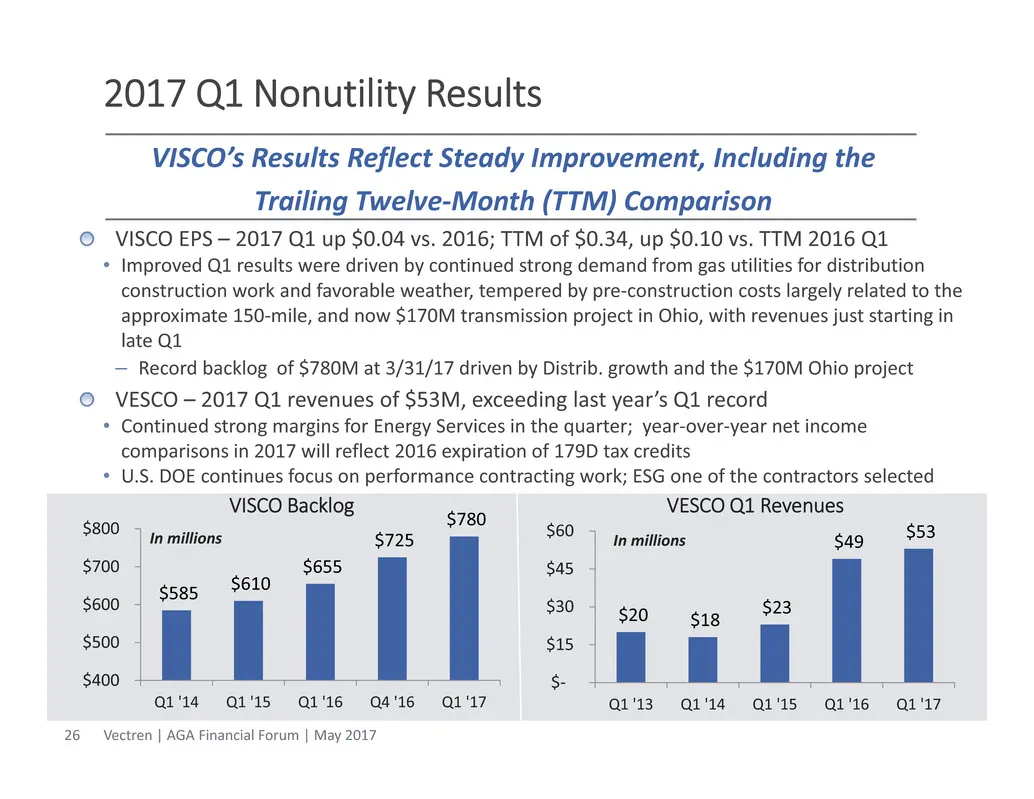
$20 $18 $23 $49 $53 $‐ $15 $30 $45 $60 Q1 '13 Q1 '14 Q1 '15 Q1 '16 Q1 '17 In millions 2017 Q1 Nonutility Results VISCO EPS – 2017 Q1 up $0.04 vs. 2016; TTM of $0.34, up $0.10 vs. TTM 2016 Q1 • Improved Q1 results were driven by continued strong demand from gas utilities for distribution construction
Slide 27: VISCO Outlook
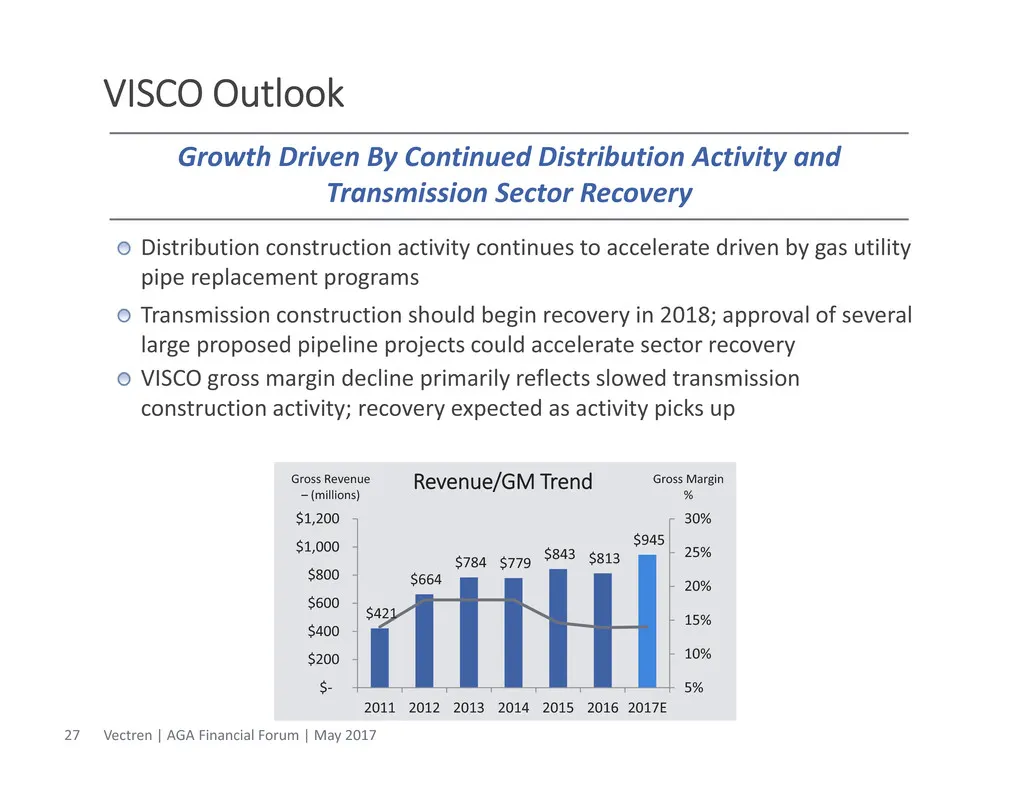
VISCO Outlook Distribution construction activity continues to accelerate driven by gas utility pipe replacement programs Transmission construction should begin recovery in 2018; approval of several large proposed pipeline projects could accelerate sector recovery VISCO gross margin decline primarily
Slide 28: VESCO Outlook
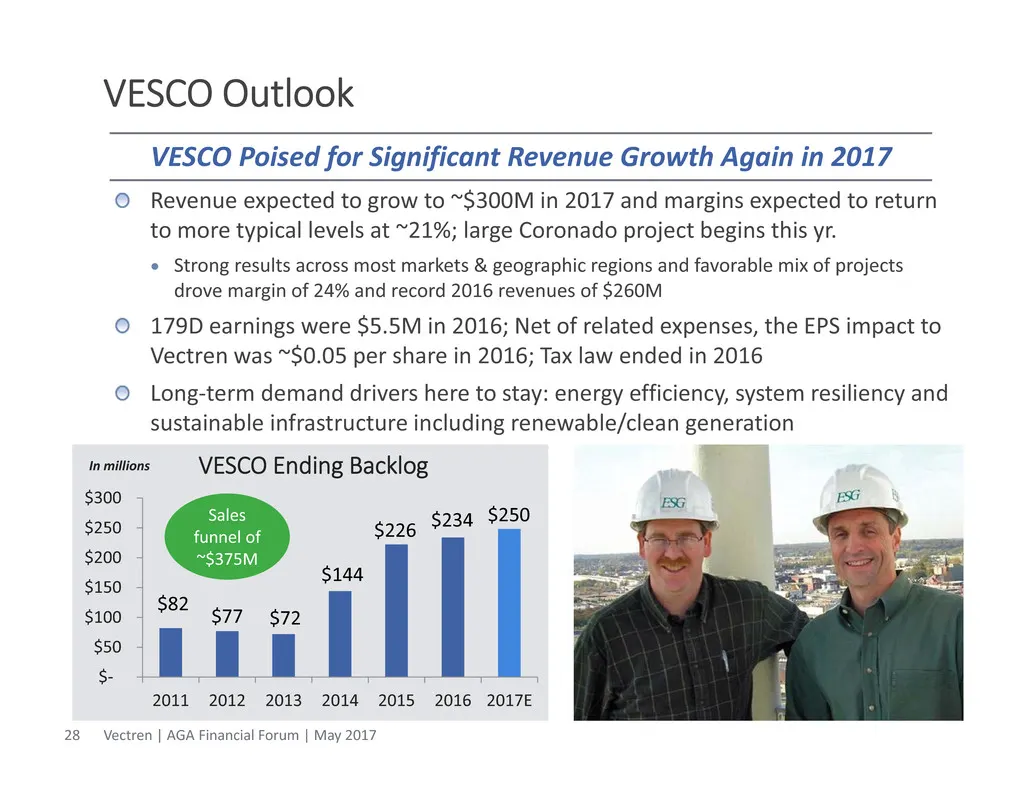
VESCO Outlook Revenue expected to grow to ~$300M in 2017 and margins expected to return to more typical levels at ~21%; large Coronado project begins this yr. Strong results across most markets & geographic regions and favorable mix of projects drove margin of 24% and record 2016 revenues of $260M
Slide 29: Closing Remarks
Closing Remarks
Slide 30: Top Decile for Dividend Increases
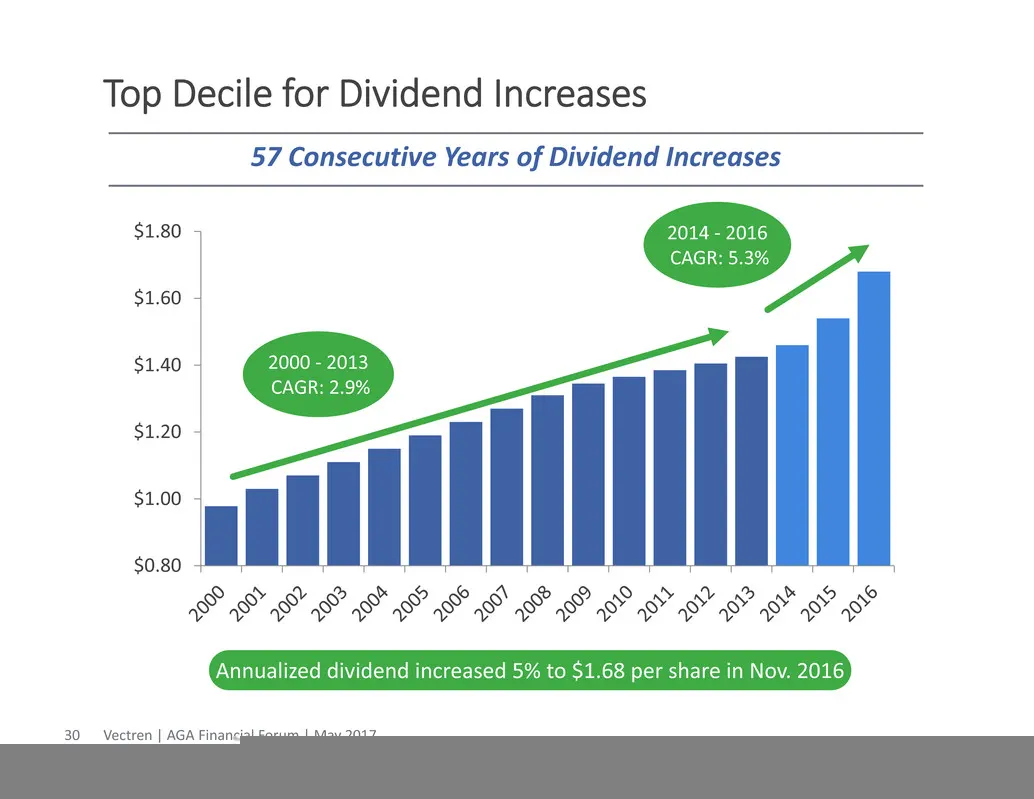
Top Decile for Dividend Increases $0.80 $1.00 $1.20 $1.40 $1.60 $1.80 2014 ‐ 2016 CAGR: 5.3% 2000 ‐ 2013 CAGR: 2.9% Annualized dividend increased 5% to $1.68 per share in Nov. 2016 57 Consecutive Years of Dividend Increases Vectren | AGA Financial Forum | May 201730
Slide 31: Proven Track Record of Achieving Targets
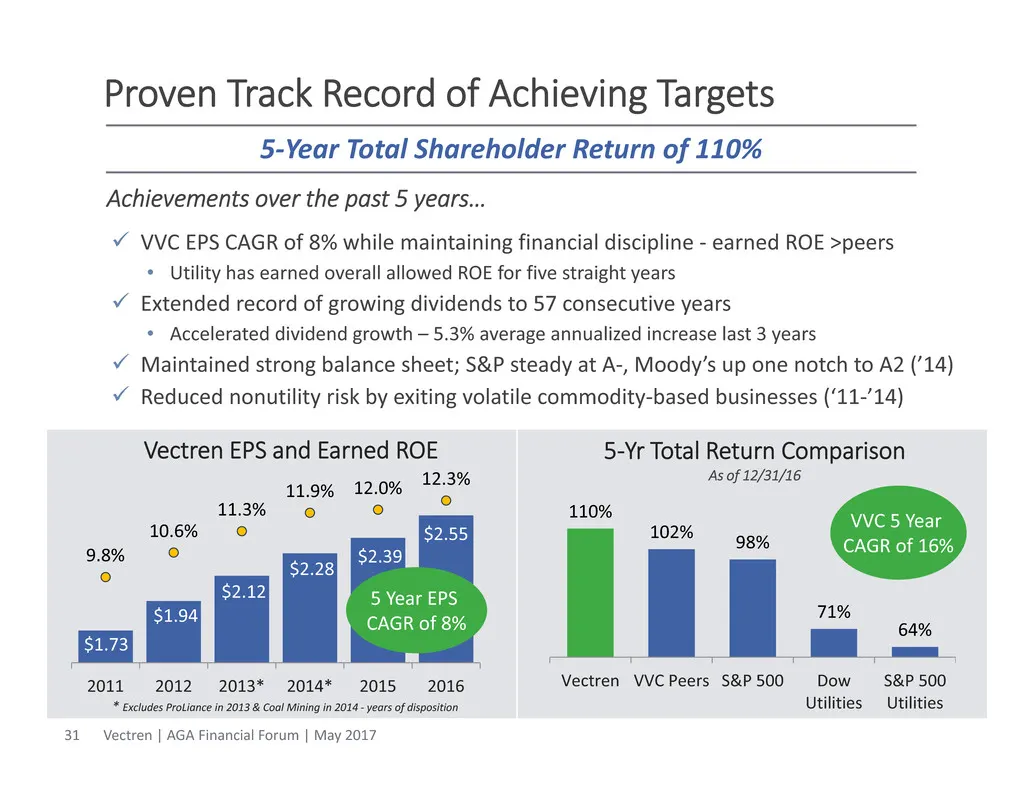
Proven Track Record of Achieving Targets Achievements over the past 5 years… VVC EPS CAGR of 8% while maintaining financial discipline ‐ earned ROE >peers • Utility has earned overall allowed ROE for five straight years Extended record of growing dividends to 57 consecutive years • Accelerated d
Slide 32: Vectren's Long-Term Outlook Improves Again
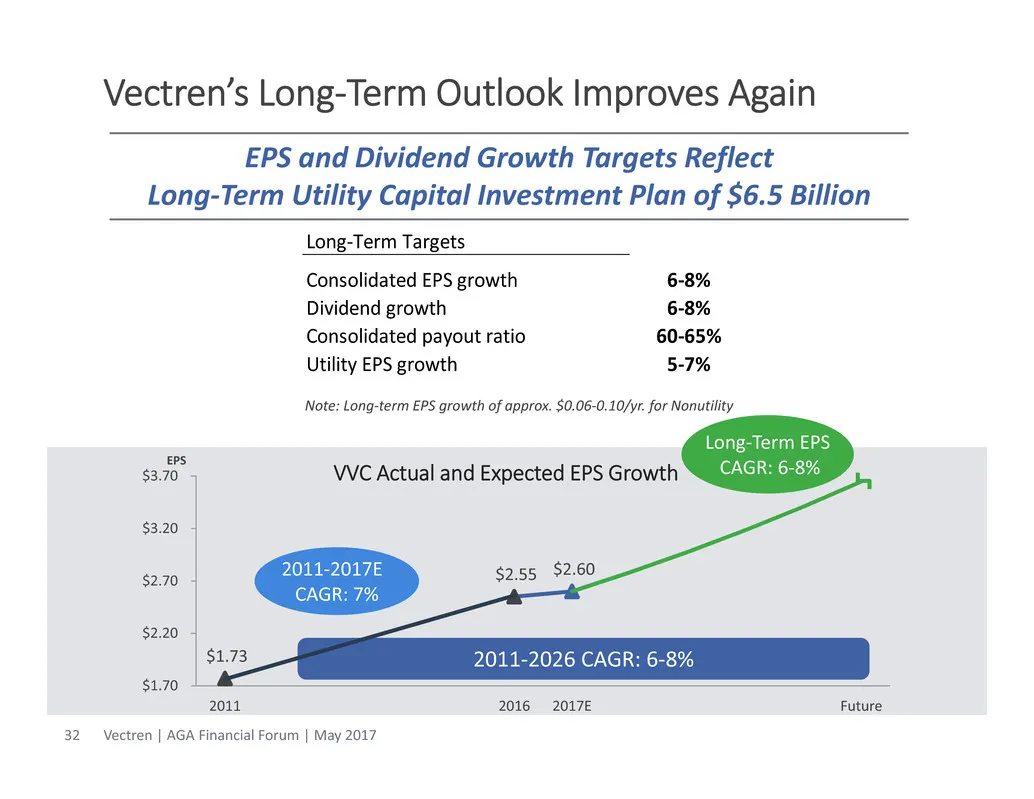
Vectren’s Long‐Term Outlook Improves Again Long‐Term Targets Consolidated EPS growth 6‐8% Dividend growth 6‐8% Consolidated payout ratio 60‐65% Utility EPS growth 5‐7% Note: Long‐term EPS growth of approx. $0.06‐0.10/yr. for Nonutility $1.73 $2.55 $2.60 $1.70 $2.20 $2.70 $3.20 $3.70 2011 2016 2017E
Slide 33: Appendix
Appendix
Slide 34: 2016 Highlights
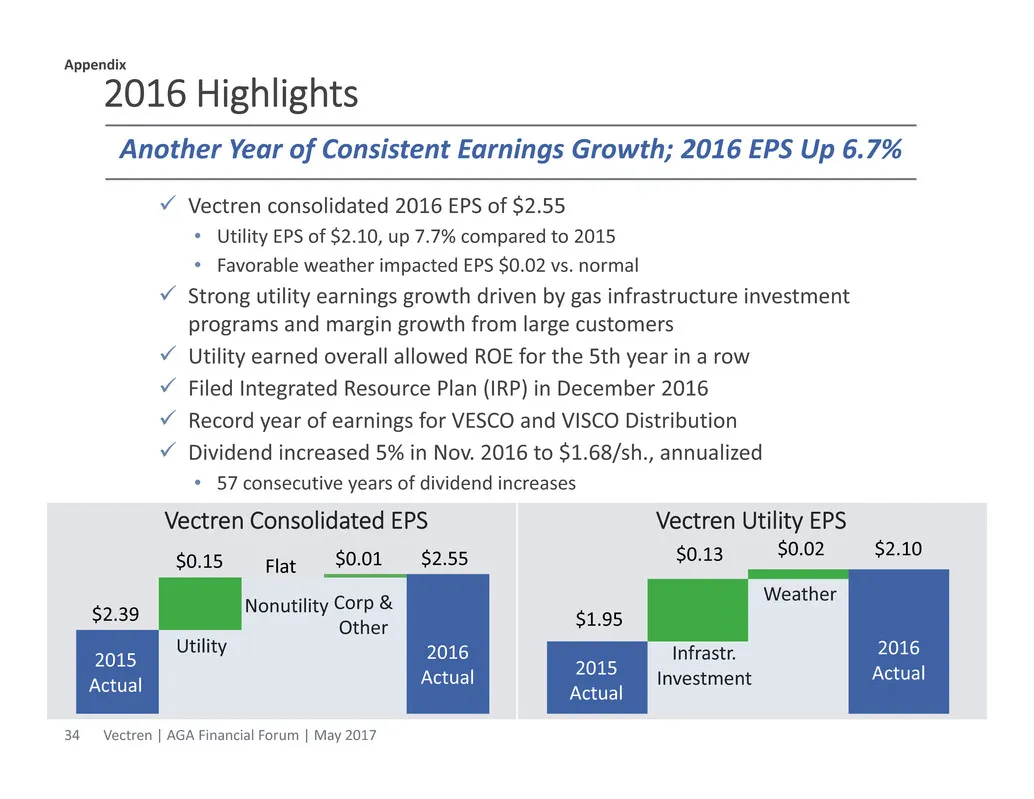
2016 Highlights Vectren consolidated 2016 EPS of $2.55 • Utility EPS of $2.10, up 7.7% compared to 2015 • Favorable weather impacted EPS $0.02 vs. normal Strong utility earnings growth driven by gas infrastructure investment programs and margin growth from large customers Utility earned overal
Slide 35: 2017E Guidance Utility Metrics
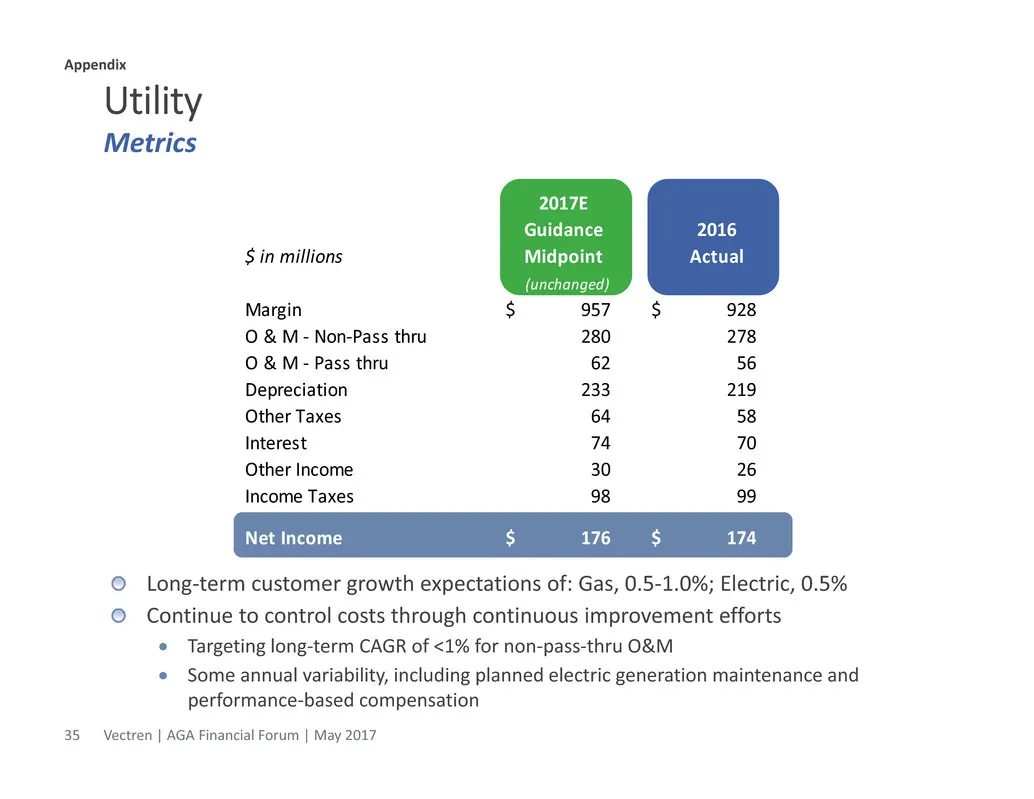
2017E Guidance 2016 $ in millions Midpoint Actual (unchanged) Margin 957$ 928$ O & M ‐ Non‐Pass thru 280 278 O & M ‐ Pass thru 62 56 Depreciation 233 219 Other Taxes 64 58 Interest 74 70 Other Income 30 26 Income Taxes 98 99 Net Income 176$ 174$ Utility Long‐term customer growth expectations of: Gas
Slide 36: Infrastructure Services (VISCO) Metrics
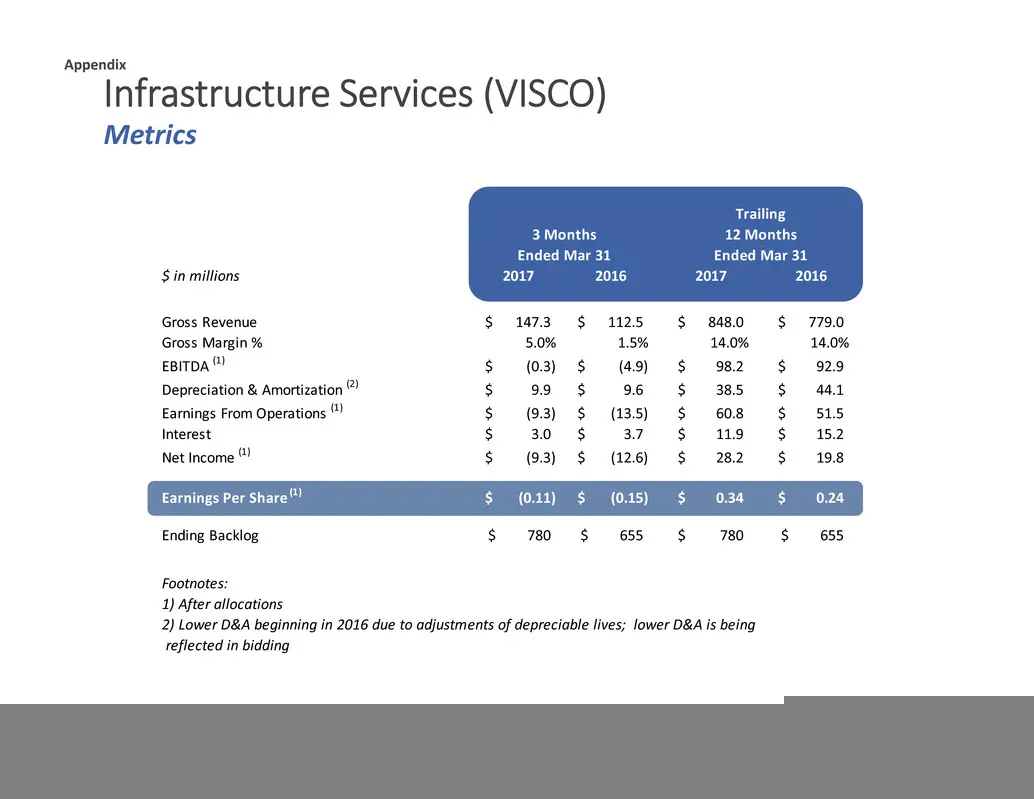
Infrastructure Services (VISCO) Metrics $ in millions 2017 2016 2017 2016 Gross Revenue 147.3$ 112.5$ 848.0$ 779.0$ Gross Margin % 5.0% 1.5% 14.0% 14.0% EBITDA (1) (0.3)$ (4.9)$ 98.2$ 92.9$ Depreciation & Amortization (2) 9.9$ 9.6$ 38.5$ 44.1$ Earnings From Operations (1) (9.3)$ (13.5)$ 60.8$ 51.5$
Slide 37: VISCO Metrics – Five Year Look
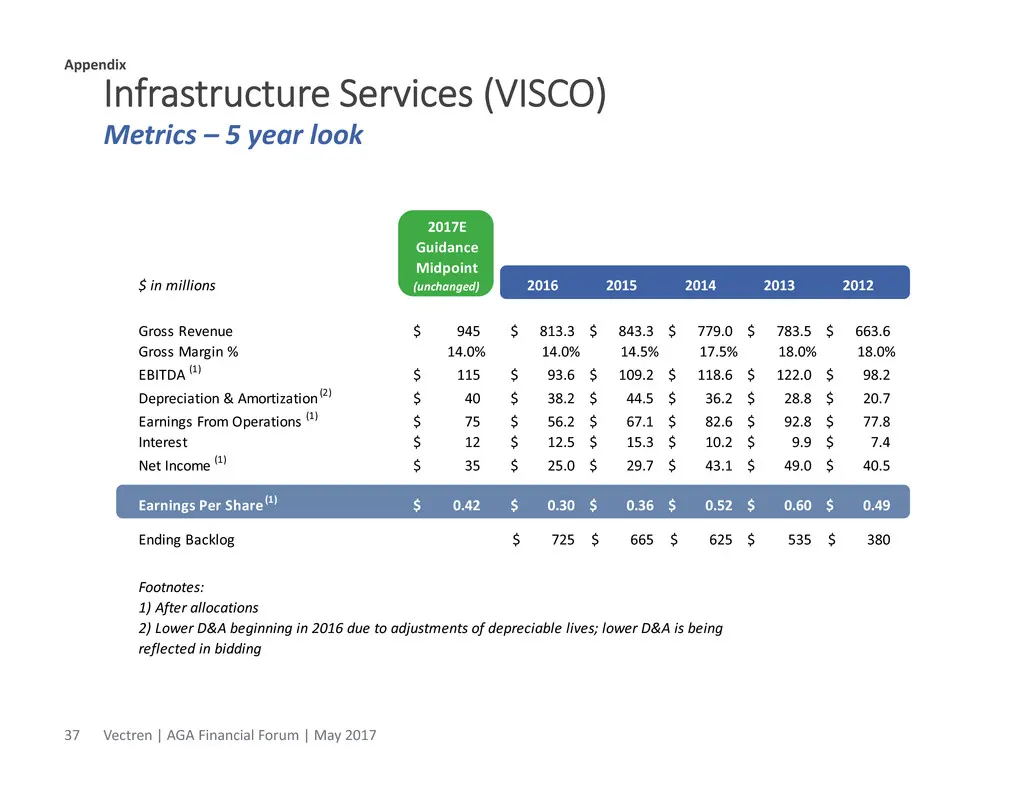
Infrastructure Services (VISCO) Metrics – 5 year look 2017E Guidance Midpoint $ in millions (unchanged) 2016 2015 2014 2013 2012 Gross Revenue 945$ 813.3$ 843.3$ 779.0$ 783.5$ 663.6$ Gross Margin % 14.0% 14.0% 14.5% 17.5% 18.0% 18.0% EBITDA (1) 115$ 93.6$ 109.2$ 118.6$ 122.0$ 98.2$ Depreciation & Am
Slide 38: VISCO Customer Contracts and Backlog
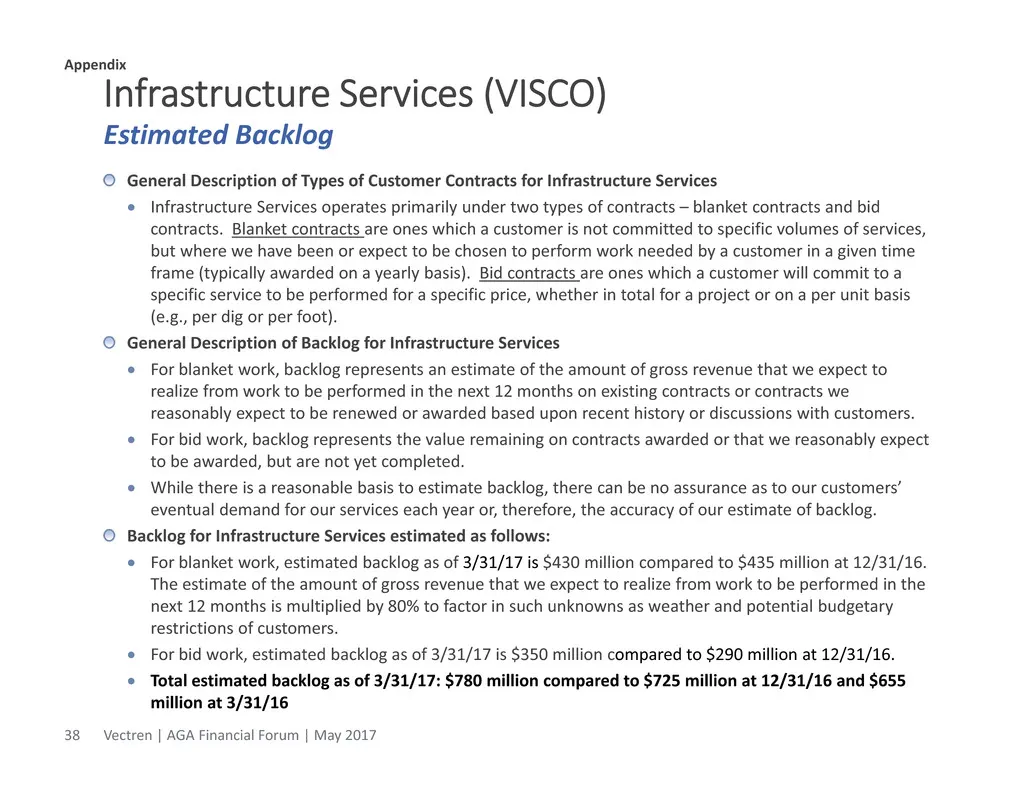
Infrastructure Services (VISCO) General Description of Types of Customer Contracts for Infrastructure Services Infrastructure Services operates primarily under two types of contracts – blanket contracts and bid contracts. Blanket contracts are ones which a customer is not committed to specific vol
Slide 39: VISCO Business Profile
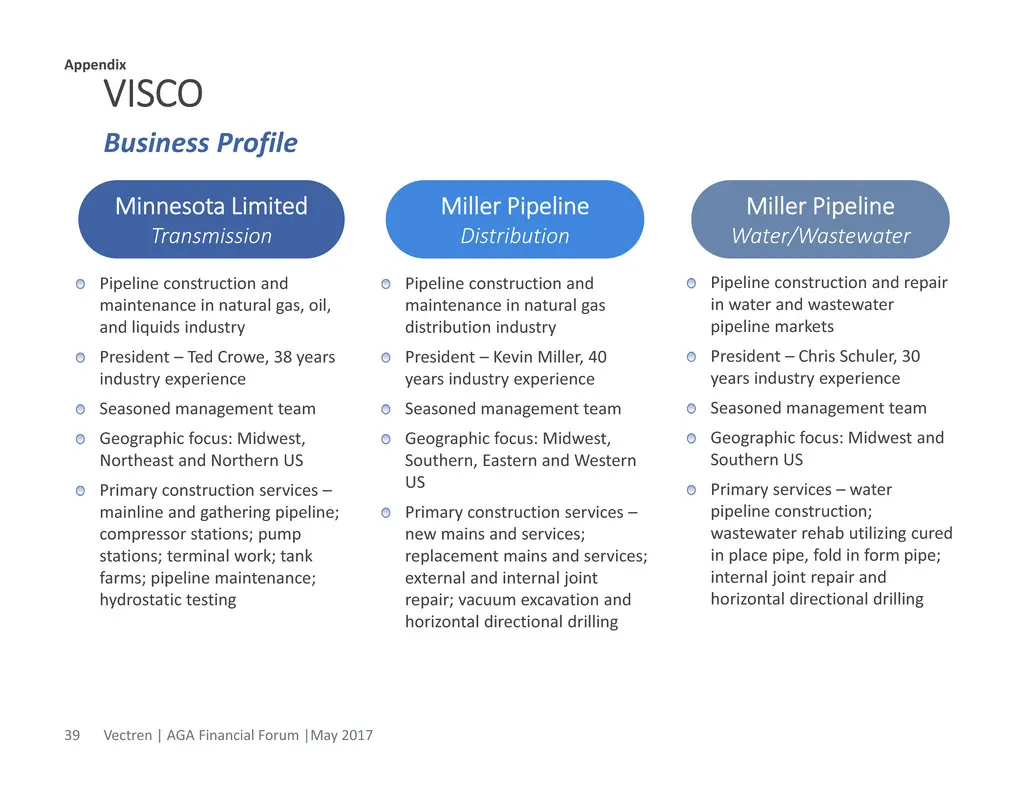
VISCO Pipeline construction and maintenance in natural gas, oil, and liquids industry President – Ted Crowe, 38 years industry experience Seasoned management team Geographic focus: Midwest, Northeast and Northern US Primary construction services – mainline and gathering pipeline; compressor stations
Slide 40: VISCO Distribution Opportunities
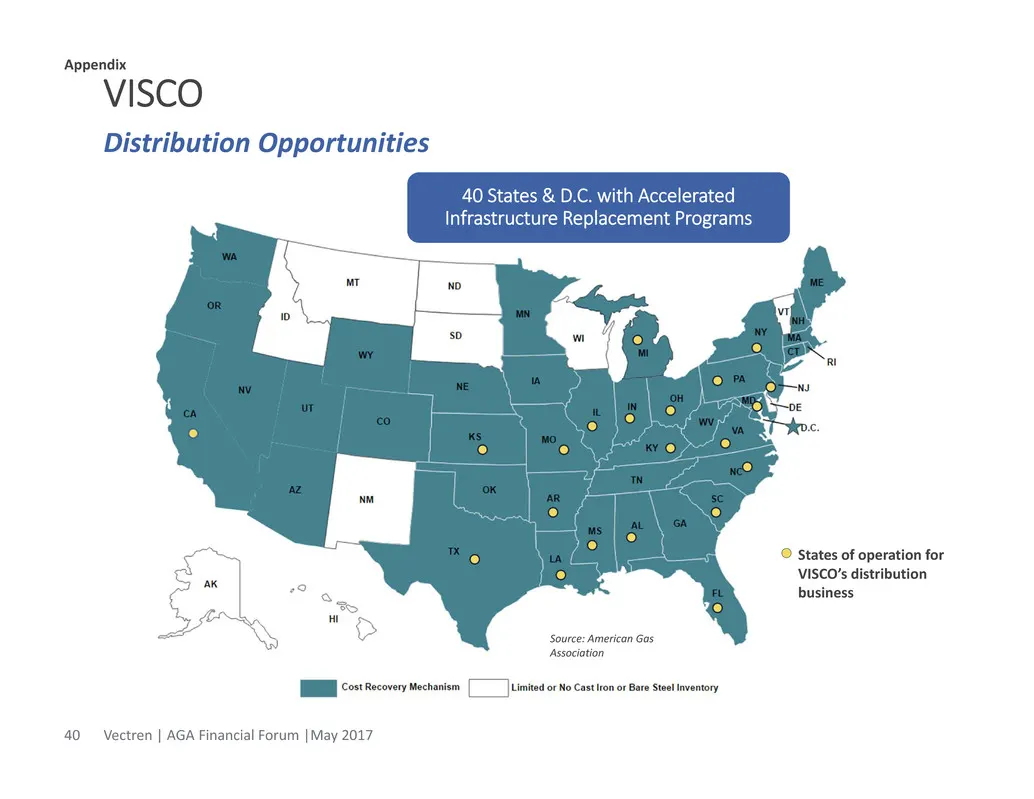
VISCO Vectren | AGA Financial Forum |May 201740 Distribution Opportunities Appendix States of operation for VISCO’s distribution business Source: American Gas Association 40 States & D.C. with Accelerated Infrastructure Replacement Programs
Slide 41: Long-Term Customer Relationships
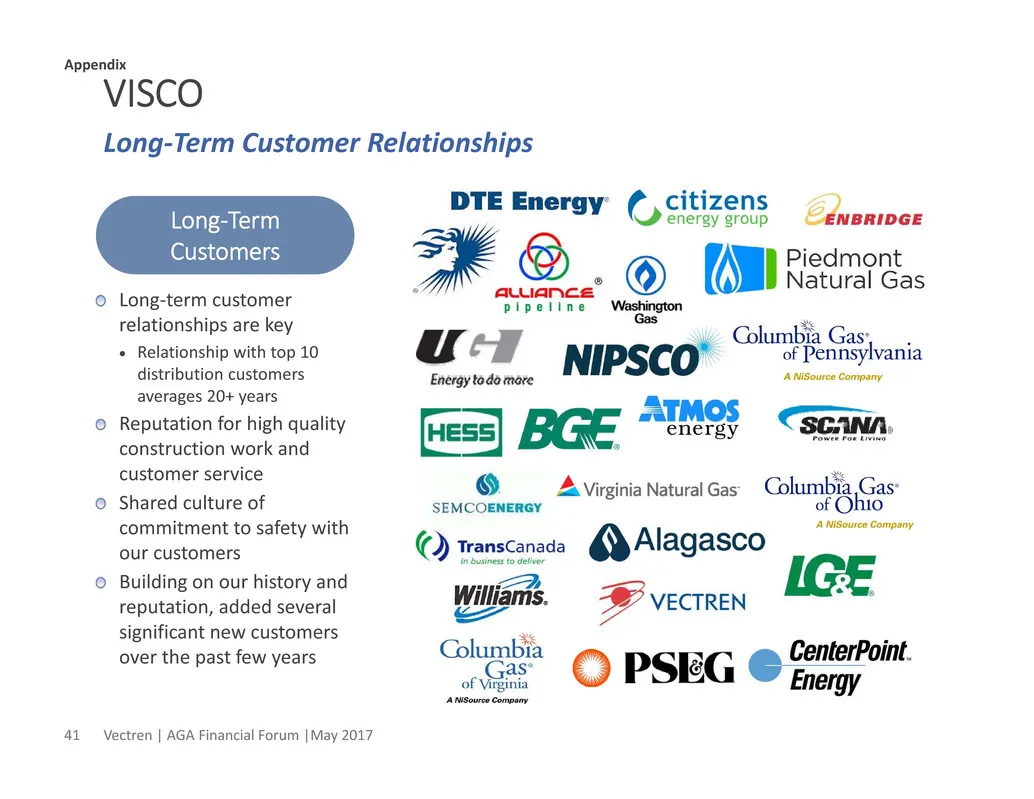
VISCO Vectren | AGA Financial Forum |May 201741 Long‐Term Customer Relationships Long‐Term Customers Long‐term customer relationships are key Relationship with top 10 distribution customers averages 20+ years Reputation for high quality construction work and customer service Shared culture of comm
Slide 42: VISCO Competitive Landscape
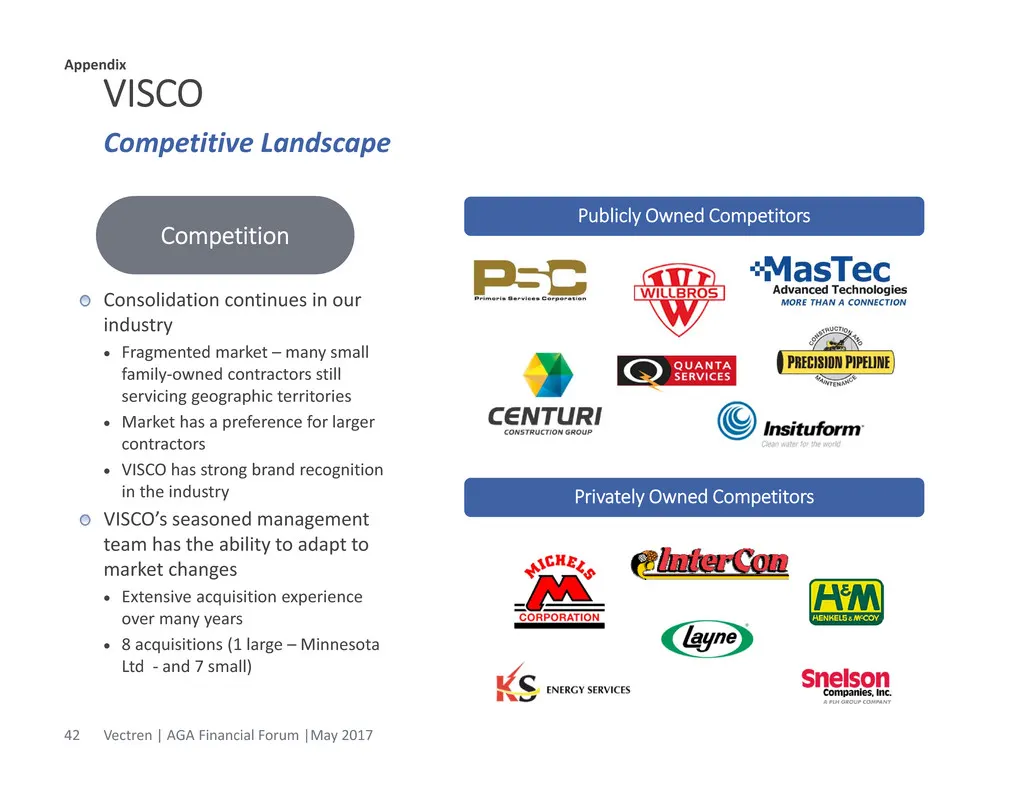
VISCO Vectren | AGA Financial Forum |May 201742 Competitive Landscape Competition Consolidation continues in our industry Fragmented market – many small family‐owned contractors still servicing geographic territories Market has a preference for larger contractors VISCO has strong brand recogni
Slide 43: Energy Services (VESCO) Metrics
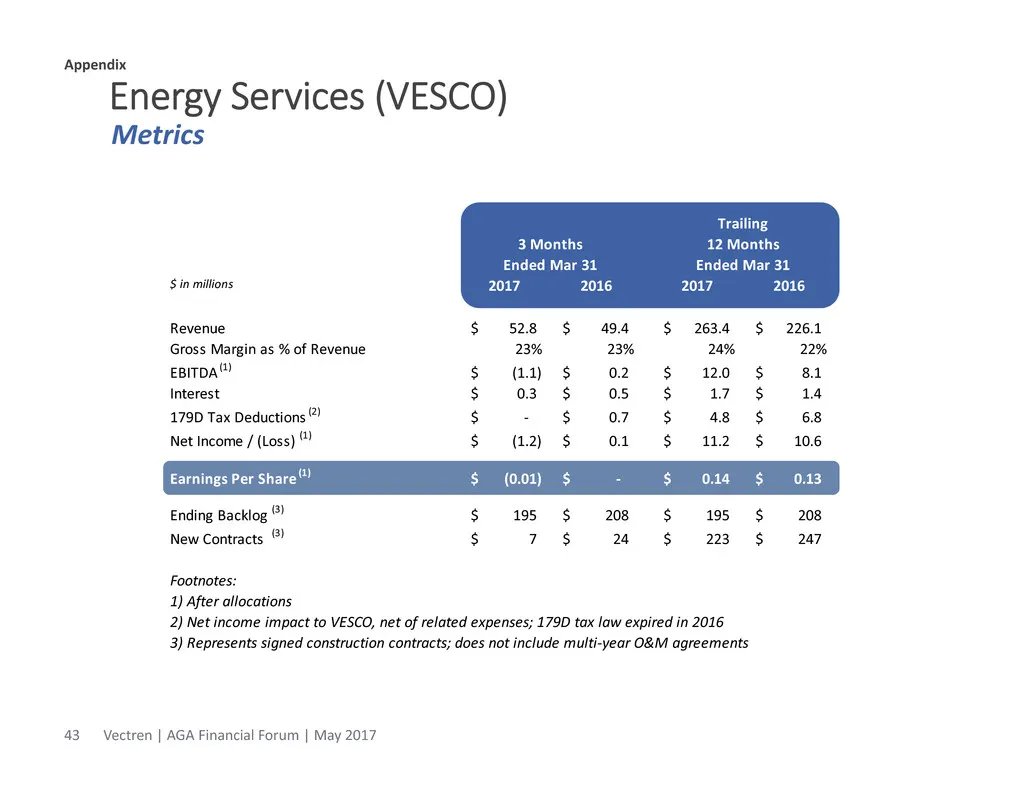
Energy Services (VESCO) Metrics $ in millions 2017 2016 2017 2016 Revenue 52.8$ 49.4$ 263.4$ 226.1$ Gross Margin as % of Revenue 23% 23% 24% 22% EBITDA (1) (1.1)$ 0.2$ 12.0$ 8.1$ Interest 0.3$ 0.5$ 1.7$ 1.4$ 179D Tax Deductions (2) ‐$ 0.7$ 4.8$ 6.8$ Net Income / (Loss) (1) (1.2)$ 0.1$ 11.2$ 10.6$ Ea
Slide 44: VESCO Metrics – Five Year Look
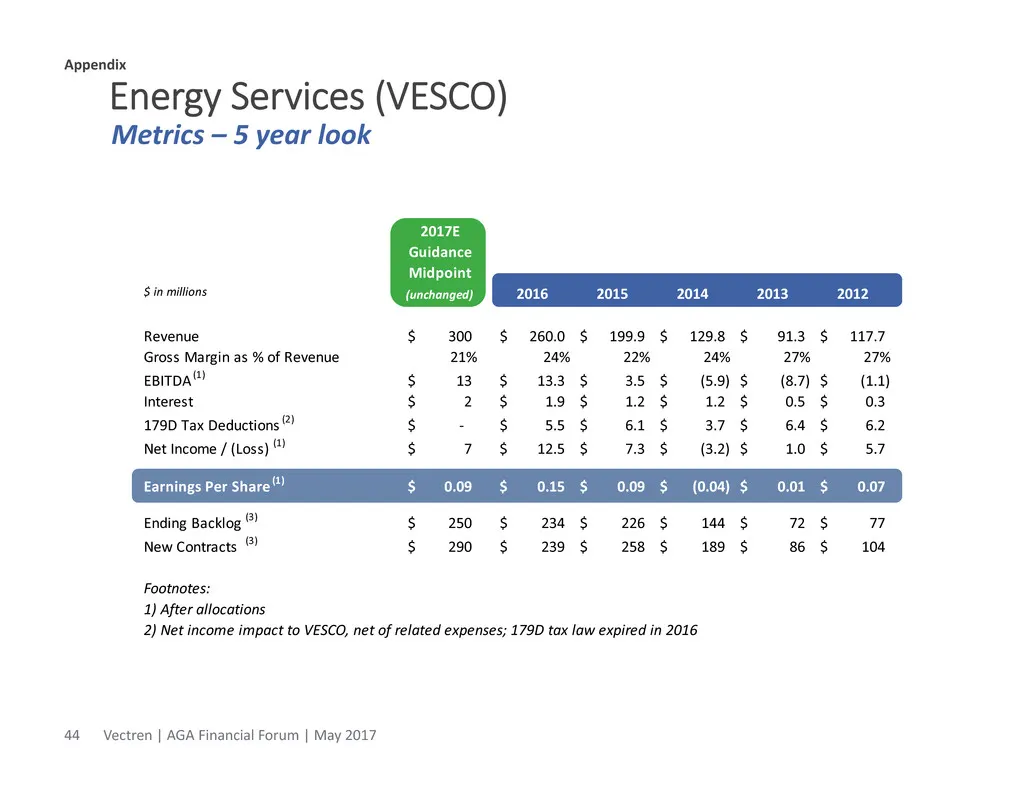
Energy Services (VESCO) Metrics – 5 year look 2017E Guidance Midpoint $ in millions (unchanged) 2016 2015 2014 2013 2012 Revenue 300$ 260.0$ 199.9$ 129.8$ 91.3$ 117.7$ Gross Margin as % of Revenue 21% 24% 22% 24% 27% 27% EBITDA (1) 13$ 13.3$ 3.5$ (5.9)$ (8.7)$ (1.1)$ Interest 2$ 1.9$ 1.2$ 1.2$ 0.5$
Slide 45: VESCO Business Profile
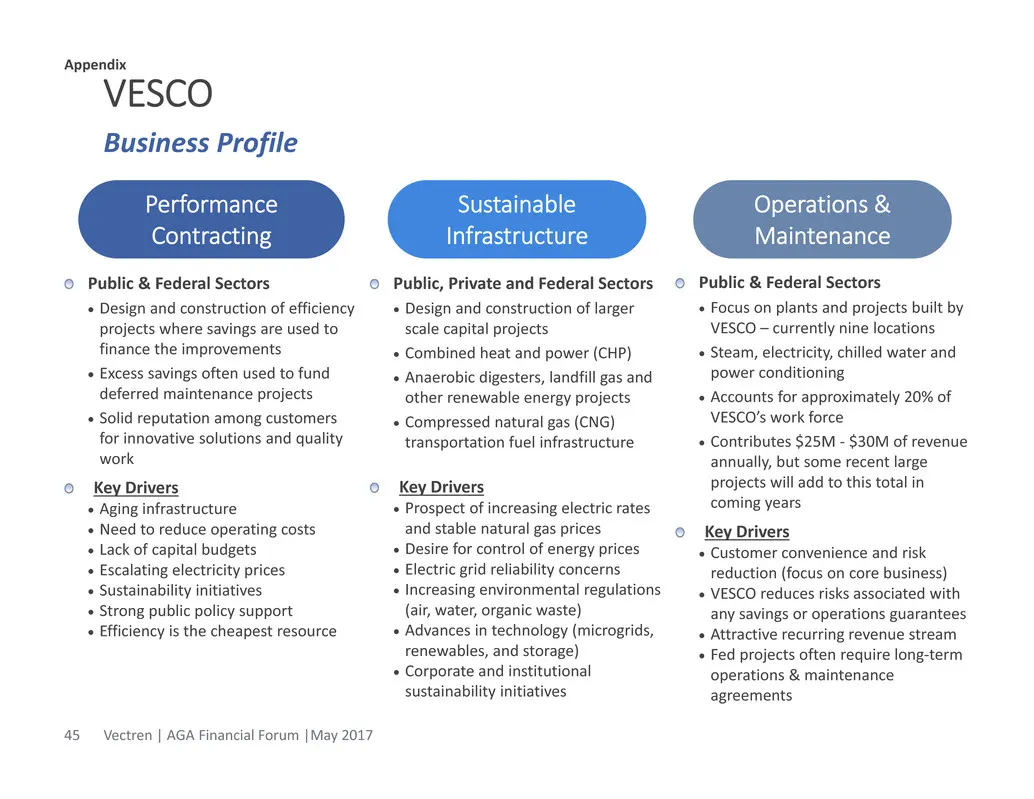
VESCO Public & Federal Sectors Design and construction of efficiency projects where savings are used to finance the improvements Excess savings often used to fund deferred maintenance projects Solid reputation among customers for innovative solutions and quality work Key Drivers Aging infras
Slide 46: VESCO At A Glance
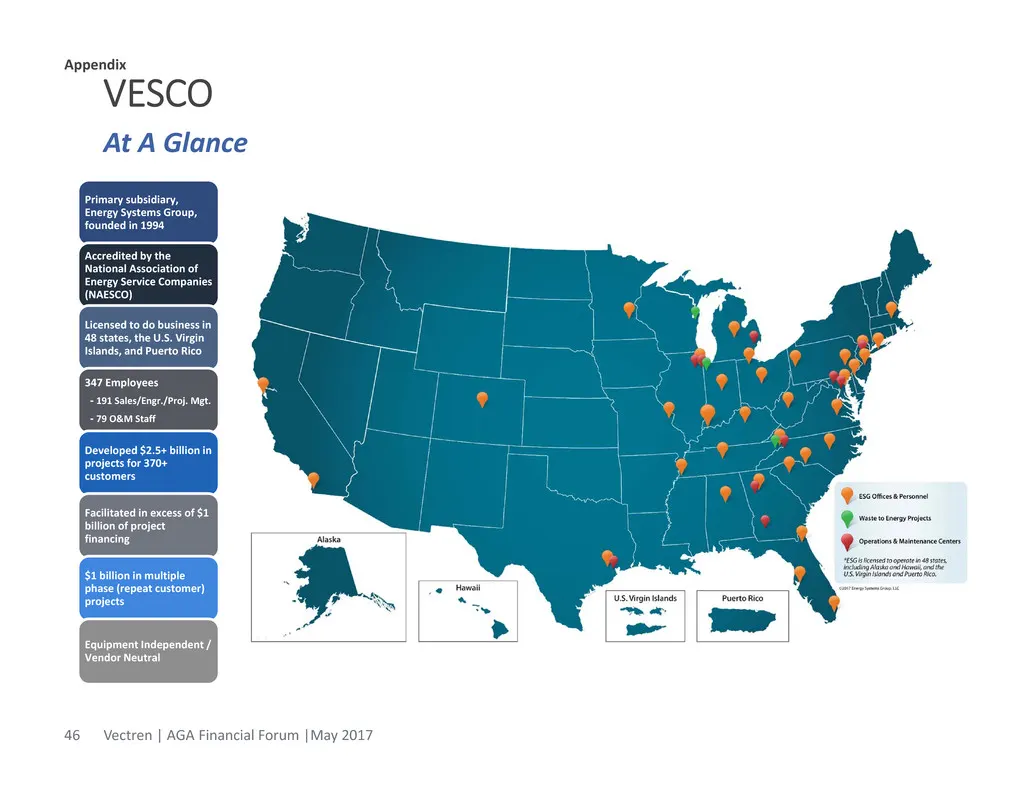
VESCO Vectren | AGA Financial Forum |May 201746 At A Glance Primary subsidiary, Energy Systems Group, founded in 1994 Accredited by the National Association of Energy Service Companies (NAESCO) Licensed to do business in 48 states, the U.S. Virgin Islands, and Puerto Rico 347 Employees ‐ 191 Sales/E
Slide 47: Market Sectors and Customers
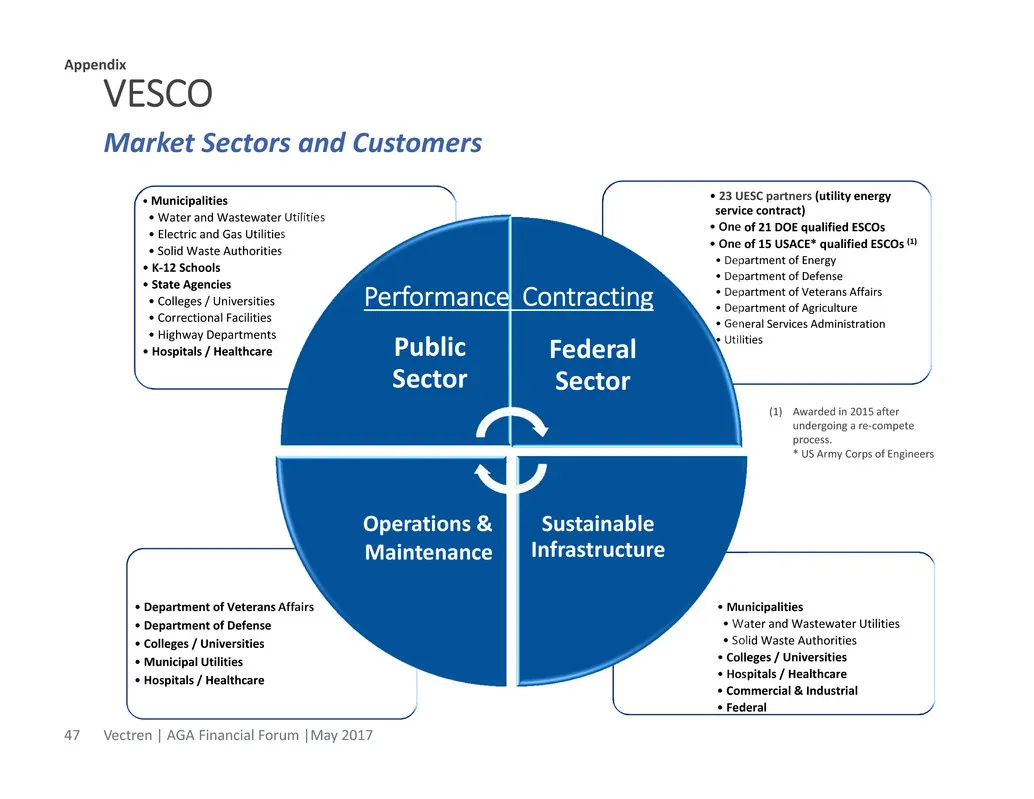
VESCO Vectren | AGA Financial Forum |May 201747 Market Sectors and Customers Appendix • Municipalities • Water and Wastewater Utilities • Solid Waste Authorities • Colleges / Universities • Hospitals / Healthcare • Commercial & Industrial • Federal • Department of Veterans Affairs • Department of De
Slide 48: VESCO Competitive Landscape
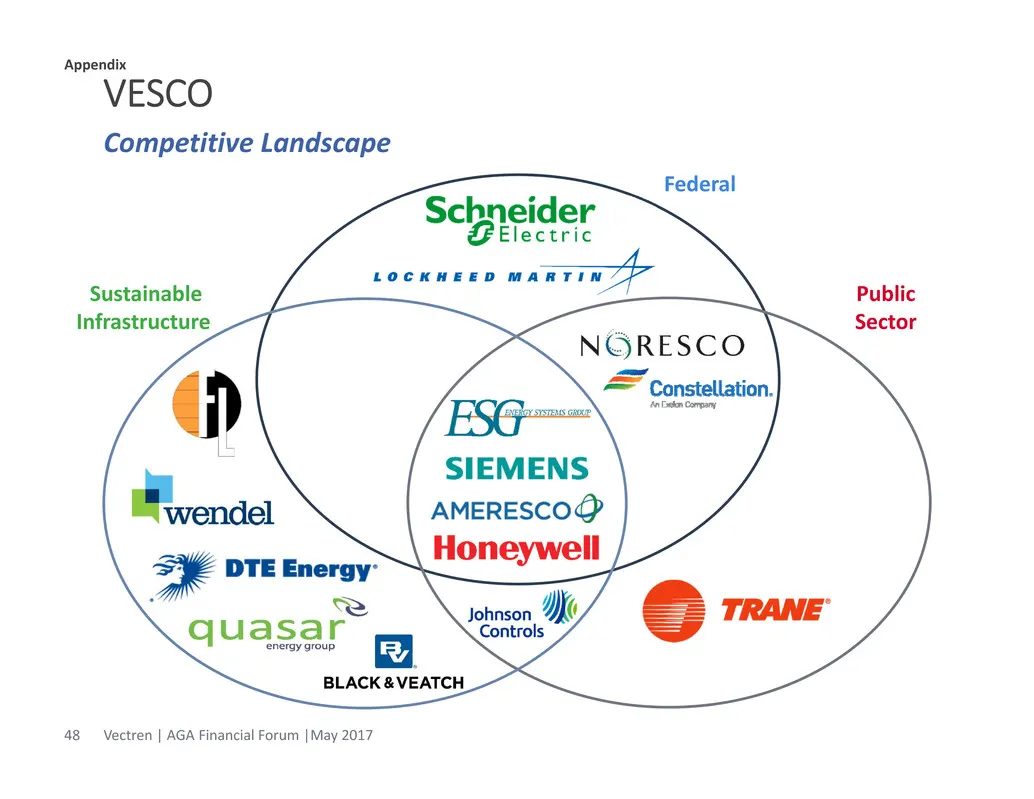
VESCO Vectren | AGA Financial Forum |May 201748 Competitive Landscape Sustainable Infrastructure Federal Public Sector Appendix
Slide 49: Key VESCO Projects
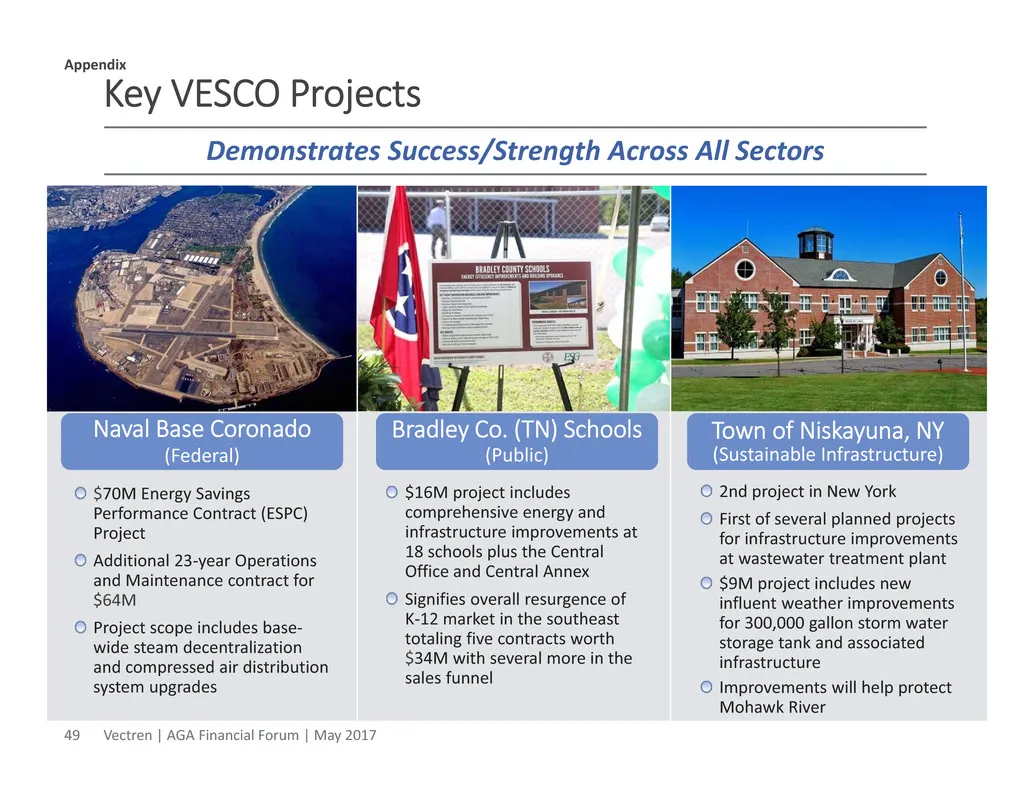
Key VESCO Projects $16M project includes comprehensive energy and infrastructure improvements at 18 schools plus the Central Office and Central Annex Signifies overall resurgence of K‐12 market in the southeast totaling five contracts worth $34M with several more in the sales funnel $70M Energy Savi
Slide 50: State Utility Commissioners
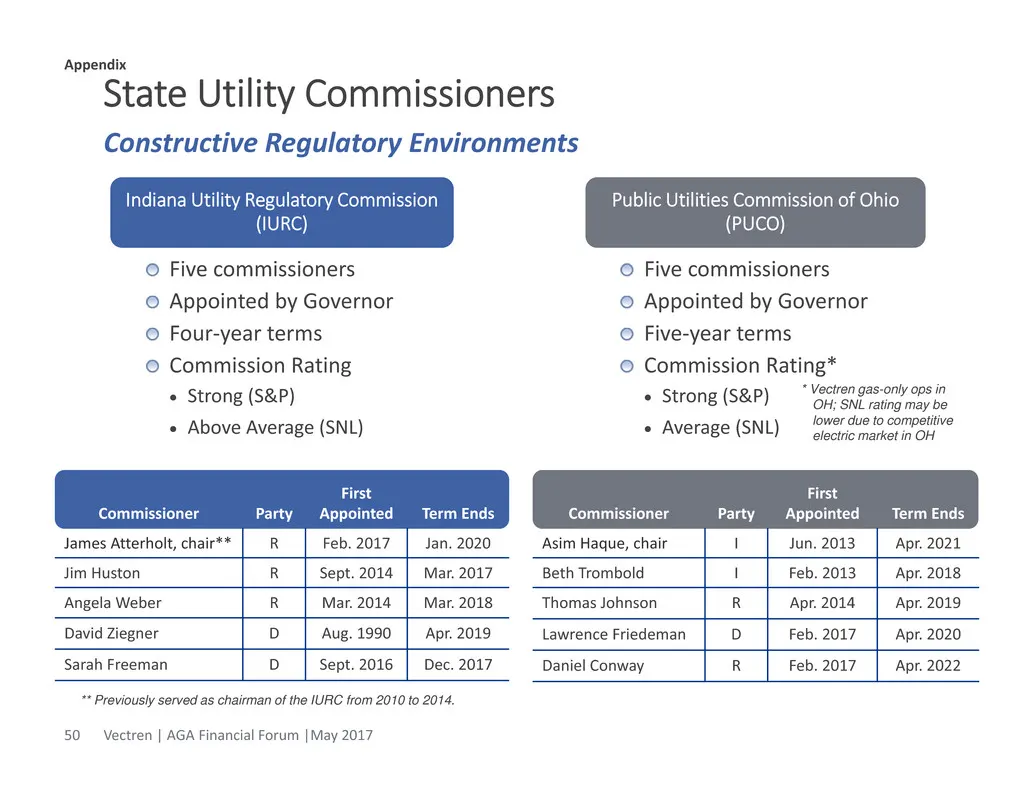
State Utility Commissioners Vectren | AGA Financial Forum |May 201750 Constructive Regulatory Environments Appendix Indiana Utility Regulatory Commission (IURC) Public Utilities Commission of Ohio (PUCO) Five commissioners Appointed by Governor Four‐year terms Commission Rating Strong (S&P) Abov
Slide 51: Environmental & Sustainability
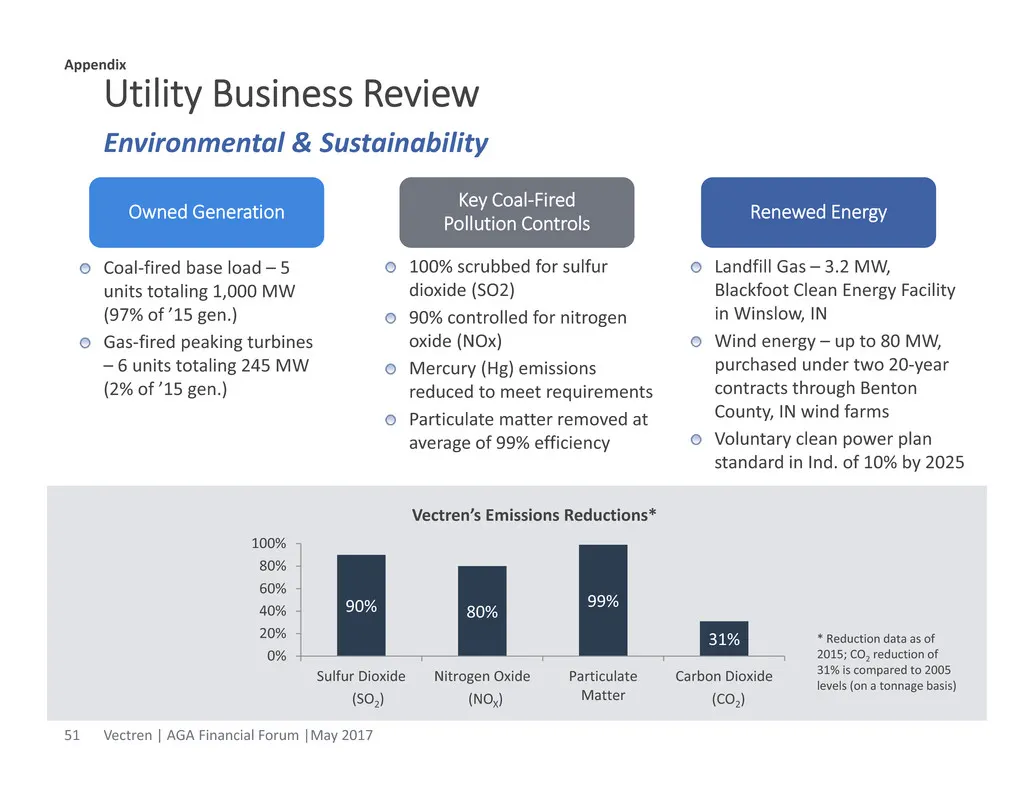
Utility Business Review Vectren | AGA Financial Forum |May 201751 Environmental & Sustainability Appendix Renewed Energy Key Coal‐Fired Pollution Controls Landfill Gas – 3.2 MW, Blackfoot Clean Energy Facility in Winslow, IN Wind energy – up to 80 MW, purchased under two 20‐year contracts through Be
Slide 52: Coal-Fired Generation Current Portfolio
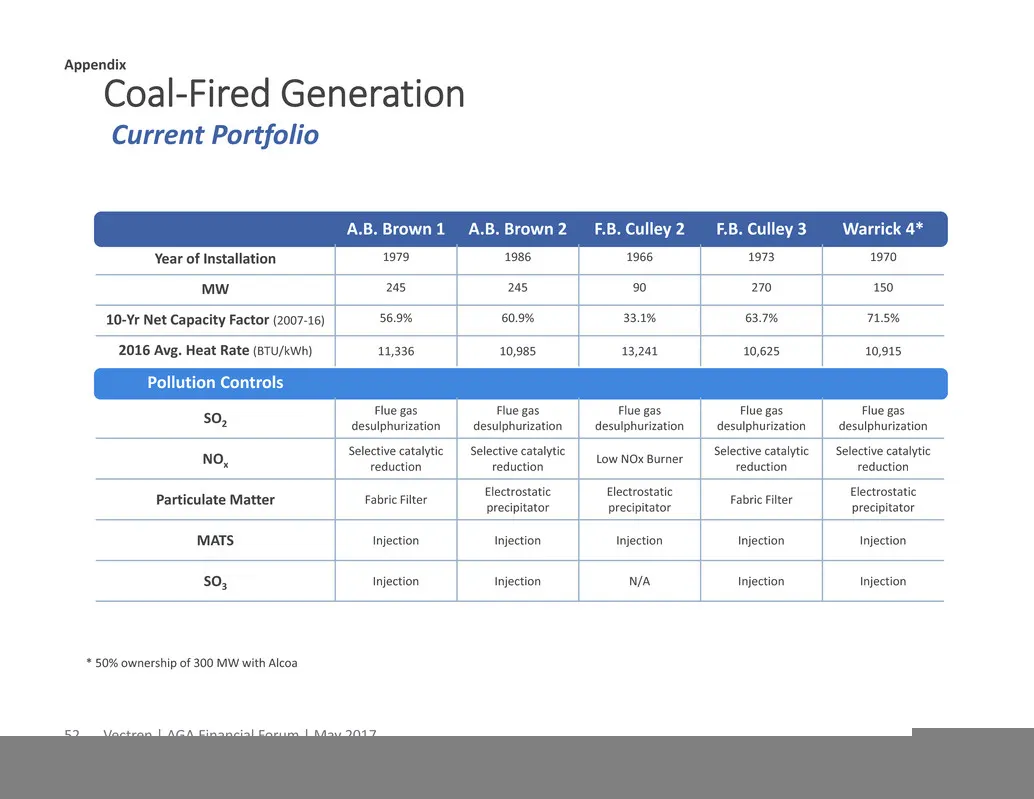
A.B. Brown 1 A.B. Brown 2 F.B. Culley 2 F.B. Culley 3 Warrick 4* Year of Installation 1979 1986 1966 1973 1970 MW 245 245 90 270 150 10‐Yr Net Capacity Factor (2007‐16) 56.9% 60.9% 33.1% 63.7% 71.5% 2016 Avg. Heat Rate (BTU/kWh) 11,336 10,985 13,241 10,625 10,915 Pollution Controls SO2 Flue gas desu
Slide 53: Integrated Resource Plan Preferred Portfolio Overview
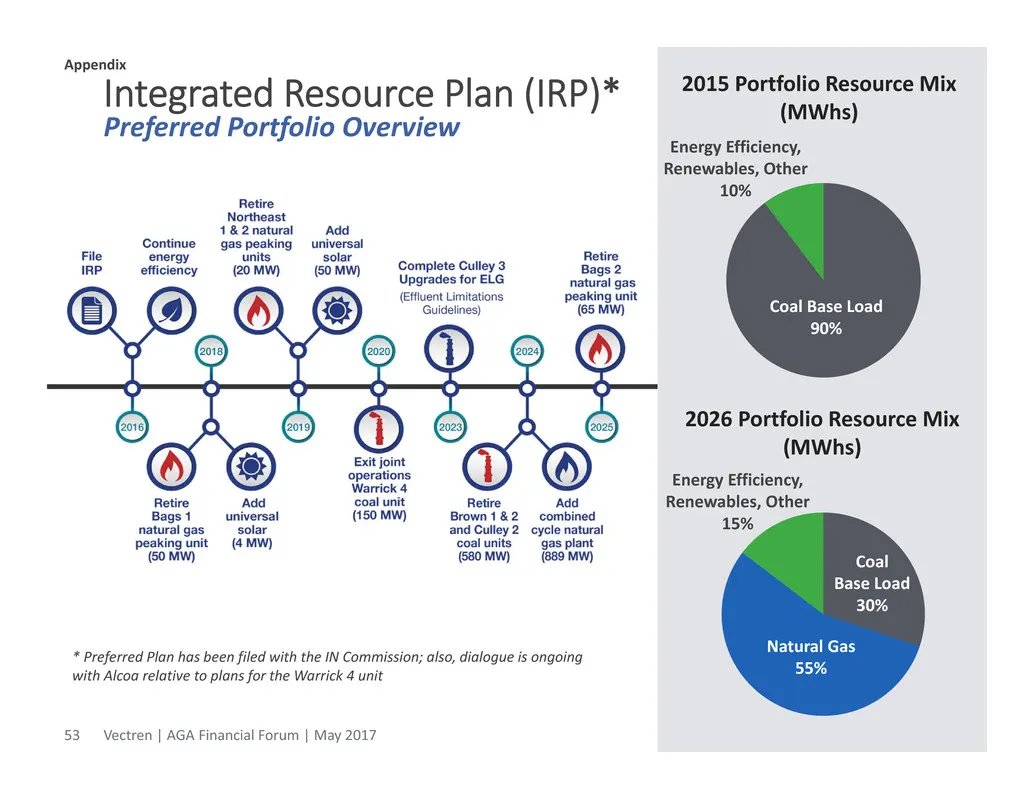
Integrated Resource Plan (IRP)* Preferred Portfolio Overview * Preferred Plan has been filed with the IN Commission; also, dialogue is ongoing with Alcoa relative to plans for the Warrick 4 unit 2015 Portfolio Resource Mix (MWhs) Energy Efficiency, Renewables, Other 10% Coal Base Load 90% 2026 Portf
Slide 54: Use of Non-GAAP Performance Measures and Per Share Measures
Use of Non‐GAAP Performance Measures and Per Share Measures Contribution to Vectren's Basic EPS Per share earnings contributions of the Utility Group, Nonutility Group, and Corporate and Other are presented and are non‐GAAP measures. Such per share amounts are based on the earnings contribution of e
Source: SEC EDGAR · 8-K filed May 19, 2017
More decks from Vectren Corporation
 Edison Electric Institute Financial Conference 201833 slides · Nov 9, 2018
 Q2 2018 Earnings Presentation31 slides · Aug 3, 2018
 Merger or Acquisition (June 2018)18 slides · Jun 12, 2018
 American Gas Association Financial Forum 201855 slides · May 18, 2018
 Q1 2018 Earnings Presentation27 slides · May 4, 2018
 FY2017 Earnings Presentation43 slides · Feb 27, 2018