Southern Community Financial Corp
Southern Community Financial — Conference Presentation (February 2009)
26 slides from Southern Community Financial's conference presentation, Feb 6, 2009

Slide 1: Investor Conference
Investor Conference Capua, Sars. | penmunity Peed
Slide 2: Forward-looking statements
This presentation may contain, in addition to historical information, various “forward-looking statements” that represent our judgment concerning the future and are subject to risks and uncertainties that could cause Southern Community's actual operating results and financial position to differ mate

Slide 3: Corporate Profile
Corporate Profile
Slide 4: Commercial bank chartered 1996, headquartered in Winston-Salem
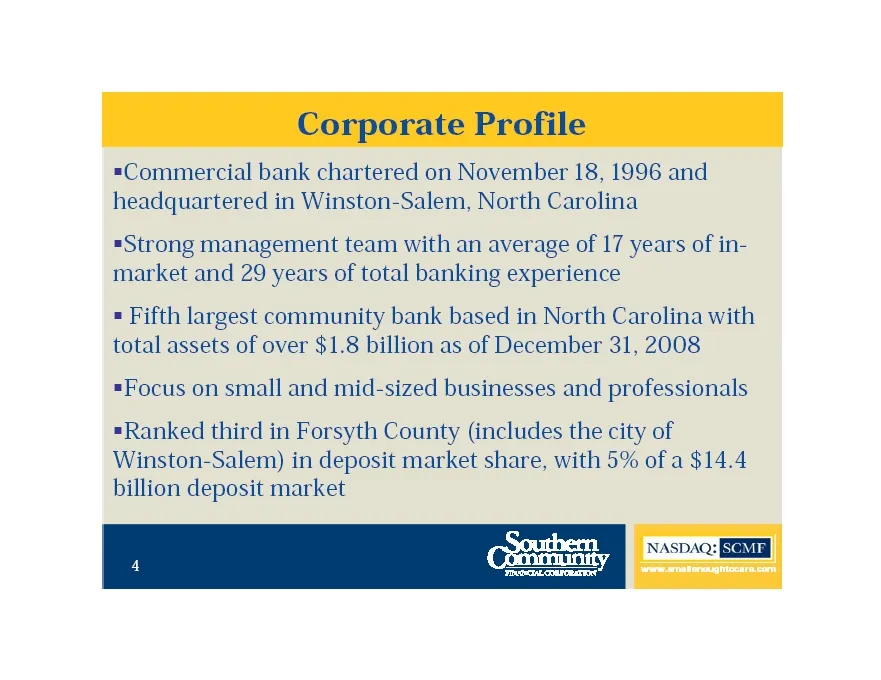
=Commercial bank chartered on November 18, 1996 and headquartered in Winston-Salem, North Carolina =Strong management team with an average of 17 years of in- market and 29 years of total banking experience = Fifth largest community bank based in North Carolina with total assets of over $1.8 billion
Slide 5: Operating in High Growth Markets
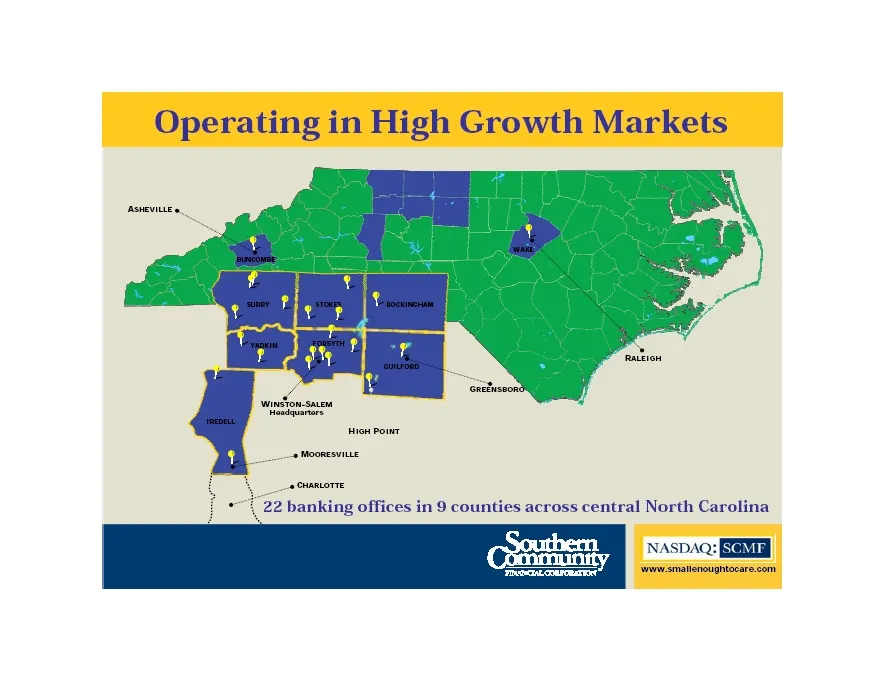
Operating in High Growth Markets 22 banking offices in 9 counties across central North Carolina NASDAQ: ‘ra smallenoushtocare.com
Slide 6: Market demographics by county
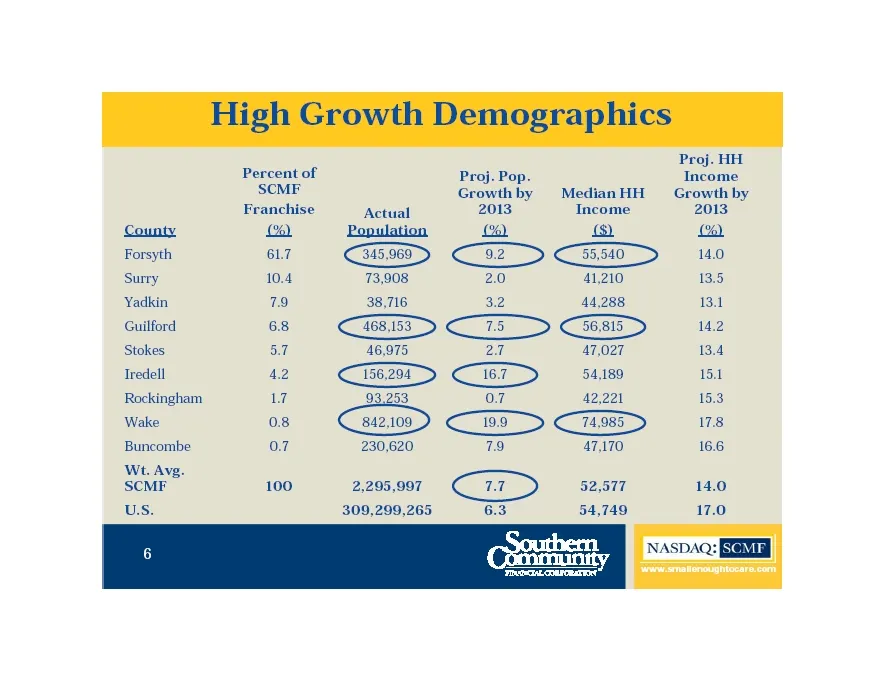
County Forsyth Surry Yadkin Guilford Stokes Iredell, Rockingham Wake Buncombe 6 Proj. HH Percent of Proj. Pop. Income SCMF Growthby MedianHH — Growth by Franchise ‘Actual 2013 Income 2013 oy Population peal a a) 10.4 73,908 20 41,210 13.5 19 at 116 —s 288 13.1 51 a Se 027 134 42 86.290 = 54,189 15.1
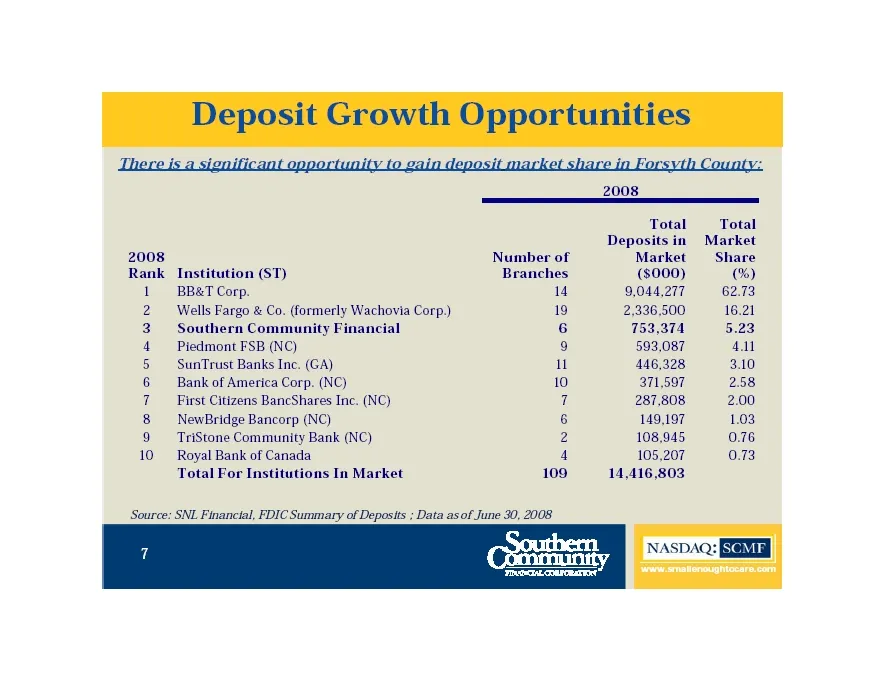
Slide 7: Forsyth County deposit market share ranking
2008, Total Total Deposits in Market 2008 Number of Market — Share Rank Institution (ST) Branches ($000) (%) 1 BB&T Corp. 14 9,044,277 62.73 2 Wells Fargo & Co. (formerly Wachovia Corp.) 19 2,336,500 16.21 3 Southern Community Financial 6 753,374 5.23 4 Piedmont FSB (NC) 9 593,087 41 5 SunTrust Bank

Slide 8: Growth Strategies & Outlook
Growth Strategies & Outlook
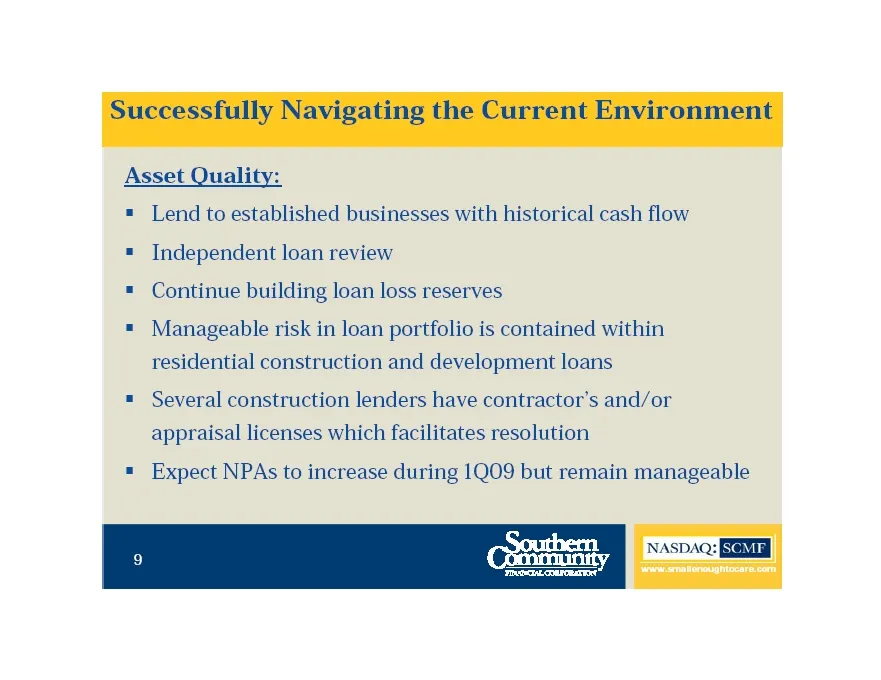
Slide 9: Asset Quality
Asset Quality: = Lend to established businesses with historical cash flow = Independent loan review = Continue building loan loss reserves = Manageable risk in loan portfolio is contained within residential construction and development loans = Several construction lenders have contractor's and/or ap
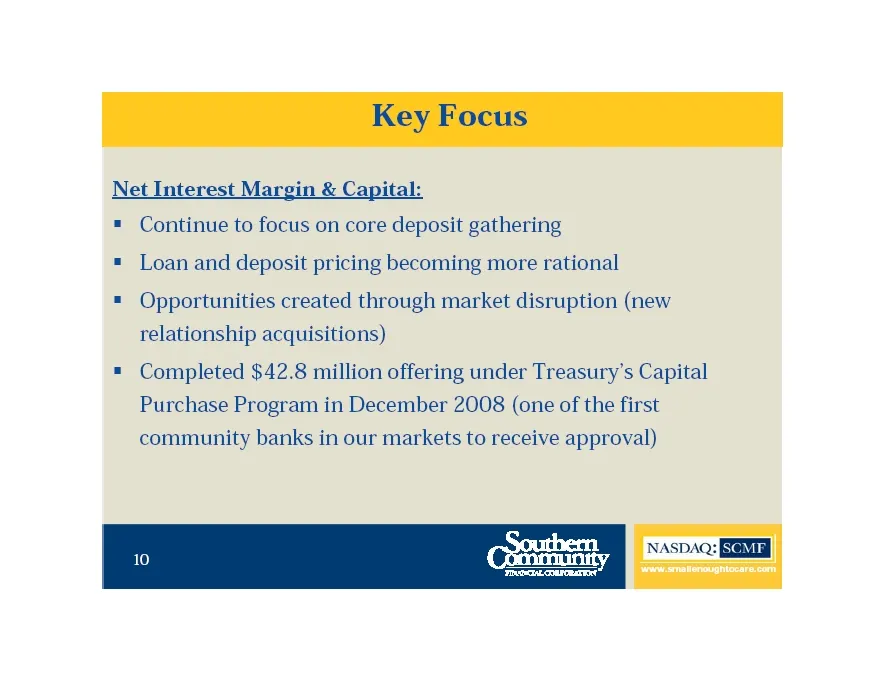
Slide 10: Net Interest Margin & Capital
Net Interest Margin & Capital: = Continue to focus on core deposit gathering = Loan and deposit pricing becoming more rational = Opportunities created through market disruption (new relationship acquisitions) = Completed $42.8 million offering under Treasury's Capital Purchase Program in December 20
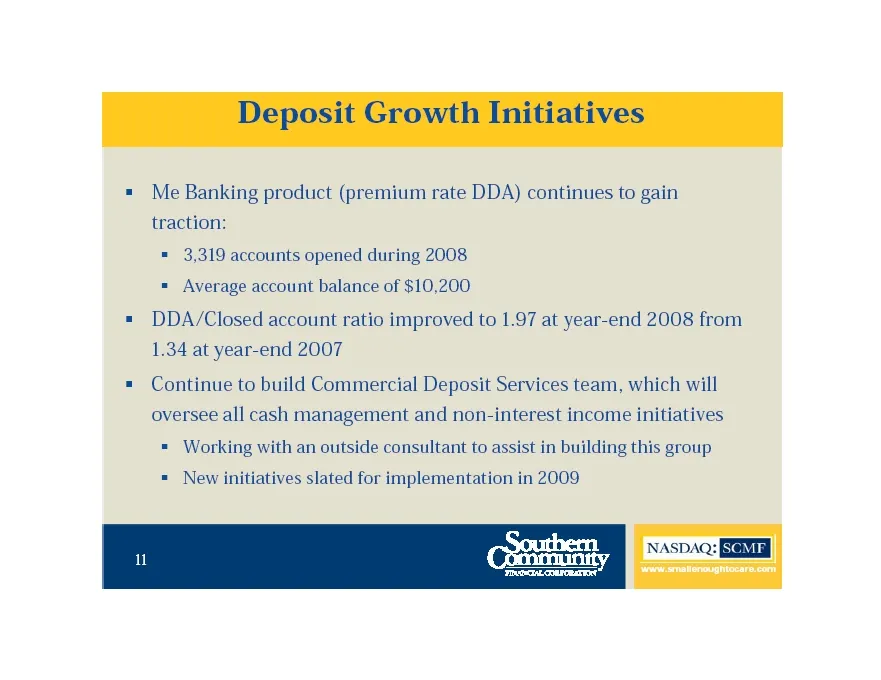
Slide 11: Me Banking product and commercial deposit services
Me Banking product (premium rate DDA) continues to gain traction: = 3,319 accounts opened during 2008 = Average account balance of $10,200. DDA/Closed account ratio improved to 1.97 at year-end 2008 from 1.34 at year-end 2007 Continue to build Commercial Deposit Services team, which will oversee all
Slide 12: Build out existing markets and enhance profitability
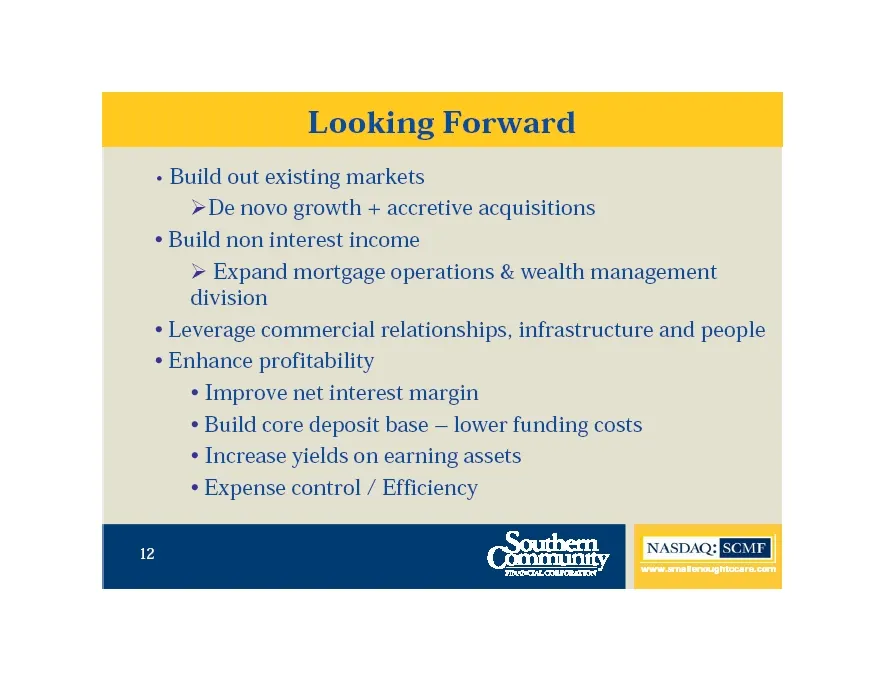
+ Build out existing markets > De novo growth + accretive acquisitions + Build non interest income > Expand mortgage operations & wealth management division ¢ Leverage commercial relationships, infrastructure and people ¢ Enhance profitability ¢ Improve net interest margin ¢ Build core deposit base

Slide 13: Financials
Financials
Slide 14: Five-Year CAGR vs peers
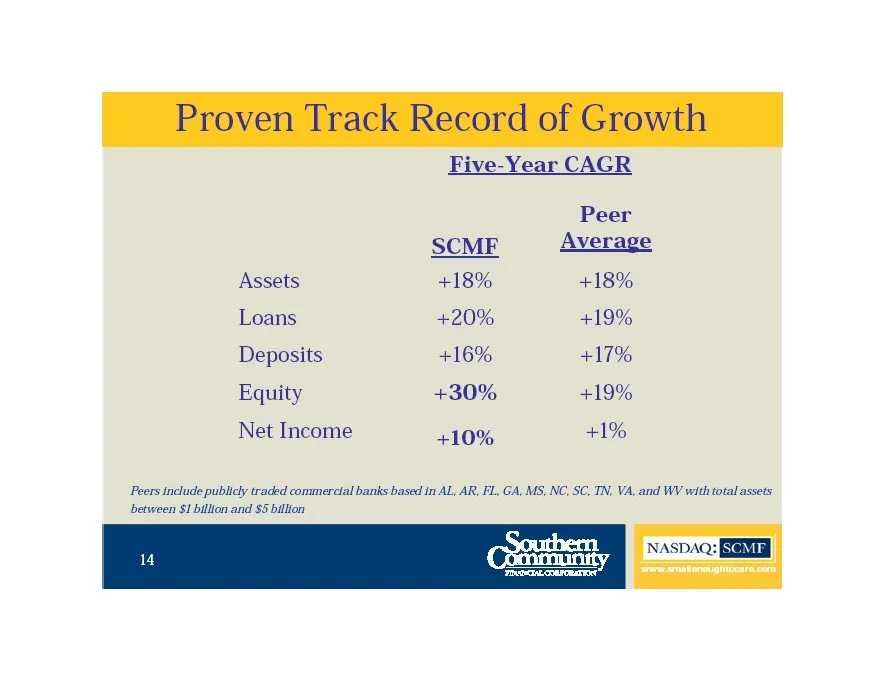
Five-Year CAGR Peer SCME Average Assets +18% +18% Loans +20% +19% Deposits +16% +17% Equity +30% +19% Net Income +10% +1% Peers include publidly traded commercial banks based in AL, AR, FL, GA, MS, NC, SC, TN, VA, and WV with total assets between $1 billion and $5 billion 14
Slide 15: 2008 results highlights
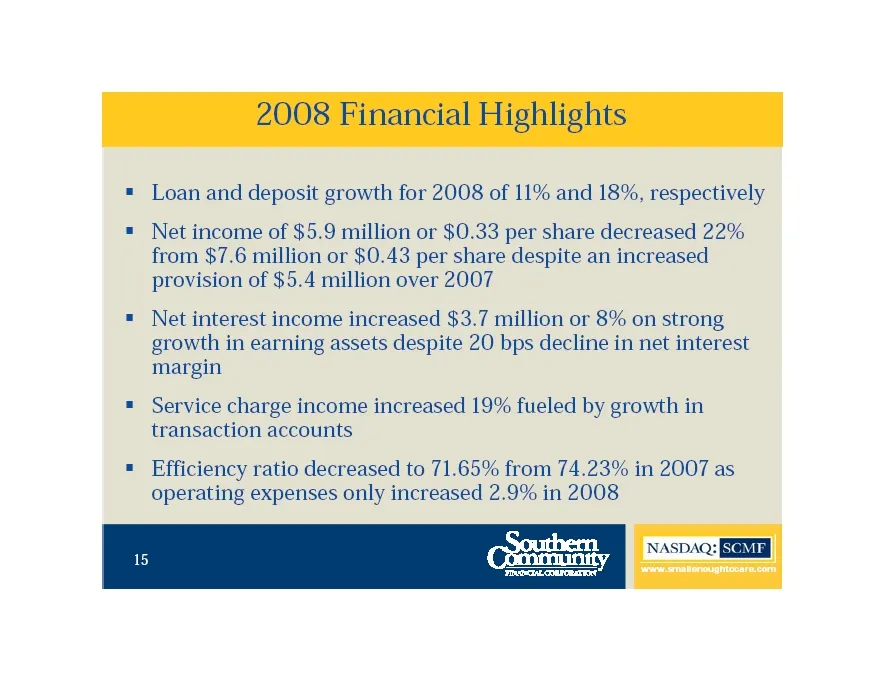
Loan and deposit growth for 2008 of 11% and 18%, respectively Net income of $5.9 million or $0.33 per share decreased 22% from $7.6 million or $0.43 per share despite an increased provision of $5.4 million over 2007 Net interest income increased $3.7 million or 8% on strong growth in earning assets
Slide 16: Fourth quarter results highlights
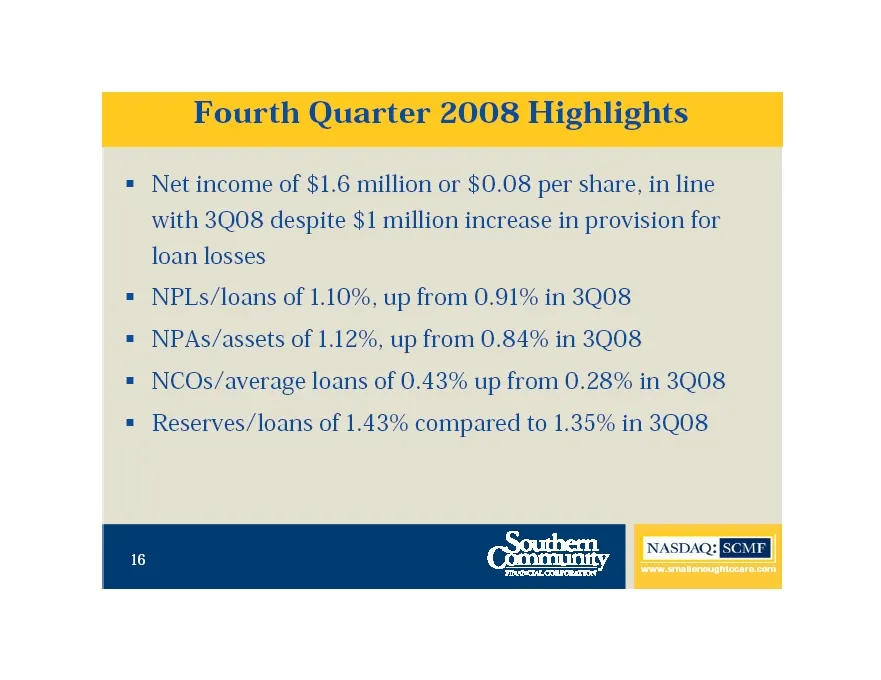
16 Net income of $1.6 million or $0.08 per share, in line with 3Q08 despite $1 million increase in provision for loan losses NPLs/loans of 1.10%, up from 0.91% in 3Q08 NPAs/assets of 1.12%, up from 0.84% in 3Q08 NCOs/average loans of 0.43% up from 0.28% in 3Q08 Reserves/loans of 1.43% compared to 1.
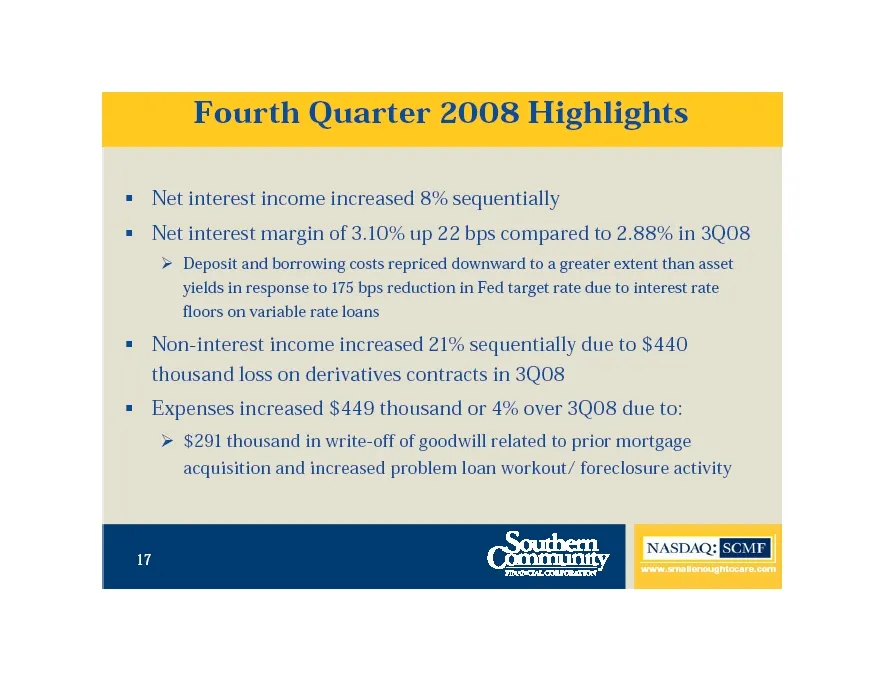
Slide 17: Net interest income and margin
= Net interest income increased 8% sequentially = Net interest margin of 3.10% up 22 bps compared to 2.88% in 3Q08 > Deposit and borrowing costs repriced downward to a greater extent than asset yields in response to 175 bps reduction in Fed target rate due to interest rate floors on variable rate lo
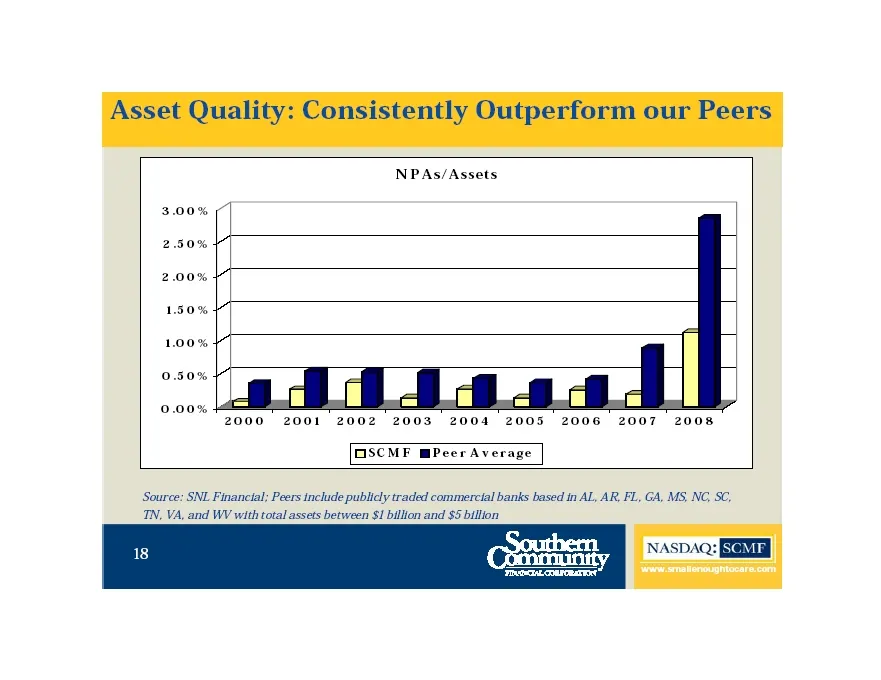
Slide 18: NPAs/Assets vs peers
3.00% 2.50% 2.00% 1.50% 1.00% 0.50% 0.00% NPAs/Assets 2000 2001 2002 2003 2004 2005 2006 TISCMF mPeer Average = 2007 2008 Source: SNL Financial; Peers include publicly traded commercial banks based in AL, AR, FL, GA, MS, NG, SC, IN, VA, and WV with total assets between $1 billion and $5 billion 18 N
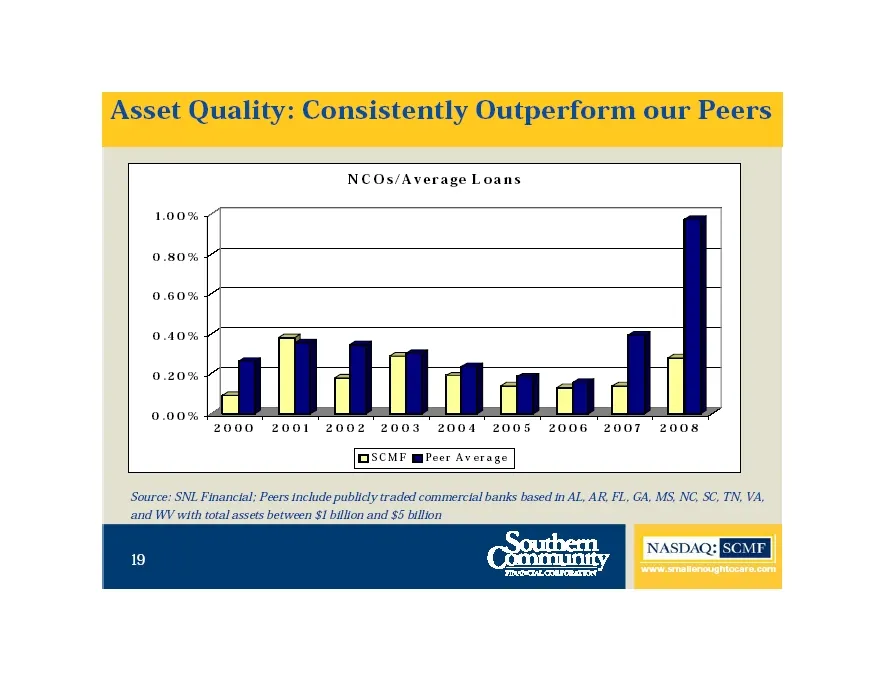
Slide 19: NCOs/Average Loans vs peers
1.00% 0.80% 0.60% 0.40% 0.20% 0.00% NCOs/Average Loans 2000 2001 2002 2003 2004 2005 ASCMF mPeer Average 2006 2007 2008 Source: SNL Financial; Peers include publicly traded commercial banks based in AL, AR, FL, GA, MS, NC, SC, TN, and WV with total assets between $1 billion and $5 billion 19 vA, NAS
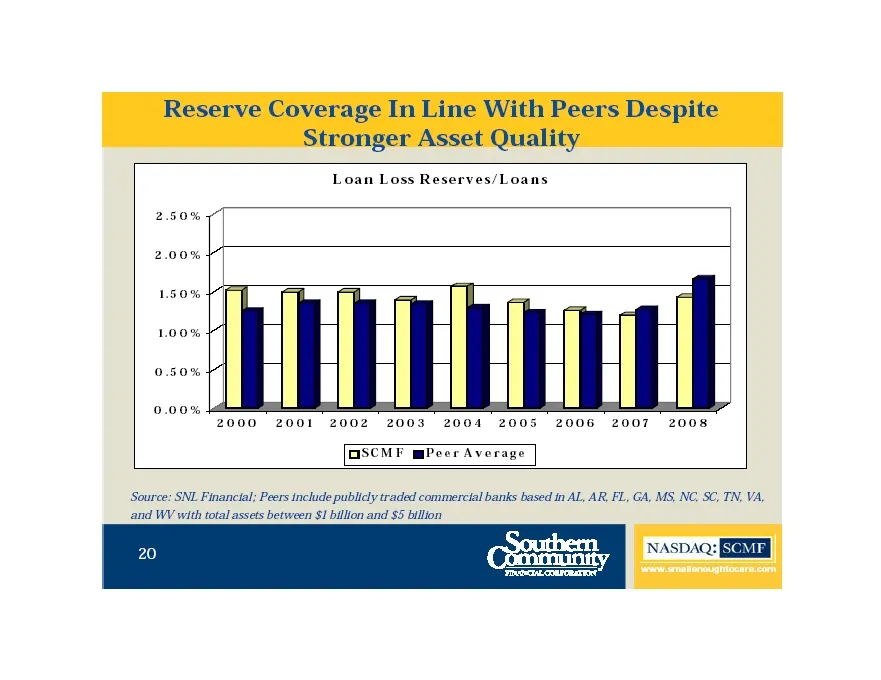
Slide 20: Loan Loss Reserves/Loans
Loan Loss Reserves/Loans 2.50% 2.00% 1.50% 1.00% 0.50% 0.00% 2000 2001 2002 2003 2004 2005 2006 2007 2008 DSCMF mPeer Average Source: SNL Financial; Peers include publicly traded commercial banks based in AL, AR, FL, GA, MS, NC, SC, TN, VA, and WV with total assets between $1 billion and $5 billion
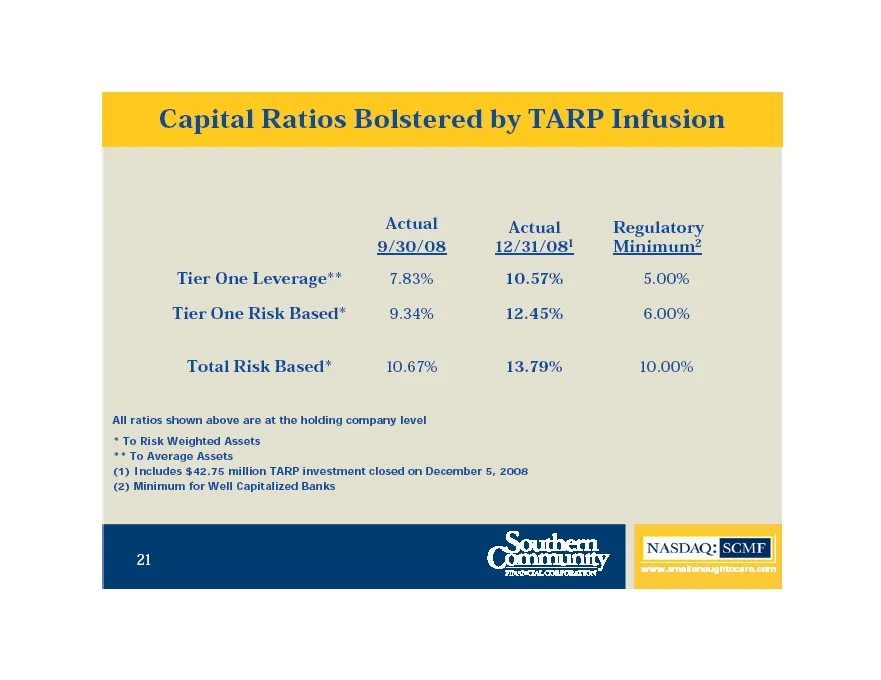
Slide 21: Regulatory capital ratios
Actual Actual Regulatory 9/30/08 12/31/08! Minimum? Tier One Leverage** 7.83% 10.57% 5.00% Tier One Risk Based* 9.34% 12.45) 6.00% Total Risk Based* 10.67% 13.79% 10.00% All ratios shown above are at the holding company level * To Risk Weighted Assots ** To Average Assots (1) Includes $42.75 million
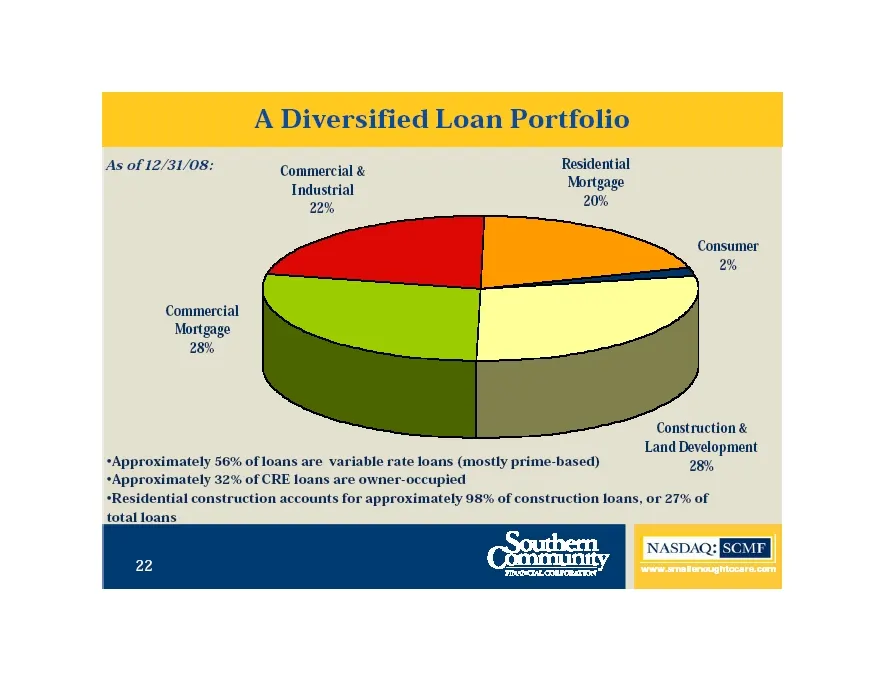
Slide 22: A Diversified Loan Portfolio
A Diversified Loan Portfolio As of 12/31/08: GxeneniAC sven Industrial rtgage aa 20% Consumer 2% Commercial Mortgage 28% Construction & Land Development Approximately 56% of loans are variable rate loans (mostly prime-based) 28% “Approximately 32% of CRE loans are owner-occupied +Residential constru
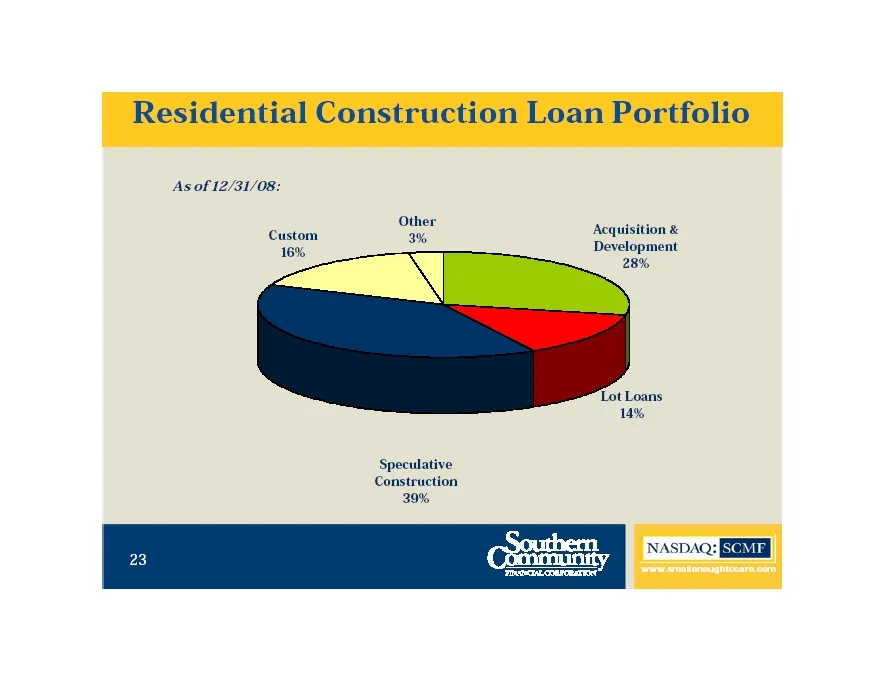
Slide 23: Construction loan composition
As of 12/31/08: Acquisition & 16% Development 28% Custom Speculative Construction 30% NASDAQ: OME ‘worw:amalenoughtocare.com
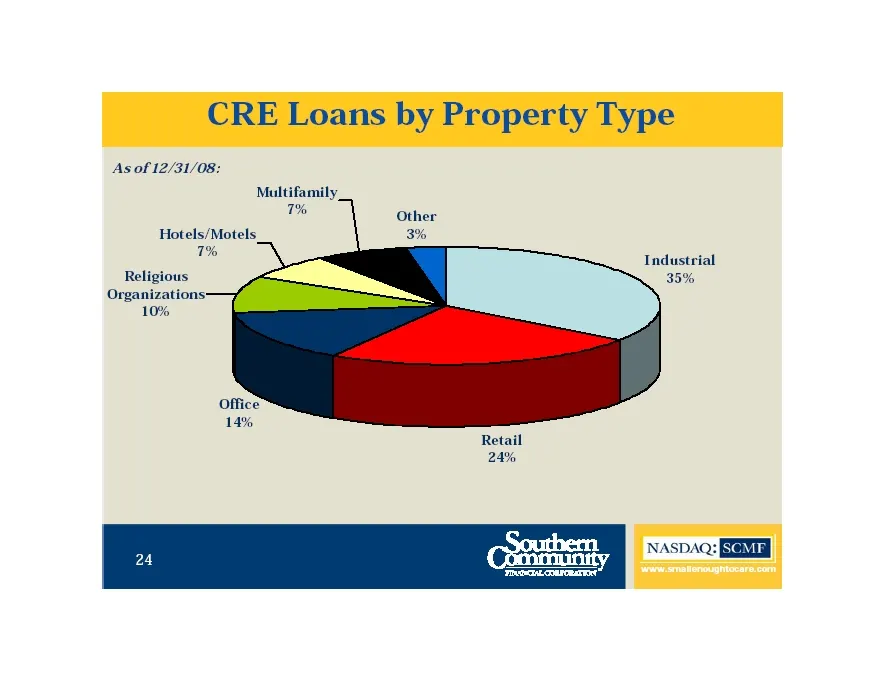
Slide 24: Commercial real estate loan composition
As of 12/31/08: ‘Multifamily. ™ Hotels/Motels, 7% Industrial Religious 35% Organizations: 10% NASDAQ: [sco } ‘ara smattenoughtocare.com
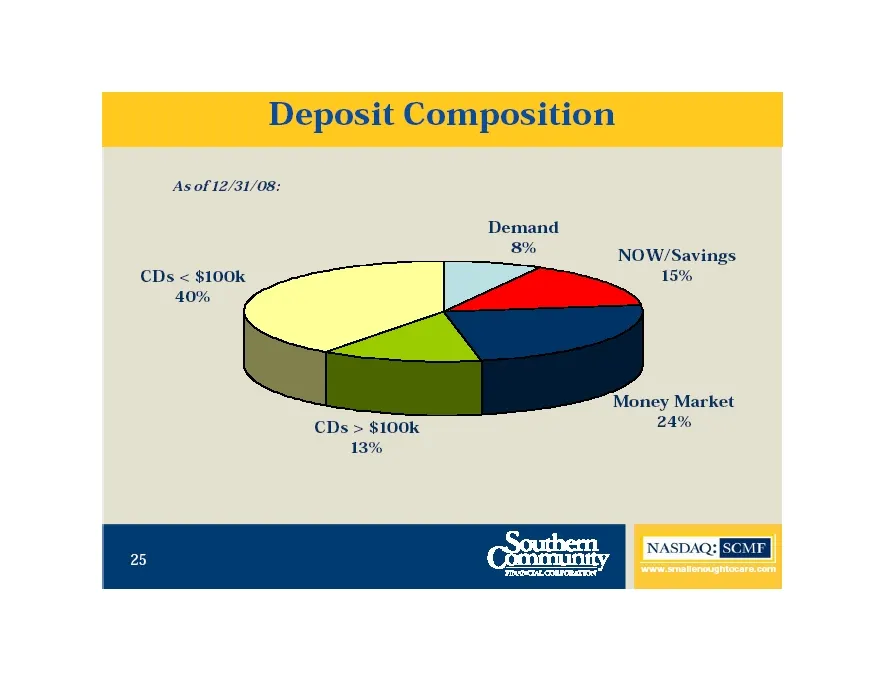
Slide 25: Deposit composition
As of 12/31/08: NOW/Savings 15% CDs < $100k 40% Money Market CDs > $100k Bev 13% Cope, (RSS| 25 ‘www.smalienoughtocare.com:

Slide 26: Small Enough To Care
ae, FINANCIAL CORPORATION Small Enough To Care NASDAQ: SMa 26
Source: SEC EDGAR · 8-K filed Feb 6, 2009
More decks from Southern Community Financial Corp
 KBW Investor Conference 201030 slides · Jul 27, 2010
 Investor Presentation (May 2009)26 slides · May 4, 2009
 Southeast SuperCommunity Bank Conference (February 2008)28 slides · Feb 11, 2008
 America's Community Bankers Community Bank Investor Conference 200724 slides · Nov 2, 2007
 Emerging Growth Institutional Investor Forum 200727 slides · Mar 26, 2007
 Southeast SuperCommunity Bank Conference (February 2007)26 slides · Feb 14, 2007